| Journal of Renewable Materials |
DOI: 10.32604/jrm.2021.017223
ARTICLE
Slenderness Ratio Effect on the Eccentric Compression Performance of Chamfered Laminated Bamboo Lumber Columns
1College of Civil Engineering, Nanjing Forestry University, Nanjing, 210037, China
2Joint International Research Laboratory of Bio-Composite Building Materials and Structures, Nanjing Forestry University, Nanjing, 210037, China
3Ganzhou Sentai Bamboo Company, Ltd., Ganzhou, 341001, China
4University College London, London, WC1E 6BT, UK
5Guangxi Lvjing Bamboo Company Ltd., Guilin, 541402, China
6University of Naples Federico II, Naples, 80133, Italy
*Corresponding Author: Haitao Li. Email: lhaitao1982@126.com
Received: 23 April 2021; Accepted: 09 May 2021
Abstract: Eccentric compression tests on 15 chamfered laminated bamboo lumber (LBL) columns with a height ranging from 600 to 3000 mm were conducted in order to study the eccentric mechanical performance. The failure of all specimens was caused by the crack of bamboo fiber in the tensile region. When the ultimate strength was reached, except specimens with a height of 600 mm, all other specimens could bear large deformation, showing good ductility. The lateral displacements of the specimens under eccentric compression were approximately parabolic in the direction of column height. The ultimate bending moment of LBL columns with different slenderness ratios under compression with the same initial eccentricity was a fixed value. The relationship between ultimate capacity, axial displacement, lateral displacement, and slenderness ratio was analyzed based on test results. It was found that the plane section assumption could be used to express the stress and strain distribution of chamfered LBL columns under eccentric compression. A method for calculating the ultimate bearing capacity was proposed using a constitutive model based on the Ramberg-Osgood relation and the empirical formula for calculating the ultimate capacity was given on the basis of the former research as well as the test results in this paper.
Keywords: Laminated bamboo lumber; column; chamfer; eccentric compression; tangential
With the rapid development of modern society, sustainable buildings made of timber or bamboo-based materials are more and more popular because of the high demand for a better living environment for human beings. Timber has been used as a construction material for thousands of years [1–5], however, bamboo [6–13] as a green and natural material that can be harvested in 4–5 years combined with its excellent mechanical properties, has more potential for popularization. Laminated bamboo lumber (LBL) [14–18] is a type of engineered bamboo [19–23] that can be made into structural elements of different sizes according to construction needs while making up the organic limitations of natural bamboo and maintaining the excellent mechanical properties.
Many researchers have investigated the mechanical properties of LBL. Wang et al. [24] analyzed the influence of bamboo nodes on the tensile properties parallel to the grain of side press-laminated bamboo lumber and found that LBL could well meet the physical and mechanical requirements of practical applications. Chen et al. [25] studied the basic mechanical properties of LBL and indicated that it has properties that are comparable to or surpass those of wood-based products and achieve the same good performance as other engineered bamboo products. Mahdavi et al. [26] found that the stiffness of LBL was comparable to that of wood, showing that LBL can be used in building structures. Yang et al. [27] studied the off-axis compressive performance of LBL and examined the applicability of the commonly used strength criteria on LBL. Karyadi et al. [28] investigated the mechanical properties of box-section LBL beams with different sidewall thickness and found that the strength of the beam significantly increased with the increase of the sidewall thickness. Sharma et al. [29] compared the LBL properties of different processing methods, results showed that the compressive and shear performances were improved after heat treatment, the tensile performance decreased while the bending properties remained. After testing 10 large-scale LBL beams, Wei et al. [30] concluded the failure phenomena and suggested that the flexural modulus of 10 GPa could be used to verify the deformation of LBL beams. Lima et al. [31] found that the failure of the LBL beams depends on the joint type, the joint position, and the adhesive used for bonding. By comparing the properties of bamboo glued beams (BGB) and LBL beams, Sinha et al. [32] found that the allowable tensile, bending strength, and mean strength of the LBL beams were higher.
Compression performance were also studied about bamboo specimens. Harries et al. [33] found the significant effects of taper on culm compression capacity by conducting a series of buckling analyses of tapered culms. Wang et al. [34] carried out tests to evaluate the effect of slenderness ratio and aramid fiber-reinforced polymer on the laminated bamboo columns and found that both fiber-reinforced polymer and slenderness ratio had a substantial impact on failure modes, ultimate load-carrying capacities, and displacements. Li et al. [35,36] studied the failure mode, ultimate capacity, axial displacement, lateral displacement of LBL columns with rectangular sections, and different slenderness ratios and proposed an empirical equation of ultimate capacity. Existing investigations [35] on the compression and bending properties of columns with different eccentricities were relatively comprehensive, while the studied slenderness ratios [36] were only ranging from 29 to 59, which cannot meet the size requirements in structural applications.
As discussed above, some scholars have investigated the mechanical properties of laminated bamboo lumber but there are still a lot of work needs to be done due to a lot of influencing factors and the development of manufacturing techniques. In the old days, it was not an easy thing to produce big structural elements. Even though it was no problem for make longer structural members the mechanical properties were not stable, and that was why the slenderness ratio values for the former research were less than 60. With the development of the science and techniques, structural elements with bigger size and stable mechanical performance could be produced. As there is still no design codes for laminated bamboo lumber buildings, it is meaningful to continue the former research and investigate the eccentric compression properties with bigger slenderness ratios which are close to the real construction site. This paper will study the mechanical properties of chamfered LBL columns with slenderness ratios from 21 to 106 under eccentric loading.
For this study, the specimens were produced by Jiangxi Ganzhou Sentai bamboo Co., Ltd., Ganzhou, China with Phyllostachys pubescens as raw material. The natural bamboo poles were processed into long and thin bamboo strips with the size of 2005 mm × 21 mm × 7 mm and then pressed at 157°C under 9 MPa pressure for 15 min. The cross-section of the specimens is shown in Fig. 1. The compressive and tensile strengths of LBL were 60 and 90 MPa, while the ultimate tensile and compressive strains were 0.012 and 0.02, respectively, and the compressive yield strain was 0.003.
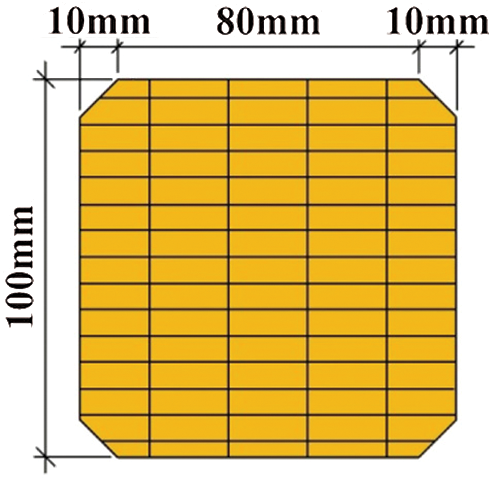
Figure 1: Cross-section
Considering the effect of the slenderness ratio, LBL column specimens were divided into 5 groups with the height of 600, 1100, 1700, 2300 and 3000 mm as shown in Fig. 2a, each group contained 3 specimens. All the specimens were named by the rule of “E + height”, for example, “E3000-1”. The eccentric direction of the LBL column was tangential as shown in Fig. 2b. To record the test conveniently, the planes of LBL columns were named as A, B, C, and D in a counterclockwise direction, as Fig. 2c.
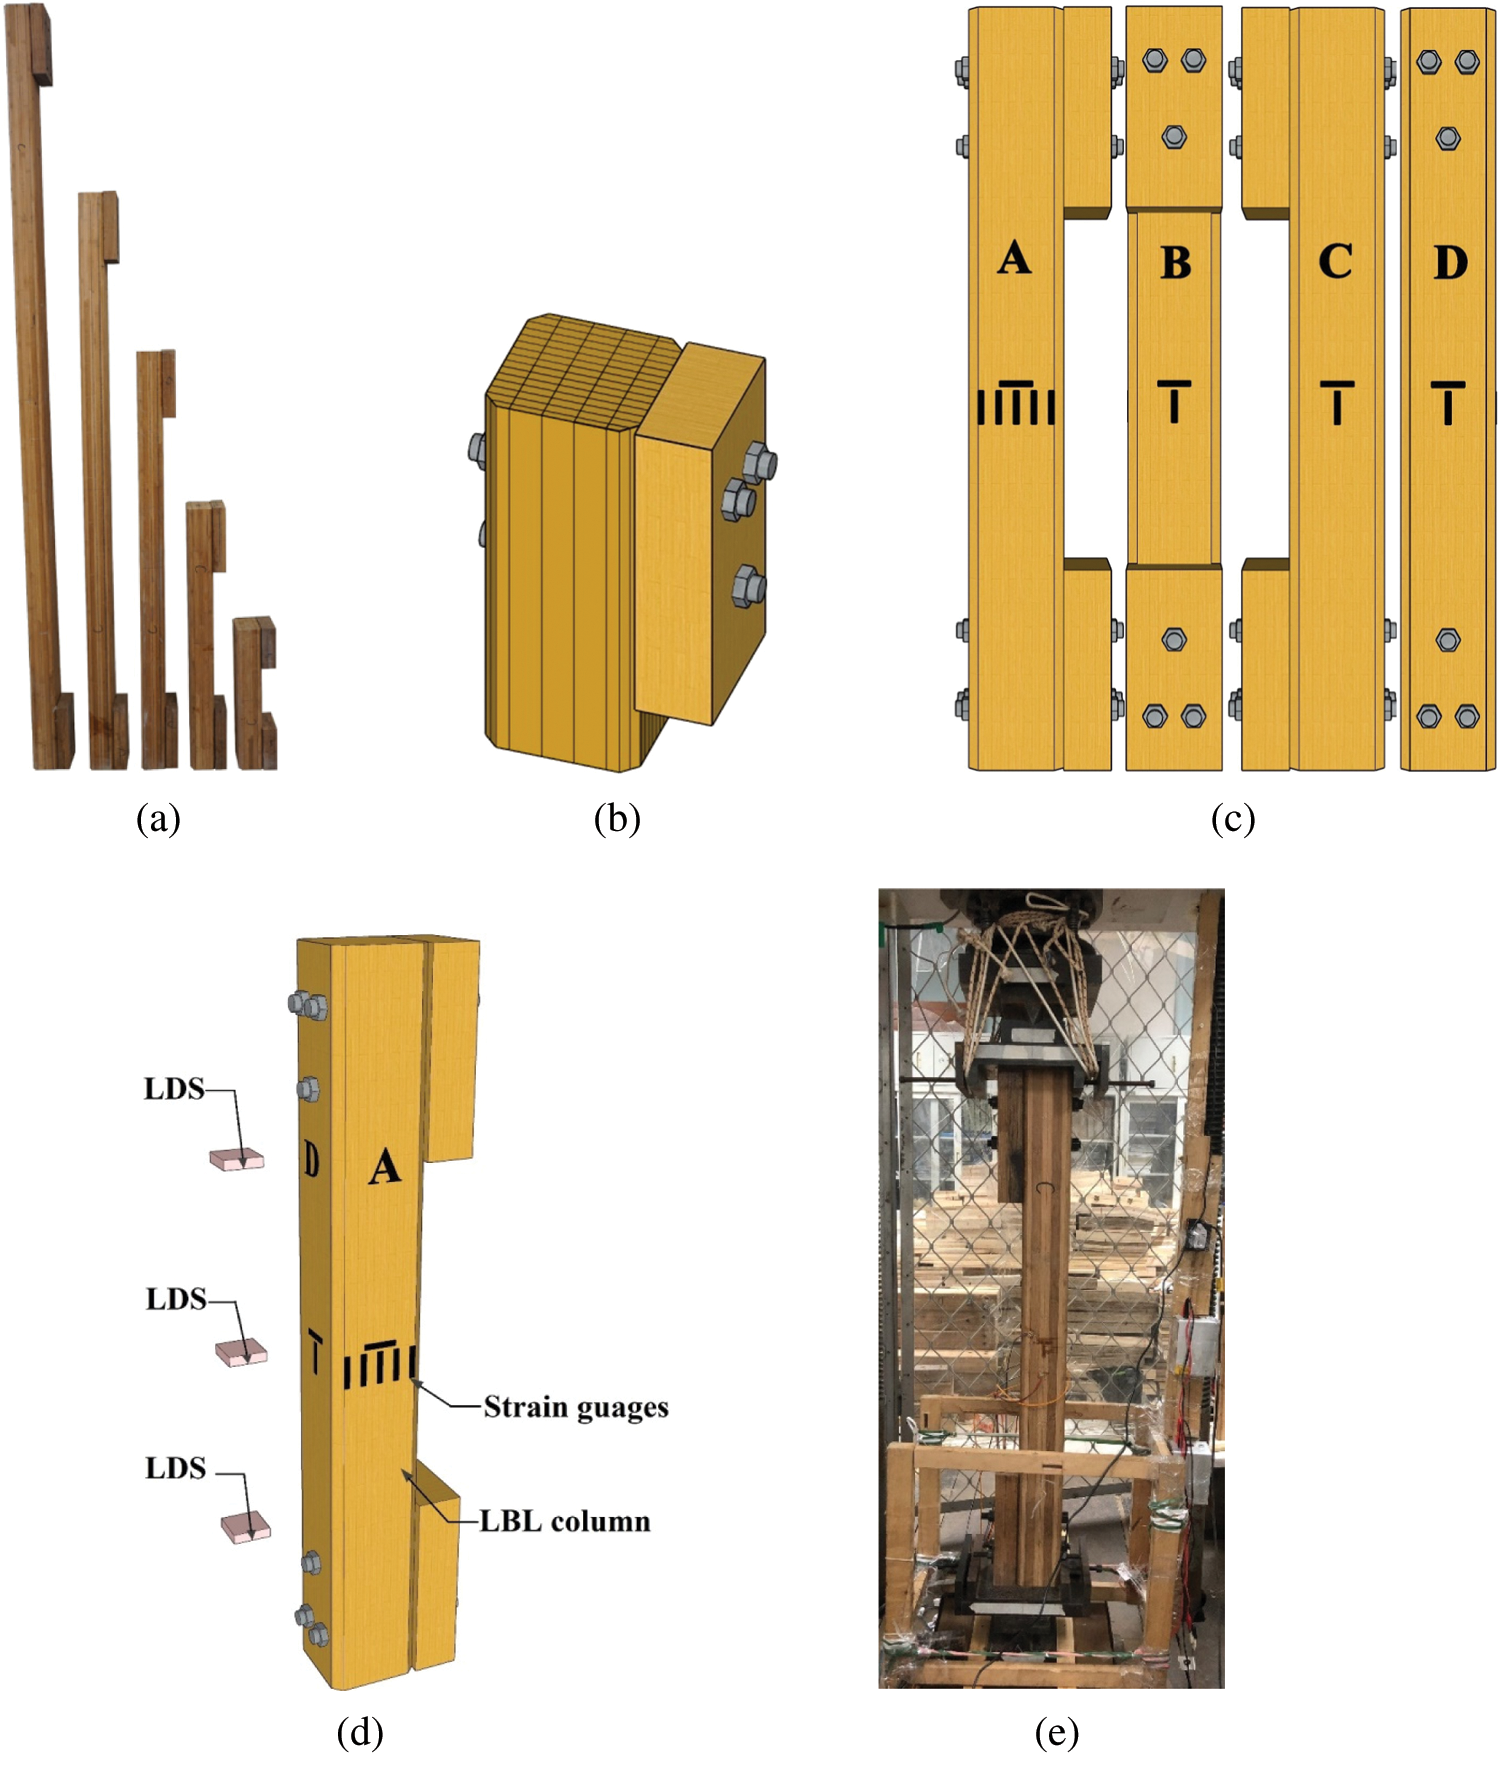
Figure 2: Test design (a) Test specimens (b) Eccentric direction (c) Method of specimen marking (d) Layout of measuring points (e) Test site
The test was designed according to the Standard for Test Methods of Timber Structures (GB/T 50329-2012). Each specimen had transverse and longitudinal strain gauges, while five longitudinal strain gauges were glued to plane A to verify the plane section assumption. For columns with lengths of 600 and 1100 mm, three laser displacement sensors (LDS) were set at the quarter points of the columns to record the lateral displacement, as shown in Fig. 2d. For 1700, 2300 and 3000 mm columns, only one laser displacement sensor was set at the height of 850 mm to measure the lateral displacement. The photo of the test site was shown in Fig. 2e.
The failure modes of the five groups of specimens were similar, the failure was caused by the fracture of the bamboo strips on the tensile side. According to the failure process, 2 failure modes were classified.
Failure mode I: The cracks first appeared near the corbel of the test piece. With the increase of load, the cracks developed to the mid-span position of the specimens, which led to the bamboo fracture in the tensile area. This kind of failure occurred in specimens E600-1, E600-2, E600-3, E1100-1, E1100-2.
Take the typical test specimen E600-1 as an example to describe the test phenomenon, as shown in Fig. 3. The specimen was gradually bending with the increase of load. When the ultimate load was reached, vertical cracks first appeared in the corbel area at both ends of the specimen about 25 mm from the tensile surface (Face D). Accompanied by the tearing sound, the crack developed towards the mid-span position of the specimen, causing the fracture of bamboo strips and failure of specimen. The failure specimen was observed, the cracks at both ends of the specimen developed to the mid-span position and formed a “V-shaped” crack, as shown in Figs. 3a and 3c. On the tensile surface (Face D) of the specimen, the crack extended from the fracture position to the bolt void as shown in Fig. 3d. The end of the specimen was also damaged as shown in Fig. 3e, while there was no obvious damage in the compression area, as shown in Fig. 3b. The main reason for failure mode I was that the height of column was short. The height of the compression zone of the specimen was larger than long column. The crack first appeared at the end of the specimen due to the large compression load. Then the cracks developed to the mid-span position of the specimen, causing the failure of specimens.
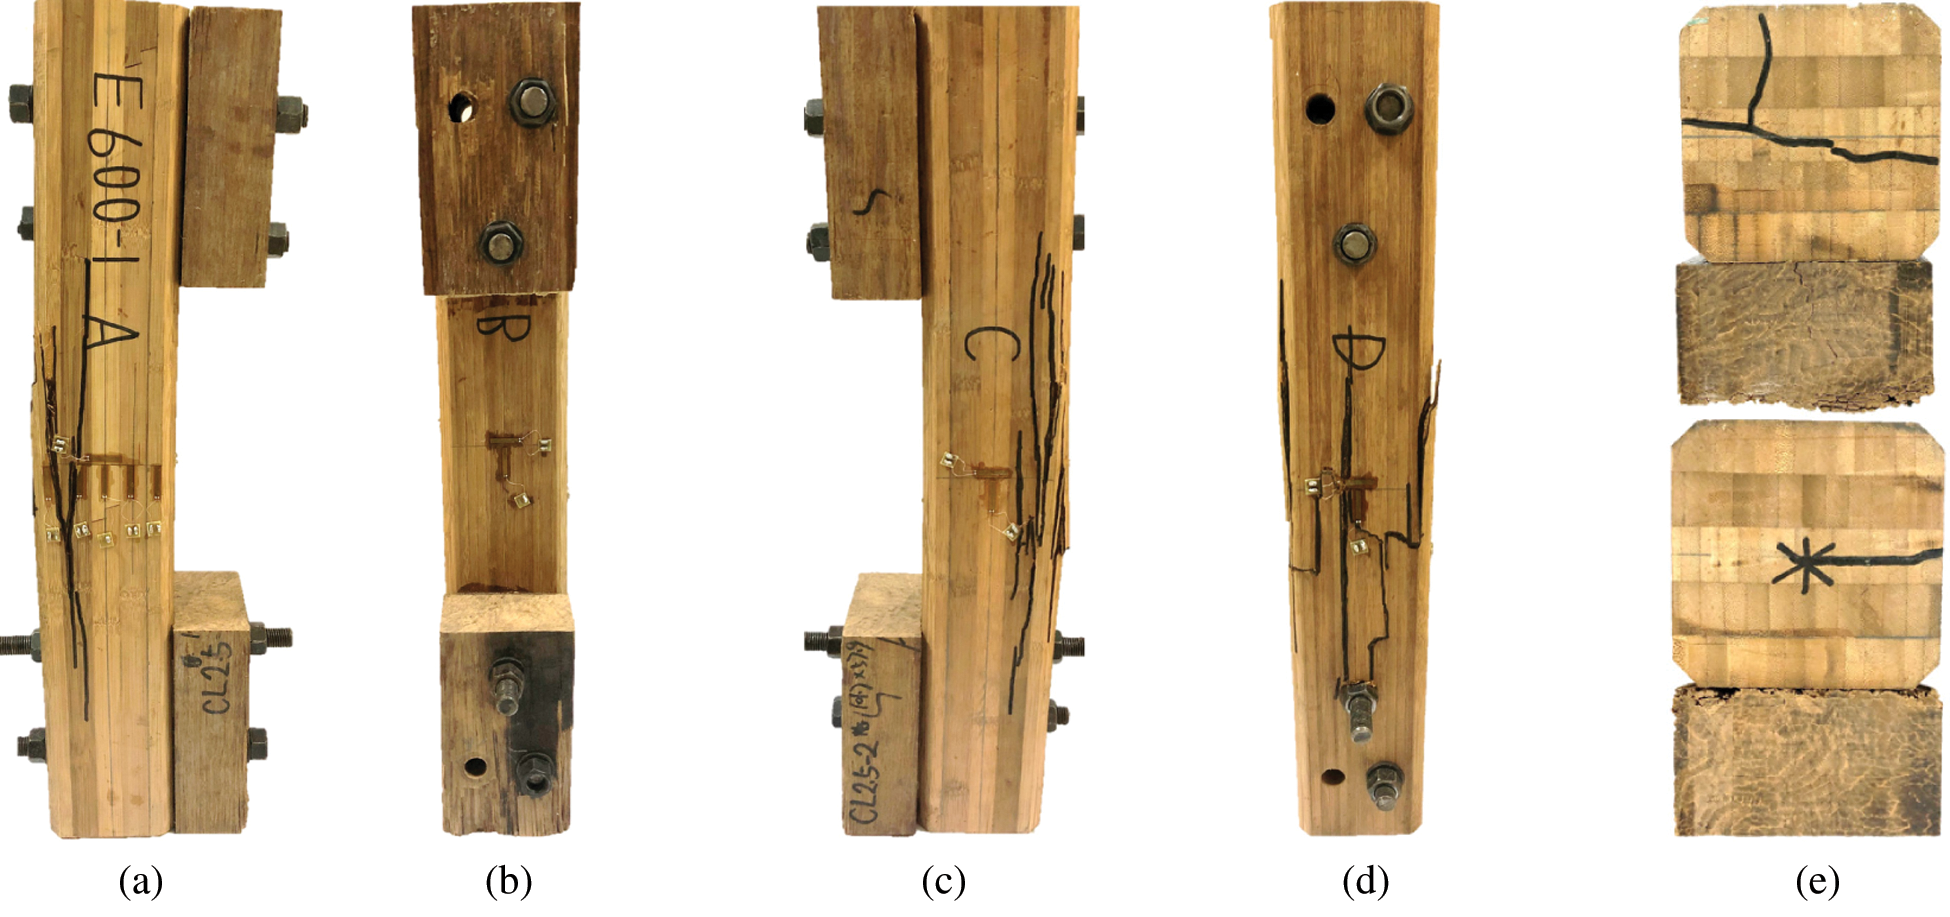
Figure 3: Failure of specimen E600-1 (a) Plane A (b) Plane B (c) Plane C (d) Plane D (e) Top and bottom
Failure mode II: The bamboo strips in the middle of the specimen’s tensile region cracked first, and the cracks developed rapidly to both ends, leading to the failure. This kind of failure occurred in the E1100-3, E1700, E2300, and E3000 groups of specimens. There were no obvious cracks before failure, the specimens could still deform after reaching the ultimate load. Failure mode II was an obviously brittle failure with no crack at the end of the specimens. Fig. 4 shows the test process of specimen E3000-2. This kind of failure was caused by the excessive lateral deformation of the specimen, resulting in the bending moment value at the mid-span position of the specimen reaching the maximum bending moment that the section could bear.
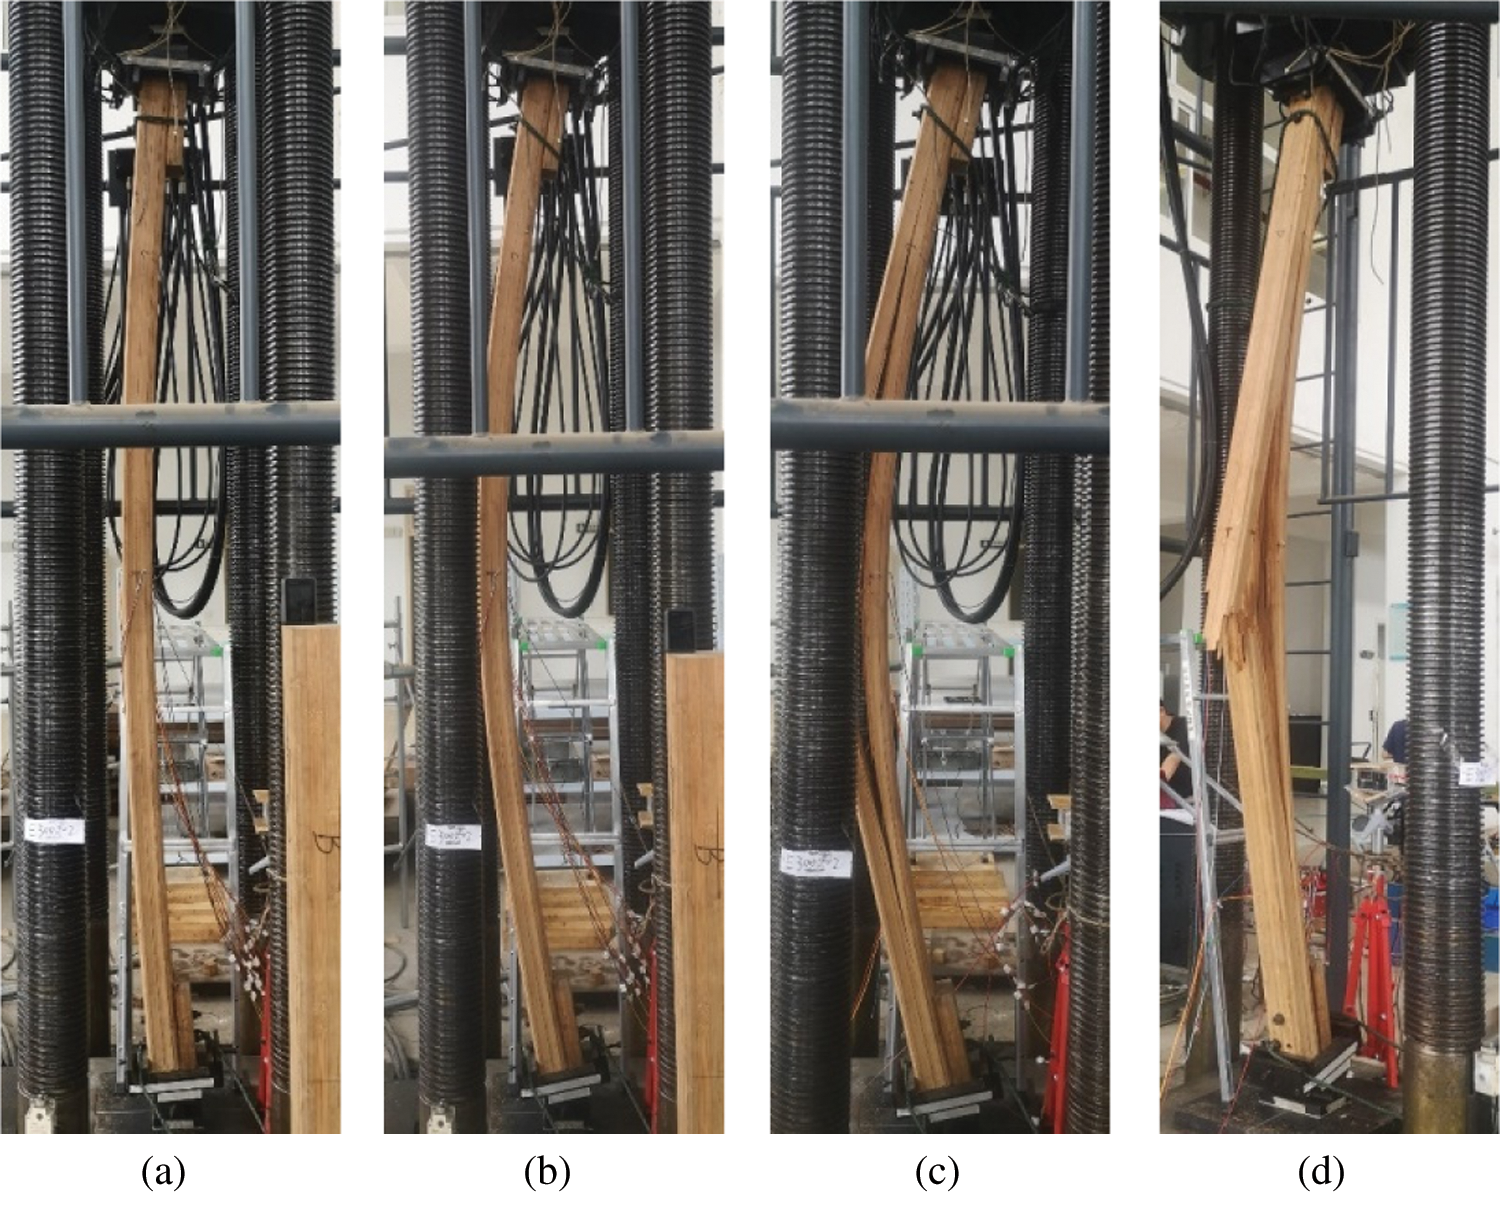
Figure 4: Process of failure of the specimen E3000-2 (a) Elastic stage (b) Plastic stage (c) Plane C (d) Plane D
It was found that the fractured part of the tensile side of the column was concentrated in finger joints and bamboo nodes. The damage of finger joints was more obvious, it was because the tensile capacity of finger joints came from the glue, mechanical interaction, and the constraint between the upper and lower bamboo strips. At the same time, the damage of bamboo nodes was less weak because nodes could still bear a certain tensile force. Therefore, the finger joint damage was the main reason for the failure of the LBL columns, which also led to the fact that the strain of the tensile part of each group of specimens could not reach the ultimate tensile strain of clear bamboo specimens. Fig. 5 shows the damaged part leading to the failure of specimens.
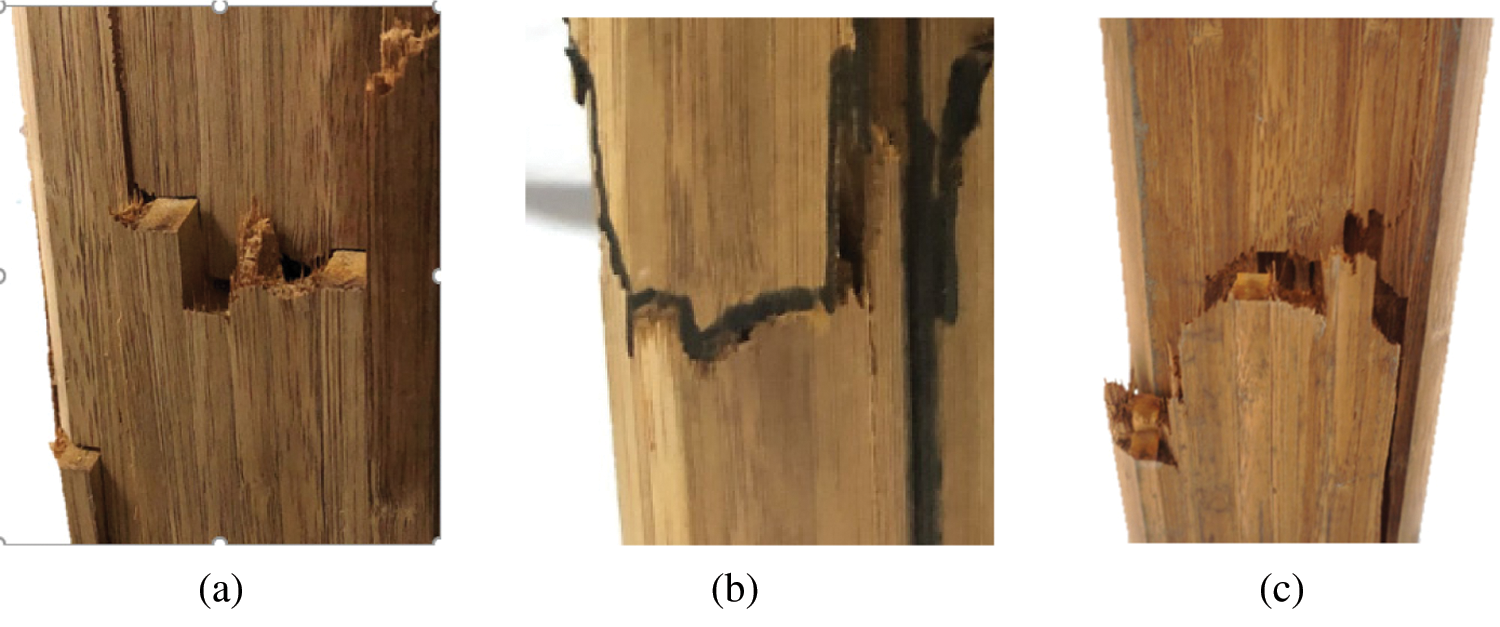
Figure 5: Main reasons of failure (a) Damage of finger joint (b) Damage of bamboo node (c) Damage of bamboo node and finger joint
Load-displacement curves of all specimens are shown in Fig. 6.
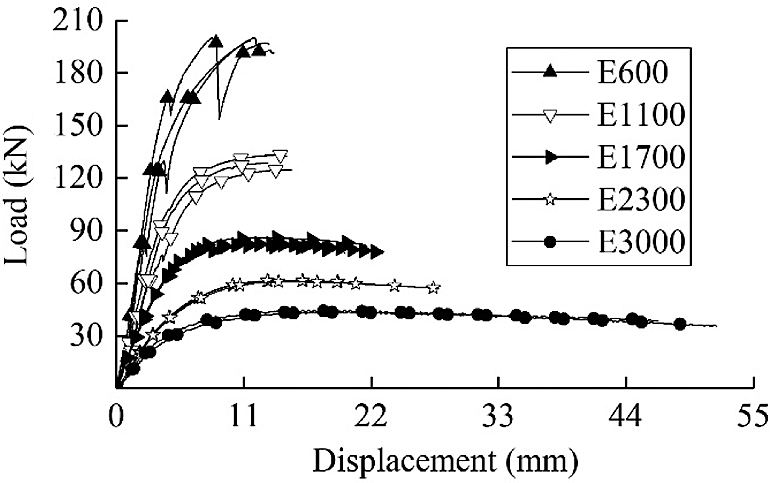
Figure 6: Load-displacement curves
Specimens with a height of 600 mm were destroyed immediately when the ultimate bearing capacity was reached. This happened because when the ultimate load was reached, the end of the specimens was damaged by strength failure, the cracks appeared and developed rapidly, making specimens unable to continue to deform. The sudden drops in the load-displacement curves were caused by the slippage between the corbel and LBL column.
For the other four groups of specimens, the load-displacement curve was the same as in the compression test of LBL. When the ultimate load was reached, the specimens could still bear a long period of plastic deformation and the load basically remained stable. This was because the ultimate load of the specimen with a larger slenderness ratio was smaller compared to the specimens of 600 mm height, and cracks near the end of the specimens and corbels did not appear. To maintain the equilibrium state of the member until the tensile zone is fractured, the compression zone gradually yielded, and the neutral axis of the LBL column moved toward the compression zone. It could be concluded that the LBL columns have good deformation capacity and excellent seismic performance. The load-displacement curves of three specimens in each group were coincident, which showed that the mechanical properties of the glued bamboo columns were stable.
3.3 Analysis of Load-Strain Relation
For a better understanding of the load-strain relationship of the LBL column under eccentric compression load, the most unfavorable cross-section deformations between two groups of columns with a height of 600 and 3000 mm were compared (Fig. 7).
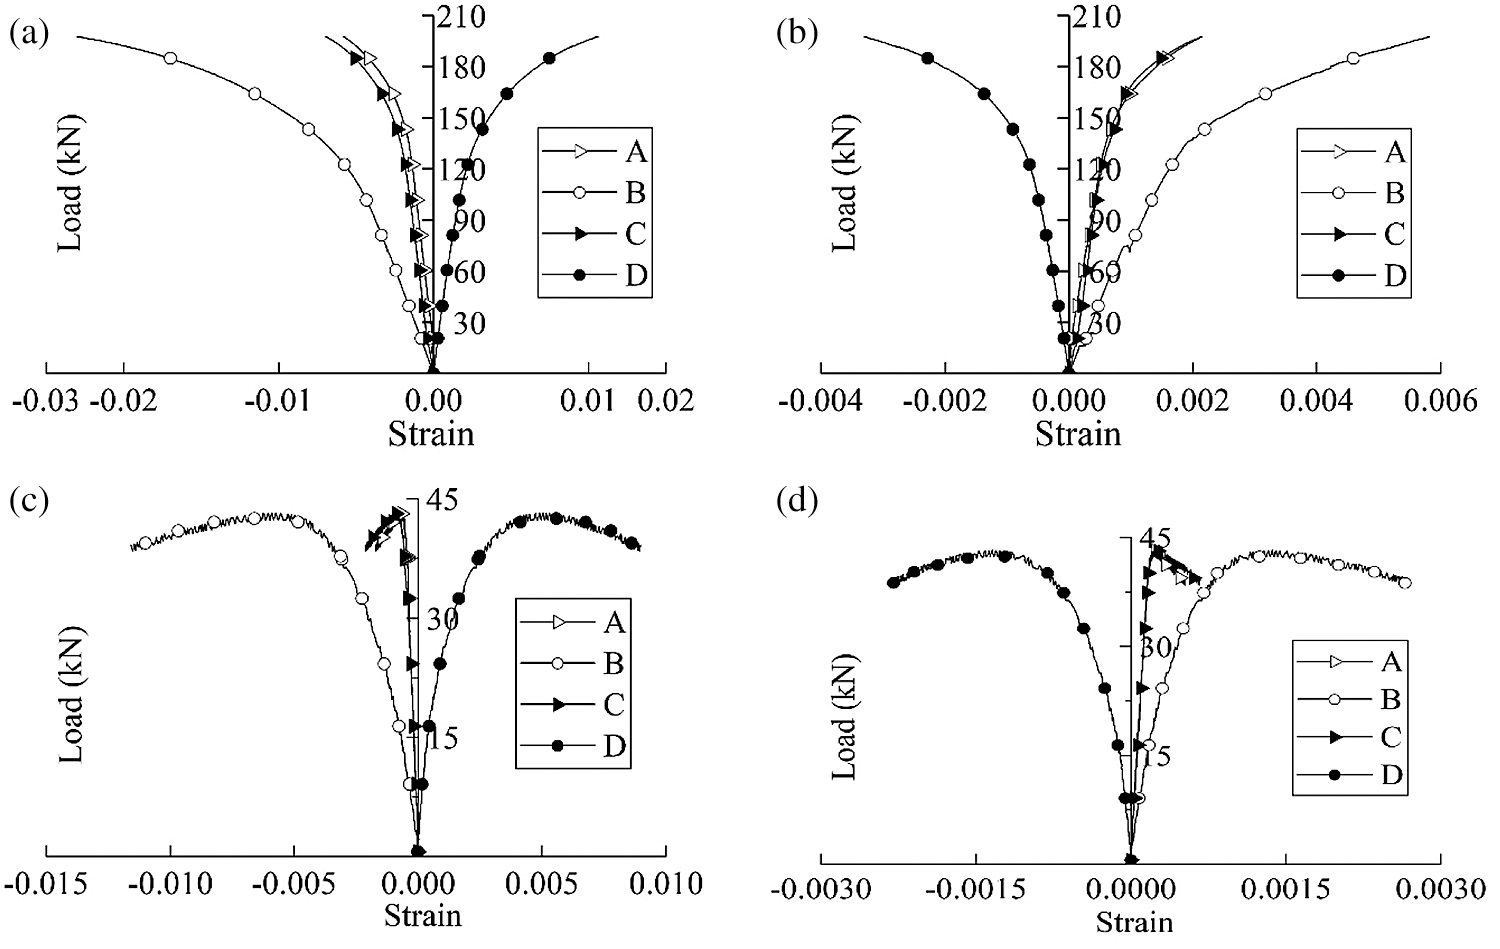
Figure 7: Load-strain curves (a) Load-vertical strain curves of E600-1 (b) Load-horizontal strain curves of E600-1 (c) Load-vertical strain curves of E3000-1 (d) Load-horizontal strain curves of E3000-1
At the initial stage of loading, the strain of planes B and D increased linearly with the load increment. When the compression zone reached the yield strain of about 0.003, specimens started to enter the plastic stage, and the stiffness of specimens decreased. After that, the loading force increased slowly, while strain soared. For specimens of the E600 group, when the ultimate load was reached, the strain in the tensile zone reached the ultimate tensile strain of LBL, and the bamboo strips in the tensile zone broke, this was also the reason why the E600 specimens failed rapidly. For the specimens of group E3000, after reaching the ultimate load, the tensile strain was only half of the ultimate strain of LBL, so the specimens could continue to deform with strain continually increasing, and then the specimens were destroyed due to large deformation. The strain of planes A and C in all specimens were small and similar to each other, because the strain gauges were near the neutral axis of LBL specimens.
In Fig. 8, the vertical strain of plane A is taken as the abscissa, the section height of specimens as the ordinate, and the relationship between the strain and the section height is shown under different loads. It can be observed that the vertical strain changed linearly with the section height, therefore, the deformation of the LBL column under 30 mm eccentric load conformed to the plane section assumption. The height of the tensile zone of specimen E3000-1 was greater than that of specimen E600, under the same eccentric load, the height of the tensile zone increased with the increase of slenderness ratio, so the bearing capacity of the specimen decreased.
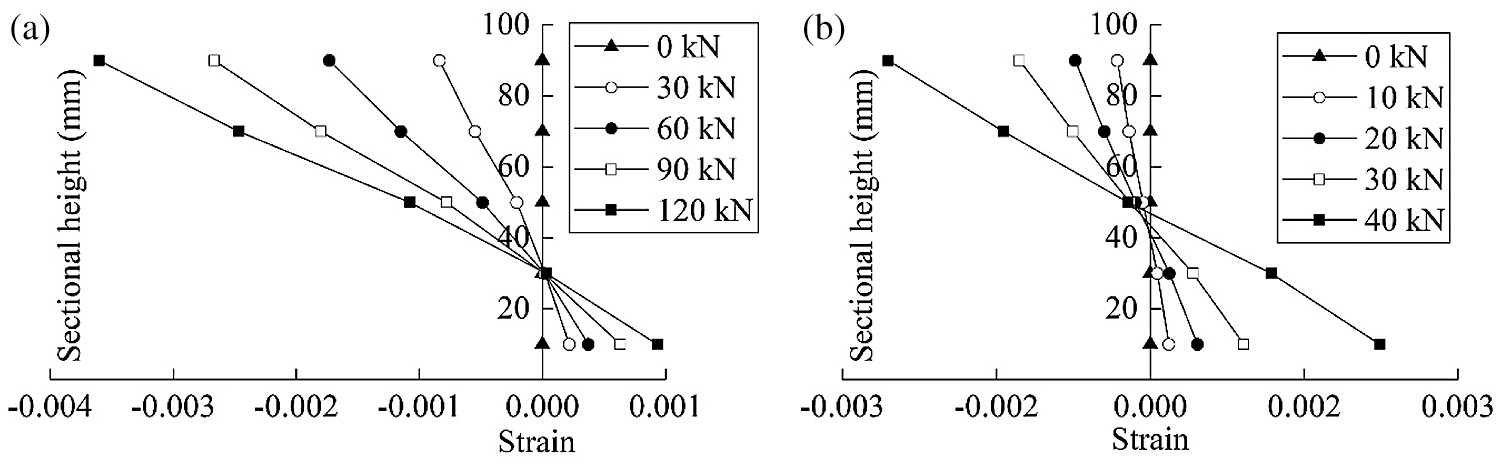
Figure 8: Verification of plane section assumption (a) E600-1 (b) E3000-1
3.4 Analysis of Lateral Displacement
In this paper, the displacements of E600 and E1100 groups of specimens were measured at the quarter point of height direction, the displacement of the E1700 group of specimens was measured at the mid-span, and the displacements of E2300 and E3000 groups of specimens were measured at the height of 850 mm.
Figs. 9a and 9b show the relationship between the lateral displacement under eccentric load and the height of the specimen of groups E600 and E1100. Ignoring the axial deformation, the dotted line in Figs. 9a and 9b shows the relationship between the lateral displacement and the column height fitted by the parabola. The displacement of columns at different heights approximately conformed to the parabolic relationship in the elastic and plastic stages, which can be expressed by Eq. (1).
where, α, β are load-dependent coefficients. Based on the recorded lateral displacement of the E2300 and E3000 groups of specimens at the height of 850 mm, the predicted curves are as shown in Figs. 9c and 9d.
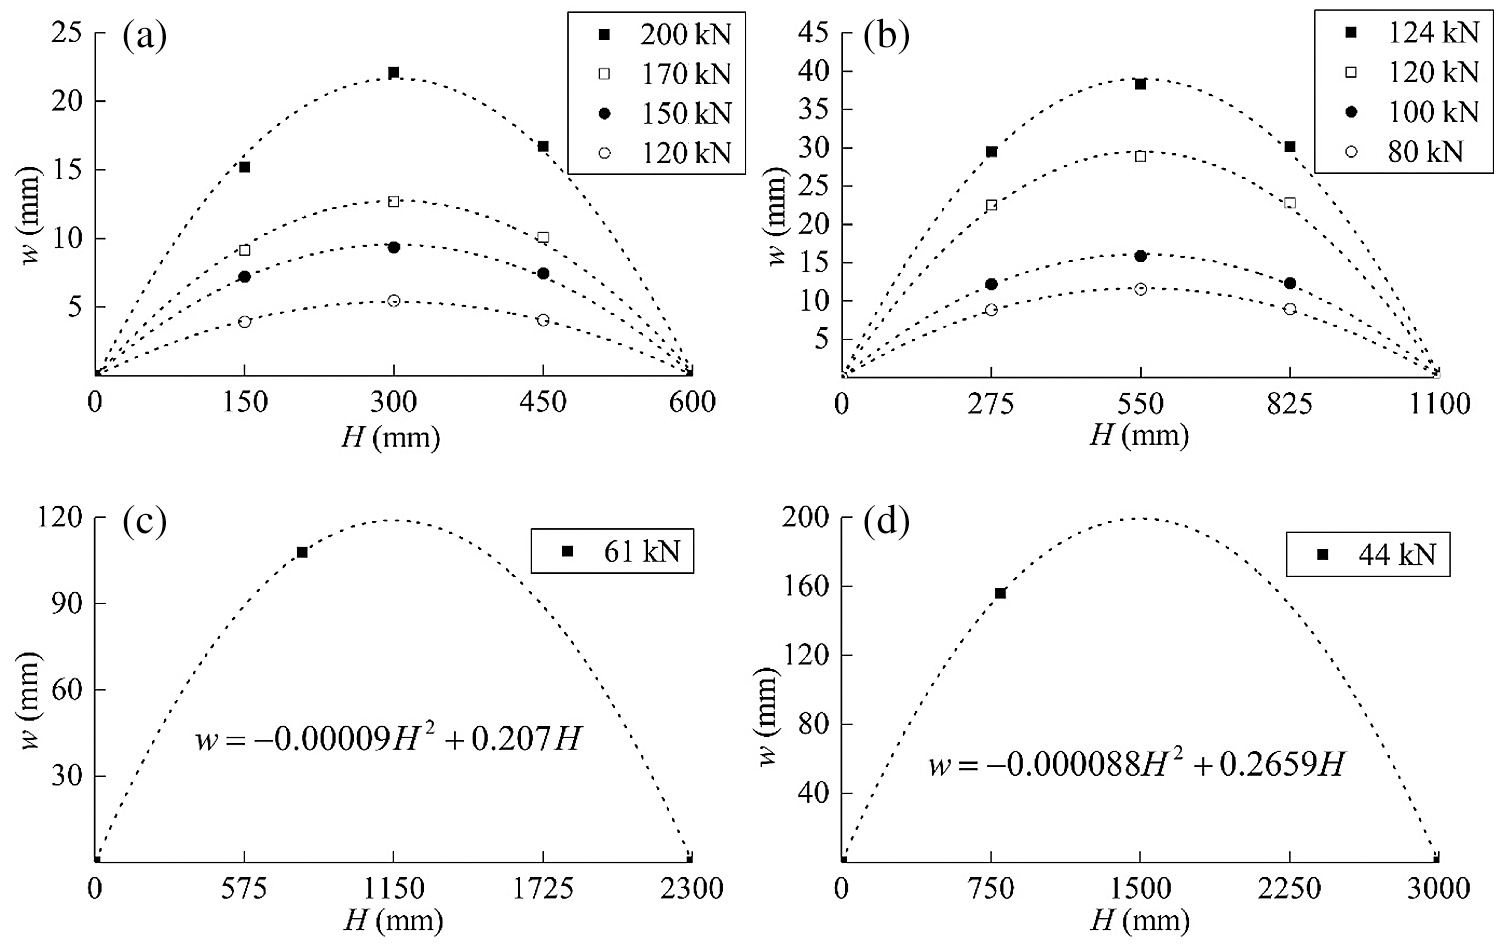
Figure 9: Deflection curves (a) E600-1 (b) E1100-1 (c) E2300-1 (d) E3000-1
The main test results are listed in Tab. 1, the coefficient of variation of all data is less than 11.95%, which shows that the mechanical properties of LBL are stable. Under 30 mm initial eccentricity, the average ultimate load of five groups of specimens are 199.49, 128.89, 83.5, 61.24 and 43.77 kN, respectively.
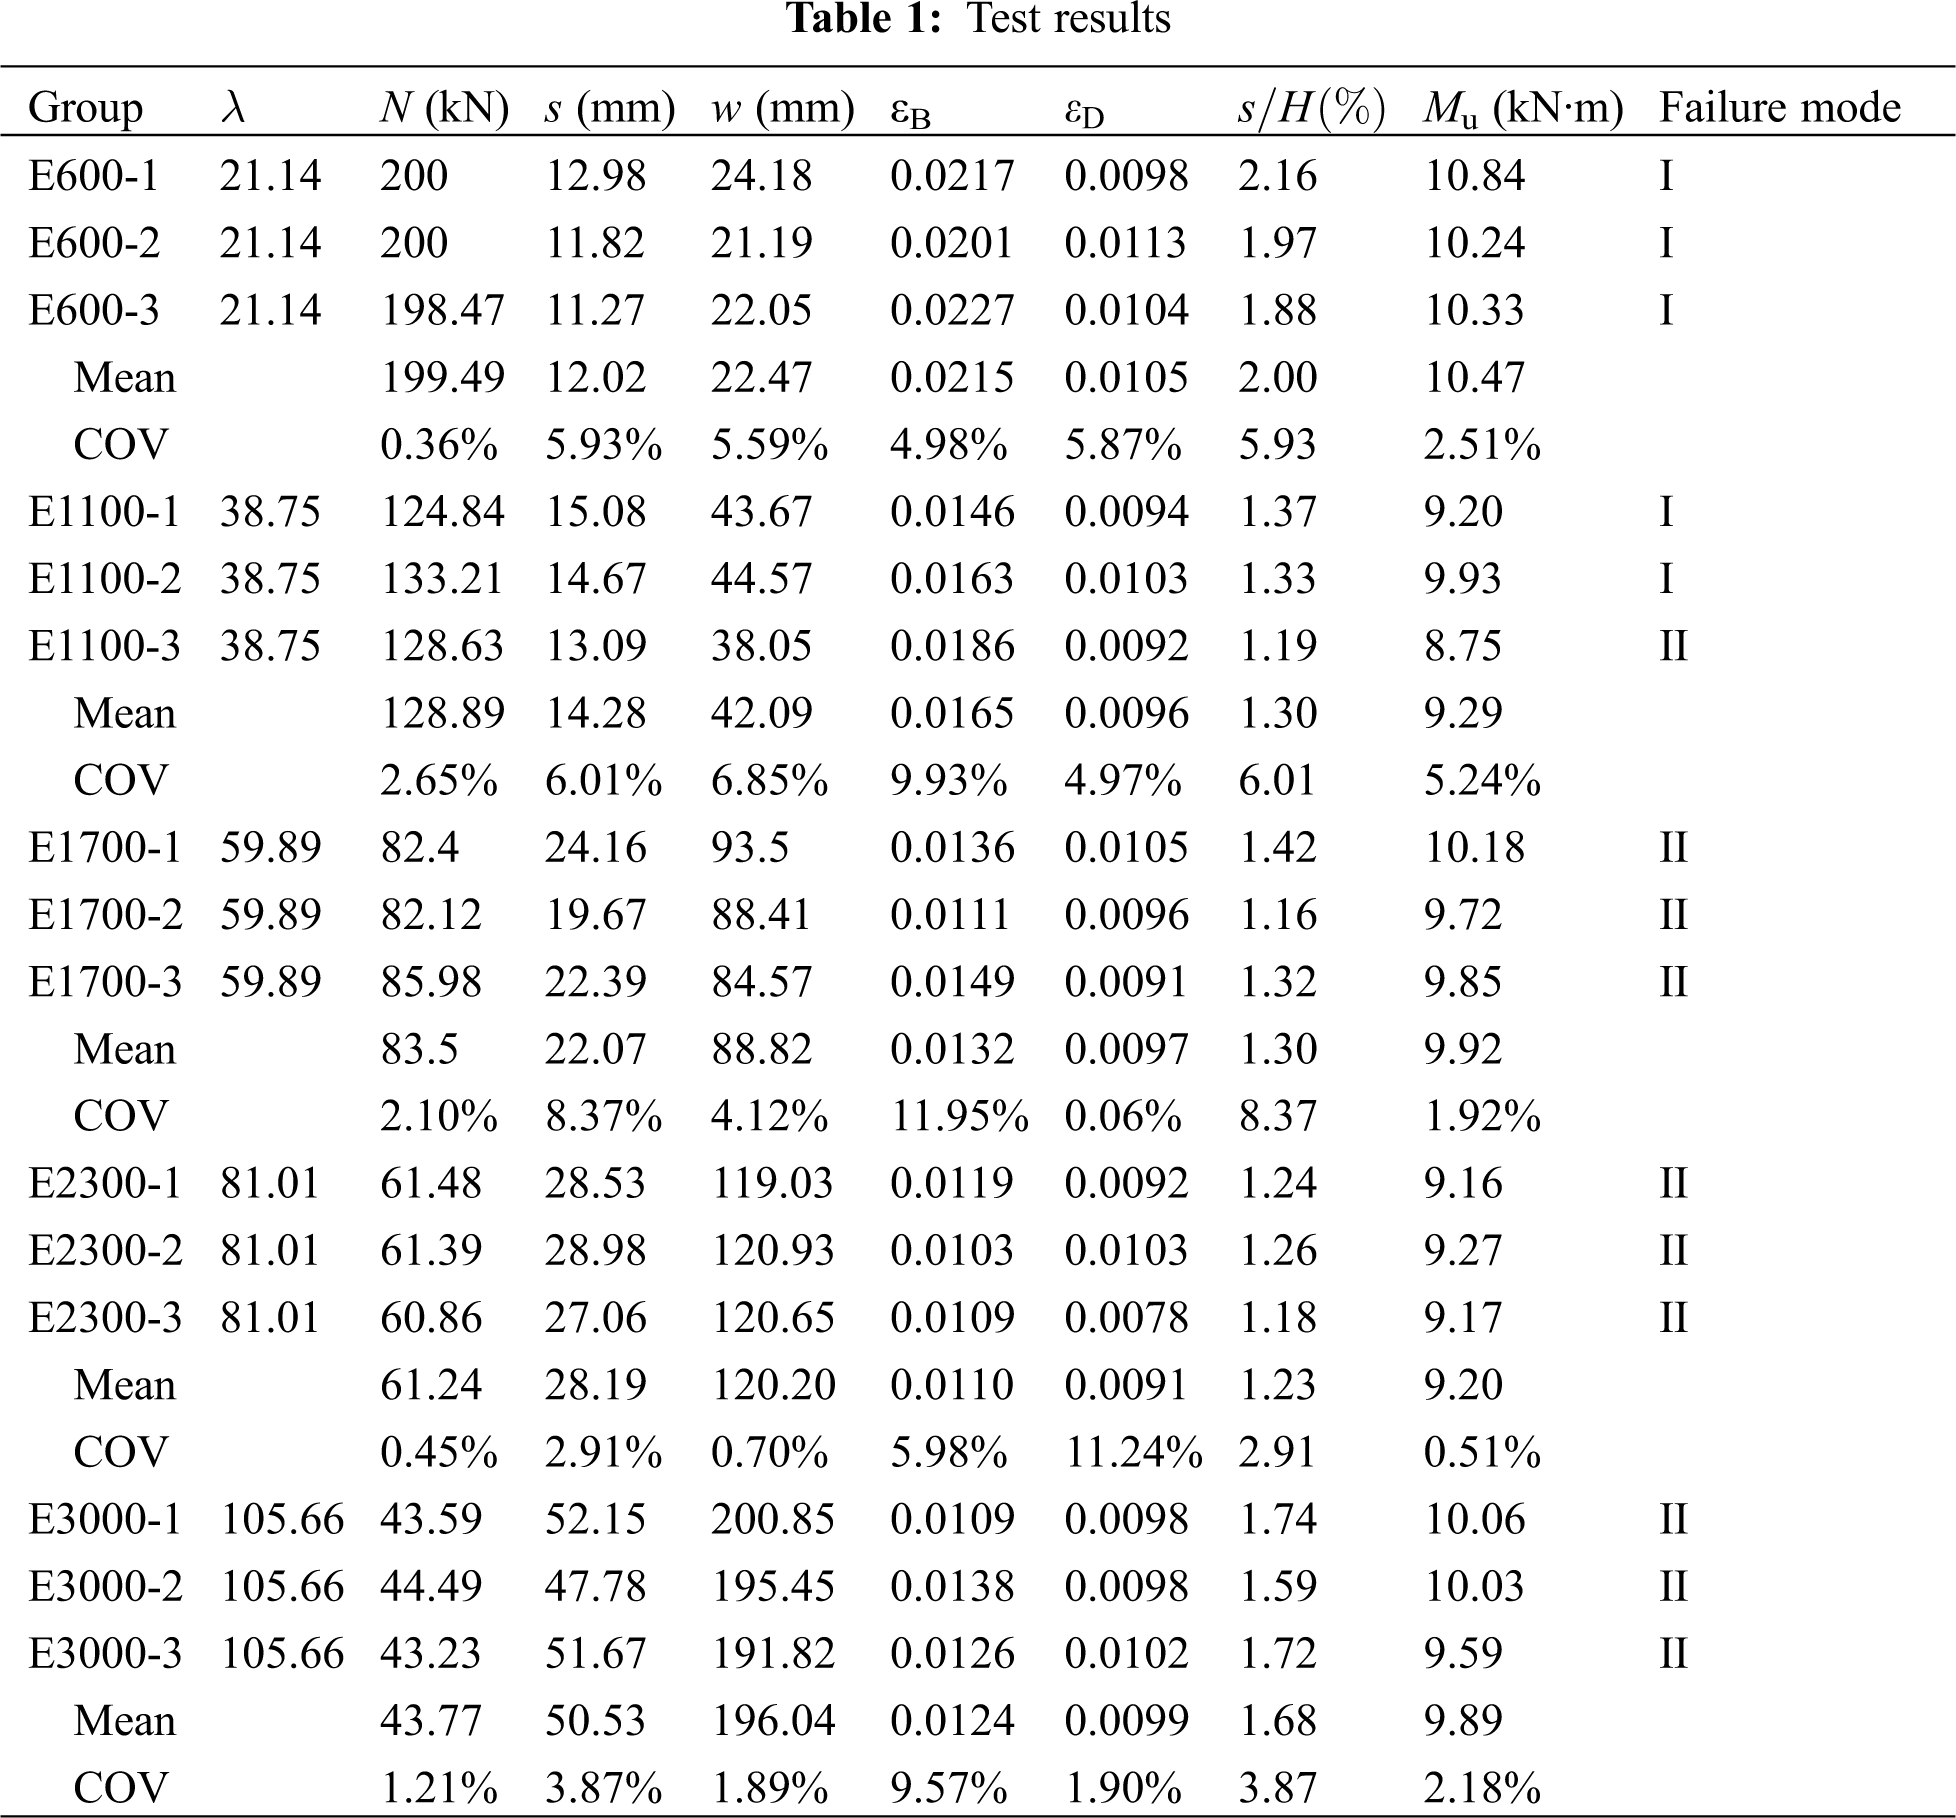
In Tab. 1, N is the ultimate load; s, w, εB, εD, are the ultimate axial displacement, the ultimate lateral displacement, the ultimate longitudinal strain of plane B, the ultimate longitudinal strain of plane D, respectively; s/H is the ratio of ultimate axial displacement to column height; Mu is the ultimate bending moment of mid-span section when the specimen was destroyed, Mu = N(e0 + w); e0 is the initial eccentricity of 30 mm; λ is the slenderness ratio of the specimen, which were calculated by Eqs. (2) and (3).
where l is the height of specimen; i is section radius of gyration; I is the moment of inertia of cross-section; A is the cross-sectional area.
From Figs. 10a–10c, with the increase of slenderness ratio, the ultimate load decreased gradually, while axial displacement and lateral displacement increased. The relationship between slenderness ratio and ultimate load, axial displacement, and lateral displacement can be expressed by the following equations:
where N is ultimate load (kN), fc is compressive strength of LBL (MPa), A is the cross-sectional area of the specimen (mm2), s is ultimate axial displacement (mm), H is height of column (mm), w is the ultimate lateral displacement (mm).
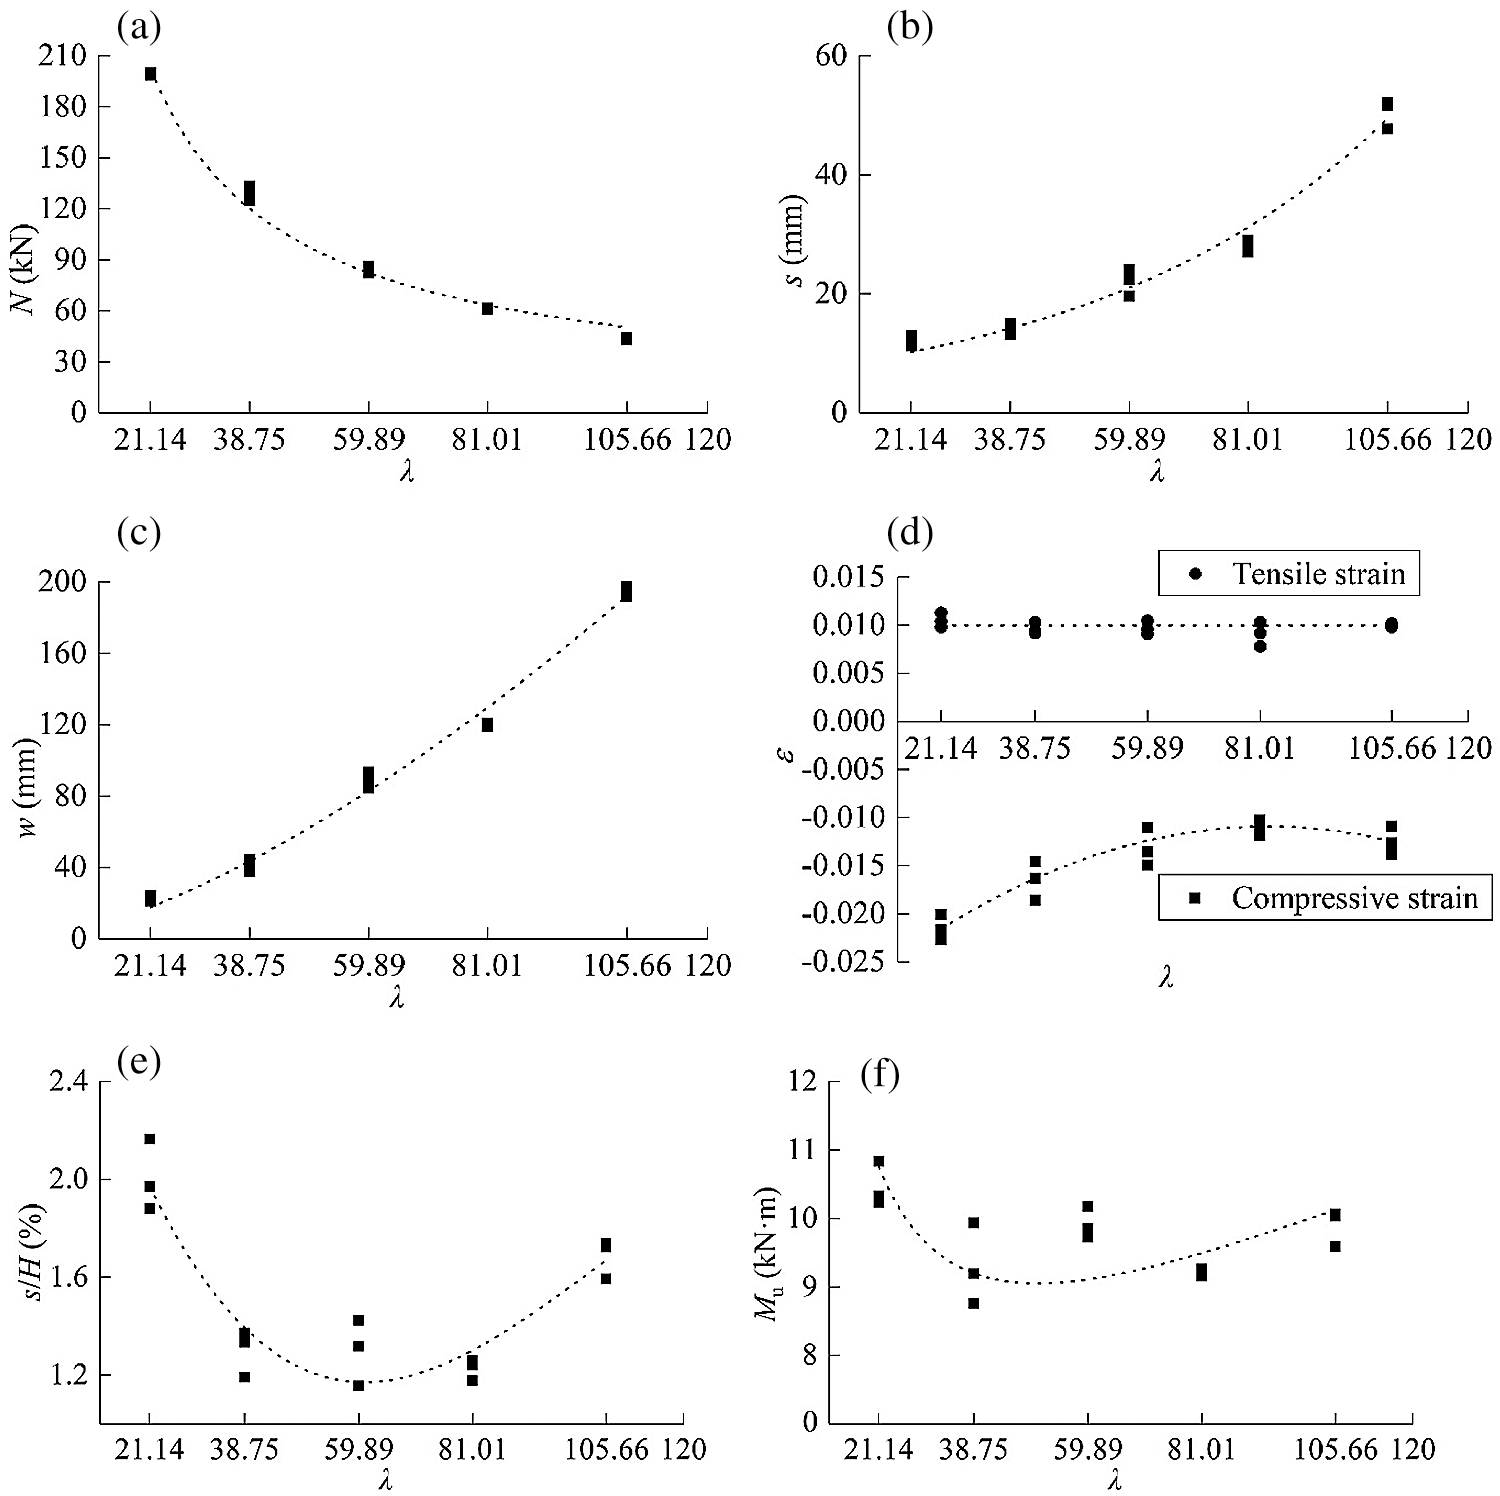
Figure 10: Relationship between test results and slenderness ratio (a) Ultimate strength (b) Axial displacement (c) Lateral displacement (d) Strain (e) s/H (f) Ultimate bending moment
From Fig. 10d, the ultimate tensile strain of the LBL column was about 0.01, which was slightly lower than the ultimate tensile strain obtained from a clear LBL specimen. This was because the LBL column was mainly damaged at the finger joint, which meant that the strength of this material was not fully utilized. The ultimate compressive strain in the compression zone gradually decreased and remained at about 0.012. The ultimate compressive strain of specimens with slenderness ratios of 21.14 and 38.75 could reach the ultimate compressive strain obtained from a clear LBL specimen.
Fig. 10e shows the compression ratio (s/H) of LBL columns with different slenderness ratios. The mean compressive ratio of specimens with slenderness ratios of 38.75, 59.89, and 81.01 are 1.3%, 1.3%, and 1.23%, respectively. It can be concluded that the deformation of LBL columns can be controlled if the slenderness ratio is maintained within a certain range.
The failure of LBL columns under eccentric compression was bending failure in the tensile zone, thus, the bending moment of the most unfavorable section in the ultimate equilibrium state was an important index to ensure the normal operation of LBL columns. In Tab. 1, the maximum value of the ultimate bending moment of 15 specimens was 10.84 kN·m (E600-1), the minimum value was 8.75 kN·m (E1100-3), the mean value of all 15 specimens was 9.17 kN·m with the coefficient of variation of 5.90%. It can be considered that the ultimate bending moment of LBL columns with different slenderness ratios under compression with the same initial eccentricity is a fixed value. The characteristic value of 8.26 kN·m (characteristic value = mean value−1.7 × standard deviation) with a 95% guarantee rate can be taken for design to ensure the safety.
4 Calculation for the Ultimate Capacity
4.1 Theoretical Calculation of Ultimate Capacity
To simplify the calculation, the following assumptions were made for the calculation model.
Firstly, LBL was assumed as a homogeneous material, the influences of the glue layer, bamboo nodes, and finger joints were ignored. The capacity of LBL columns depended on the mechanical properties of the grain. The constitutive model [37] of the LBL parallel to the grain is shown in Fig. 11 and Eq. (7). In Fig. 11, the value of εcn, εcu, εc0, εtu are −0.003, −0.005, −0.002, 0.012, respectively [18]; the value of σcn, ftu, fc0 are 29.96, 90 and 60 MPa, respectively [24]; α = 0.01993; n = 7.7528; β = 0.917, where (εcn, σcn) is any point in the elastic stage; fc0 is the peak compressive stress; εc0 is the peak compressive strain; εcu is the ultimate compressive strain value; ftu is the ultimate tensile stress; εtu is the ultimate tensile strain.
Secondly, plane section assumption. Under eccentric load, the strain on the LBL column varies linearly with the height of the section which is shown in Fig. 8.
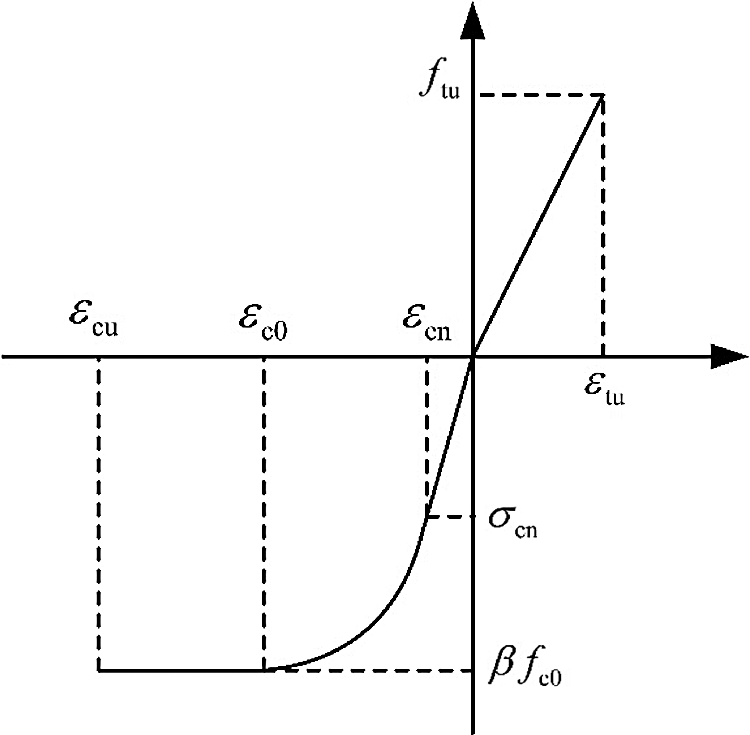
Figure 11: Constitutive model of the LBL parallel to grain
Thirdly when the ultimate load was reached, the stress in chamfered area of the compression zone was a constant.
Based on the assumptions above, the stress-strain distribution of LBL columns under eccentric compression is shown in Fig. 12.
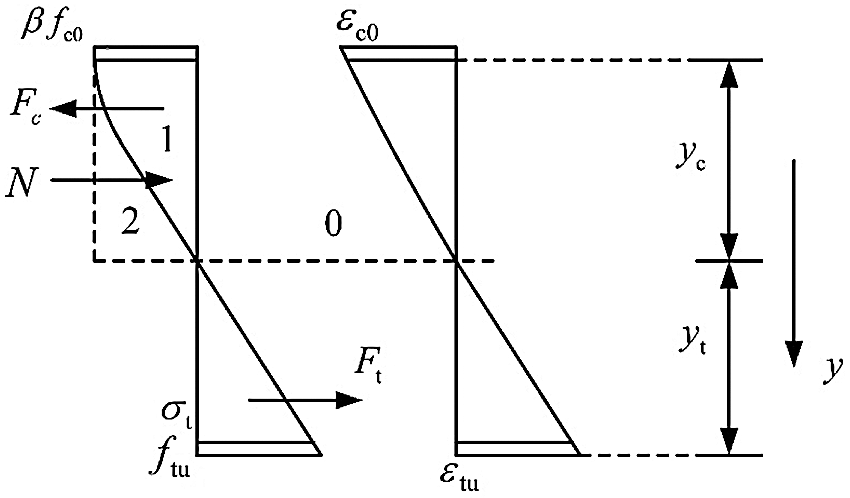
Figure 12: Stress-strain distribution
Based on the equilibrium equation of the load, Eq. (8) could be obtained.
where, Ft, Fc are the resultant forces of the tension and compression zones, respectively; N is external load; Ft could be obtained from Eq. (9):
Taking ε = ky into Eq. (9):
Eq. (11) could be obtained by integrating Eq. (10):
According to the linear relation of strain and stress in tension zone:
Substitute Eq. (12) into Eq. (11), the resultant force in tensile zone was gained:
The resultant force in the compression zone could be expressed as:
where Fc1 is the resultant force in the compression zone of the chamfered part; Fc2 is the resultant force of the remaining compression zone. Fc1 could be calculated by Eq. (15):
where, ST is the area of trapezoid part with the value of 900 mm2.
Fc2 could be obtained by Eq. (12):
where, S1 and S2, (kN/mm), represent the stress distribution per unit width of Zone 1 and Zone 2 in Fig. 12, respectively; Su, (kN/mm), represents the combined stress distribution of Zone 1 and Zone 2.
Then Eq. (17) could be obtained:
Substitute
Eq. (19) could be obtained by integrating Eq. (18):
Combing Eqs. (8), (13)–(15) and (19), the ultimate capacity could be obtained.
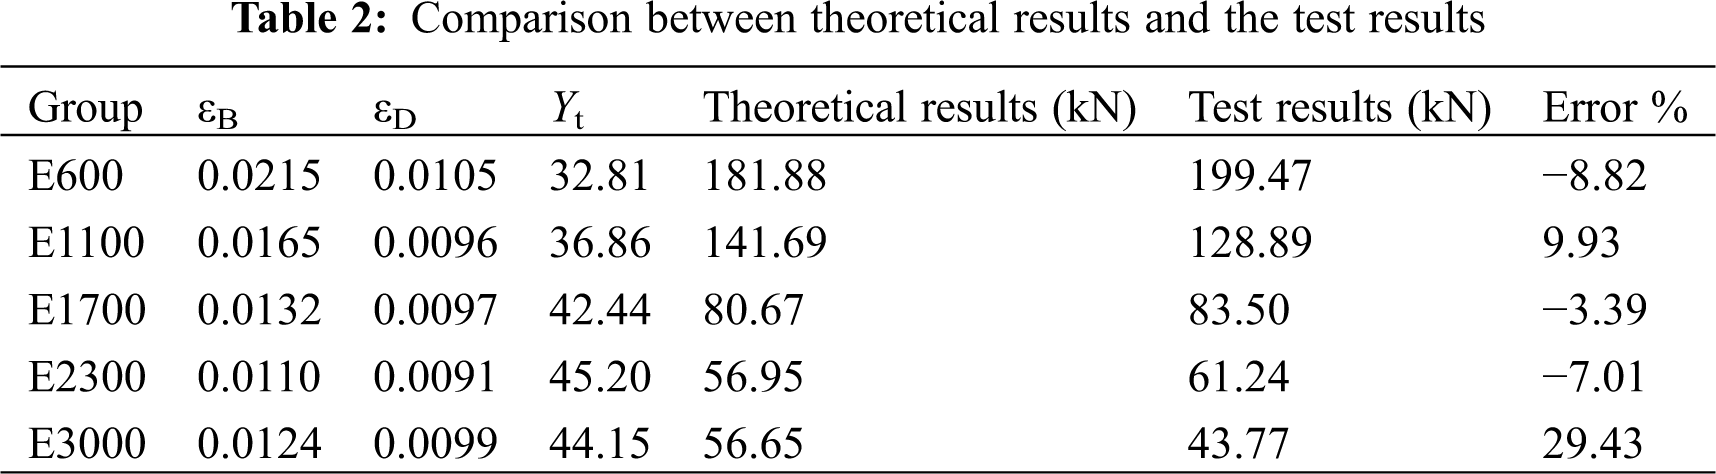
The comparison between the theoretical results and the test results is shown in Tab. 2. The error between the calculated results and test results was less than 10% except specimens of group E3000, which may be due to the larger number of the bamboo nodes and finger joints of higher columns, leading to the large error. Error is calculated by (Theoretical results-Test results)/Test results. Thus, the rationality of the basic assumptions and the practicability of the stress-strain model based on Ramberg-Osgood relation were proved.
4.2 General Formula for Ultimate Capacity
In the existing research, Li et al. [35,36] gave the calculation formula of ultimate capacity of LBL columns with different eccentricity and slenderness ratio under eccentric compression in Eqs. (20) and (21). However, the effect of slenderness ratio and eccentricity is not considered comprehensively in the formulas.
where
Considering the influence of slenderness ratio and eccentricity, the ultimate capacity (
According to the test data in papers [35,36], the relationship between ultimate capacity, slenderness ratio and eccentricity can be expressed by Eq. (23).
The parameters in Eq. (23) could be determined by regression analysis, and the calculation formula of ultimate capacity could be obtained (R2 = 0.9):
Fig. 13 shows the relationship between ultimate capacity, slenderness ratio and eccentricity.
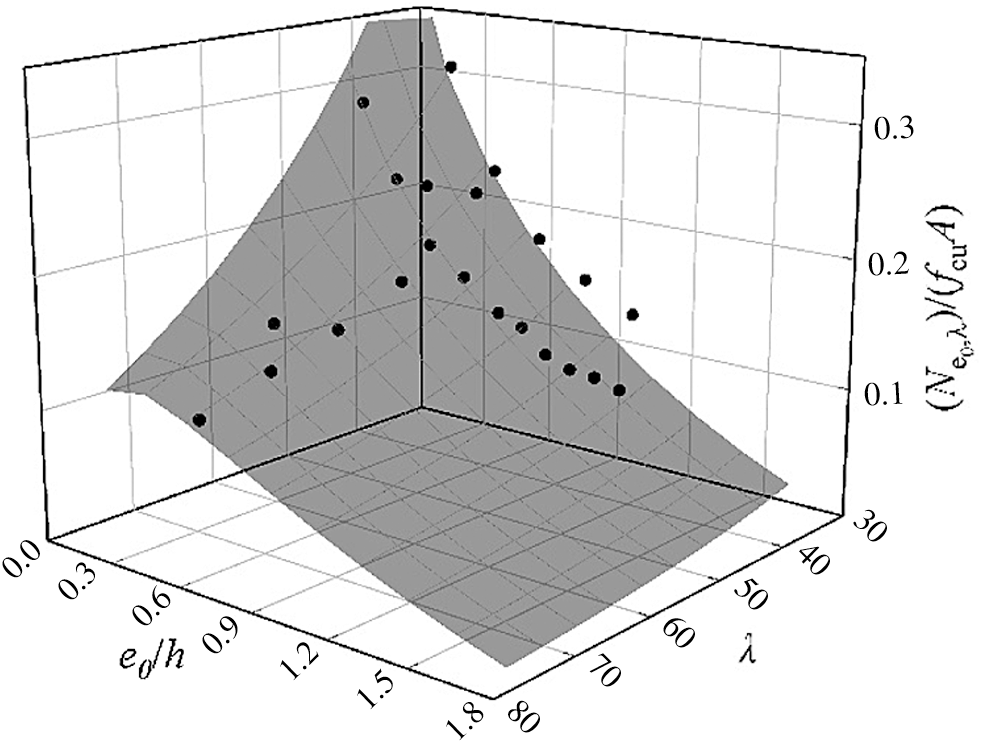
Figure 13: Relationship between ultimate capacity, slenderness ratio and eccentricity
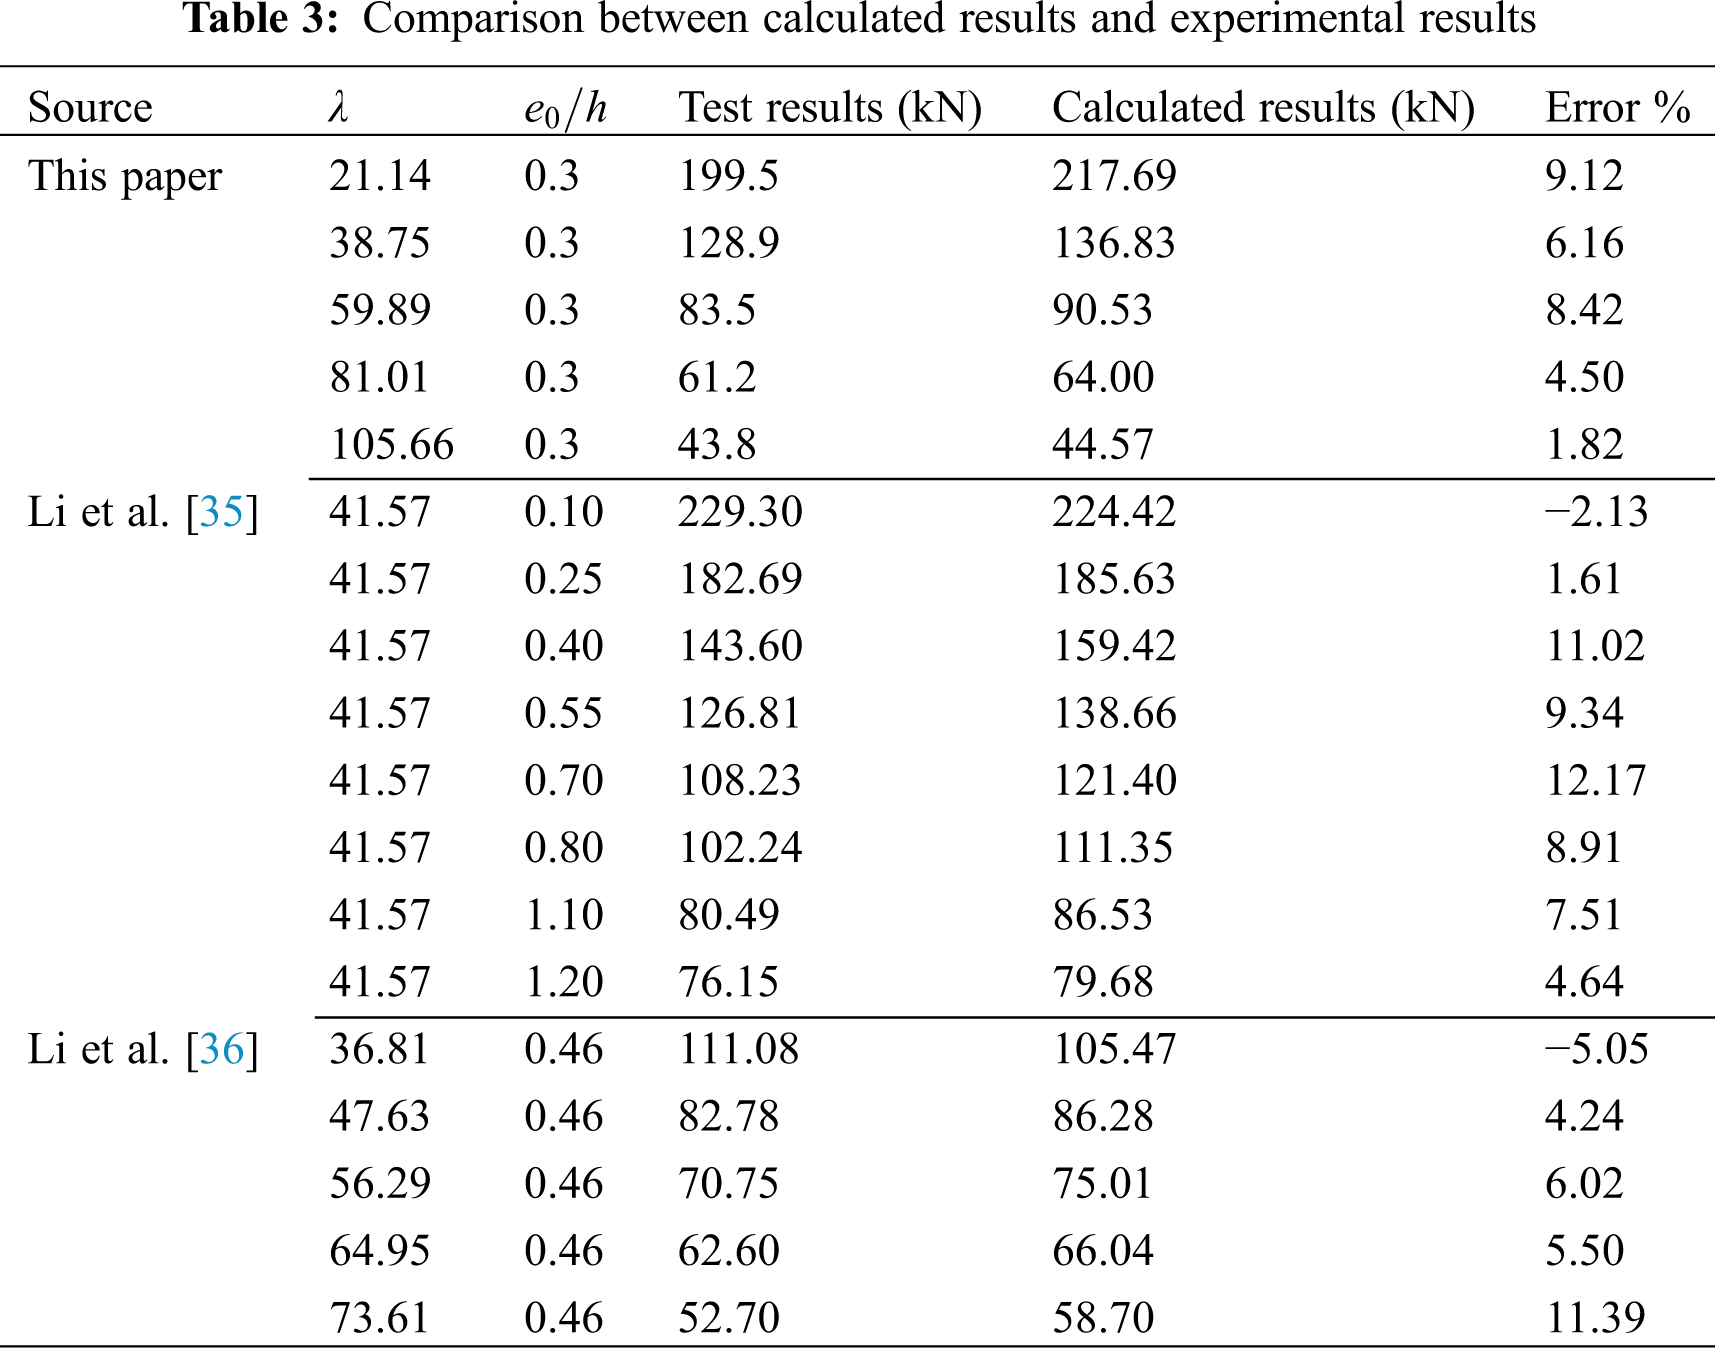
The comparison between results calculated by Eq. (24) and experimental results is shown in Tab. 3. The error is within 25%, which shows the applicability of Eq. (22). Error is calculated by (Calculated results-Test results)/Test results.
(1) (1) Under the initial eccentricity of 30 mm, the failure modes of LBL columns with different slenderness ratios were similar, showing fracture failure of bamboo strips in the tension area. The finger joint was the weakest part of LBL, which led to the fact that the tensile strength of bamboo was not fully utilized when the ultimate load was reached. Except for specimens with a height of 600 mm, other groups of specimens experienced a long deformation after reaching the ultimate load, showing good ductility.
(2) (2) With the increase of slenderness ratio, the ultimate load of the specimens decreased, the ultimate strain in the tensile region reached the ultimate tensile strain of the bamboo strips, which is the main reason for the failure of specimens. Specimens with a height of 600 mm reached the ultimate compressive strain in the compression zone, which made specimens of group E600 fail rapidly when they reached the ultimate load and could not sustain large deformation.
(3) (3) The lateral displacements of the specimens under eccentric compression were approximately parabolic in the direction of column height. The bending moment at the middle of the specimens was a constant when the ultimate load was reached.
(4) (4) The plane section assumption can be used to express the mid-span stress and strain distribution of chamfered LBL columns under eccentric compression. The method for calculating the ultimate bearing capacity was proposed using a constitutive model based on the Ramberg-Osgood relation. Considering the influence of slenderness ratio and eccentricity, the empirical formula for calculating the ultimate capacity was given based on the former research as well as the test results in this paper.
Acknowledgement: Thanks for all fundings! The writers gratefully acknowledge Zhen Wang, Hang Li, Chen Chen, Gensheng Chen, Jiachen Lei, Ben Chen, Nianqiang Zhou, Longlong Zhao, Xiaoyan Zheng, Shaoyun Zhu, Liqing Liu, Dunben Sun, Jing Cao, Yanjun Liu, and others from the Nanjing Forestry University for helping with the tests.
Funding Statement: This study was funded by the National Natural Science Foundation of China (Nos. 51878354 & 51308301), the Natural Science Foundation of Jiangsu Province (Nos. BK20181402 & BK20130978), Postgraduate Research & Practice Innovation Program of Jiangsu Province (No. KYCX20_0885), Six talent peak high-level projects of Jiangsu Province (No. JZ-029), and Qinglan Project of Jiangsu Higher Education Institutions. Any research results expressed in this paper are those of the writers and do not necessarily reflect the views of the foundations.
Conflicts of Interest: The authors declare that they have no conflicts of interest to report regarding the present study.
1. Li, X., Ashraf, M., Mahbube, S., Paul, K., Bidur, K. et al. (2020). Experimental and numerical study on bending properties of heterogeneous lamella layups in cross laminated timber using australian radiata pine. Construction and Building Materials, 247, 118525. DOI 10.1016/j.conbuildmat.2020.118525. [Google Scholar] [CrossRef]
2. Yang, R., Li, H., Dauletbek, A., Ashraf, M., Lorenzo, R. et al. (2021). Effect of freeze–thaw cycles on physical and mechanical properties of glulam exposed to outdoor environment. Journal of Renewable Materials, 9(7), 1293–1307. DOI 10.32604/jrm.2021.015296. [Google Scholar] [CrossRef]
3. Resch, E., Kaliske, M. (2009). Three-dimensional numerical analyses of load-bearing behavior and failure of multiple double-shear dowel-type connections in timber engineering. Computers and Structures, 88(3), 165–177. DOI 10.1016/j.compstruc.2009.09.002. [Google Scholar] [CrossRef]
4. Huber, J. A. J., Ekevad, M., Girhammar, U. A., Berg, S. (2019). Structural robustness and timber buildings–A review. Wood Material Science & Engineering, 14(2), 107–128. DOI 10.1080/17480272.2018.1446052. [Google Scholar] [CrossRef]
5. Wang, Z., Li, H., Lorenzo, R., Corbi, I., Corbi, O. et al. (2020). Review on bond properties between wood and fiber reinforced polymer. Journal of Renewable Materials, 8(8), 993–1018. DOI 10.32604/jrm.2020.012488. [Google Scholar] [CrossRef]
6. Pradhan, N. P. N., Paraskeva, T. S., Dimitrakopoulos, E. G. (2020). Quasi-static reversed cyclic testing of multi-culm bamboo members with steel connectors. Journal of Building Engineering, 27, 100983. DOI 10.1016/j.jobe.2019.100983. [Google Scholar] [CrossRef]
7. Hong, C., Li, H., Lorenzo, R., Wu, G., Corbi, I. et al. (2019). Review on connections for original bamboo structures. Journal of Renewable Materials, 7(8), 713–730. DOI 10.32604/jrm.2019.07647. [Google Scholar] [CrossRef]
8. Wei, X., Chen, F., Wang, G. (2020). Flexibility characterization of bamboo slivers through winding-based bending stiffness method. Journal of Forestry Engineering, 5(2), 48–53. DOI 10.13360/j.issn.2096-1359.201905046. [Google Scholar] [CrossRef]
9. Lou, Z., Yang, L., Zhang, A., Shen, D., Liu, J. et al. (2020). Influence of saturated steam heat treatment on the bamboo color. Journal of Forestry Engineering, 5(4), 38–44. DOI 10.13360/j.issn.2096-1359.201906044. [Google Scholar] [CrossRef]
10. Lou, Z., Yuan, C., Li, Y., Shen, D., Yang, L. et al. (2020). Effect of saturated steam treatment on the chemical composition and crystallinity properties of bamboo bundles. Journal of Forestry Engineering, 5(2), 29–35. DOI 10.13360/j.issn.2096-1359.201905014. [Google Scholar] [CrossRef]
11. Wu, Y., Xiao, Y. (2018). Steel and glubam hybrid space truss. Engineering Structures, 171, 140–153. DOI 10.1016/j.engstruct.2018.05.086. [Google Scholar] [CrossRef]
12. Yu, Y., Huang, Y., Zhang, Y., Liu, R., Meng, F. et al. (2019). The reinforcing mechanism of mechanical properties of bamboo fiber bundle-reinforced composites. Polymer Composites, 40(4), 1463–1472. DOI 10.1002/pc.24885. [Google Scholar] [CrossRef]
13. Lv, Q., Ding, Y., Liu, Y. (2019). Study of the bond behaviour between basalt fibre-reinforced polymer bar/sheet and bamboo engineering materials. Advances in Structural Engineering, 22(14), 3121–3133. DOI 10.1177/1369433219858725. [Google Scholar] [CrossRef]
14. Verma, C. S., Chariar, V. M. (2013). Stiffness and strength analysis of four layered laminate bamboo composite at macroscopic scale. Composites Part B: Engineering, 45(1), 369–376. DOI 10.1016/j.compositesb.2012.07.048. [Google Scholar] [CrossRef]
15. Xuan, Y., Li, H., Bei, Z., Xiong, Z., Lorenzo, R. et al. (2021). Nodes effect on the bending performance of laminated bamboo lumber unit. Journal of Renewable Materials, 9(6), 1143–1156. DOI 10.32604/jrm.2021.015292. [Google Scholar] [CrossRef]
16. Reynolds, T., Sharma, B., Harries, K., Ramage, M. (2016). Dowelled structural connections in laminated bamboo and timber. Composites Part B: Engineering, 90, 232–240. DOI 10.1016/j.compositesb.2015.11.045. [Google Scholar] [CrossRef]
17. Anokye, R., Bakar, E. S., Ratnasingam, J., Yong, A. C. C., Bakar, N. N. (2016). The effects of nodes and resin on the mechanical properties of laminated bamboo timber produced from gigantochloa scortechinii. Construction and Building Materials, 105, 285–290. DOI 10.1016/j.conbuildmat.2015.12.083. [Google Scholar] [CrossRef]
18. Correal, J. F., Echeverry, J. S., Ramírez, F., Yamín, L. E. (2014). Experimental evaluation of physical and mechanical properties of glued laminated guadua angustifolia kunth. Construction and Building Materials, 73, 105–112. DOI 10.1016/j.conbuildmat.2014.09.056. [Google Scholar] [CrossRef]
19. Zhong, Y., Ren, H. Q., Jiang, Z. H. (2016). Effects of temperature on the compressive strength parallel to the grain of bamboo scrimbe. Materials, 9(6), 436. DOI 10.3390/ma9060436. [Google Scholar] [CrossRef]
20. Aschheim, M., Gil-Martín, L. M. (2010). Hernández-montes E. Engineered Bamboo I-Joists. Journal of Structural Engineering, 136(12), 1619–1624. DOI 10.1061/(ASCE)ST.1943-541X.0000235. [Google Scholar] [CrossRef]
21. Li, H., Xuan, Y., Xu, B., Li, S. (2020). Bamboo application in civil engineering field. Journal of Forestry Engineering, 5(6), 1–10. DOI 10.13360/j.issn.2096-1359.202003001. [Google Scholar] [CrossRef]
22. Sun, L., Bian, Y., Zhou, A., Zhu, Y. (2020). Study on short-term creep property of bamboo scrimber. Journal of Forestry Engineering, 5(2), 69–75. DOI 10.13360/j.issn.2096-1359.201905021. [Google Scholar] [CrossRef]
23. Zhou, K., Li, H., Hong, C., Ashraf, M., Sayed, U. et al. (2021). Mechanical properties of large-scale parallel bambooo strand lumber under local compression. Construction and Building Materials, 271, 121572. DOI 10.1016/j.conbuildmat.2020.121572. [Google Scholar] [CrossRef]
24. Wang, Z., Li, H., Yang, D., Xiong, Z., Sayed, U. et al. (2021). Bamboo node effect on the tensile properties of side press-laminated bamboo lumber. Wood Science and Technology, 55(1), 195–214. DOI 10.1007/s00226-020-01251-9. [Google Scholar] [CrossRef]
25. Chen, G., Yu, Y., Li, X., He, B. (2020). Mechanical behavior of laminated bamboo lumber for structural application: An experimental investigation. European Journal of Wood and Wood Products, 78(1), 53–63. DOI 10.1007/s00107-019-01486-9. [Google Scholar] [CrossRef]
26. Mahdavi, M., Clouston, P. L., Arwade, S. R. (2011). Development of laminated bamboo lumber: Review of processing, performance, and economical considerations. Journal of Materials in Civil Engineering, 23(7), 1036–1042. DOI 10.1061/(ASCE)MT.1943-5533.0000253. [Google Scholar] [CrossRef]
27. Yang, D., Li, H., Xiong, Z., Mimendi, L., Lorenzo, R. et al. (2020). Mechanical properties of laminated bamboo under off-axis compression. Composites Part A: Applied Science and Manufacturing, 138, 106042. DOI 10.1016/j.compositesa.2020.106042. [Google Scholar] [CrossRef]
28. Karyadi, K., Basuki, E. W. A., Susanto, P. B., Nindyawati, N. (2019). Sidewall thickening as strengthening for Box-section laminated bamboo beam under transverse load in shear failure mode. Research Journal of Applied Sciences, Engineering and Technology, 16, 129–134. DOI 10.19026/rjaset.16.6008. [Google Scholar] [CrossRef]
29. Sharma, B., Gatóo, A., Ramage, M. H. (2015). Effect of processing methods on the mechanical properties of engineered bamboo. Construction and Building Materials, 83, 95–101. DOI 10.1016/j.conbuildmat.2015.02.048. [Google Scholar] [CrossRef]
30. Wei, Y., Jiang, S., Lv, Q., Zhang, Q., Wang, L. et al. (2011). Flexural performance of glued laminated bamboo beams. Advanced Materials Research, 168–170, 1700–1703. DOI 10.4028/www.scientific.net/AMR.168-170.1700. [Google Scholar]
31. Lima, D. M., Amorim, M. M., Lima, J. H. C., Barbosa, N. P., Wilrich, F. L. (2014). Avaliação do comportamento de vigas de bambu laminado colado submetidas à flexão. Ambiente Construído, 14(1), 15–27. DOI 10.1590/S1678-86212014000100003. [Google Scholar] [CrossRef]
32. Sinha, A., Way, D., Mlasko, S. (2014). Structural performance of glued laminated bamboo beams. Journal of Structural Engineering, 140(1), 4013021. DOI 10.1061/(ASCE)ST.1943-541X.0000807. [Google Scholar] [CrossRef]
33. Harries, K. A., Bumstead, J., Richard, M., Trujillo, D. (2017). Geometric and material effects on bamboo buckling behaviour. Proceedings of the Institution of Civil Engineers-Structures and Buildings, 170(4), 236–249. DOI 10.1680/jstbu.16.00018. [Google Scholar] [CrossRef]
34. Wang, Z., Li, H., Fei, B., Ashraf, M., Xiong, Z. et al. (2021). Axial compressive performance of laminated bamboo column with aramid fiber reinforced polymer. Composite Structures, 258, 113398. DOI 10.1016/j.compstruct.2020.113398. [Google Scholar] [CrossRef]
35. Li, H., Wu, G., Zhang, Q., Su, J. (2016). Mechanical evaluation for laminated bamboo lumber along two eccentric compression directions. Journal of Wood Science, 62(6), 503–517. DOI 10.1007/s10086-016-1584-1. [Google Scholar] [CrossRef]
36. Li, H., Liu, R., Lorenzo, R., Wu, G., Wang, L. (2019). Eccentric compression properties of laminated bamboo columns with different slenderness ratios. Proceedings of the Institution of Civil Engineers–Structures and Buildings, 172(5), 315–326. DOI 10.1680/jstbu.18.00007. [Google Scholar] [CrossRef]
37. Ramberg, W., Osgood, W. R. (1943). Description of stress-strain curves by three parameters. Washington DC, NACA Technical Note 902, National Bureau of Standards. [Google Scholar]
 | This work is licensed under a Creative Commons Attribution 4.0 International License, which permits unrestricted use, distribution, and reproduction in any medium, provided the original work is properly cited. |