| Journal of Renewable Materials |
DOI: 10.32604/jrm.2022.021531
ARTICLE
Acoustics Performance Research and Analysis of Light Timber Construction Wall Elements Based on Helmholtz Metasurface
1Jiangsu Co-Innovation Center of Efficient Processing and Utilization of Forest Resources, College of Materials Science and Technology, Nanjing Forestry University, Nanjing, 210037, China
2College of Civil Engineering, Nanjing Forestry University, Nanjing, 210037, China
*Corresponding Author: Zheng Wang. Email: wangzheng63258@163.com
Received: 19 January 2022; Accepted: 12 March 2022
Abstract: Based on the efficient sound absorption characteristics of Helmholtz resonance structures in the range of medium and low frequency acoustic waves, this paper investigates an effective solution for light timber construction walls with acoustic problems. This study takes the light timber construction wall structure as the research object. Based on the Helmholtz resonance principle, the structure design of the wall unit, impedance tube experiment and COMSOL MULTIPHYSICS simulation calculation were carried out to obtain the change rule of acoustic performance of the Helmholtz resonance wall unit structure. The research results show that the overall stability of sound insulation of the structure is improved, and the frequency range with sound transmission loss more than 50 dB in the experimental group is 640–1600 Hz, while in the control group is 500–906 Hz and 1238–1600 Hz; the sound absorption performance of the structure is obviously better than that of the ordinary structure, especially in the low frequency acoustic wave range of 100–320 Hz, the sound absorption coefficient of the experimental group is more than 0.49, while the sound absorption coefficient of the control group is less than 0.1. It is expected that these results will contribute to the optimization of the acoustic performance of light timber construction walls and have high application and popularization value.
Keywords: Acoustic metasurface; aperture embedded helmholtz resonance structure; light timber construction; low frequency sound absorption; ordinary wall structure
Since the natural frequency of human organs is mainly in the ultra-low and low frequency range, it is easy to resonate with low frequency acoustic waves, so people’s health is very vulnerable to low frequency noise. The health damage caused by low frequency noise is becoming more and more obvious and sound insulation and vibration have become a hot issue in the research of building comfort [1–8]. In order to solve the problem of noise pollution caused by medium and low frequencies in today’s living environment, this paper attempts to apply acoustic metasurface based on the Helmholtz resonance structure to light timber construction walls.
The Helmholtz resonance structure consists of a closed cavity and a perforated plate whose one end is connected to the cavity and the other end is connected to the pipe. The perforated plate and cavity form an elastic vibration system. When the acoustic frequency of the fluid matches the natural frequency of the resonant cavity vibration system, the vibration system enters a strong resonance. The motion velocity of the fluid column with a certain mass in the short pipe is accelerated, the frictional resistance is increased, and a large amount of sound energy is converted into heat energy and consumed to achieve the purpose of silencing. The sound absorption mechanism is that the aperture size of the perforated plate is equal to the thickness of the viscous boundary layer, so the viscous loss in the perforation cannot be ignored and corresponds to the acoustic resistance xh and acoustic reactance yh. The appropriate acoustic reactance yc can be obtained by adjusting the air cavity volume of the cavity structure so that the total acoustic reactance ys of the structure is 0, ys = yh + yc = 0. Under this condition, the total acoustic resistance xh can be matched with the air acoustic resistance xs by adjusting the aperture of the perforation, xs = xh = 1, and the perfect sound absorption is finally achieved. The disadvantage of the traditional Helmholtz resonance structure is that it can only absorb the noise of a certain frequency. The sound absorption value reaches the maximum at the resonant frequency and decreases rapidly at the non-resonant frequency [9]. In addition, to eliminate the low frequency noise, it is necessary to increase the thickness of the resonant cavity and the cover plate, which makes the equipment very large and inconvenient to use. Therefore, the current main research objective is to redesign the structure of the Helmholtz resonator to ensure its good performance in a wide noise band, especially in the low frequency range. Based on the structural characteristics of light timber construction walls, an aperture embedded Helmholtz resonance structure is proposed, tested by impedance tube and simulated by COMSOL multimedia software, to obtain the variation law of sound absorption performance of an aperture embedded structure in a wall unit and analyze the feasibility of aperture embedded Helmholtz light timber construction walls. It is expected that the data will serve as a reference for the optimization of building wall structures.
2 Sound Absorption Principle of the Unit Structure and Design of the Wall Unit Structure
2.1 Sound Absorption Principle of the Unit Structure
The acoustic absorption coefficient α of an acoustic material or a structure can be determined by its (normal) acoustic impedance Z, and the relation between α and Z is as follows [10]:
where, ρ0 is the static air density, kg/m3; c0 is the sound velocity, m/s. According to Eq. (1), it is necessary to match the impedance of the air and the impedance of the absorbing material/structure to achieve perfect sound absorption, i.e., Re(Z) = ρ0c0 and Im(Z) = 0. The impedance of the structural cavity that satisfies this condition is Z = -jρccccot(kcL), and the minimum value of kcL should be close to π /2, i.e., the inner length L of the structural cavity should be close to the quarter wavelength, where L, kc, ρc, cc is the inner length of the structural cavity, the complex wave number, complex air density, and complex sound velocity [11], respectively.
In the low frequency range, the thickness of a quarter wavelength means a very large structure. To overcome this problem, an effective method is to increase the sound quality of the system, which can induce the large phase delay within a certain thickness. Many studies have shown that inserting a group of expansion tubes into the panel can enhance its low frequency absorption capacity [12,13]. For example, a study by Simon in 2018 [14] showed that a highly efficient and ultra-thin (∼λ/25) sound absorber can be achieved by a series of slots embedded in the cavity as shown in Fig. 1a.

Figure 1: Detailed structural theoretical model diagram of aperture embedded helmholtz resonance unit
As shown in Fig. 1b, According to Crandall theory [15], for short aperture, when kla<<1(k = ω/c0) and sin(kcla/2) ≈ kcla/2, the acoustic impedance per unit length can be simplified as:
where ρ0 is static air density, kg/m3; ω is the angular frequency, rad/s; la is the aperture length, m; Ψv is the viscosity coefficient. When the shape of the cavity is irregular due to the embedded aperture, and its acoustic impedance needs to be modified. By modifying the results and considering its viscosity and heat loss, the acoustic impedance of the backing cavity can be expressed as:
where Sa = π(da/2)2 is the cross-sectional area of the cavity within the embedded aperture, m2; da is the diameter of the cavity within the embedded aperture, m; V = AcL−Sal is the irregular volume of the inner cavity, m3; Ac is the cross-sectional area of the inner cavity, m2; L is the length of the inner cavity, m; l is length of the embedded aperture within the inner cavity, m.
If the influence of the embedded aperture on the cavity viscosity and the thermal field is ignored, the acoustic impedance of the entire aperture embedded resonance structure [16,17] can be expressed as:
2.2 The Structure Design of the Wall Unit
Based on the above theoretical analysis of the aperture embedded Helmholtz resonance unit structure combined with the requirements of the impedance tube experiment specimens and the basic composition of light timber construction wall structures, an aperture embedded wall unit structure of light timber construction is designed. In order to verify the acoustic performance of the structure, a group of ordinary wall elements (control group) and aperture embedded structures (experimental group) are designed for comparative analysis. The design drawings and dimensional details are shown in Fig. 2, respectively.

Figure 2: Research and analysis object
3 Acoustic Performance Experiment of the Wall Unit Structure
3.1 Sound Absorption Performance Experiment of the Wall Unit Structure
3.1.1 Experimental Materials and Instruments
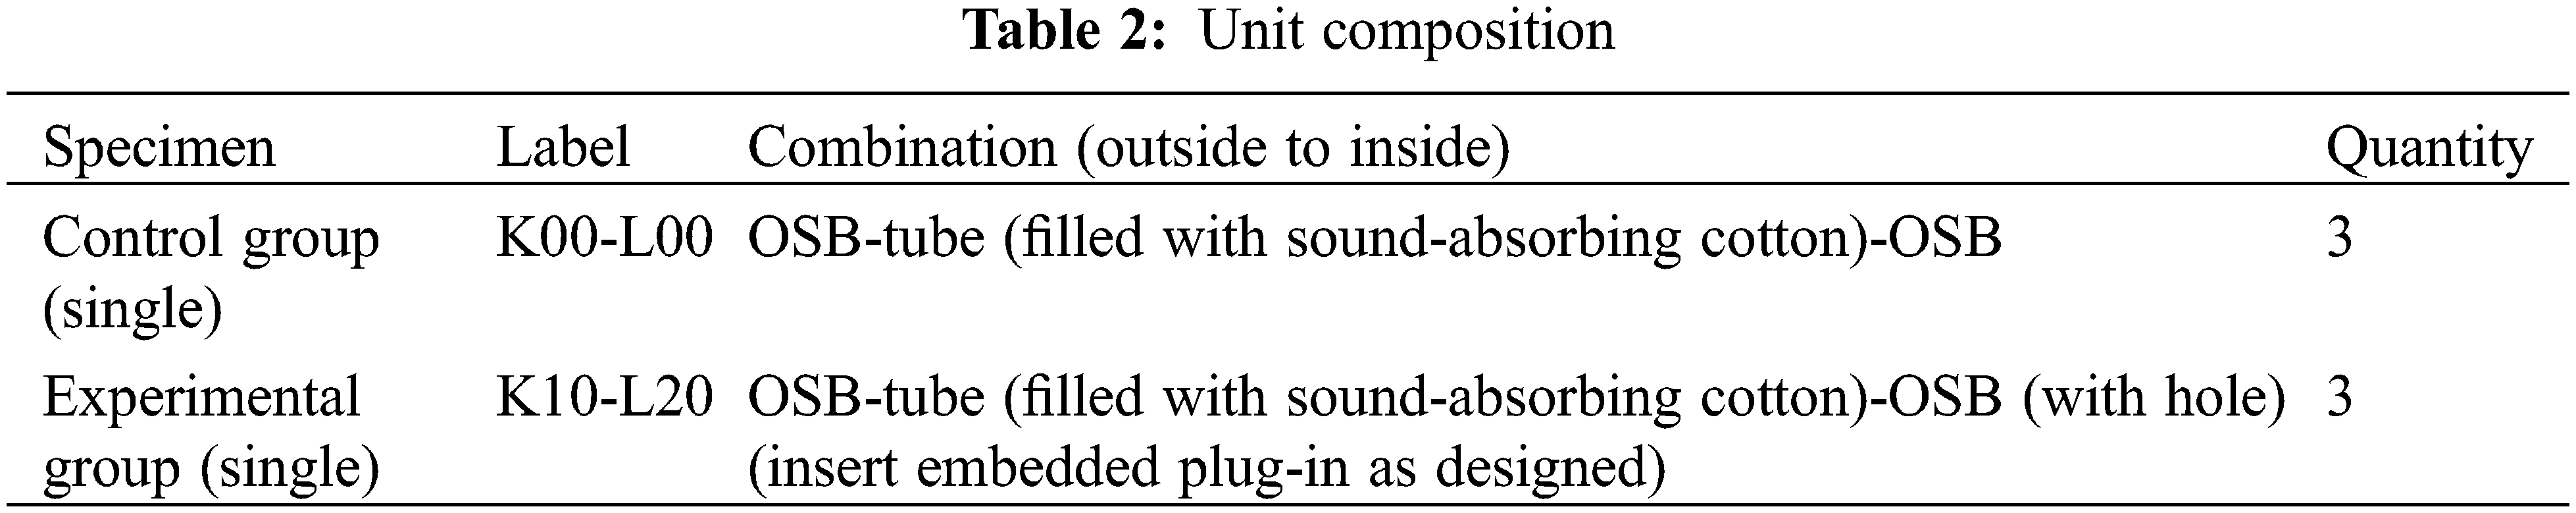
In this study, the acoustic performance of two groups of specimens of an ordinary wall structure (control group) and an aperture embedded structure (experimental group) was mainly investigated at medium and low frequencies. According to the principle and requirements of the impedance tube experiment, an impedance tube with an inner diameter of 100 mm was selected to test the acoustic performance of the structures in the frequency range of 90 to 1600 Hz. The specimens were made according to the wall unit structure design in Section 2.2, Fig. 2. The basic material parameters are listed in Table 1. The OSB panel specimens were manufactured and punched by a CNC machine tool with a moisture content of 9.5% and the tube and embedded plug-in were processed by 3D printing. The number of specimens of each specification was three. According to the wall unit structure design in Section 2.2 and Table 2, the material components were assembled. In this experiment, the control group K00-L00 is the ordinary wall unit structure, and the experimental group K10-L20 is the aperture embedded unit structure. The temperature and humidity during the experiment were 24°C and 67%, respectively.
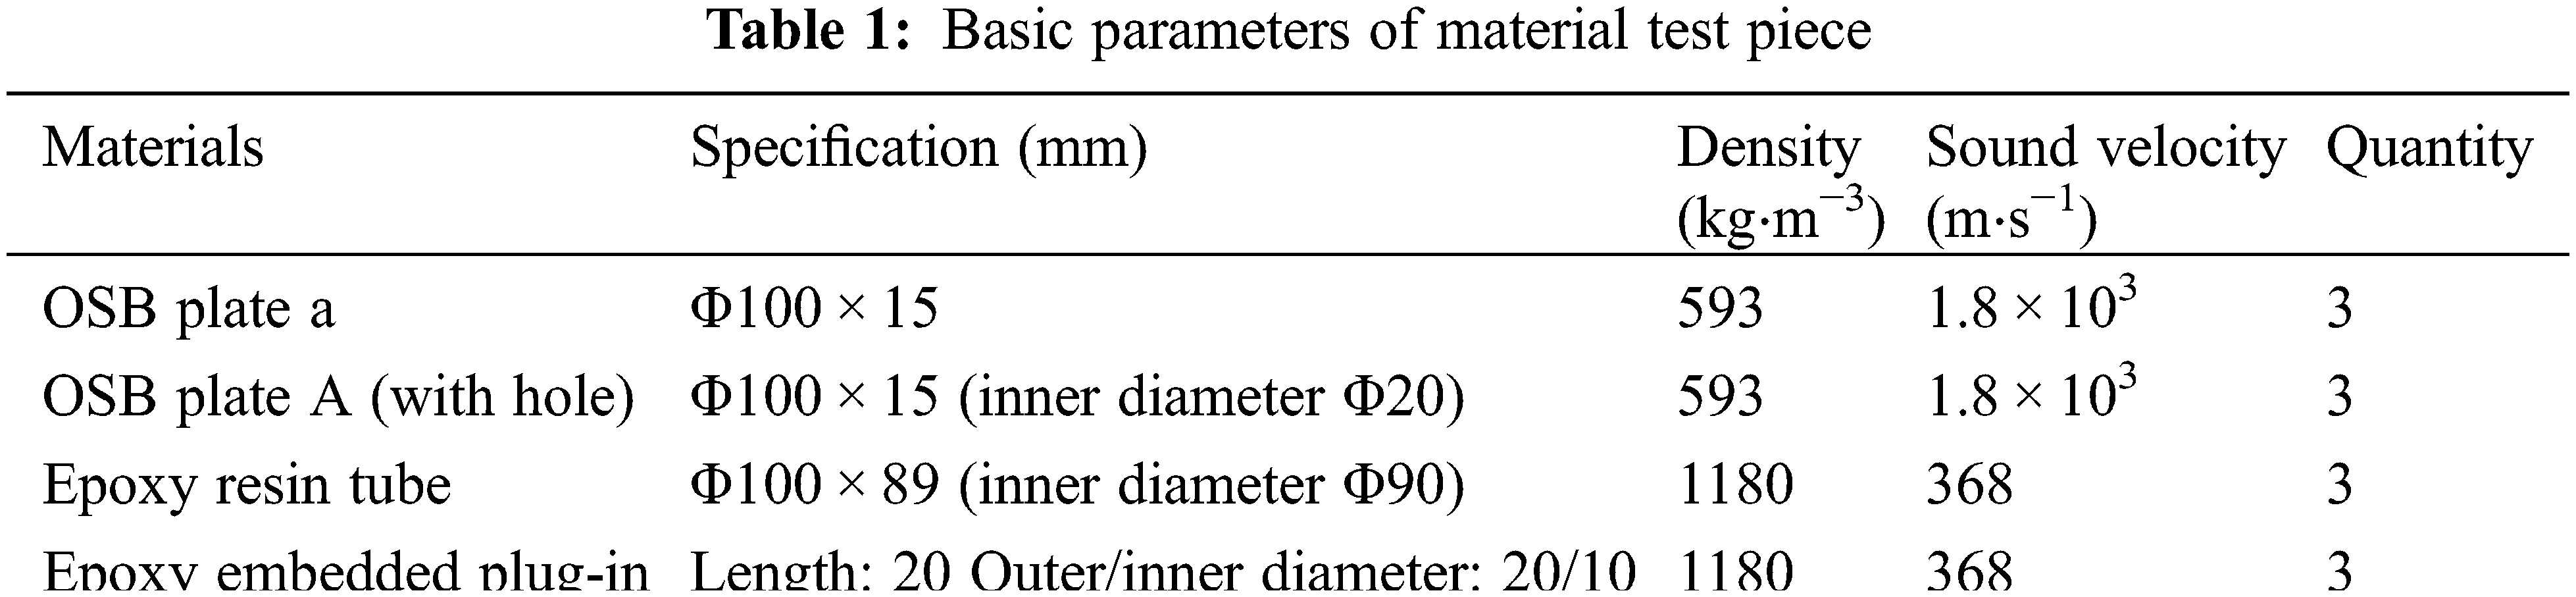
The experimental equipment B&K4206 impedance tube and its supporting system were used to test the sound absorption performance of the structures, which mainly included an impedance tube with an inner diameter of 100 mm, a distance of 50 mm between the microphone and the specimen surface and a distance of 150 mm between the microphone and the specimen surface. The testing frequency range was 90 to 1600 Hz. Furthermore, used were two 4187 dual microphones; a set of 3560B data acquisition system; a 2716C power amplifier; a PULSE7758 application software and a B&K4231 sound level calibrator.
3.1.2 Experimental Principle and Method
The two microphone transfer function method was used to test the sound absorption performance of the impedance tube. The tested specimen was inserted into one end of the impedance tube as shown in Fig. 3. The plane wave in the tube is generated by a sound source (random noise, pseudo-random sequence noise or linear frequency modulation pulse). The sound pressure is measured at two positions close to the tested specimen to obtain the sound transfer function of the signals of two sensors to calculate the normal incident sound absorption coefficients of the specimen [18].
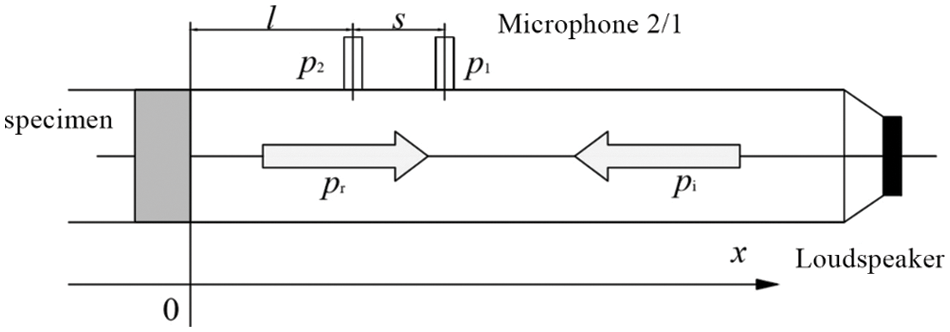
Figure 3: Principle diagram of sound absorption performance measurement with dual microphone method
The formulas of sound absorption coefficient α and normal acoustic impedance rate Z of the specimen are as follows:
where r is the reflection coefficient; ρ is the medium density, kg⋅m−3; c0 is the propagation velocity of the sound wave in the medium, m⋅s−1.
The main test steps were the following: first, the instruments were checked and the test system was connected according to Fig. 3 to run the equipment. Second, the specimen was installed and the impedance tube was configured systematically, i.e., an appropriate frequency range was used, a fine spectral resolution for FFT analysis was selected, and a linear average of more than 100 times was chosen to improve the signal-to-noise ratio. Third, the B&K4231 sound level calibrator was used to calibrate the microphone channel. Background noise measurement and signal measurement were selected, respectively, and the system automatically calculated the signal-to-noise ratio. Meanwhile, the transfer function was modified. Finally, the sound absorption coefficient of the specimen was measured. Each group of specimens was tested 5 times and post-processed by software to obtain the average experimental result of the sound absorption coefficient of the specimen.
3.2 Sound Insulation Performance Experiment of the Wall Unit Structure
3.2.1 Experimental Materials and Instruments
The sound insulation tested specimens were the same as the sound absorption experiment specimens in 2.1, as shown in Fig. 2, Tables 1 and 2. The test equipment consisted of a set of B&K4206 impedance tube and its supporting system, mainly including: one impedance tube with an inner diameter of 100 mm, a test frequency range of 50 to 1600 Hz; four 4187 dual microphones; a set of 3560B data acquisition system; a 2716C power amplifier; a set of PULSE7758 application software; a B&K4231 sound level calibrator.
3.2.2 Experimental Principle and Method
To test the sound attenuation by the impedance tube, the principle of the transfer function with four microphones was used, as shown in Fig. 4. The signal generator emitted a signal, which was converted into a sound wave through the loudspeaker and entered the sound source tube to generate a planar incident wave pi. Upon impinging the specimen, part of it was absorbed, part was emitted as a planar reflected sound wave pr, and part passed through the specimen and entered the receiving tube to become a planar transmitted sound wave pt; When the planar transmitted sound wave met the absorbent ending, part was absorbed and part was reflected into a planar reflected sound wave p2r [19,20]. The impedance tube sound insulation performance test equipment mainly included the sound source, sound source tube, receiving tube, absorbent ending and microphone. Two microphones were placed in the sound source tube and the receiving tube, and the specimen was placed in the middle of the impedance tube. The distance between microphone 1 and the front of the specimen was x1, the distance between microphone 2 and the front of the specimen was x2, the distance between microphone 3 and the back of the specimen was x3, the distance between microphone 4 and the back of the specimen was x4, and the thickness of the specimen is d [21,22]. The sound pressure at the four microphones was measured and expressed as p1, p2, p3 and p4, respectively.

Figure 4: Principle diagram of sound insulation performance measurement with four-microphone method
The formula of sound pressure transmission coefficient of the specimen is:
The formula of sound insulation TL (dB) of the specimen is:
where k is the wave number, m−1; pi is the incident sound pressure, Pa; pt is the transmitted sound pressure in the transmission tube, Pa; p1, p2, p3 and p4 is the sound pressure at the four measuring points of the microphone respectively, Pa.
According to the test principle and requirements of the impedance tube, the impedance tube with an inner diameter of 100 mm was selected to test the sound insulation performance of the structures in the frequency range of 90 to 1600 Hz. The main test steps were the following: first, the sensor was calibrated. The instruments were checked and connected, and the microphones of the four channels were calibrated before the formal test. Second, background calibration was carried out. Without installing the specimen, the sound pressure at the four microphones was tested in the two states of opening and closing the absorbing end of the impedance tube to obtain the residual sound insulation. Third, the sound insulation of the specimen was tested. The specimen was installed and the sound pressure at the four microphones in the open and closed state of the absorbing end of the impedance tube was tested respectively, as was as the background calibration test. Finally, data processing was carried out. The experimental data were processed by PULSE7758 acoustic material professional test and analysis software developed by B&K Company, and the sound insulation of the specimen in the frequency range from 90 to 1600 Hz was determined.
4 Simulation Calculation of Wall Unit Structure Based on COMSOL Multiphysics Method
The software simulation operation process includes defining geometry (component size, etc.), selecting materials (input of the basic physical constants of materials required according to specific research), determining appropriate physical fields, defining boundaries and initial conditions, creating finite element meshes, selecting research methods, solving physical fields and generating visual diagrams.
Based on the impedance tube experiment, the acoustic performance of the experimental specimens is simulated and verified by using the multi-physical field COMSOL finite element software. The software modeling process includes the definition of the components, the selection of the research methods and the analysis of the results. The simulation process is as follows:
(1) Setting of components
First, the wall unit structure model was created. The simulation study was based on impedance tube specimens, so the specifications and material parameters of the simulated specimens were the same as those of impedance tube specimens (see Tables 1 and 2). The frequency of medium and low frequency incident acoustic waves was mainly studied. Therefore, the frequency range of the impedance tube experiment was set to 90–1600 Hz, the tube length of impedance tube was 500 mm, the inner diameter was 100 mm, and the distance between microphones 1 and 2 was 50 mm. The simulation geometry was defined, materials were determined, and a 3D model of the specimen was established. Acoustic pressure interfaces could be used to model pressure-acoustic phenomena such as scattering, diffraction, emission, radiation and sound propagation, as well as to model in the frequency domain using Helmholtz equations.
(2) Selection of the research
The order of research steps, parameter research and optimization was set, and “frequency domain” and “characteristic frequency” were selected as the analysis types. Referring to the frequency range of the experiment, the frequency range of the simulation study was set to 90–1600 Hz. To obtain more groups of data, 1/12 octaves were used for simulation and 1/3 octaves were used for analysis.
(3) Analysis of the results
The finite element method (FEM) was used to discretize the spatial variables (x, y, z) of the partial differential equations, generate the results, and export the graphs via the visualization function. Meanwhile, the relevant data were derived and analyzed, and the sound absorption coefficient for the frequency range 90–1600 Hz was calculated and compared to the experimental value.
5.1 Experimental Results and Analysis of Sound Absorption Performance of the Wall Units
The curves of the sound absorption coefficient with frequency in the control group (single) and the experimental group (single) are shown in Fig. 5.

Figure 5: Sound absorption coefficient of the specimens at different acoustic frequencies
As shown in Fig. 5, the sound absorption coefficient of the experimental group (single) is significantly higher than that of the control group (single) in the range of 90 to 1600 Hz. In the range of sound wave frequency 90 to 1250 Hz, the sound absorption coefficient of the experimental group (single) is larger than 0.1, while the sound absorption coefficient of the control group (single) is less than 0.1. In the range of 100–320 Hz, the sound absorption coefficient of the experimental group (single) is more than 0.49. Therefore, it can be concluded that the sound absorption performance of the aperture embedded structure is much better than that of the ordinary structure in the test frequency band, and it has good sound absorption performance in the medium and low frequencies.
As shown in Fig. 5, there are two peaks of acoustic absorption in the test frequency range in the experimental group (single), and the corresponding frequency and absorption coefficient of incident acoustic wave are 108 Hz and 0.754 and 184 Hz and 0.812, respectively, while there is only one peak sound absorption at 1364 Hz with a coefficient of 0.251 in the control group (single). The peak occurs because the incident wave propagates into the structure, reaches the natural frequency of the structure, resonates, and the sound energy is converted into heat energy. Therefore, the sound absorption coefficient is the largest at the resonance frequency and the sound absorption performance is the strongest. The comparison between the two groups shows that in addition to the overall high sound absorption coefficient of the experimental group (single) compared to the control group (single), the sound absorption peak moves to low frequencies and the sound absorption frequency band is widened. This shows that the sound absorption performance of the experimental group (single) is significantly higher than that of the control group (single) in the low frequency band.
5.2 Experimental Results and Analysis of Sound Insulation Performance of Wall Units
Fig. 6 shows the curves of sound transmission loss with frequencies of the control group (single) and the experimental group (single). The main characteristics of the two groups of specimens and their sound transmission loss more than 50 dB are marked in the Fig. 6.

Figure 6: Sound transmission loss of the specimen at different acoustic frequencies
As can be seen from Fig. 6, there are no distinct rule between the sound transmission loss of the experimental group (single) and the control group (single) in the acoustic frequency range 90–1600 Hz. Multiple acoustic insulation peaks occur in both groups. The sound transmission loss of the experimental group is lower than that of the control group in the frequency range of 90–640 Hz. This is because the embedded aperture destroys the integrity of the panel, affecting the low frequency sound insulation performance of the structure. However, compared with the control group (single), the sound insulation of the experimental group (single) is more stable overall. In the whole test frequency range, the frequency range with sound transmission loss more than 50 dB in the experimental group (single) is 640–1600 Hz, while the frequency range with sound transmission loss more than 50 dB in the control group (single) is 500–906 Hz and 1238–1600 Hz. It can be proved that the sound insulation performance of the aperture embedded structure is basically the same as that of the ordinary structure in the range of acoustic frequency 90–1600 Hz, but the overall stability of sound insulation is better than that of the ordinary structure.
As can be seen from Fig. 6, the first peak of sound transmission loss in the control group (single) appears at 280 Hz, and the sound transmission loss is 46.475 dB. The first peak of sound transmission loss in the experimental group (single) appears at 310 Hz, and the sound transmission loss is 47.857 dB. The whole sound transmission loss curve has the tendency to move toward high frequencies, but the trend is not obvious, which indicates that the structural change of the experimental group (single) compared to the control group (single) basically has no effect on the sound insulation performance of the original unit structure.
5.3 Results and Analysis of the COMSOL Simulation
The simulation results are shown in Fig. 6. The data were derived for analysis, and the maximum and minimum surface sound pressure levels of the structure were substituted into Eq. (9) [23] to calculate the simulated value of the structure’s sound absorption coefficient.
where ΔL is the difference between the maximum and minimum sound pressure levels.
Fig. 7 shows the sound pressure level distribution of two groups of specimens at 1000 Hz. In Fig. 7, only the sound pressure level distribution of the specimens is analyzed, and the impedance tube is not included. It can be seen from Fig. 7 that the sound pressure and the sound pressure level at the structure surface can be reflected by the multi-physical finite element program COMSOL, to better analyze the sound absorption performance of the structure.

Figure 7: Sound pressure levels of two groups of specimens at 125 Hz (Left: Control; Right: Experiment)
In the frequency range of 90–1600 Hz, the absorption coefficient at 1/3 octave node frequency is selected based on the data obtained from the simulation and the experiment. The comparison curve of the simulated value and the experimental value of the sound absorption coefficient of the experimental group (single) is shown in Fig. 8.

Figure 8: Comparison of simulated and experimental values of absorption coefficient of experimental group
The error of the experimental value and the simulation value of the sound absorption coefficient of the experimental group (single) in the frequency range of 90–1600 Hz and the nodal frequency of 1/3 octave is in the range of 0.08%–31.32%. The error is 31.32% at the frequencies of 100 Hz which is because the measurement of low-frequency acoustic wave propagation is greatly affected by the air tightness of the test system, resulting in large measurement error. However, the average error is maintained at 12%, which shows that the overall simulation results are basically consistent with the experimental measurement results. It can be seen from Fig. 8 that the simulated value curve decreases in the whole range of the sound absorption coefficient curve. The experimental value curve also decreases in the frequency range of 250–1600 Hz, which agrees with the simulation, but it first increases and then decreases in the frequency range of 90–250 Hz, and the peak of sound absorption occurs near 200 Hz. Compared to the experimental curve of the sound absorption coefficient, the simulation curve moves to the low frequency band, and the peak of the simulation result is in the frequency band of 90 Hz. The above reasons are: There are still some errors between the actual material performance and structural size parameters of the specimen and the input data of simulation, such as the sound-absorbing cotton and the OSB panel inside the cavity. At the same time, the simulation setting conditions are ideal, and the temperature and humidity of the environment during the test also affect the test results to some extent.
In order to solve the problem of medium and low frequency noise pollution indoors, the Helmholtz resonance structure with efficient sound absorption performance at medium and low frequencies was applied to a light timber construction wall. First of all, the principle of sound absorption performance of the unit structure was described. The wall unit structure was designed by combining the requirements of specimens in an impedance tube experiment and the basic structure of light timber walls. Then, the acoustic performance of the wall unit structure was studied and analyzed by an impedance tube experiment, including sound absorption performance and sound insulation performance. The specimen was simulated and verified using COMSOL Multiphysics based on multi-physical fields. The main conclusions are as follows:
(1) By studying the acoustic performance of the wall unit structure based on the impedance tube experiment method, it can be found that in the test frequency band, although the sound insulation performance of the aperture embedded Helmholtz resonance unit structure does not show significant change in the value, the overall stability of sound insulation is better than that of the ordinary wall unit structure. The sound absorption performance of the aperture embedded structure is significantly better than that of the ordinary structure, especially in the range of low frequency incident sound waves. Overall, the acoustic performance of the aperture embedded structure is significantly improved.
(2) The finite element software COMSOL Multiphysics can reflect the sound pressure and sound pressure level of the structure surface based on multiple physical fields and can analyze the sound absorption performance of the structure. The analysis of the experimental and simulated values of the sound absorption coefficient of the aperture embedded structure shows that the simulation results of COMSOL are basically consistent with the experimental results in the test frequency band. However, the error of sound absorption coefficient value at 100, 200 and 630 Hz frequency is large. Compared to the experimental sound absorption coefficient curve, the simulated sound absorption coefficient curve moves to the low frequency band.
The combination of impedance tube experiment method and COMSOL Multiphysics simulation analysis method is very useful for researching and analysis of the sound absorption performance of the aperture embedded wall unit. This study shows that the aperture embedded wall unit structure has good sound absorption characteristics in the range of low and medium frequency incident acoustic waves. It is expected to provide a reliable foundation for the structural optimization of light timber wall and its application in practical engineering.
Acknowledgement: All support is greatly acknowledged and appreciated, especially the constructive discussion and criticism from colleagues.
Funding Statement: The authors received no specific funding for this study.
Conflicts of Interest: The authors declare that they have no conflicts of interest to report regarding the present study.
1. Corbi, O., Baratta, A., Corbi, I., Tropeano, F., Liccardo, E. (2021). Design issues for smart seismic isolation of structures: Past and recent research. Sustainable Structures, 1, 1–11. DOI 10.54113/j.sust.2021.000001. [Google Scholar] [CrossRef]
2. Liang, R., Stanislawski, D., Hota, G. (2021). Material characterization and structural response under earthquake load of Hakka rammed earth building. Sustainable Structures, 3, 1–13. DOI 10.54113/j.sust.2021.000003. [Google Scholar] [CrossRef]
3. Zhou, Y. H., Huang, Y. J., Sayed, U., Wang, Z. (2021). Research on dynamic characteristics test of wooden floor structure for gymnasium. Sustainable Structures, 5, 1–10. DOI 10.54113/j.sust.2021.000005. [Google Scholar] [CrossRef]
4. Zhang, H., Li, H. T., Li, Y. J., Xiong, Z. H., Zhang, N. N. et al. (2021). Effect of nodes onmechanical properties and microstructure of laminated bamboo units. Construction and Building Materials, 304, 124427. DOI 10.1016/j.conbuildmat.2021.124427. [Google Scholar] [CrossRef]
5. Su, J. W., Li, H. T., Xiong, Z. H., Lorenzo, R. (2021). Structural design and construction of an office building with laminated bamboo lumber. Sustainable Structures, 1(2), 000010. DOI 10.54113/j.sust.2021.000010. [Google Scholar] [CrossRef]
6. Wang, Z. H., Wang, Z., Brad, J., Wang, Y. L., Wang, X. R. et al. (2014). Dynamic testing and evaluation of modulus of elasticity (MOE) of SPF dimension lumber. BioResources, 9(3), 3869–3882. DOI 10.1016/j.rser.2010.10.006. [Google Scholar] [CrossRef]
7. Wang, Z. H., Gao, Z. Z., Wang, Y. L., Cao, Y., Wang, G. G. et al. (2015). A new dynamic testing method for elastic, shear modulus and poisson’s ratio of concrete. Construction and Building Materials, 100, 129–135. DOI 10.1002/fsn3.1479. [Google Scholar] [CrossRef]
8. Wang, Z. H., Wang, Y. L., Cao, Y., Wang, Z. (2016). Measurement of shear modulus of materials based on the torsional mode of cantilever plate. Construction and Building Materials, 124, 1059–1071 DOI 10.1016/j.colsurfb.2013.03.040. [Google Scholar] [CrossRef]
9. Yan, W. C., Jing, X. D. (2007). Noise control implementation using an active helmholtz resonator. Chinese Journal of Scientific Instrument, 2, 333–335. DOI 10.1039/C6RA10378B. [Google Scholar] [CrossRef]
10. Huang, S., Fang, X., Wang, X., Assouar, B., Cheng, Q. et al. (2019). Acoustic perfect absorbers via helmholtz resonators with embedded apertures. Journal of the Acoustical Society of America, 145(1), 254–262. DOI 10.1121/1.5087128. [Google Scholar] [CrossRef]
11. Stinson, R. M. (1991). The propagation of plane sound waves in narrow and wide circular tubes, and generalization to uniform tubes of arbitrary cross-sectional shape. Journal of the Acoustical Society of America, 89(2), 550–558. DOI 10.1121/1.400379. [Google Scholar] [CrossRef]
12. Selamet, A., Ji, Z. L. (1999). Acoustic attenuation performance of circular expansion chambers with extended inlet outlet. Journal of Sound & Vibration, 223(2), 197–212. DOI 10.1006/jsvi.1998.2138. [Google Scholar] [CrossRef]
13. Li, D. K., Chang, D. Q., Liu, B. L. (2016). Enhancing the low frequency sound absorption of a perforated panel by parallel-arranged extended tubes. Applied Acoustics, 102, 126–132. DOI 10.1016/j.apacoust.2015.10.001. [Google Scholar] [CrossRef]
14. Simon, F. (2018). Long elastic open neck acoustic resonator for low frequency absorption. Journal of Sound and Vibration, 421, 1–16. DOI 10.1016/j.jsv.2018.01.044. [Google Scholar] [CrossRef]
15. Stinson, R. M. (1985). Acoustic impedance of small, circular orifices in thin plates. Journal of the Acoustical Society of America, 77, 2039–2042. DOI 10.1121/1.391776. [Google Scholar] [CrossRef]
16. Ingard, U. (1953). On the theory and design of acoustic resonators. The Journal of the Acoustical Society of America, 25, 1037–1061. DOI 10.1121/1.1907235. [Google Scholar] [CrossRef]
17. Dah, Y. M. (1998). Potential of microperforated panel absorber. The Journal of the Acoustical Society of America, 104(5), 2861. DOI 10.1121/1.423870. [Google Scholar] [CrossRef]
18. GB/T 18696.2-2002 (2002). Acoustics—Determination of Sound Absorption Coefficient and Impedance in Impedance Tubes—Part 2: Transfer Function Method. Beijing: Standards Press of China. [Google Scholar]
19. Dong, M. (2008). The research on sound transmission loss measuring system of acoustic material. Shanghai: Shanghai Jiao Tong University. [Google Scholar]
20. Qu, B., Zhu, B. (2002). Four-microphone method of sound transmission in the standing wave tube. Noise and Vibration Control, 6, 44–46. DOI 10.1016/j.ijbiomac.2020.01.183. [Google Scholar] [CrossRef]
21. Fan, D. (2017). The design and realization of a measurement system by impedance tube for sound absorption coefficient and sound tramission loss. Changchun: Jilin University. [Google Scholar]
22. Zhao, Y. (2016). Improvement of sound insulation measurement method in standing wave tube. Guizhou: Guizhou University. [Google Scholar]
23. Hou, Q. (2012). Study and simulation of wooden perforated panels structure’s sound absorption performance. Harbin: Northeast Forestry University. [Google Scholar]
 | This work is licensed under a Creative Commons Attribution 4.0 International License, which permits unrestricted use, distribution, and reproduction in any medium, provided the original work is properly cited. |