| Journal of Renewable Materials |
DOI: 10.32604/jrm.2022.021845
ARTICLE
A Modeling Method for Predicting the Strength of Cemented Paste Backfill Based on a Combination of Aggregate Gradation Optimization and LSTM
1School of Civil and Resource Engineering, University of Science and Technology Beijing, Beijing, 100083, China
2Key Laboratory of Ministry of Education of China for Efficient Mining and Safety of Metal Mines, University of Science and Technology Beijing, Beijing, 100083, China
*Corresponding Author: Bin Han. Email: cai1youxiang@163.com
Received: 08 February 2022; Accepted: 20 March 2022
Abstract: Cemented paste backfill (CPB) is a sustainable mining technology that is widely used in mines and helps to improve the mine environment. To investigate the relationship between aggregate grading and different affecting factors and the uniaxial compressive strength (UCS) of the cemented paste backfill (CPB), Talbol gradation theory and neural networks is used to evaluate aggregate gradation to determine the optimum aggregate ratio. The mixed aggregate ratio with the least amount of cement (waste stone content river sand content = 7:3) is obtained by using Talbol grading theory and pile compactness function and combined with experiments. In addition, the response surface method is used to design strength-specific ratio experiments. The UCS prediction model which uses the LSTM and considers the aggregates gradation have high accuracy. The root mean square error (RMSE) of the prediction results is 0.0914, the coefficient of determination (R2) is 0.9973 and the variance account for (VAF) is 99.73. Compared with back propagation neural network (BP-ANN), extreme learning machine (ELM) and radial basis function neural network (RBF-ANN), LSTM can effectively characterize the nonlinear relationship between UCS and individual affecting factors and predict UCS with high accuracy. The sensitivity analysis of different affecting factors on UCS shows that all 4 factors have significant effect on UCS and sensitivity is in the following ranking: cement content (0.9264) > slurry concentration (0.9179) > aggregate gradation (waste rock content) (0.9031) > curing time (0.9031).
Keywords: Backfill; aggregate gradation; machine learning; uniaxial compressive strength; cemented paste backfill
Nomenclature
| CPB | Cemented paste backfill |
| UCS | Uniaxial compressive strength |
| LSTM | Long short-term memory neural network |
| BP-ANN | Back propagation neural network |
| ELM | Extreme learning machine |
| RBF-ANN | Radial basis function neural network |
| R2 | Coefficient of determination |
| RMSE | Root mean square error |
| VAF | Variance account for |
As Chinese mines move towards safety, green and environmental protection, fill mining, a mining method that can effectively control ground pressure and reduce environmental pollution, has become the preferred solution for major Chinese mines [1]. Cemented paste backfill (CPB) is one of the more widely used methods of fill mining [2]. CPB is a composite material made of cement, aggregate mixed with water, which provides a stable bearing capacity for the underground mined-our area, and the level of this bearing capacity is determined by the mechanical properties of the CPB [3]. The use of CPB not only makes it possible to effectively utilize solid wastes such as tailings and waste rock generated during mine production, but also makes clean production in mines possible. In a word, CPB has become the core technology for the pursuit of sustainable development and the construction of green mines in the mining industry. Related studies shows that the uniaxial compressive strength (UCS) of the CPB, as its core mechanical property, is not only affected by various factors such as slurry concentration, cement content and curing time, but also related to the aggregate gradation [4–7]. Packing density is the volume of solid particles per unit volume and is an important property used to describe aggregate gradation [8,9]. It not only reflects the caulking effect of the aggregate comprehensively, but also is an important characteristic parameter of the aggregate bulk system [10]. Since the volume of aggregate in the filling slurry generally accounts for more than 2/3 of the filling volume, the aggregate gradation becomes an important factor affecting the UCS [11–13].
In recent years, many scholars have done a lot of research on the aggregates gradation in CPB and the factors influencing the UCS. Firstly, the increase of stacking density will make the caulking effect between the aggregates more significant, and then make the aggregates in a tightly embedded locking state [14,15]. Secondly, the packing density is closely related to the gradation index, which shows a trend of increasing and then decreasing with the increase of gradation index [16,17]. Thirdly, through the mixed aggregate ratio test, it is found that when the waste rock content and tailings content is 7:3, the aggregate packing density [18–20]. In addition, UCS is also related to factors such as water-cement ratio, cohesion and curing temperature [21,22]. Moreover, the research of cementitious materials for infill mining is also an important research direction at present [23,24]. The above studies have fully demonstrated the correlation between UCS and many factors including aggregate grading, but the problem is that many studies only consider the effect of a single factor on UCS and the experimental volume is large and cumbersome. Therefore, it is of practical significance to construct an UCS prediction model of the CPB with the influencing factors such as aggregate gradation as input variables to reduce the test cost and guide the CPB scheme according to the engineering practice.
With the development of artificial intelligence, many scholars start to use machine learning to study optimization and prediction problems in engineering. Support vector machines (SVM), decision trees (DT) and regression analysis are used in research work in the fields of mechanics, environment and energy and have yielded excellent results [25–28]. In the field of fill mining, back propagation neural network (BP-ANN) has been widely used in recent years for UCS prediction and slurry ratio optimization due to their strong fitting ability [29–31]. However, the selection of initial weights and thresholds of the BP neural network have a significant effect on the prediction results. To overcome above problem, various swarm intelligence optimization algorithms are used to optimize the initial weights and thresholds of BP neural network. The use of particle swarm optimization (PSO) and genetic algorithm (GA) combined with BP neural network can achieve the prediction of the strength of downhole wet shotcrete and the intelligent selection of the proportion [32–36]. Although the above studies improve the prediction accuracy, the limitation is that the slow convergence rate and the tendency to overfit due to the error back propagation algorithm of BP neural network are not addressed. In addition, BP neural network requires high typicality of training samples, but it is difficult to obtain typical samples from practical engineering [37–41]. In summary, BP neural network is widely used in the practice of fill mining engineering but the disadvantages still exist.
Long short-term memory neural network (LSTM), as a new neural network model with excellent generalization ability and robustness, is currently less used in the field of fill mining. In this paper, a nickel mine in northwest China is used as the engineering background to explore the mixed aggregate gradation of waste rock and river sand, with slurry concentration, waste rock content and cement content as input variables and the UCS of CPB as output variable, and a long and short-term memory neural network as the framework for modeling. Finally, a high accuracy UCS prediction model with aggregate gradation characteristics is constructed. The study is not only important for understand the effects of other variables on the UCS of the CPB but also is a guidance to improve the CPB technology and construct the green mine to achieve sustainable development of mines.
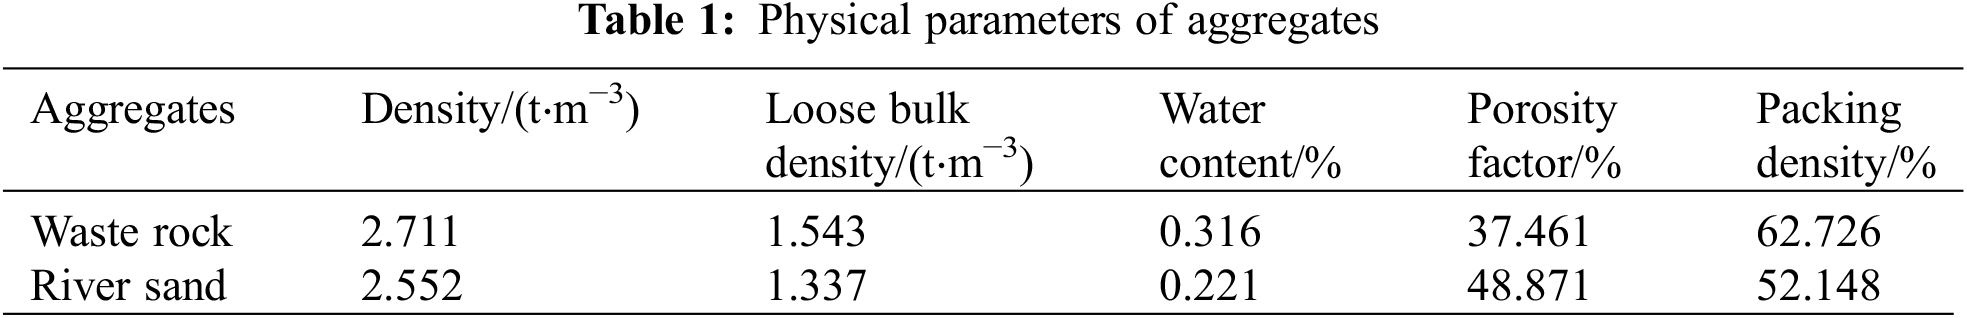
The waste rock is obtained from the underground roadway development and production of a nickel mine in Northwest China. The waste rock is pre-treated with a jaw crusher to obtain waste rock crushing aggregates with a maximum particle size of 12 mm. At this time, the waste rock aggregate meets the requirements of filling slurry using pipeline transportation and can be used as coarse aggregate. The physical parameters of the waste rock are shown in Table 1.
From Talbol gradation theory [42–44], it is known that the proportion of the total content of a sample with particle size less than or equal to satisfies the following equation:
In Eq. (1), P is the percent passage of the target aggregate particle size x (%); D is the maximum particle size (mm); and n is the Talbol gradation index. Talbol gradation index (n) is a scalar to describe the particle size of the material and the ideal value of n is 0.5. If n > 0.5, the coarse aggregate content is high; if n < 0.5, the coarse aggregate content is high.
The mathematical fitting of the particle size distribution of the crushed waste rock using an exponential-like function is shown in Fig. 1. The fitted Talbol gradation index is n = 0.63798, which is larger than the ideal gradation index of 0.5 [45–47]. This indicates that the waste rock has a high percentage of coarse aggregate, so fine aggregates need to be added to improve the gradation for preventing layered segregation under high water-cement ratio.
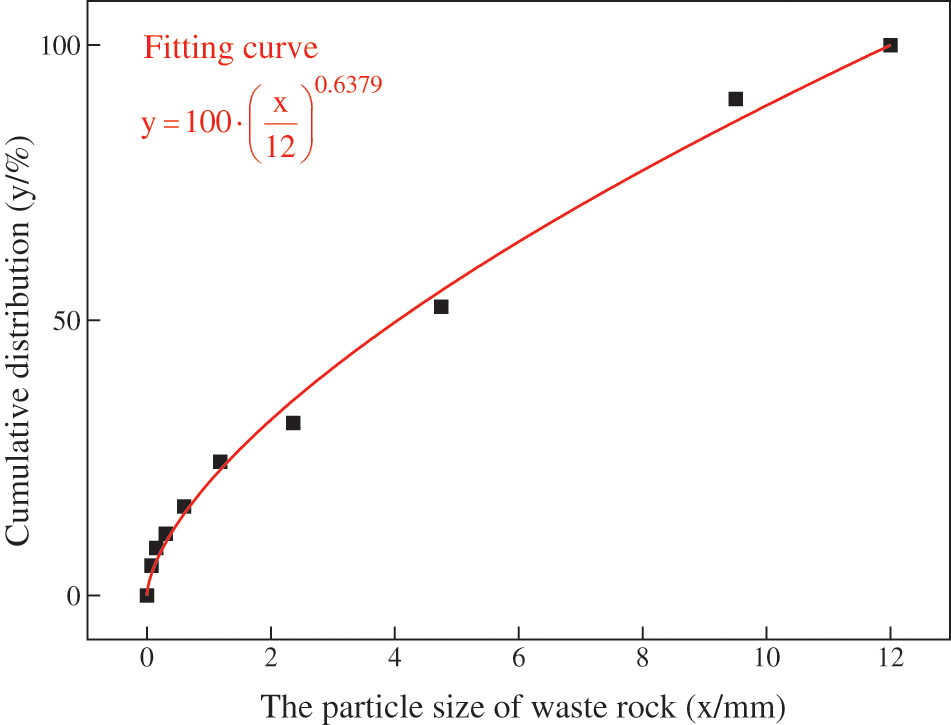
Figure 1: Particle size composition of waste rock
River sand comes from the river near the nickel mine, its chemical composition is mainly SiO2, which is an inert material with a maximum particle size of 0.95 mm, and can be used as fine aggregate for CPB. The physical parameters are shown in Table 1 and the chemical composition is shown in Table 2. The size distribution of river sand is mathematically fitted using an exponential-like function and the results are shown in Fig. 2. As can be seen from the Fig. 2, the fitted Talbol gradation index is n = 0.38167, which is within the reasonable range of the filling aggregate gradation index, but still less than the ideal gradation index of 0.5. This indicates that the fine particle size content is higher in the river sand, and coarse aggregates need to be added to improve the gradation to generate a skeletal structure to ensure the formation of the UCS [48].
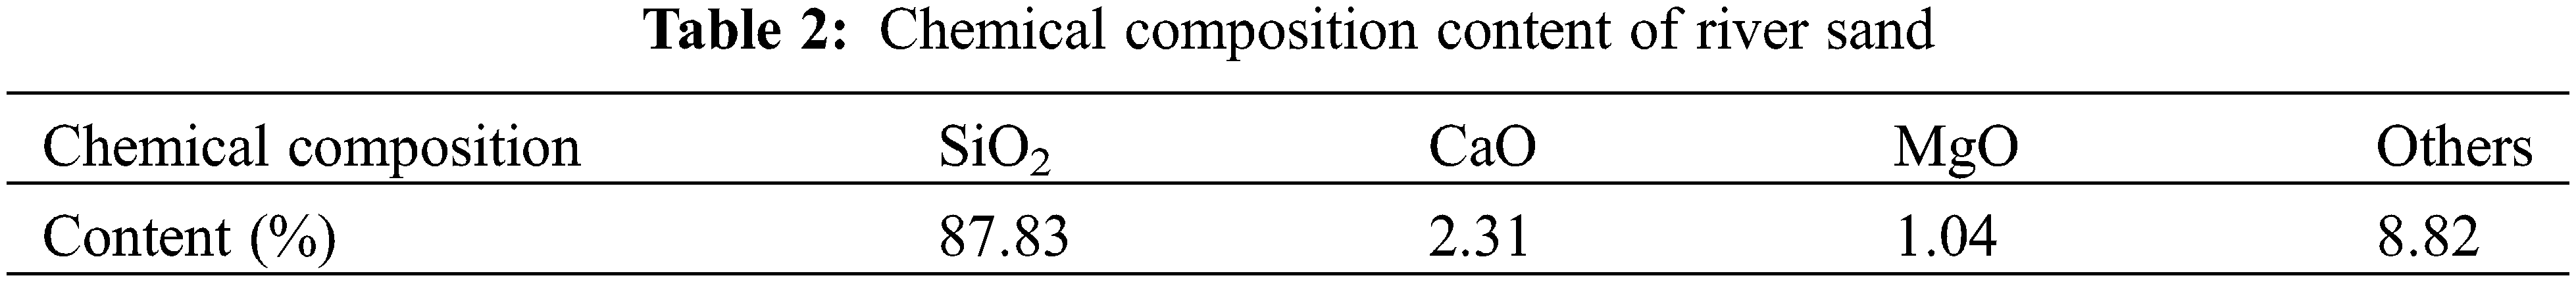
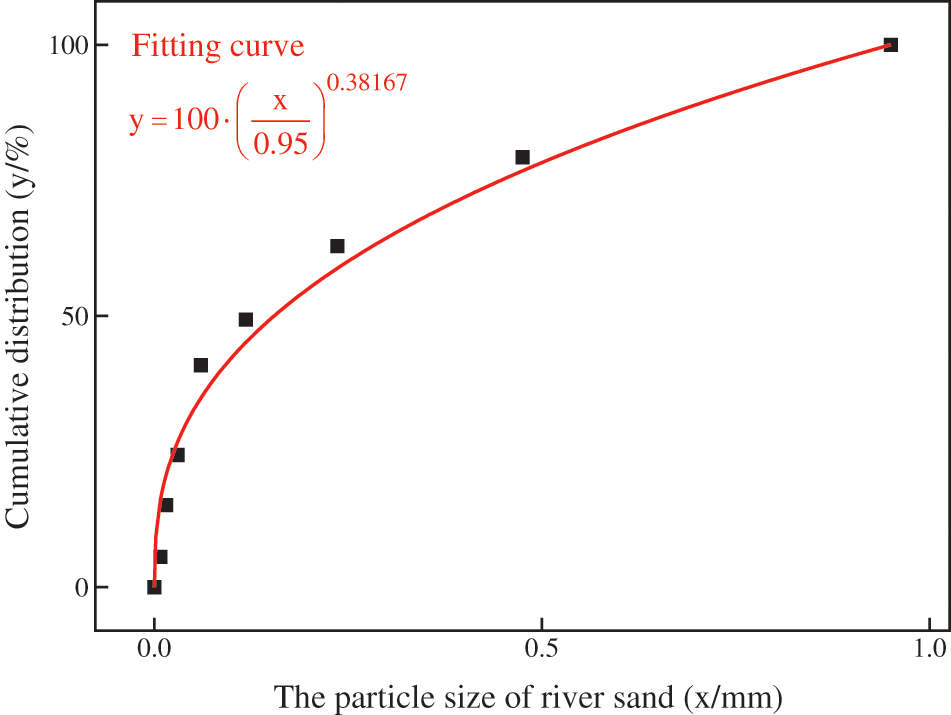
Figure 2: Particle size composition of river sands
3.1 Aggregate Packing Density Experiment
According to the analysis in Section 1, both waste rock and river sand cannot be used as CPB aggregate alone. The two aggregates need to be mixed to improve the gradation and thus increase the packing density to reduce the cement consumption. Therefore, before conducting the filling slurry proportioning experiments, it is necessary to conduct the packing density experiments of both aggregates to determine the mixing ratio of waste rock and river sand.
In order to maximize the UCS of CPB under the condition of same slurry concentration and cement content, waste rock and river sand are mixed in different ratios (1:9–9:1). After measuring the density of mixed aggregates and loose density, the packing density of the mixture can be calculated by substituting the following equation:
In Eq. (2),
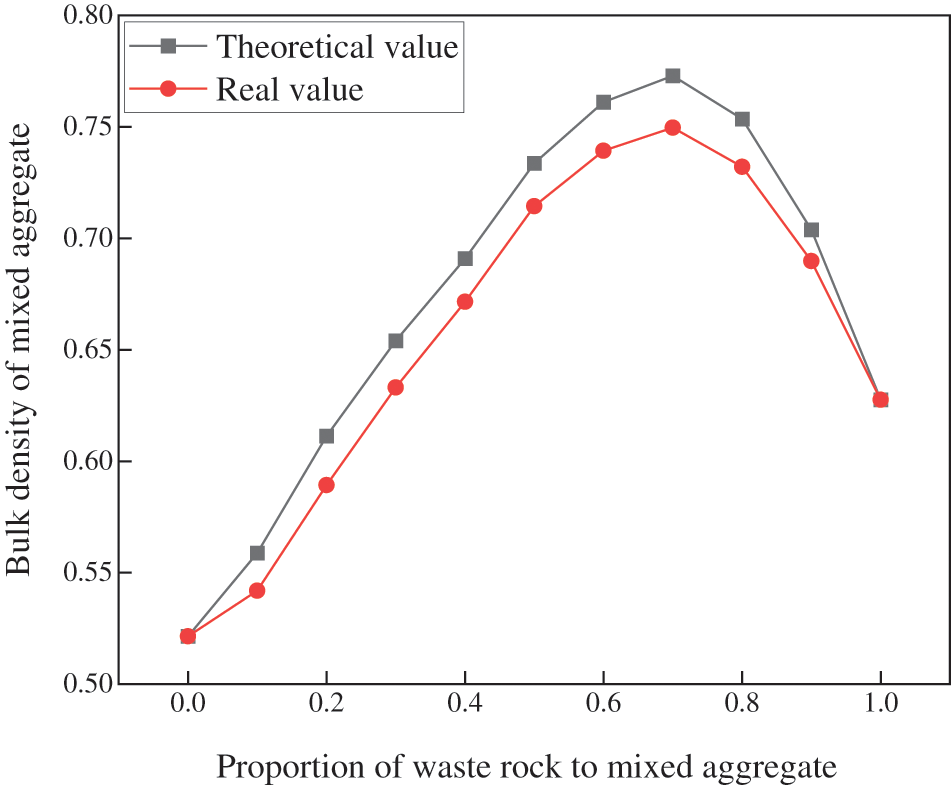
Figure 3: Packing density of aggregate at different waste rock contents
From Fig. 3, it can be seen that the packing density and the proportion of waste rock (x) in the mixture show a simultaneous increasing trend and the actual value is basically the same as the theoretical value when x < 0.5. In this case, the waste rock as coarse aggregate can form a skeleton structure and the river sand as fine aggregate can be used to fill the gap between aggregates. When x = 0.7, the actual and theoretical values of packing density both reach the maximum. This indicates that the river sand just fills gaps in the skeleton formed by the waste rock. When x > 0.7, the packing density decreases and the error between the actual value and the theoretical value increases significantly. This indicates that when the coarse aggregate gradually increases, the fine aggregate cannot effectively fill the gaps between coarse aggregates due to its low content. At this point the coarse aggregate particles in the mix produce a wall effect causing the fine aggregate to fail to fill the gap ideally, ultimately leading to this trend and error.
According to the above analysis, it can be seen that when x < 0.7, the packing density of mixed aggregates is in the strength growth period. When x = 0.7, the packing density of mixed aggregates is maximum. When x > 0.7, the packing density of mixed aggregates is in the strength decline period. Therefore, three options of 5:5, 6:4 and 7:3 ratio of waste rock to river sand were selected for filling slurry proportional experiments.
3.2 Filling Slurry Proportioning and UCS Experiment
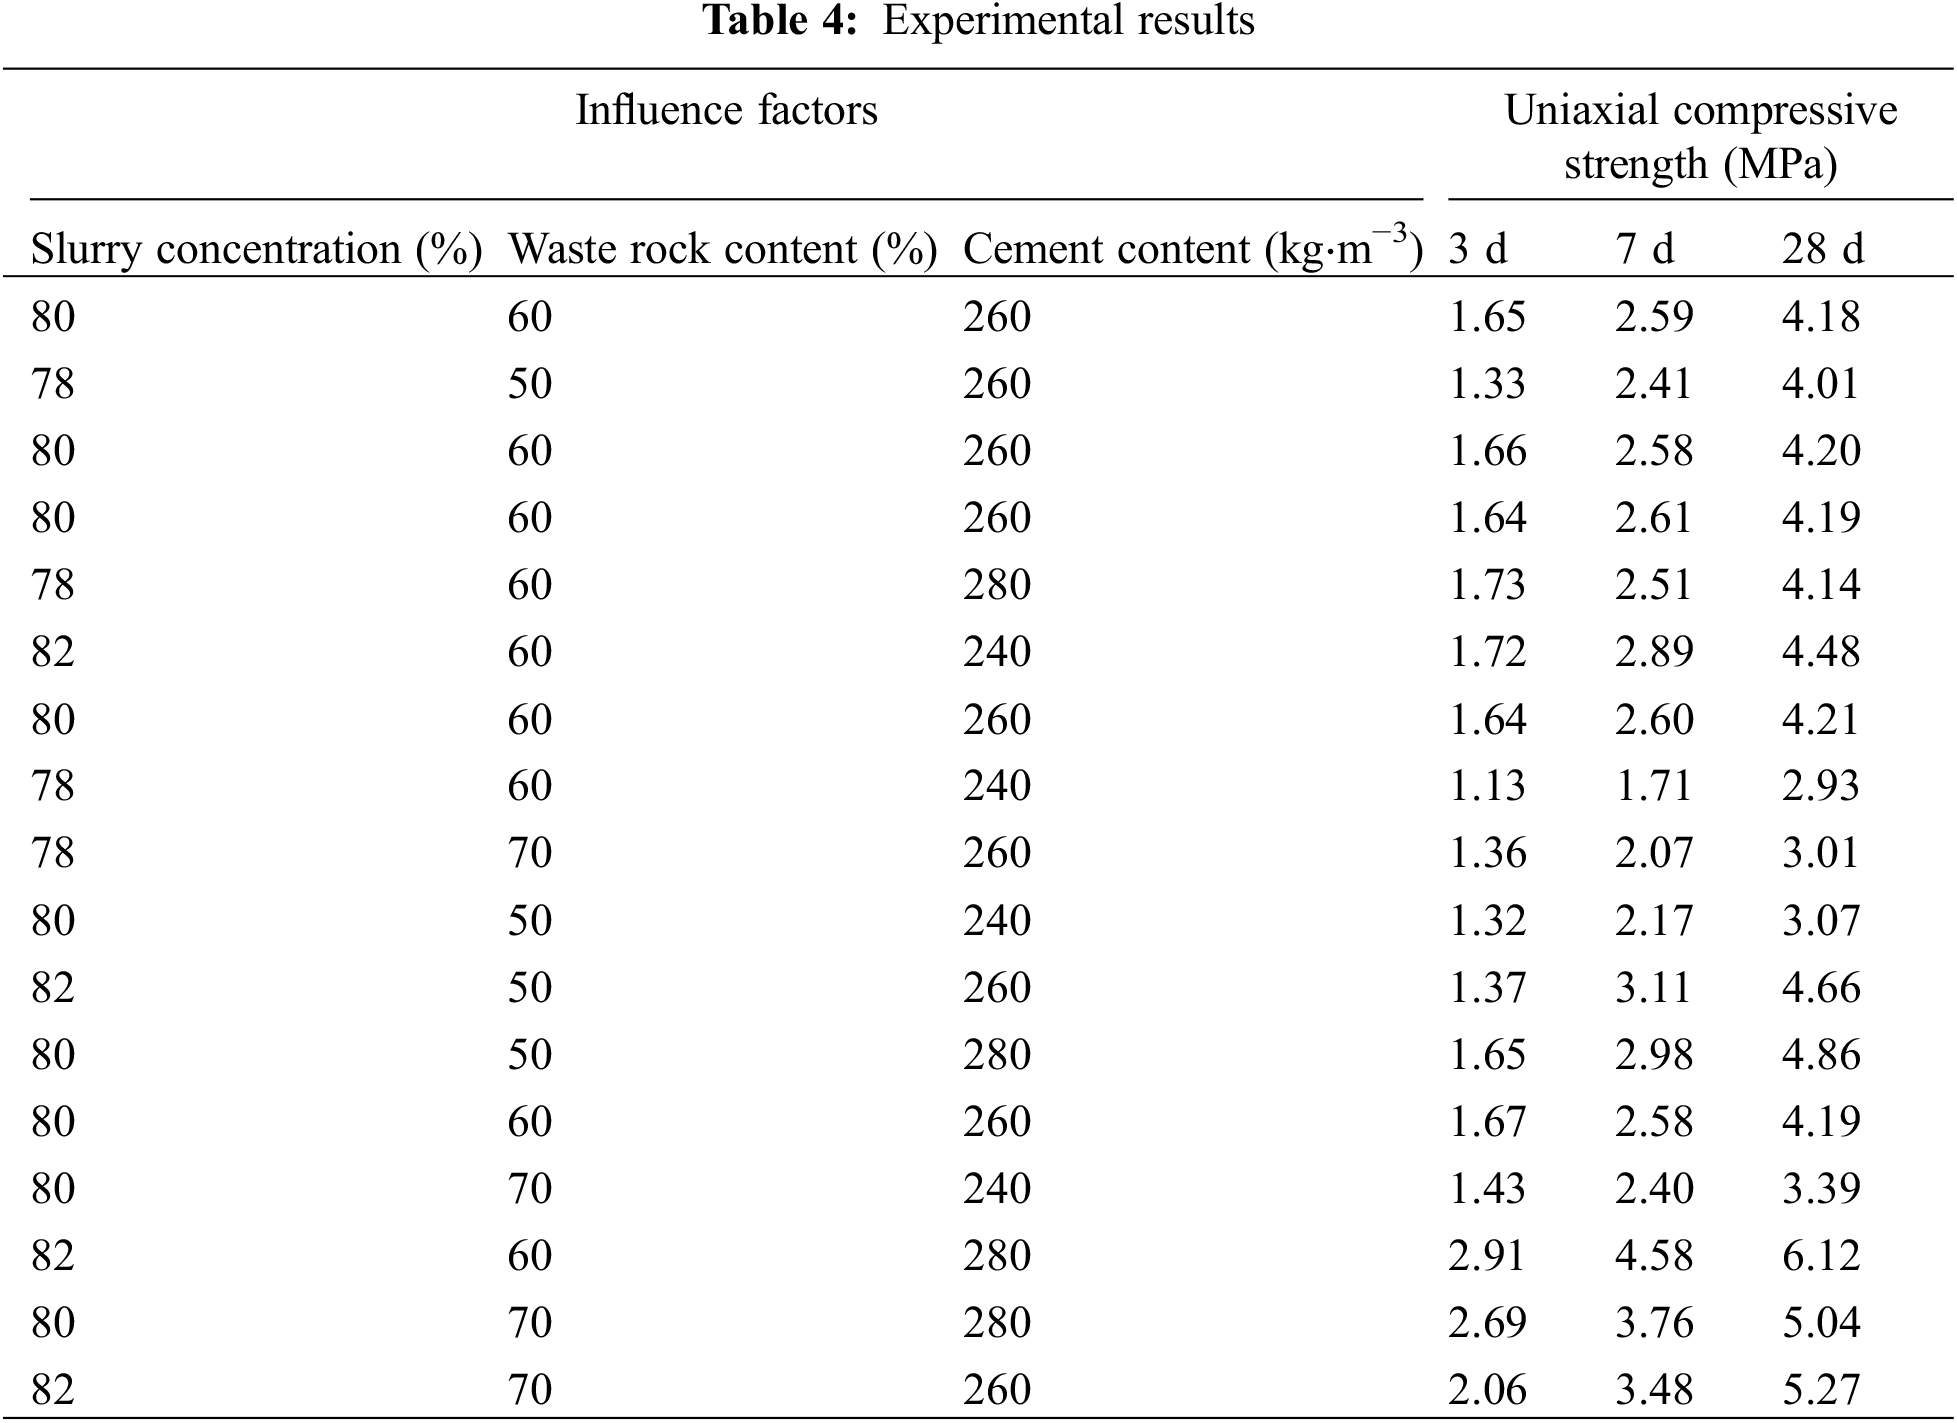
Response surface methodology (RSM) is a method to optimize the experimental results by using a reasonable experimental design, which can reduce experiment volume and improve efficiency and accuracy of experiments [49–51]. In this paper, the Box-Behnken (BBD) design in RSM is used to perform the experimental design and response surface calculation. The three affecting factors of slurry concentration (X1), waste rock content (X2) and cement content (X3) are defined as independent variables, and the UCS of the CPB at 3 d, 7 d and 28 d are defined as response values. The waste rock content is set to 50%, 60% and 70% according to the study in Section 2.1. The slurry concentration and cement content are set at 78%, 80%, 82% and 240, 260, 280 kg⋅m−3, respectively. Then, the prepared slurry is poured into a standard triplex specimen mold of size 70.7 cm × 70.7 cm × 70.7 cm and cured for 24 h at room temperature. Finally, the cured specimens are demolded and placed in a curing phase at a curing temperature of 20°C and a relative humidity of 95% for curing. Both experimental designs are derived from previous research results and the UCS and the flowability of slurry meet the engineering requirements [52–54]. The RSM-BBD experimental factors and levels are shown in Table 3 and the experimental flow is shown in Fig. 4. The experimental results are shown in Table 4.
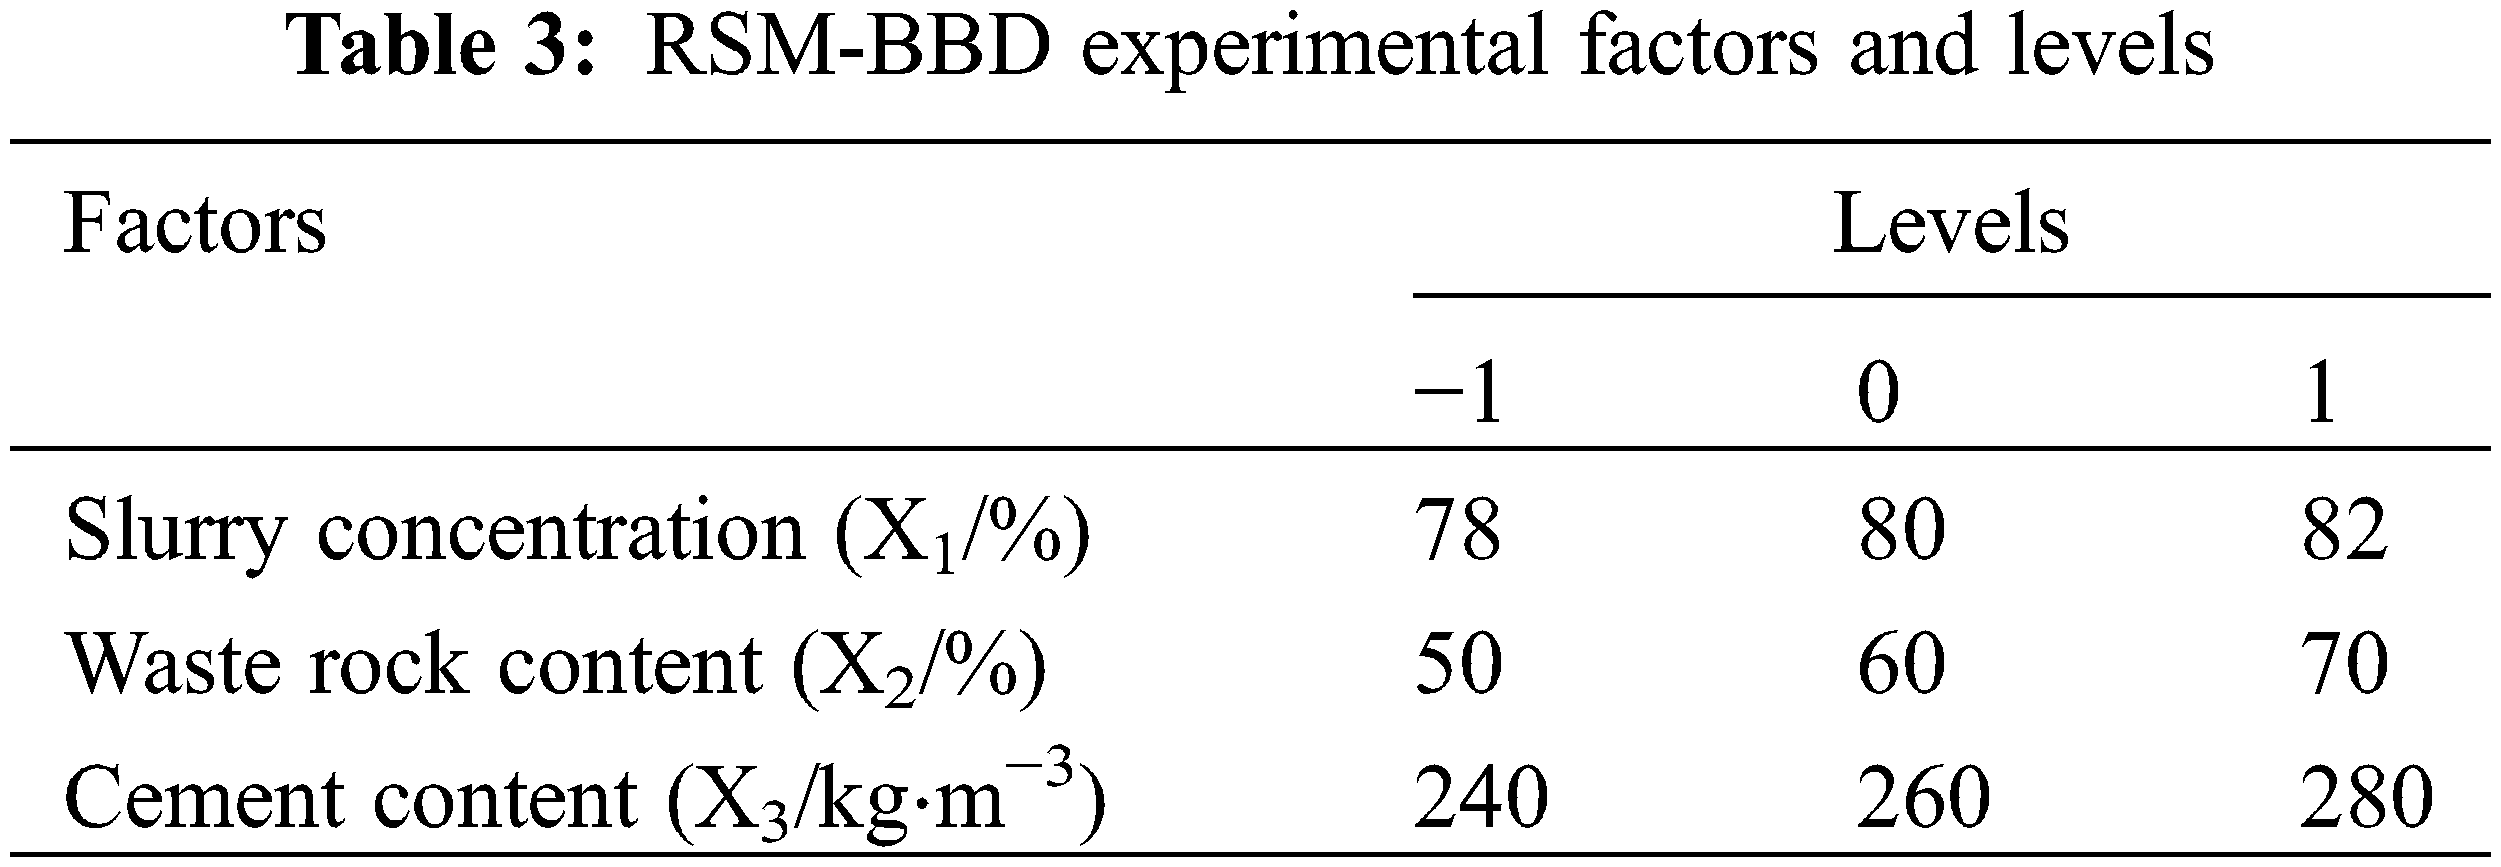
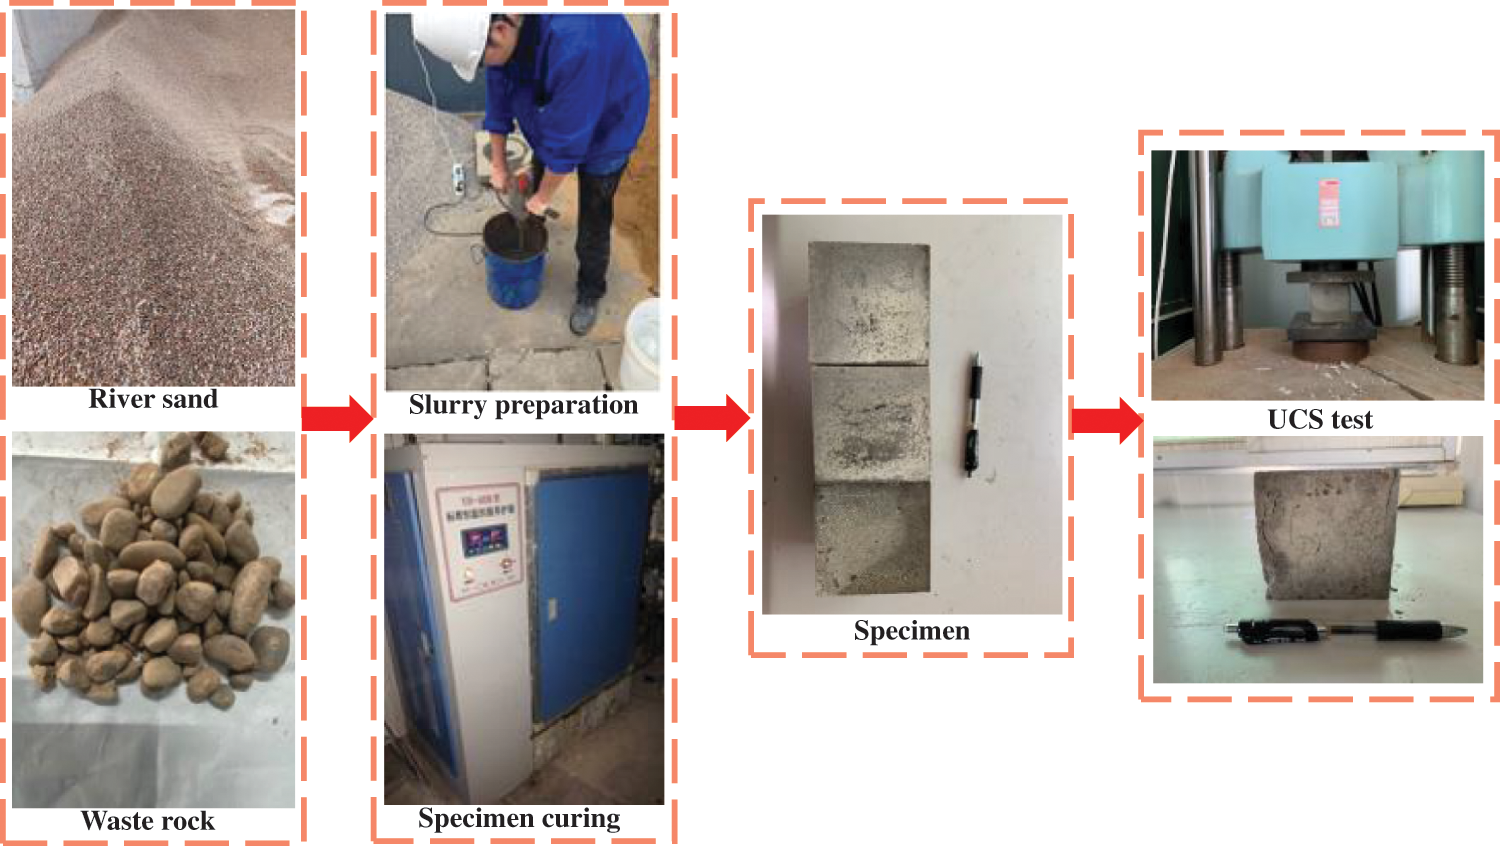
Figure 4: Experimental flow
4.1 Long Short-Term Memory Neural Network
The long short-term memory neural network (LSTM) is a modified recurrent neural network (RNN) proposed by Hochreiter and Schmidhuber in 1997 [55,56]. Compared with the traditional neural network, LSTM adds the memory cell ct with gating mechanism as the core for storing the past data information [56]. This optimization solves the problem of gradient disappearance during back propagation so that the final output significantly reduces the possibility of overfitting. The gating mechanism of each cyclic unit in the LSTM network consists of 3 parts: input gate, output gate and forget gate. Input gate is used to control data input, output gate is used to control data output and forget gate is used to control the filtering of historical data information from memory cell [57]. The recurrent cell structure of the LSTM network is shown in Fig. 5. Due to the limited space, the relevant mathematical derivation equations of LSTM are not described. Interested readers can read the above references [55–57] for detailed steps.
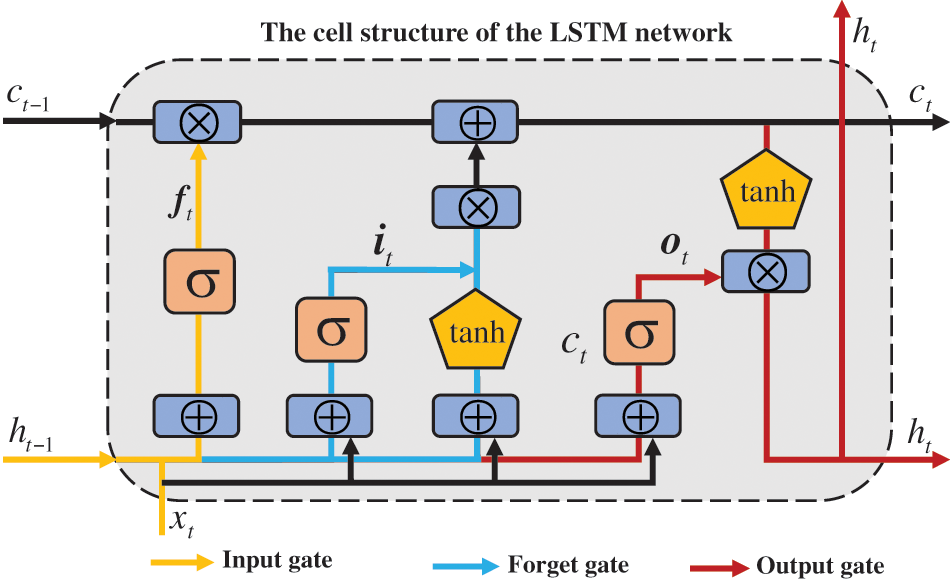
Figure 5: The network structure of cell structure of LSTM
4.2 Optimization of Parameters for LSTM
Max iterations and hidden layer nodes have a significant effect on the accuracy of the LSTM, so the above 2 parameters need to be adjusted in combination with the experimental data to obtain the optimal LSTM model suitable for this study.
After normalizing the experimental data, 11 samples are randomly selected as the validation set, and the remaining 40 samples as the training set. To solve the gradient disappearance, the Adam algorithm is used for LSTM and the error is calculated using the mean average absolute error (MAE). MAE is calculated as follows:
In Eq. (4), yi is the actual value and
The training set is substituted into the LSTM for training and the training process is tracked. As shown in Fig. 6, the MAE of the actual and predicted values of the UCS for training set shows a decreasing trend. The loss of the training set is high when the training count interval is (1, 115). The loss is stable around 0.0019 for the training number interval (115, 200). This indicates that the model tends to converge at this point. Based on the above results, the threshold of the maximum iterations of the LSTM network is set to 115 to improve the computational efficiency and ensure the generalization of the model.
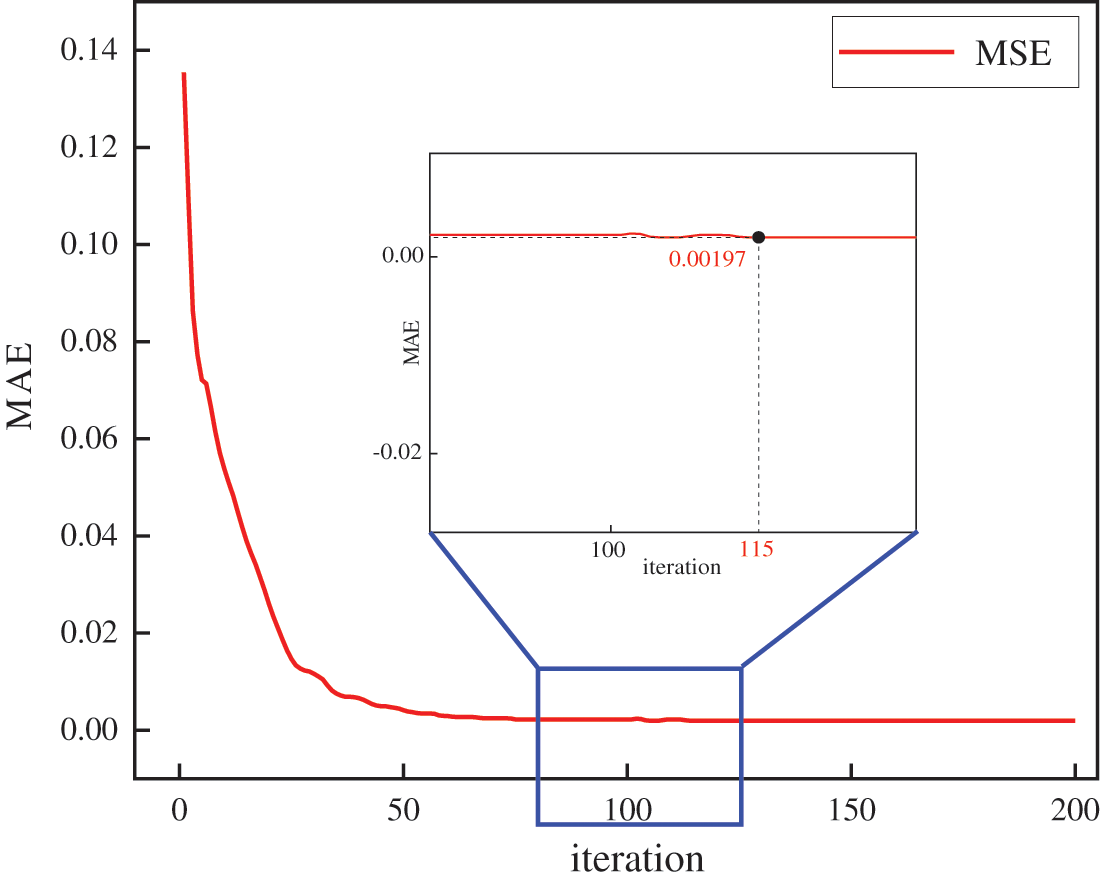
Figure 6: The MAE of training set in iterating
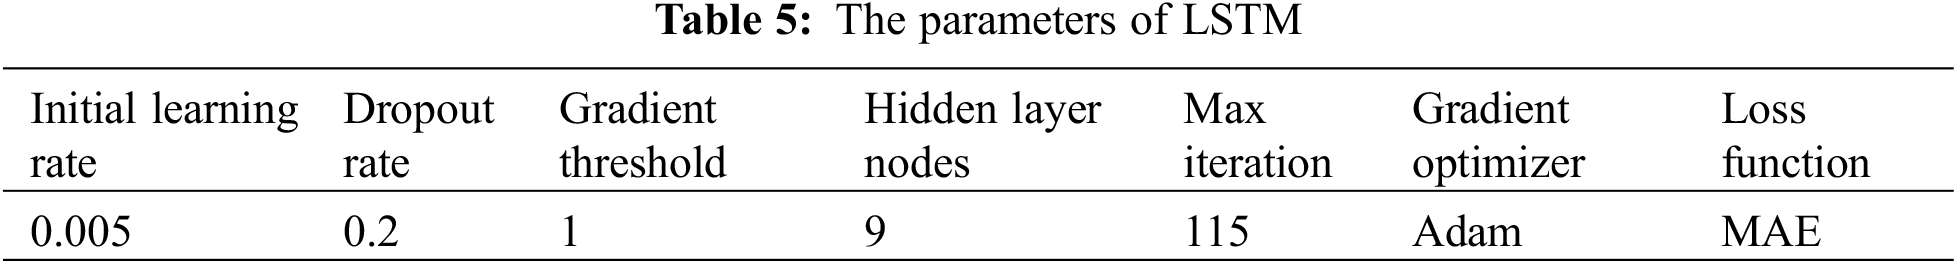
In order to reduce the impact of overfitting on model prediction accuracy, Dropout regularization mechanism is added to the LSTM based on related research results [58–62]. The dropping rate, gradient threshold and initial learning rate are set to 0.2, 1 and 0.005, respectively. In addition, hidden layer nodes are also an important factor that affects the final prediction result of LSTM. Usually hidden layer nodes are determined using the following empirical equation:
In Eq. (5), m is the number of input variables, n is the number of output variables and l is the adjustable constant on the interval (1, 10).
To determine the optimal hidden layer node, it is set to 10 cases from 3 to 12 using Eq. (5). Substitute the above results into the LSTM and calculate the root mean square error (RMSE) of the actual and predicted values of the UCS in the training set under different cases. The equation for calculating RMSE is as follows.
From Fig. 7, it can be seen that when the hidden layer nodes is 9, the RMSE of the training set data obtains the minimum value of 0.03771. Therefore, the hidden layer nodes of the LSTM is set to 9. The finalized LSTM network parameters are shown in Table 5.
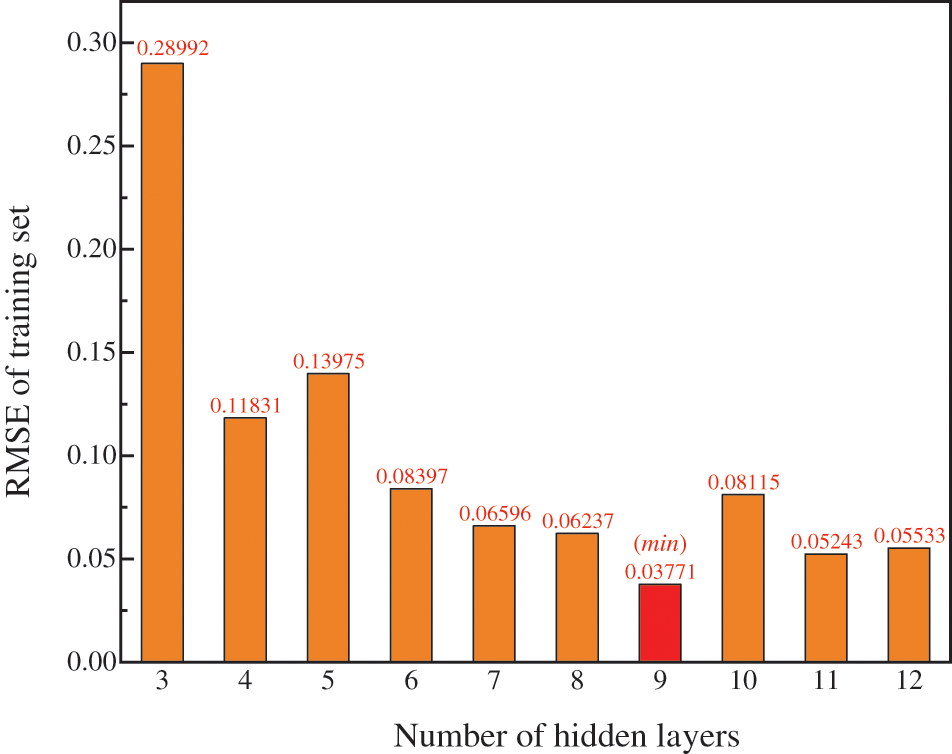
Figure 7: The RMSE of training set in different hidden layer nodes
4.3 Evaluation Method of Model
To evaluate the model prediction accuracy, RMSE, the coefficient of determination (R2) and variance account for (VAF) are used as evaluation indicators. R2 and VAF are calculated as follows [63].
In Eqs. (7) and (8), yi and f (xi) are the actual and predicted values of the sample, respectively.
5.1 Results and Analysis of LSTM
A comparison of the predicted and actual values of the training set and the validation set is shown in Fig. 8. From Figs. 8a and 8b, it can be seen that the prediction accuracy of the training set samples is extremely high with R2 = 0.9999, RMSE = 0.0034 and VAF = 99.999. This indicates that the LSTM is fully trained. From Figs. 8c and 8d, it can be seen that the validation set has R2 = 0.9915, RMSE = 0.1966 and VAF = 98.298. This indicates that the LSTM can accurately solve the nonlinear relationship between each affecting factor and the UCS of CPB with high prediction accuracy.
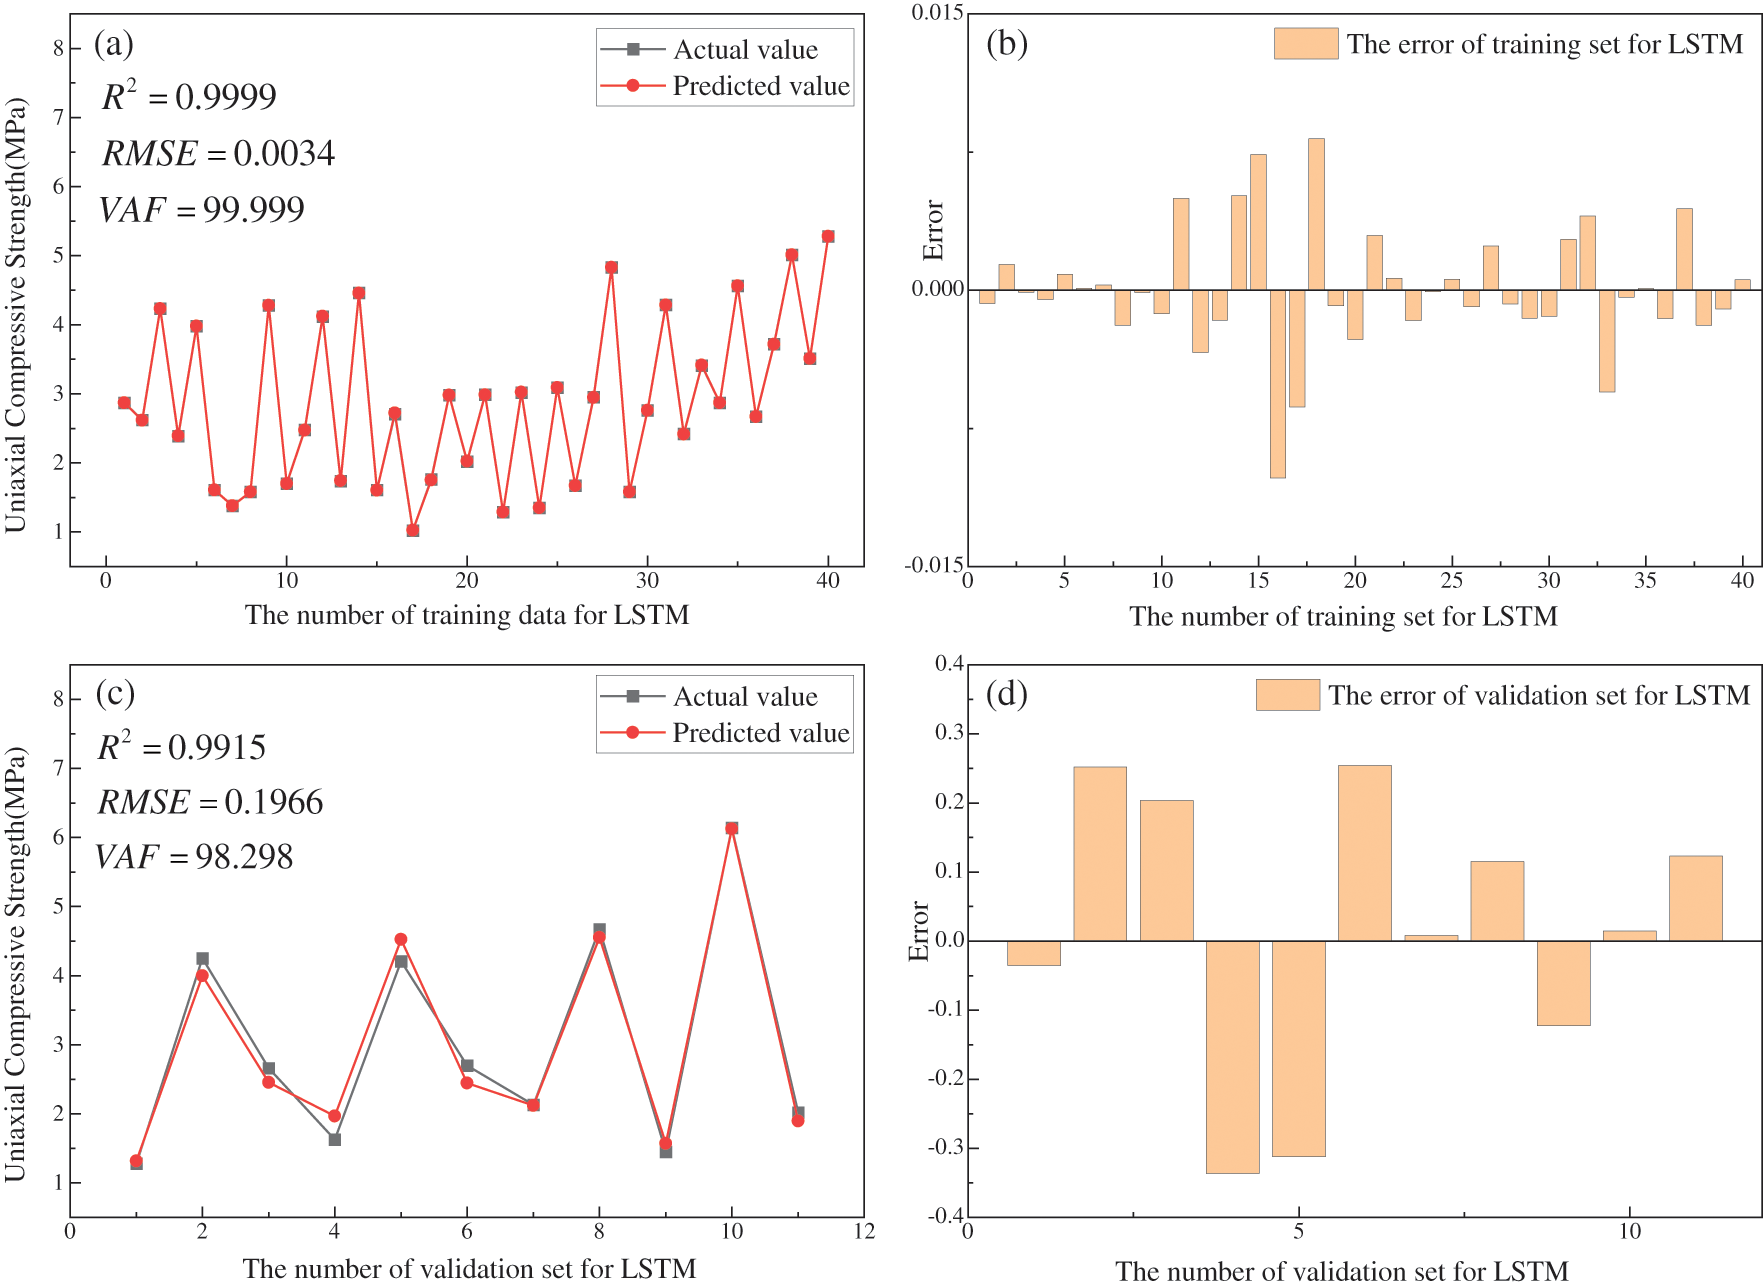
Figure 8: LSTM Model prediction performance
5.2 Results and Analysis of Models Used for Comparison
To evaluate the effectiveness of LSTM in UCS prediction, three neural networks, BP-ANN, Extreme Learning Machine (ELM) and Radial Basis Function Neural Network (RBF-ANN) [64–67], are selected to conduct simulation experiments and compare the prediction results with LSTM under the same data set and the same hidden layer nodes and maximum iterations. Numbers 1–40 are the training set data and 41–51 are the validation set data. The prediction results of LSTM are shown in Fig. 9. From Figs. 9a and 9b, the R2 = 0.9973, RMSE = 0.0914 and VAF = 99.73 for the predicted and actual values of LSTM. From Figs. 9c and 9d, it can be seen that the errors between the predicted and actual values of LSTM basically obey the normal distribution N (0.00325, 0.0922).
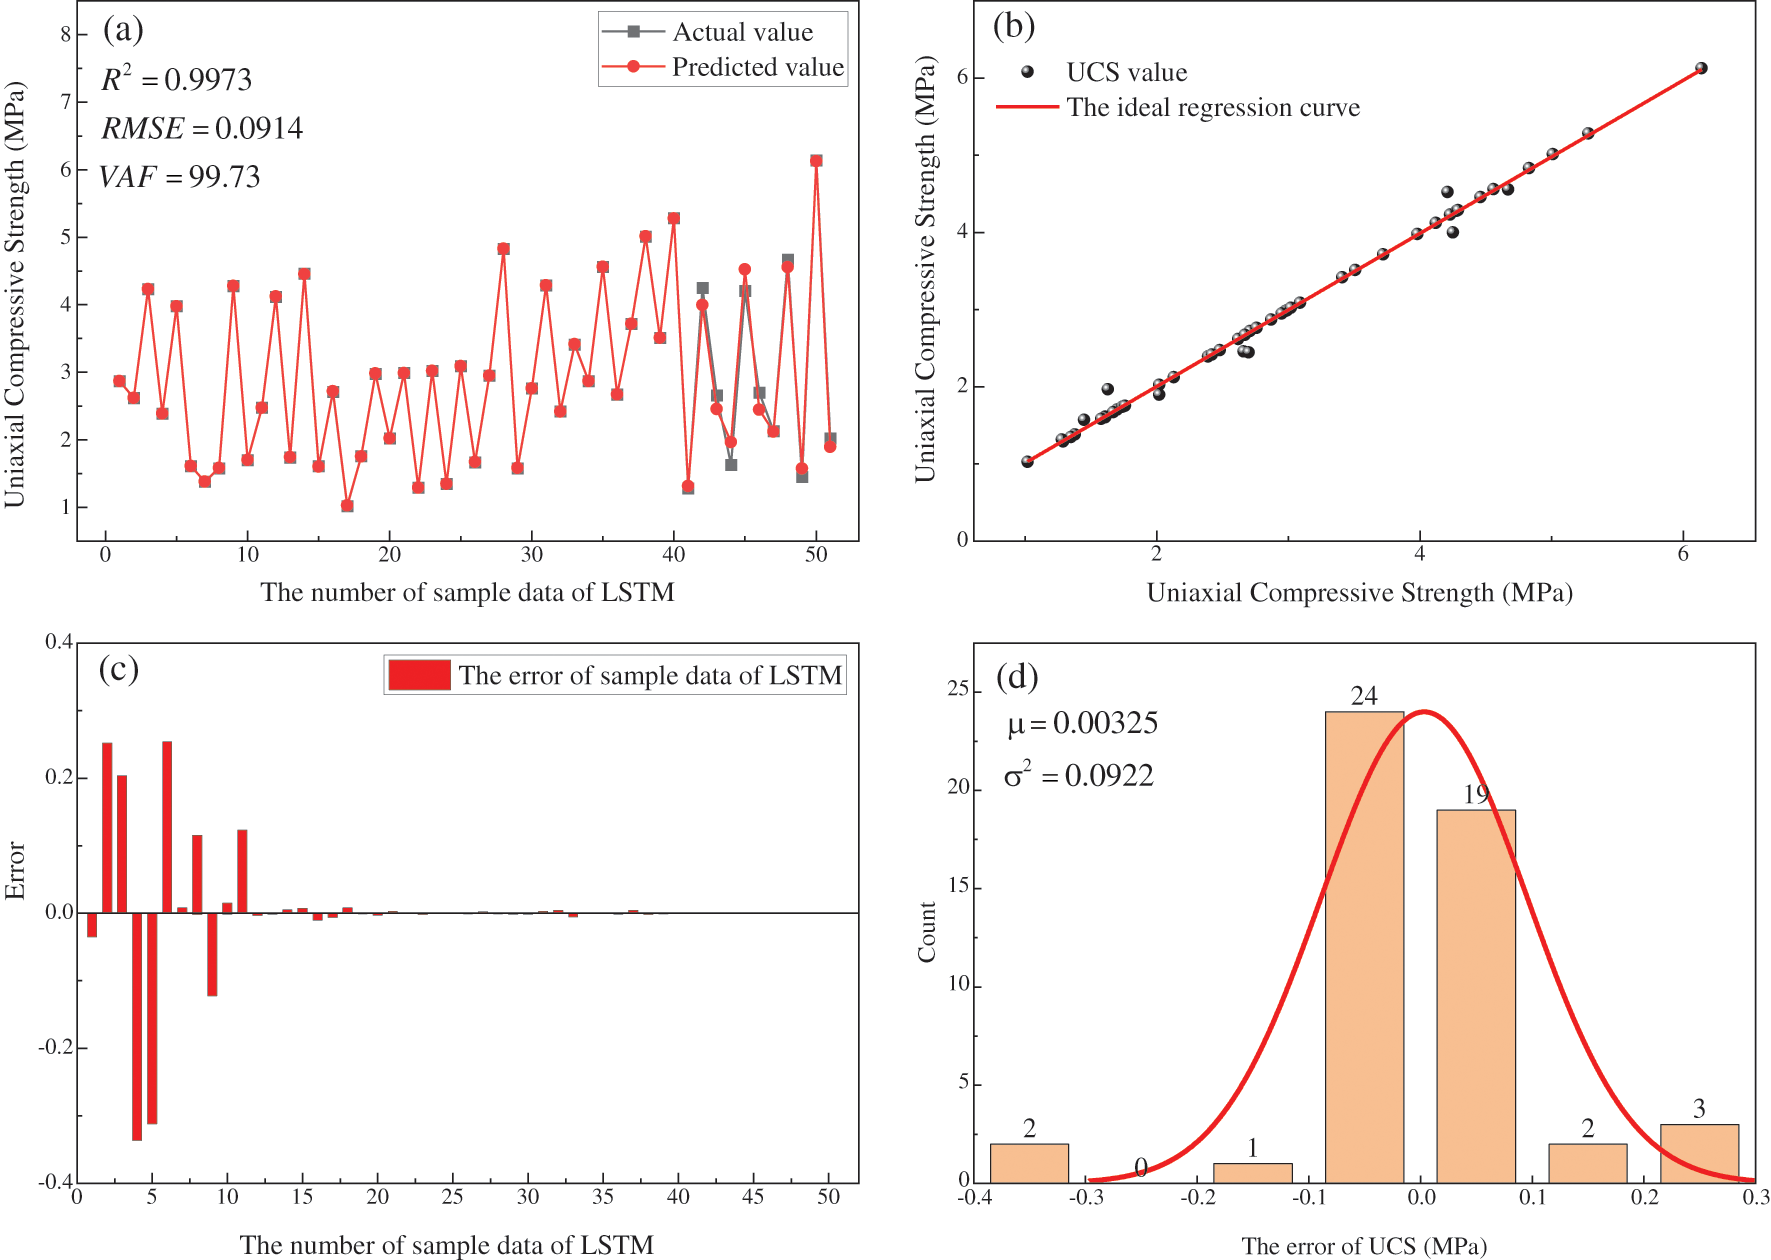
Figure 9: The predicted result of LSTM
The prediction results of RBF are shown in Fig. 10. From Figs. 10a and 10b, the R2 = 0.9884, RMSE = 0.1933 and VAF = 97.68 for the predicted and actual values of RBF-ANN. From Figs. 10c and 10d, it can be seen that the errors between the predicted and actual values of RBF-ANN basically obey the normal distribution N (−0.04132, 0.19071). The prediction results of ELM are shown in Fig. 11. From Figs. 11a and 11b, the R2 = 0.9507, RMSE = 0.3849 and VAF = 90.376 for the predicted and actual values of ELM. From Figs. 11c and 11d, it can be seen that the errors between the predicted and actual values of ELM basically obey the normal distribution N (−0.00461, 0.38875). The prediction results of BP-ANN are shown in Fig. 12. From Figs. 12a and 12b, the R2 = 0.9503, RMSE = 0.4048 and VAF = 89.376 for the predicted and actual values of BP-ANN. From Figs. 12c and 12d, it can be seen that the errors between the predicted and actual values of BP-ANN basically obey the normal distribution N (−0.01621, 0.40846).
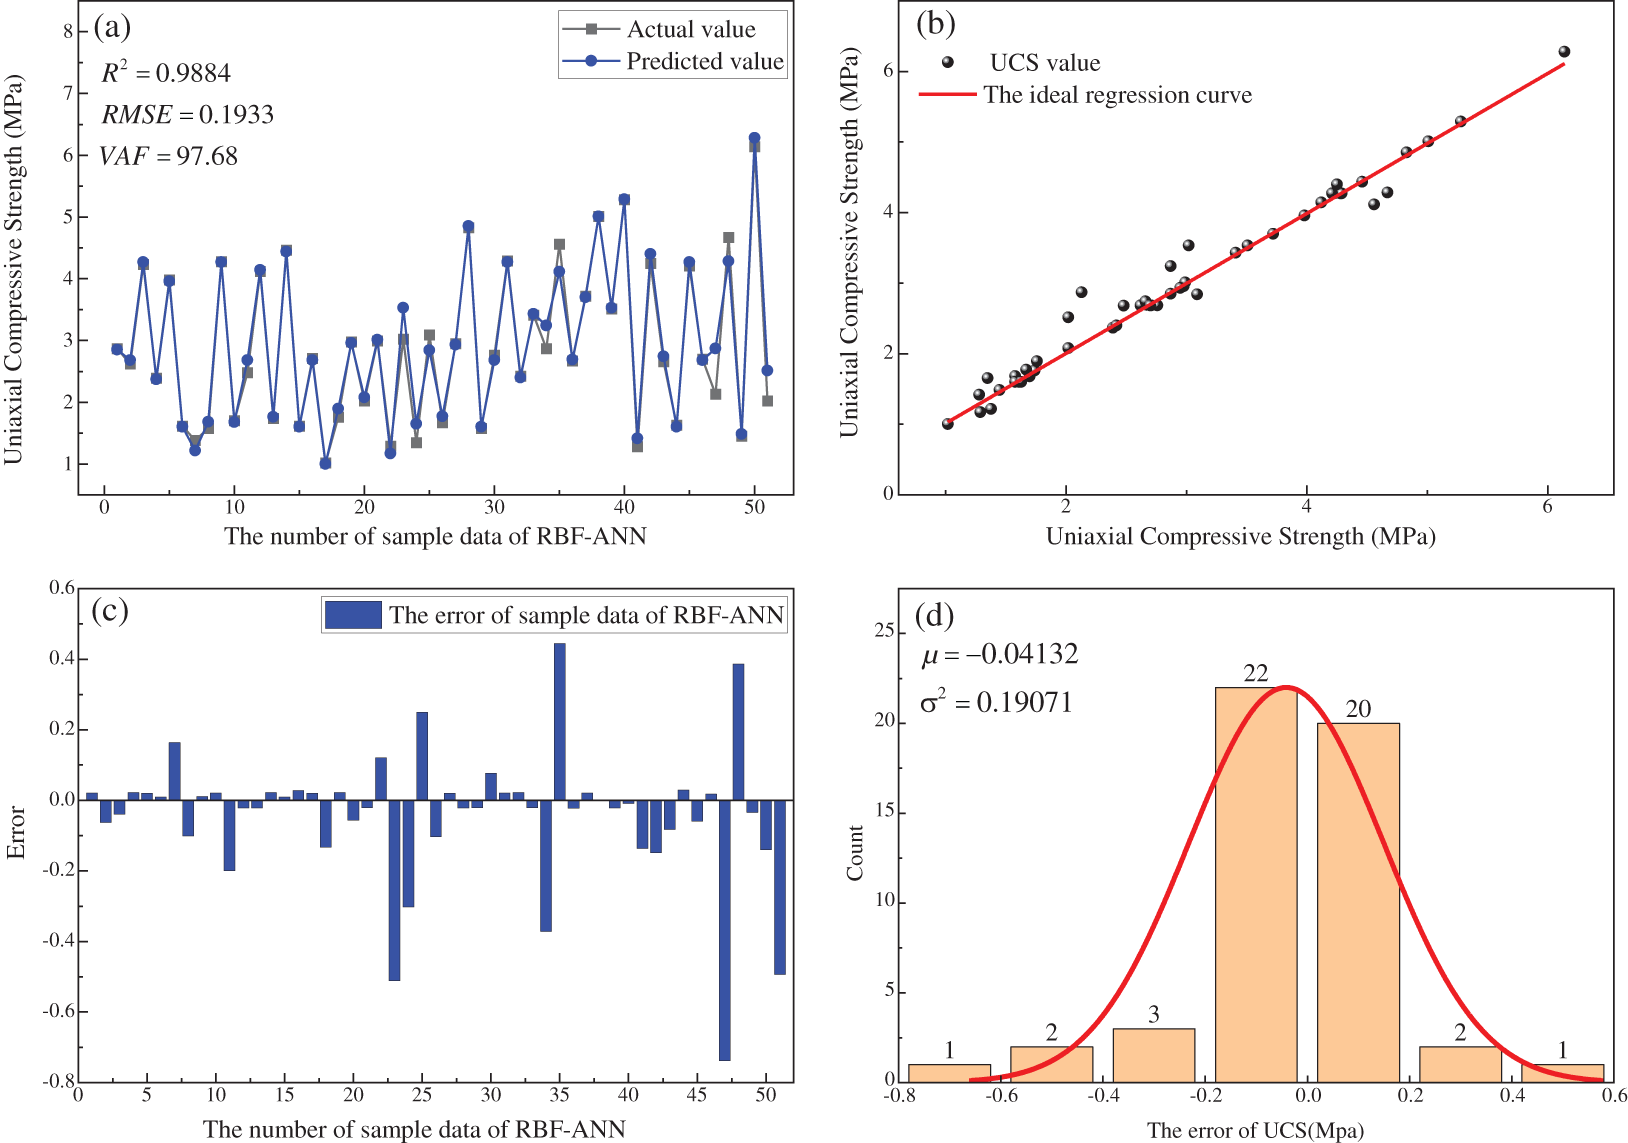
Figure 10: The predicted result of RBF-ANN
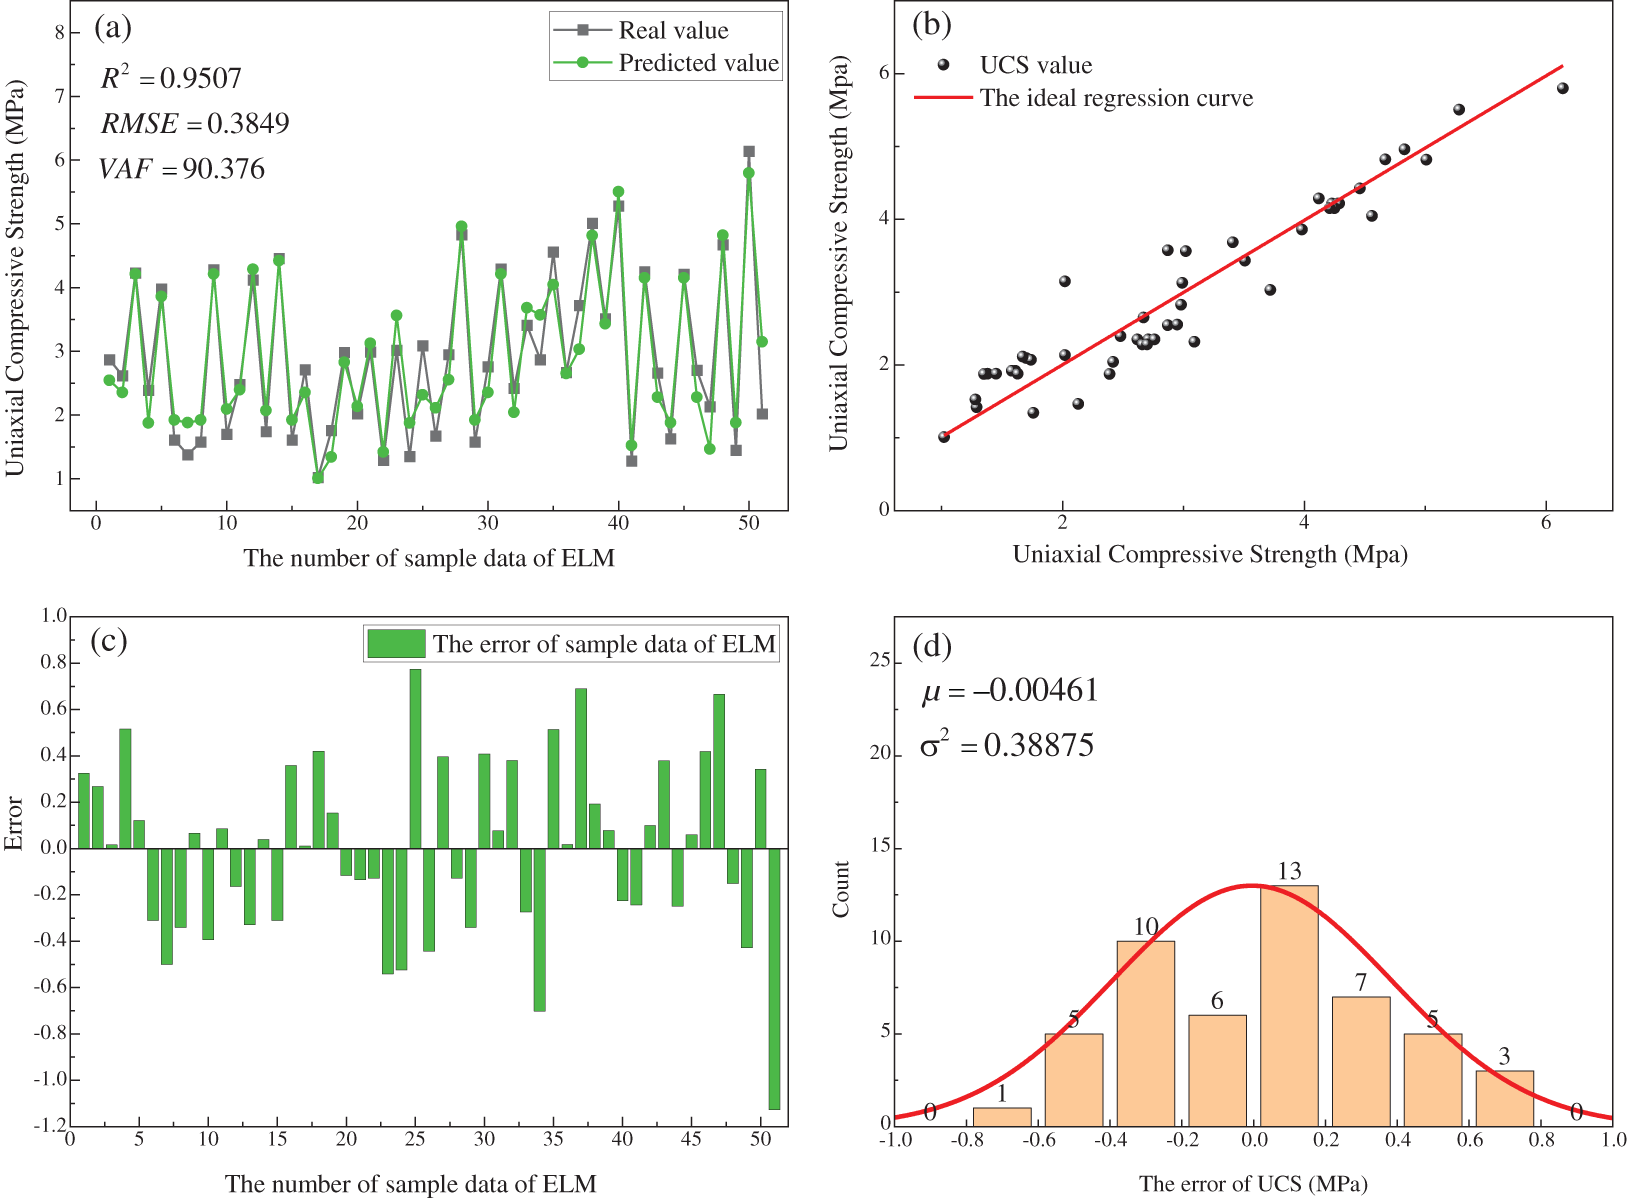
Figure 11: The predicted result of ELM
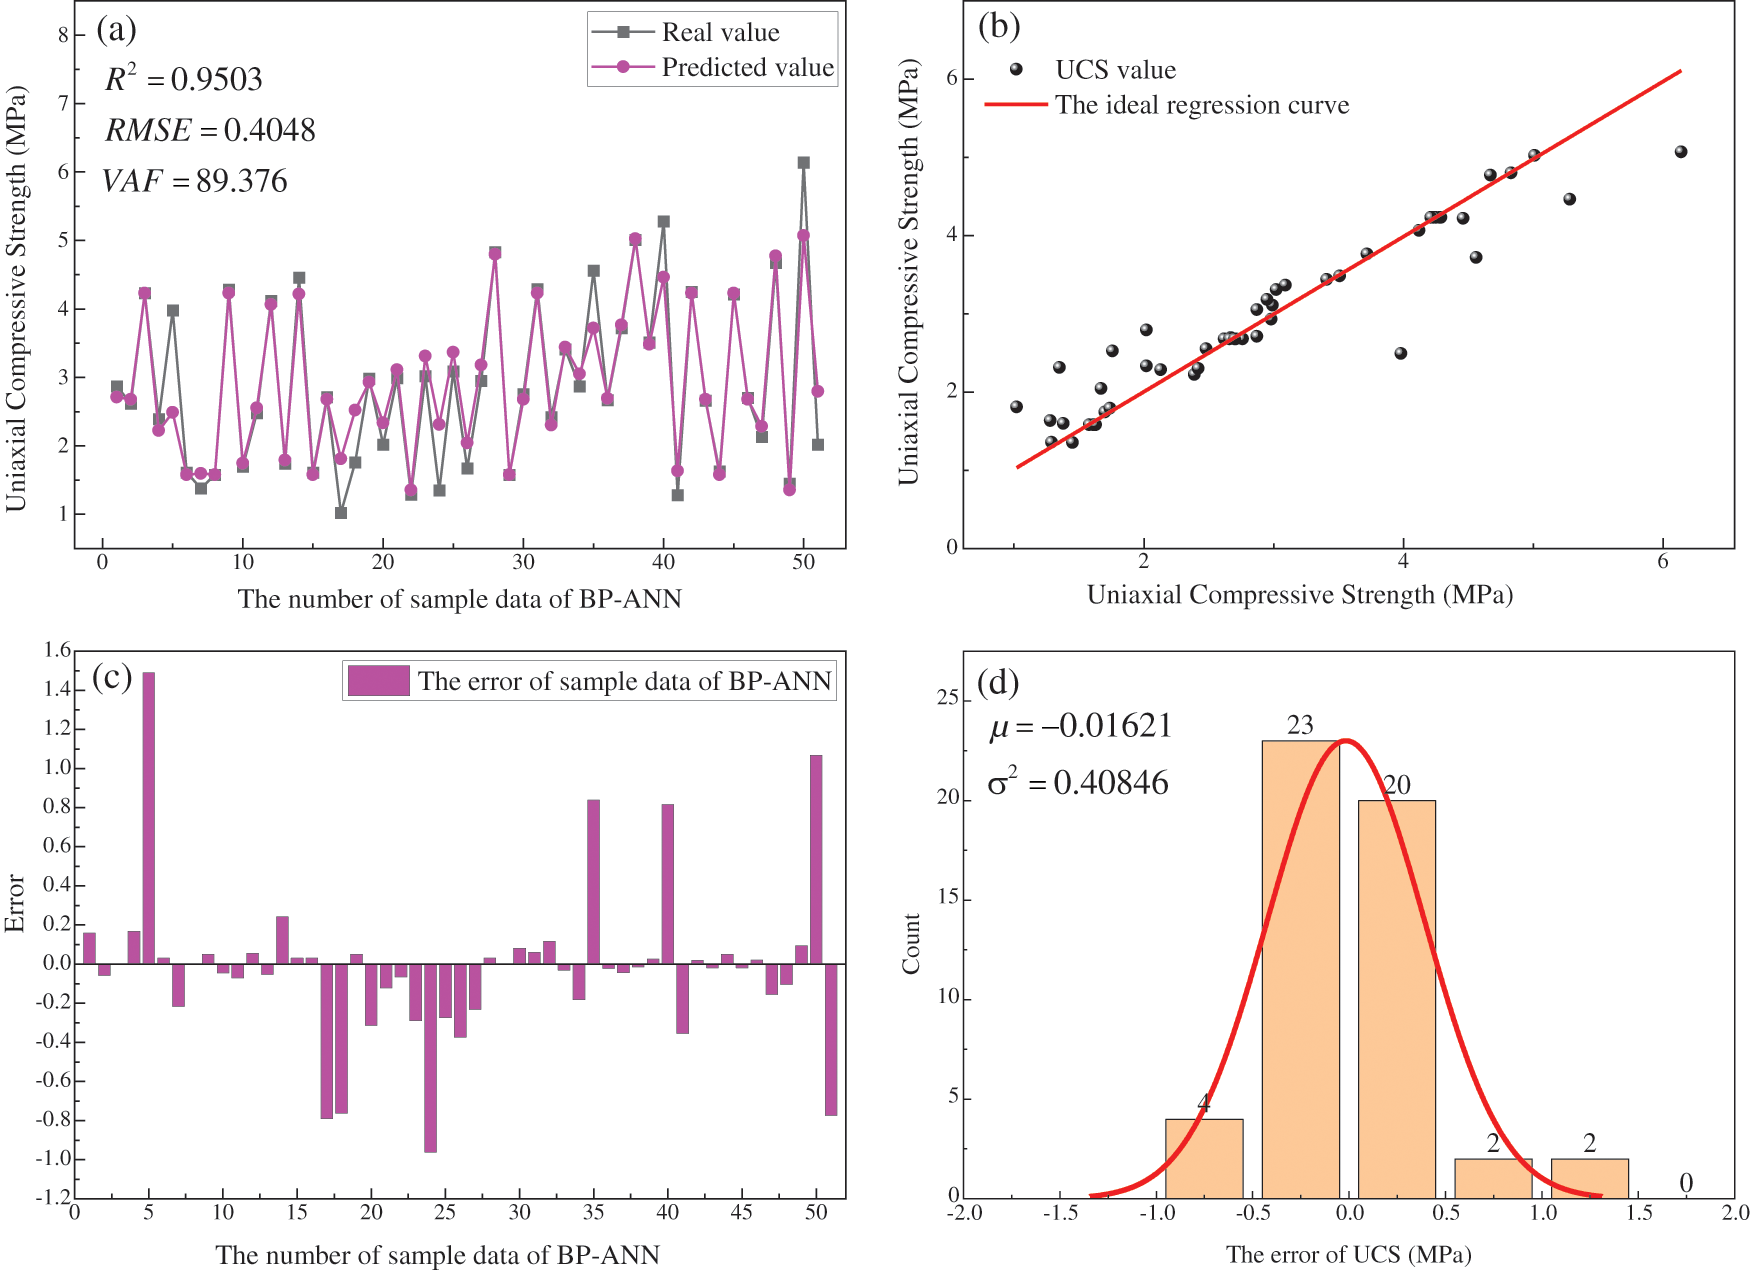
Figure 12: The predicted result of BP-ANN
Compared with RBF-ANN, ELM and BP-ANN, the RMSE of the prediction results of LSTM decreased by 52.72%, 76.25% and 77.42%, R2 improved by 0.9%, 4.9% and 4.95% and VAF improved by 2.09%, 10.35% and 11.58%, respectively. The standard deviation (SD), correlation coefficient and RMSE of the predicted and actual values of the four models are calculated and plotted as Taylor diagram for performance comparison in Fig. 13 [68]. In Taylor diagrams, the closer the model is to the ideal point, the better the prediction performance. According to Fig. 14, the LSTM is the optimal model in this paper. Combined with previous results about the application of machine learning in CPB [1,2,11,29,30,32,33], the LSTM model has improved in generalizability and computational accuracy by different magnitudes. In short, the introduction of LSTM provides a new tool for in-depth study of CPB and has heuristic implications for future in-depth studies.
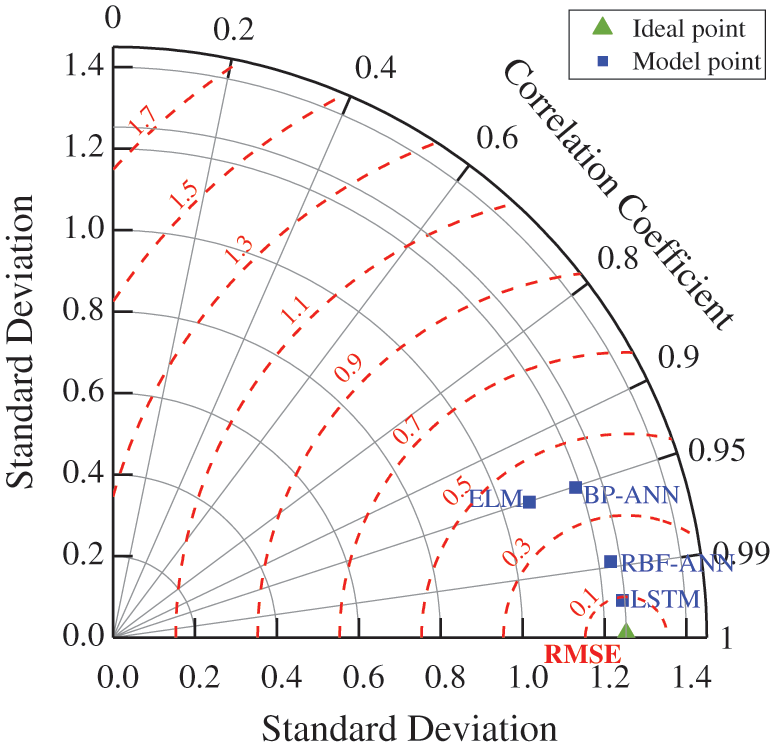
Figure 13: The results of evolution index from different model in Taylor Diagram
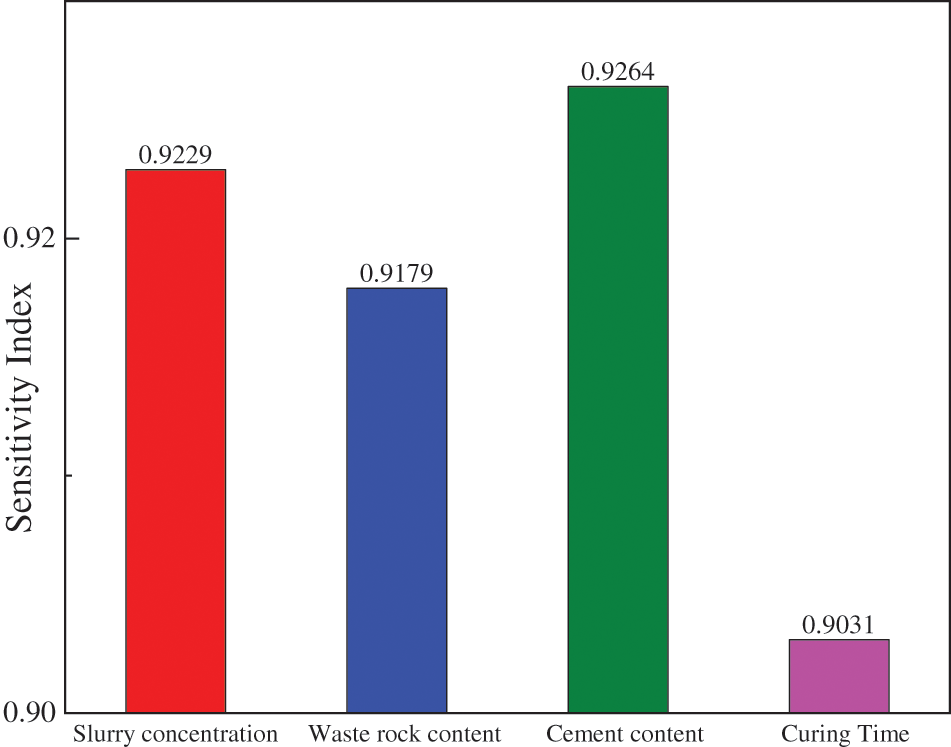
Figure 14: The results of sensitivity analysis
To investigate the sensitivity of the 4 input variables to the UCS of CPB in this paper, the cosine amplitude method is used to perform sensitivity analysis [69–72]. The sensitivity is calculated in Eq. (14).
In Eq. (9), xan represents the column vector composed of different independent variables; xbn represents the column vector composed of dependent variables; Sab represents the sensitivity.
The sensitivity index closer to 0 indicates that the variable has a higher degree of influence on the UCS and closer to 1 indicates that the variable has a lower degree of influence on the UCS. The results of the sensitivity analysis are shown in Fig. 14. As shown in Fig. 14, the sensitivity of all 4 variables to UCS is the UCS is higher than 0.8. This indicates that all 4 influencing factors have a significant effect on UCS. The sensitivity of the 4 variables to UCS is ranked from highest to lowest: Cement content (0.9264) > Slurry concentration (0.9229) > Waste rock content (0.9179) > Curing time (0.9031).
Sensitivity analysis shows that the effect of cement content is the most important factor in UCS. This is because the cement acts as a cementing agent during the formation of UCS to ensure that the hydration reaction takes place. The large amount of hydration products generated by the hydration reaction glues the aggregates together to form a stable cement structure, which becomes the basis for the formation of the UCS [73]. The slurry concentration is the secondary factor affecting the UCS. This is because slurry concentration has an important effect on slurry segregation [74]. The settling speed of different size particles in the slurry is different resulting in high concentration of slurry due to the large viscosity of the high resistance to particle settling. This results in an even distribution of coarse and fine particles in the slurry, which enhances the denseness of the filler and thus the UCS [75]. Waste rock content is an important factor affecting the UCS. From Section 2 of this paper, it can be seen that the amount of waste rock content affects the UCS by affecting the aggregate packing density and thus the UCS. Specific details are limited to space and will not be repeated. In addition, the curing time can also affect the UCS to some extent. Numerous studies show that prolonging the curing time enhances the UCS to to a certain extent [76–78].
In this paper, results show that LSTM is a low-cost, high-accuracy and lossless method for predicting the UCS of CPB. Despite the results achieved in this study, there are still unavoidable limitations. Firstly, the LSTM model proposed in this paper does not include the physicochemical properties of the filling material in predicting the UCS of CPB. The physicochemical properties affect the hydration reactions and hydration products of the filling material, which in turn have an impact on the UCS of CPB. Secondly, the generalization performance and prediction accuracy of the model in this paper can improve with the expansion of the data set. The small data set is a key factor limiting the application of machine learning in the field of infill mining. In the subsequent work, the study of the physicochemical properties of the filling material and the expansion of the filling strength dataset will be carried out simultaneously.
(1) In this study, waste rock and river sand are used as aggregates to prepare a material that can be used for CPB. This research effectively utilizes and resources one of the solid wastes in mine, waste rock. Moreover, this provides guidance for the improvement of CPB application in different mines and the sustainable development of mines.
(2) Optimization of the gradation of filled mixed aggregates based on the theory of packing density and the Talbol gradation principle. The packing density of mixed aggregates composed of waste rock and river sand shows a trend of increasing and then decreasing with the increase of waste rock content. The maximum packing density is achieved when the waste rock content is 70%. In this way, the theoretical optimum gradation of 7:3 is determined for coarse and fine aggregates made of waste rock and river sand, respectively.
(3) Filled slurry ratio tests and UCS tests are designed using RSM-BBD with 3 levels and 3 influencing factors. The slurry concentration, waste rock content and cement content are set as input variables, and the UCS is set as output variable and modeled by LSTM. Based on the experimental data, two parameters, the maximum iterations and the hidden layer nodes in LSTM, are optimally found. The optimal LSTM model with the hidden layer nodes of 9 and the maximum iterations of 115 is finally constructed.
(4) The prediction results of LSTM are compared with three neural networks, RBF-ANN, ELM and BP-ANN. The results show that all evaluation measures of LSTM are optimal (R2 = 0.9973, RMSE = 0.0914 and VAF = 99.73). LSTM is a low cost, high accuracy and non-destructive UCS evaluation method that can be used to guide CPB design.
(5) The sensitivity analysis shows that the sensitivity of all 4 affecting factors to UCS is higher than 0.8. The result shows that all 4 affecting factors have significant effect on UCS. The sensitivity of the 4 variables to UCS is ranked from highest to lowest: Cement content (0.9264) > Slurry concentration (0.9229) > Waste rock content (0.9179) > Curing time (0.9031).
Funding Statement: This study was supported by the National Key Research and Development Program of China (2018YFC1900603, 2018YFC0604604).
Conflicts of Interest: The authors declare that they have no conflicts of interest to report regarding the present study.
1. Li, E., Zhou, J., Shi, X., Jahed, A., Yu, Z. (2021). Developing a hybrid model of salp swarm algorithm-based support vector machine to predict the strength of fiber-reinforced cemented paste backfill. Engineering with Computers, 37(4), 3519–3540. DOI 10.1007/s00366-020-01014-x. [Google Scholar] [CrossRef]
2. Qi, C., Fourie, A. (2019). Cemented paste backfill for mineral tailings management: Review and future perspectives. Minerals Engineering, 144, 106025. DOI 10.1016/j.mineng.2019.106025. [Google Scholar] [CrossRef]
3. Fourie, A. (2009). Preventing catastrophic failures and mitigating environmental impacts of tailings storage facilities. Procedia Earth and Planetary Science, 1(1), 1067–1071. DOI 10.1016/j.proeps.2009.09.164. [Google Scholar] [CrossRef]
4. Sun, W., Wu, D., Liu, H., Qu, C. (2021). Thermal, mechanical and ultrasonic properties of cemented tailings backfill subjected to microwave radiation. Construction and Building Materials, 313, 125535. DOI 10.1016/j.conbuildmat.2021.125535. [Google Scholar] [CrossRef]
5. Zhang, S., Shi, T., Ni, W., Li, K., Gao, W. (2021). The mechanism of hydrating and solidifying green mine fill materials using circulating fluidized bed fly ash-slag-based agent. Journal of Hazardous Materials, 415, 125625. DOI 10.1016/j.jhazmat.2021.125625. [Google Scholar] [CrossRef]
6. Sun, W., Wang, H., Hou, K. (2018). Control of waste rock-tailings paste backfill for active mining subsidence areas. Journal of Cleaner Production, 171, 567–579. DOI 10.1016/j.jclepro.2017.09.253. [Google Scholar] [CrossRef]
7. Lu, H., Qi, C., Chen, Q., Gan, D., Xue, Z. (2018). A new procedure for recycling waste tailings as cemented paste backfill to underground stopes and open pits. Journal of Cleaner Production, 188, 601–612. DOI 10.1016/j.jclepro.2018.04.041. [Google Scholar] [CrossRef]
8. Niu, H., Yang, D., Gao, T., Wang, J. (2021). Efficient prediction of the packing density of inorganic fillers in dental resin composites for excellent properties. Dental Materials, 37(12), 1806–1818. DOI 10.1016/j.dental.2021.09.010. [Google Scholar] [CrossRef]
9. Qiu, J., Guo, Z., Yang, L., Jiang, H., Zhao, Y. (2020). Effects of packing density and water film thickness on the fluidity behaviour of cemented paste backfill. Powder Technology, 359, 27–35. DOI 10.1016/j.powtec.2019.10.046. [Google Scholar] [CrossRef]
10. Hettiarachchi, H., Mampearachchi, W. (2018). Effect of vibration frequency, size ratio and large particle volume fraction on packing density of binary spherical mixtures. Powder Technology, 336 150–160. DOI 10.1016/j.powtec.2018.05.049. [Google Scholar] [CrossRef]
11. Qi, C., Chen, Q., Dong, X., Zhang, Q., Yaseen, Z. (2020). Pressure drops of fresh cemented paste backfills through coupled test loop experiments and machine learning techniques. Powder Technology, 361, 748–758. DOI 10.1016/j.powtec.2019.11.046. [Google Scholar] [CrossRef]
12. Zhang, Y., Gao, W., Ni, W., Zhang, S., Li, Y. (2020). Influence of calcium hydroxide addition on arsenic leaching and solidification/stabilisation behaviour of metallurgical-slag-based green mining fill. Journal of Hazardous Materials, 390, 122161. DOI 10.1016/j.jhazmat.2020.122161. [Google Scholar] [CrossRef]
13. Qiu, J., Guo, Z., Yang, L., Jiang, H., Zhao, Y. (2020). Effect of tailings fineness on flow, strength, ultrasonic and microstructure characteristics of cemented paste backfill. Construction and Building Materials, 263, 120645. DOI 10.1016/j.conbuildmat.2020.120645. [Google Scholar] [CrossRef]
14. Liu, Z., Dang, W., Liu, Q., Chen, G., Peng, K. (2013). Optimization of clay material mixture ratio and filling process in gypsum mine goaf. International Journal of Mining Science and Technology, 23(3), 337–342. DOI 10.1016/j.ijmst.2013.05.018. [Google Scholar] [CrossRef]
15. Yan, B., Zhu, W., Hou, C., Yilmaz, E., Saadat, M. (2020). Characterization of early age behavior of cemented paste backfill through the magnitude and frequency spectrum of ultrasonic P-wave. Construction and Building Materials, 249, 118733. DOI 10.1016/j.conbuildmat.2020.118733. [Google Scholar] [CrossRef]
16. Hu, J., Ren, Q., Yang, D., Ma, S., Shang, J. (2020). Cross-scale characteristics of backfill material using NMR and fractal theory. Transactions of Nonferrous Metals Society of China, 30(5), 1347–1363. DOI 10.1016/S1003-6326(20)65301-8. [Google Scholar] [CrossRef]
17. Jiang, H., Fall, M., Li, Y., Han, J. (2019). An experimental study on compressive behaviour of cemented rockfill. Construction and Building Materials, 213, 10–19. DOI 10.1016/j.conbuildmat.2019.04.061. [Google Scholar] [CrossRef]
18. Shi, Y., Cheng, L., Tao, M., Tong, S., Yao, X. (2021). Using modified quartz sand for phosphate pollution control in cemented phosphogypsum (PG) backfill. Journal of Cleaner Production, 283, 124652. DOI 10.1016/j.jclepro.2020.124652. [Google Scholar] [CrossRef]
19. Wu, J., Jing, H., Yin, Q., Meng, B., Han, G. (2020). Strength and ultrasonic properties of cemented waste rock backfill considering confining pressure, dosage and particle size effects. Construction and Building Materials, 242, 118132. DOI 10.1016/j.conbuildmat.2020.118132. [Google Scholar] [CrossRef]
20. Arulrajah, A., Disfani, M., Horpibulsuk, S., Suksiripattanapong, C., Prongmanee, N. (2014). Physical properties and shear strength responses of recycled construction and demolition materials in unbound pavement base/subbase applications. Construction and Building Materials, 58, 245–257. DOI 10.1016/j.conbuildmat.2014.02.025. [Google Scholar] [CrossRef]
21. Mohammed, A., Mahmood, W., Ghafor, K. (2020). TGA, rheological properties with maximum shear stress and compressive strength of cement-based grout modified with polycarboxylate polymers. Construction and Building Materials, 235, 117534. DOI 10.1016/j.conbuildmat.2019.117534. [Google Scholar] [CrossRef]
22. Jo, Y. (2020). Adhesion in tension of polymer cement mortar by curing conditions using polymer dispersions as cement modifier. Construction and Building Materials, 242, 118134. DOI 10.1016/j.conbuildmat.2020.118134. [Google Scholar] [CrossRef]
23. Xiao, B., Wen, Z., Miao, S., Gao, Q. (2021). Utilization of steel slag for cemented tailings backfill: Hydration, strength, pore structure, and cost analysis. Case Studies in Construction Materials, 15, e00621. DOI 10.1016/j.cscm.2021.e00621. [Google Scholar] [CrossRef]
24. Micael, R., Camila, S., Márlon, A., Ana, P. (2021). Valorization of kaolin mining waste from the Amazon region (Brazil) for the low-carbon cement production. Case Studies in Construction Materials, 15, e00756. DOI 10.1016/j.cscm.2021.e00756. [Google Scholar] [CrossRef]
25. Altunkaynak, A., Kartal, E. (2021). Transfer sea level learning in the bosphorus strait by wavelet based machine learning methods. Ocean Engineering, 233, 109116. DOI 10.1016/j.oceaneng.2021.109116. [Google Scholar] [CrossRef]
26. ElSayed, N., Tolba, A., Rashad, M., Belal, T., Sarhan, S. (2021). Multimodal analysis of electroencephalographic and electrooculographic signals. Computers in Biology and Medicine, 137, 104809. DOI 10.1016/j.compbiomed.2021.104809. [Google Scholar] [CrossRef]
27. Heinermann, J., Kramer, O. (2016). Machine learning ensembles for wind power prediction. Renewable Energy, 89, 671–679. DOI 10.1016/j.renene.2015.11.073. [Google Scholar] [CrossRef]
28. Thangamani, T., Prabha, R., Prasad, M., Kumari, U., KV, R. (2021). IoT defense machine learning: Emerging solutions and future problems. Microprocessors and Microsystems, 104043. DOI 10.1016/j.micpro.2021.104043. [Google Scholar] [CrossRef]
29. Qi, C., Fourie, A., Chen, Q. (2018). Neural network and particle swarm optimization for predicting the unconfined compressive strength of cemented paste backfill. Construction and Building Materials, 159, 473–478. DOI 10.1016/j.conbuildmat.2017.11.006. [Google Scholar] [CrossRef]
30. Qi, C., Guo, L., Ly, H., Le, H. V., Pham, B. T. (2021). Improving pressure drops estimation of fresh cemented paste backfill slurry using a hybrid machine learning method. Minerals Engineering, 163, 106790. DOI 10.1016/j.mineng.2021.106790. [Google Scholar] [CrossRef]
31. Wang, Y., Cao, Y., Cui, L., Si, Z., Wang, H. (2020). Effect of external sulfate attack on the mechanical behavior of cemented paste backfill. Construction and Building Materials, 263, 120968. DOI 10.1016/j.conbuildmat.2020.120968. [Google Scholar] [CrossRef]
32. Ji, K., Han, B., Hu, Y., Wu, F., Qiu, J. (2021). Prediction of backfill strength in underground stope based on strength reduction and intelligent algorithm. The Chinese Journal of Nonferrous Metals, 31(3), 796–805. DOI 10.11817/j.ysxb.1004.0609.2020-35929. [Google Scholar] [CrossRef]
33. Zhang, Q., Li, X., Yang, W. (2013). Optimization of filling slurry ratio in a mine based on back-propagation neural network. Journal of Central South University (Science and Technology), 44(7), 2867–2874. [Google Scholar]
34. Wu, W., Ji, K., Zhang, P., Qiu, J., Luo, X., Han, B. (2020). Strength prediction of filling body based on ANN-PSO model and its engineering application. Mining Research and Development, 40(2), 53–57. DOI 10.13827/j.cnki.kyyk.2020.02.010. [Google Scholar] [CrossRef]
35. Li, K., Hu, Y., Han, B., Ji, K., Zhang, P. (2021). Strength prediction and strength damage of wet shotcrete at low temperature. Journal of Central South University (Science and Technology), 52(5), 1581–1590. DOI 10.11817/j.issn.1672-7207.2021.05.019. [Google Scholar] [CrossRef]
36. Han, B., Ji, K., Hu, Y. F., Yao, S. (2021). Application of ANN-PSO-GA model in UCS prediction and mix proportion optimization of wet shotcrete. Journal of Mining & Safety Engineering, 38(3), 584–591. DOI 10.13545/j.cnki.jmse.2019.0424. [Google Scholar] [CrossRef]
37. Shyamasundar, R. (1996). Algorithms. Resonance, 1(6), 22–32. DOI 10.1007/BF02834362. [Google Scholar] [CrossRef]
38. Yeoman, I. (2019). Algorithms. Journal of Revenue and Pricing Management, 18(3), 183–184. DOI 10.1057/s41272-019-00196-4. [Google Scholar] [CrossRef]
39. Shyamasundar, R. (1996). Algorithms. Resonance, 1(1), 20–27. DOI 10.1007/BF02838854. [Google Scholar] [CrossRef]
40. Ream, A. (1985). Algorithms. Journal of Clinical Monitoring, 1(1), 64. DOI 10.1007/BF02832691. [Google Scholar] [CrossRef]
41. Kirwan, C., Smith, J., Beale, R. (2006). A calibrated pulse waveform analysis algorithm, which determines continuous cardiac output, compared with a noncalibrated algorithm. Critical Care, 10(1), 325. DOI 10.1186/cc4672. [Google Scholar] [CrossRef]
42. Guo, Z., Wang, Q., Yin, S., Kuai, X., Yan, D. (2019). The creep compaction behavior of crushed mudstones under the step loading in underground mining. International Journal of Coal Science & Technology, 6(3), 408–418. DOI 10.1007/s40789-019-0243-8. [Google Scholar] [CrossRef]
43. Zakeri, J., Sadeghi, J. (2007). Field investigation on load distribution and deflections of railway track sleepers. Journal of Mechanical Science and Technology, 21(12), 1948–1956. DOI 10.1007/BF03177452. [Google Scholar] [CrossRef]
44. Feng, M., Wu, J., Ma, D., Ni, X., Yu, B. (2018). Experimental investigation on the seepage property of saturated broken red sandstone of continuous gradation. Bulletin of Engineering Geology and the Environment, 77(3), 1167–1178. DOI 10.1007/s10064-017-1046-z. [Google Scholar] [CrossRef]
45. Gao, Q., Yang, X., Wen, Z., Chen, D., He, J. (2019). Optimization of proportioning of mixed aggregate filling slurry based on BBD response surface method. Journal of Hunan University (Natural Sciences), 46(6), 47–55. DOI 10.16339/j.cnki.hdxbzkb.2019.06.007. [Google Scholar] [CrossRef]
46. Fu, Z., Qiao, D., Guo, Z., Xie, J., Huang, F. (2018). Experimental research on mixture proportion and strength of cemented hydraulic fill with waste rock and eolian sand based on RSM-BBD. Journal of China Coal Society, 43(3), 694–703. DOI 10.13225/j.cnki.jccs.2017.0806. [Google Scholar] [CrossRef]
47. Zhang, C., Hu, Y., Wang, Y., Gu, J. (2019). Study on the law of influence of aggregate packing density on the strength of filling body. Mining Research and Development, 39(8), 96–100. DOI 10.13827/j.cnki.kyyk.2019.08.020. [Google Scholar] [CrossRef]
48. Zhou, N., Zhang, J., Ouyang, S., Deng, X., Dong, C. (2020). Feasibility study and performance optimization of sand-based cemented paste backfill materials. Journal of Cleaner Production, 259, 120798. DOI 10.1016/j.jclepro.2020.120798. [Google Scholar] [CrossRef]
49. Dwivedi, S., Sharma, S., Mishra, R. (2019). Retraction note: Effects of roller burnishing process parameters on surface roughness of A356/5%SiC composite using response surface methodology. Advances in Manufacturing, 7(1), 116. DOI 10.1007/s40436-018-0232-y. [Google Scholar] [CrossRef]
50. Qureshi, T., Memon, N., Memon, S., Yavuz, H., Lachgar, A. (2019). Correction to: Evaluation of hydrochar efficiency for simultaneous removal of diclofenac and ibuprofen from aqueous system using surface response methodology. Environmental Science and Pollution Research, 26(10), 9805. DOI 10.1007/s11356-019-04746-6. [Google Scholar] [CrossRef]
51. Ashan, S., Ziaeifar, N., Khalilnezhad, R. (2018). Correction to: Artificial neural network modelling of Cr(VI) surface adsorption with NiO nanoparticles using the results obtained from optimization of response surface methodology. Neural Computing and Applications, 29(10), 981. DOI 10.1007/s00521-018-3341-4. [Google Scholar] [CrossRef]
52. Yao, H., Liu, D. (2021). Utilization of low activity CFBC ash in cemented paste backfill containing phosphate tailings. Mining, Metallurgy & Exploration, 38(6), 2485–2492. DOI 10.1007/s42461-021-00504-w. [Google Scholar] [CrossRef]
53. Zhang, Q., Hu, G., Wang, X. (2008). Hydraulic calculation of gravity transportation pipeline system for backfill slurry. Journal of Central South University of Technology, 15(5), 645–649. DOI 10.1007/s11771-008-0120-x. [Google Scholar] [CrossRef]
54. Liu, H., Hou, C., Li, L., Du, J., Yan, B. (2021). Experimental investigation on flow properties of cemented paste backfill through L-pipe and loop-pipe tests. Journal of Central South University (Science and Technology), 28(9), 2830–2842. DOI 10.1007/s11771-021-4810-y. [Google Scholar] [CrossRef]
55. Chen, Q., Zhang, Q., Wang, X., Xiao, C., Hu, Q. (2016). A hydraulic gradient model of paste-like crude tailings backfill slurry transported by a pipeline system. Environmental Earth Sciences, 75(14), 1099. DOI 10.1007/s12665-016-5895-8. [Google Scholar] [CrossRef]
56. Hochreiter, S., Schmidhuber, J. (1997). Long short-term memory. Neural Computation, 9(8), 1735–1780. DOI 10.1162/neco.1997.9.8.1735. [Google Scholar] [CrossRef]
57. Gauch, M., Kratzert, F., Klotz, D., Nearing, G., Lin, J. (2021). Rainfall-runoff prediction at multiple timescales with a single long short-term memory network. Hydrology and Earth System Sciences, 25(4), 2045–2062. DOI 10.5194/hess-25-2045-2021. [Google Scholar] [CrossRef]
58. Mahdi, H., Ehsan, V. (2019). Code failure prediction and pattern extraction using LSTM networks. 2019 IEEE Fifth International Conference on Big Data Computing Service and ApplicationsSan Francisco, California, USA. DOI 10.48550/arXiv.1812.05237. [Google Scholar] [CrossRef]
59. Xing, L., Liu, W. (2021). A data fusion powered Bi-directional long short term memory model for predicting multi-lane short term traffic flow. IEEE Transactions on Intelligent Transportation Systems, 99, 1–10. DOI 10.1109/TITS.2021.3095095. [Google Scholar] [CrossRef]
60. Guo, Y. (2020). Stock price prediction based on LSTM neural network: The effectiveness of news sentiment analysis. 2020 2nd International Conference on Economic Management and Model Engineering (ICEMME), Chongqing, China. [Google Scholar]
61. van de Leemput, S. C., Prokop, M., van Ginneken, B., Manniesing, R. (2020). Stacked bidirectional convolutional LSTMs for deriving 3D non-contrast CT from spatiotemporal 4D CT. IEEE Transactions on Medical Imaging, 39(4), 985–996. DOI 10.1109/TMI.2019.2939044. [Google Scholar] [CrossRef]
62. Zhou, W., Liu, M., Zheng, Y., Dai, Y. (2020). Online error correction method of PMU data based on LSTM model and kalman filter. 2020 12th IEEE PES Asia-Pacific Power and Energy Engineering Conference (APPEEC)Xi’an, China. [Google Scholar]
63. Cao, W., Zhu, W., Wang, W. W., Yves, D. (2020). A deep coupled LSTM approach for USD/CNY exchange rate forecasting. IEEE Intelligent Systems, 35(2), 43–53. DOI 10.1109/MIS.2020.2977283. [Google Scholar] [CrossRef]
64. Yu, Z., Shi, X., Chen, X., Zhou, J., Qi, C. (2021). Artificial intelligence model for studying unconfined compressive performance of fiber-reinforced cemented paste backfill. Transactions of Nonferrous Metals Society of China, 31(4), 1087–1102. DOI 10.1016/S1003-6326(21)65563-2. [Google Scholar] [CrossRef]
65. Xu, X., Shan, D., Li, S., Sun, T., Xiao, P. (2019). Multi-label learning method based on ML-RBF and laplacian ELM. Neurocomputing, 331, 213–219. DOI 10.1016/j.neucom.2018.11.018. [Google Scholar] [CrossRef]
66. Zhang, N., Ding, S., Zhang, J. (2016). Multi layer ELM-RBF for multi-label learning. Applied Soft Computing, 43, 535–545. DOI 10.1016/j.asoc.2016.02.039. [Google Scholar] [CrossRef]
67. Ofori-Ntow, J., Ziggah, Y., Relvas, S. (2021). Hybrid ensemble intelligent model based on wavelet transform, swarm intelligence and artificial neural network for electricity demand forecasting. Sustainable Cities and Society, 66, 102679. DOI 10.1016/j.scs.2020.102679. [Google Scholar] [CrossRef]
68. Reiner, P., Wilamowski, B. (2015). Efficient incremental construction of RBF networks using quasi-gradient method. Neurocomputing, 150, 349–356. DOI 10.1016/j.neucom.2014.05.082. [Google Scholar] [CrossRef]
69. Cao, J., Gao, J., Nikafshan, R., Mohammed, A. S., Hasanipanah, M. (2021). A novel systematic and evolved approach based on XGBoost-firefly algorithm to predict young’s modulus and unconfined compressive strength of rock. Engineering with Computers, 366(20), 1241–1242. DOI 10.1007/s00366-020-01241-2. [Google Scholar] [CrossRef]
70. Ma, C., Liu, J., Wang, S. (2020). Thermal error compensation of linear axis with fixed-fixed installation. International Journal of Mechanical Sciences, 175, 105531. DOI 10.1016/j.ijmecsci.2020.105531. [Google Scholar] [CrossRef]
71. Neri, B., Ciapini, A., Comparini, T., Guidi, G., Guidi, S. (1981). Circadian variations of phosphohexose-isomerase (PGI) in multiple myeloma. European Journal of Cancer and Clinical Oncology, 17(11), 1177–1181. DOI 10.1016/S0277-5379(81)80021-1. [Google Scholar] [CrossRef]
72. Vieira, J., Fabiani, B., Silveira, E., Sakomura, E., Oliveira, F. (2021). Calibration procedures for microwave vector comparators. Sensors and Actuators A: Physical, 331, 112955. DOI 10.1016/j.sna.2021.112955. [Google Scholar] [CrossRef]
73. Fetecau, C., Vieru, D., Fetecau, C. (2008). A note on the second problem of stokes for newtonian fluids. International Journal of Non-Linear Mechanics, 43(5), 451–457. DOI 10.1016/j.ijnonlinmec.2007.12.022. [Google Scholar] [CrossRef]
74. Zhao, X., Zhang, H., Zhu, W. (2014). Fracture evolution around pre-existing cylindrical cavities in brittle rocks under uniaxial compression. Transactions of Nonferrous Metals Society of China, 24(3), 806–815. DOI 10.1016/S1003-6326(14)63129-0. [Google Scholar] [CrossRef]
75. Zhou, J., Qiu, Y., Khandelwal, M., Zhu, S., Zhang, X. (2021). Developing a hybrid model of jaya algorithm-based extreme gradient boosting machine to estimate blast-induced ground vibrations. International Journal of Rock Mechanics and Mining Sciences, 145, 104856. DOI 10.1016/j.ijrmms.2021.104856. [Google Scholar] [CrossRef]
76. Wang, C., Hou, X., Liao, Z., Chen, Z., Lu, Z. (2019). Experimental investigation of predicting coal failure using acoustic emission energy and load-unload response ratio theory. Journal of Applied Geophysics, 161, 76–83. DOI 10.1016/j.jappgeo.2018.12.010. [Google Scholar] [CrossRef]
77. Wei, X., Ni, W., Zhang, S., Wang, X., Li, J. (2022). Influence of the key factors on the performance of steel slag-desulphurisation gypsum-based hydration-carbonation materials. Journal of Building Engineering, 45, 103591. DOI 10.1016/j.jobe.2021.103591. [Google Scholar] [CrossRef]
78. Li, J., Zhang, S., Wang, Q., Ni, W., Li, K. (2020). Feasibility of using fly ash–slag-based binder for mine backfilling and its associated leaching risks. Journal of Hazardous Materials, 400, 123191. DOI 10.1016/j.jhazmat.2020.123191. [Google Scholar] [CrossRef]
 | This work is licensed under a Creative Commons Attribution 4.0 International License, which permits unrestricted use, distribution, and reproduction in any medium, provided the original work is properly cited. |