| Journal of Renewable Materials |
DOI: 10.32604/jrm.2022.020636
ARTICLE
Preparation and Properties of Eco-Friendly Aerated Concrete Utilizing High-Volume Fly Ash with MgO and CaO Activators
School of Chemistry and Civil Engineering, Shaoguan University, Shaoguan, 512005, China
*Corresponding Author: Zhiguang Zhao. Email: mszzg@sgu.edu.cn
Received: 08 December 2021; Accepted: 20 January 2022
Abstract: The associated MgO in limestone is believed to affect the volume stability of cementitious materials at room temperature, which limits the utilization of low-grade limestone. In this study, MgO was used as an alkali activator instead of partial CaO to prepare the aerated concrete under hydrothermal conditions. The expansion process was studied to evaluate the influence of the raw materials on the gas forming stability of the slurry. The pore structure (porosity, pore size and its distribution) was analyzed by the image method. The physic-mechanical properties (density, strength, thermal properties) of concrete with the addition of MgO were comprehensively investigated. Besides, the mineral compositions and morphology of the hydration products were analyzed to demonstrate the influence mechanism of MgO on the mechanical properties. Experimental results show that the final expansion rate of the slurry decreases with MgO content. A reasonable MgO content, i.e., MgO/(MgO + CaO) < 20%, contributes to improve the compressive strength, attributing to an increased reaction rate to C-S-H gel and tobermorite. The addition of MgO causes the thermal conductivity and specific heat to increase. The pore structure is mainly related to the amount of air-entraining agent. This study has a significance for the further utilization of magnesium-rich carbonates in the autoclaved building products.
Keywords: Fly ash; aerated concrete; strength; thermal properties; pore structure
At present, about 30% of the total energy consumption in China is concentrated in building industry, and it is increasing year by year [1,2]. Therefore, it is imperative to carry out building energy conservation. The implementation of building energy conservation is favorable to fundamentally promoting energy conservation, thereby alleviating the contradiction between energy supply and social development. The main ways to realize building energy saving are architectural planning and design building envelope structure, but from the perspective of long-term service of buildings, building materials play a key role in building energy saving. According to the principle of heat transfer, the light-weight thermal insulation materials are indispensable for building energy conservation. Among them, the wall materials account for about 70% of the entire building materials. Thus, the thermal insulation materials are of great significance to promote energy-saving buildings and reduce energy consumption.
The autoclaved aerated concrete (AAC) is a widely used wall material in the external wall self-insulation system. It uses fly ash, sand, slag, etc. as the raw materials and obtains a structure with the aid of alkali activators. AAC is a new kind of building energy-saving wall material obtained through high-temperature and high-pressure treatment. Its main characteristics are light weight, heat insulation, heat preservation, soil and energy saving, and convenient construction [3–5]. Importantly, the existing research shows AAC is the only wall material whose single material can reach the energy saving requirement of 50%. From the perspective of long-term development, AAC blocks have become the most promising wall thermal insulation materials.
Since the 20th century, a lot of research on the composition and mixing ratio of raw materials, the composition and structure of hardened paste, and product performance and quality evaluation of AAC have been reported. The porous structure of AAC makes it have good thermal insulation properties. The density is 400–1700 kg/m3, and its thermal conductivity is 0.1–0.7 W/(m·K), which is 1/20 of ordinary concrete [6–8]. Experiments have shown that the thermal conductivity of AAC is decreased by 0.02–0.05 W/(m·K) for every 100 kg/m3 decrease in density, the porosity of AAC increases from 50% to 71%, and then the thermal conductivity of aerated concrete decreases from 0.22 to 0.07 W/(m·K) [9–11]. In fact, the thermal performance of AAC is related to density, water content, raw material compositions, and pore structure [3,12].
The main raw materials of AAC include calcareous materials (CaO and cement) and siliceous materials (fly ash, ground sand, etc.). During the autoclave process, some complex hydrothermal reactions will occur to generate hydration products based on the CaO-SiO2-H2O system, such as tobermorite, xonotlite, etc. [3,11]. In the initial stage, the C3S and C2S in the cement are converted into C-S-H gel and Ca(OH)2. During the autoclave stage, the high alkalinity C-S-H appears. As the autoclave time increases, the low alkalinity C-S-H is formed as crystalline phase [13–15], in which, tobermorite is the main phase. In addition, there is xonotlite, etc. The type and quantity of these phases depend on the raw material CaO/SiO2, autoclave temperature and time [3,6,11]. The hydration products play a great role on the mechanical strength. Increasing the amount of tobermorite can improve the strength [9,12], and the larger grain size is conducive to improving the mechanical strength [9]. Therefore, it is an effective way to improve the strength of AAC by adjusting the compositions of raw materials and the preparation parameters to increase the amount of tobermorite.
The quick lime (CaO) is the main alkali activator in AAC based on the CaO-SiO2-H2O system, this results in a huge consumption of high-grade limestone (CaO > 48%) as a source of CaO. Unfortunately, the limestone is often accompanied by MgCO3 due to the similar chemical properties of Ca and Mg elements. It is believed that MgO has the potential to affect the volume stability of cementitious materials at room temperature, thus the amount of MgO is rigidly restricted within 5% [16]. This undoubtedly leads to a lot of limestone containing MgCO3 being discarded. Therefore, the synergistic use of CaO and MgO to prepare cementitious materials is of great significance to the utilization of low-grade limestone. MgO had been used to prepare the alkali-activated cementitious materials based on the CaO-MgO-SiO2-H2O system at ambient temperature [17,18]. Yi et al. [19–21] indicated that the addition of MgO could improve the initial strength of the MgO-CaO-activated-slag pastes. Gu et al. [22,23] also found that 9.5% MgO and 0.5% CaO were more effective for the strength of the alkali-activated pastes.
In fact, the reactivity of Mg2+ and Ca2+ increases under high temperature conditions. Ali et al. [24] found that the mechanical strength of high magnesia cement was significantly increased at high temperature. Besides, Nakagawa et al. indicated that magnesium oxide could influence the hydration products of silica fume-cement-slag pastes. For instance, the formation of tobermorite was promoted by MgO at 175°C, and then was converted to xonotlite at 250°C [25]. Tang, Lothenbach et al. [26–28] discovered that magnesium silicate hydrates can bind part of Ca or C-S-H can bind part of Mg to form a calcium-magnesium silicate complex hydrates (C-M-S-H). Mostafa et al. [29] showed that using 2% (molar ratio) MgO instead of CaO, tobermorite prepared by autoclaving at 175°C for 4 and 24 h has a higher degree of silicon chain polymerization, indicating that MgO participated in the formation of C-S-H and entered the structure. Fernandez et al. [30] added MgO to the synthesized C3S and autoclaved it at 100°C for 23 h. The results showed that Mg2+ entered the C-S-H silicon chain in the form of four coordination for C-S-H with Ca/Si > 1. Therefore, MgO can participate in the reaction between CaO and SiO2. The above investigations indicate the utilization of MgO and CaO to prepare new building materials is expected to happen.
The main purpose of this work is to use magnesium oxide as an alkali activator instead of partial calcium oxide to prepare the aerated concrete under hydrothermal conditions. Therefore, the effects of calcareous materials (CaO and MgO) on the gas expansion of slurry, forming of pore structure, and properties of AAC were systematically investigated. The optimal replacement amount was determined based on the above investigations. Meanwhile, the intrinsic correlations among the raw materials, pore structure, microstructure and properties were deeply explored.
The main starting materials used to prepare AAC in this study contained cement, fly ash (FA), calcium oxide and magnesium oxide. CaO was obtained by calcining CaCO3 at 1000°C for 3 h. Besides, MgO was gained by calcining MgCO3 at 850°C for 2 h. Aluminum powder pastes were used as air-entraining agent to generate bubbles in the slurry and pores in the AAC. There was 90% active Al content in the mixture of Al powder pastes, and the solid content of Al powder pastes was 70%. The fineness of Al powder pastes was evaluated with a 75 μm mesh sieve remaining 2.5%. The foam stabilizing agent was used to enhance the stability of bubbles by reducing the surface tension of the slurry. The soluble oil was used as foam stabilizing agent in this study. It was a mixture of oleic acid, triethanolamine and water in a ratio of 1:3:36, which could generate fatty acid soaps (C17H33COONa) at room temperature.
The mix proportions of AAC were listed in Table 1. The mass ratio replacement of MgO to CaO was designed to explore the impact of magnesium oxide on the properties of AAC. In addition, the pore structure and its relationship with the performance of AAC were studied by changing the amount of aluminum powders.
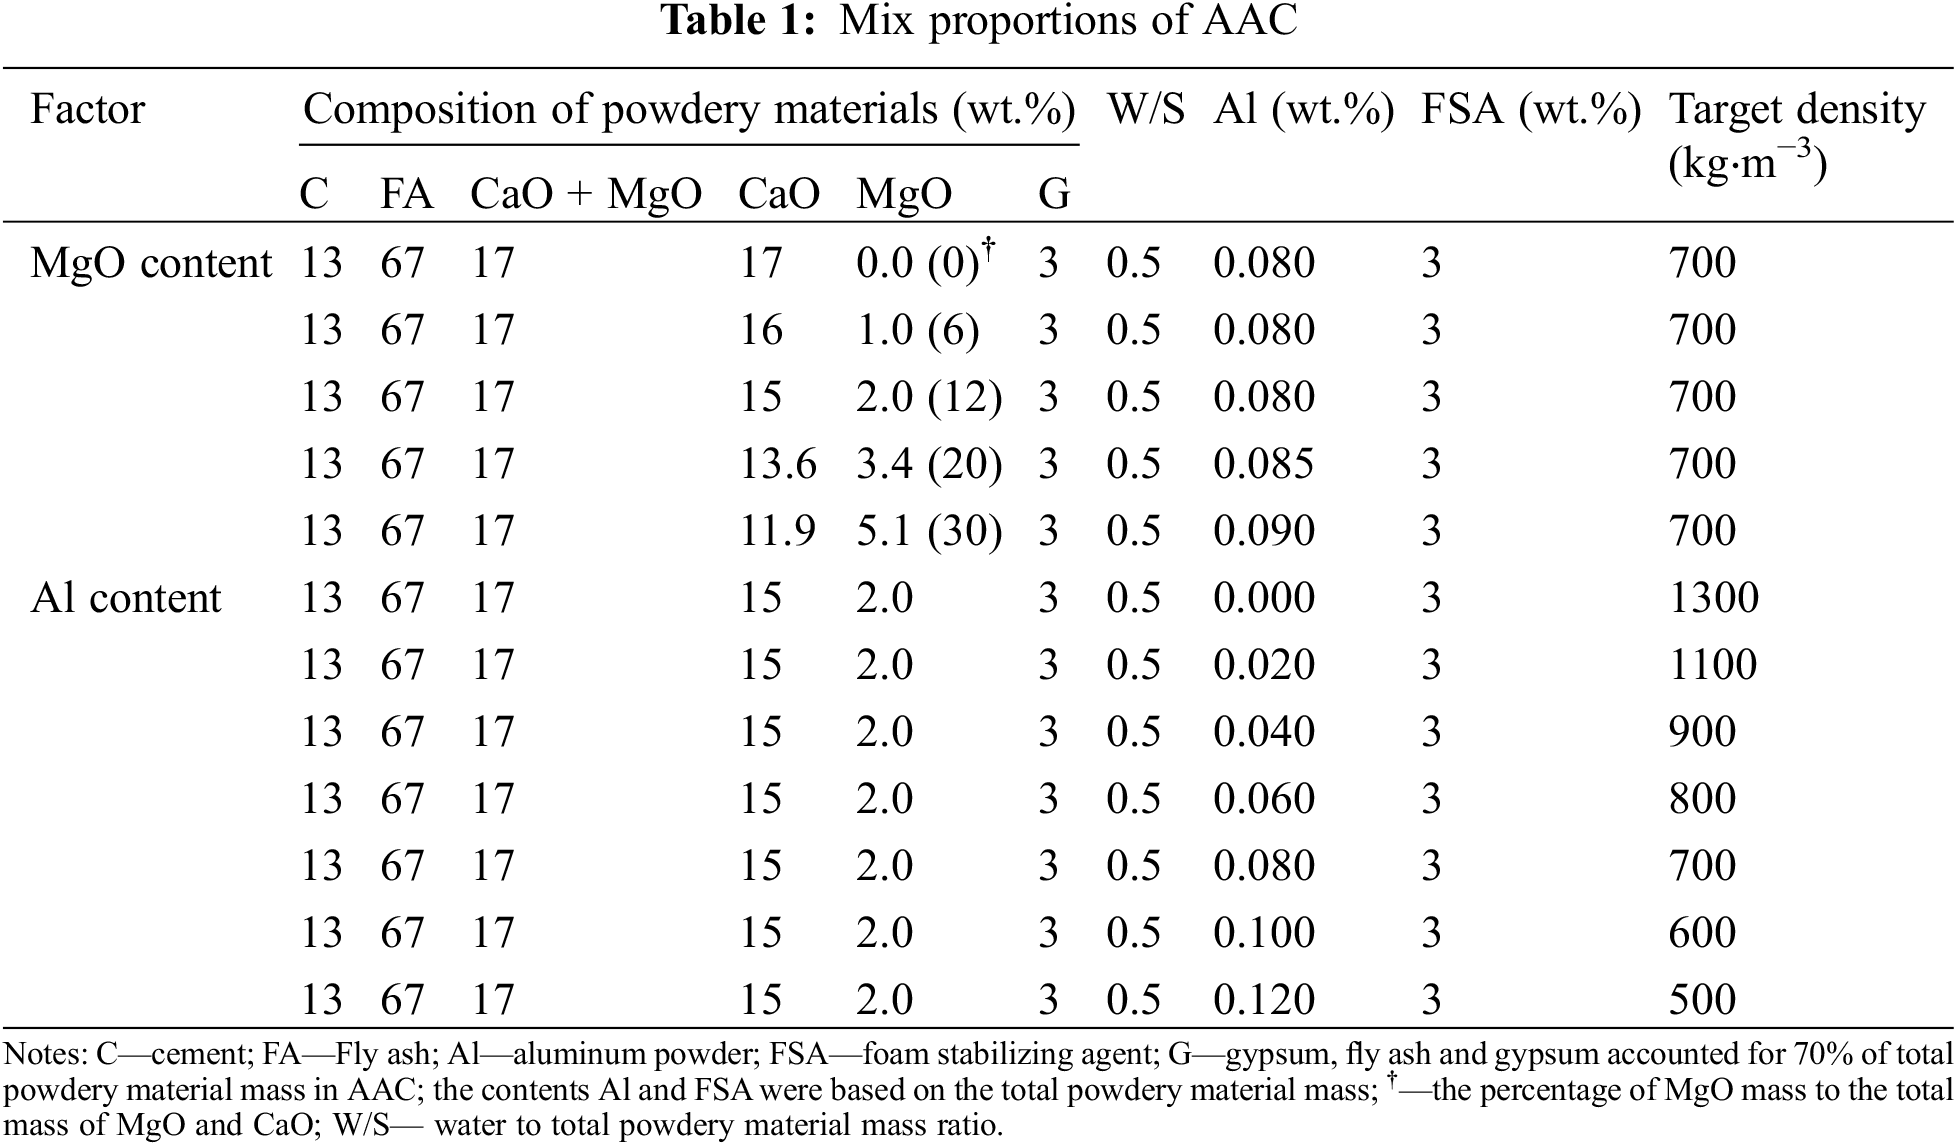
The raw materials of samples with different proportions were weighed according to Table 1. The raw materials were pre-mixed for 2 h. The evenly mixed raw materials were put into the mixer, and then the warm water (55–60°C) was added and stirred for 2 min to obtain the primary slurry. After that, the air-entraining agent and foam stabilizing agent were mixed with the primary slurry, then stirred for 30 s to obtain the ultimate slurry. The ultimate slurry was quickly poured into mould of 100 × 100 × 100 mm3 and located at 65–70°C for 3 h. Then the expanded body beyond the upper surface of the mould was cut off, which was followed by demoulding to obtain the green body. Finally, the green body was transferred into an industrial autoclave and autoclaved at the designed autoclave temperature and autoclave time.
The expansion rate test of the slurry: the slurry prepared in different proportions was poured into a 250 mL volumetric cylinder. The initial height of the slurry was fixed at 100 mL, the slurry height was recorded every 3 min until the slurry stopped expanding. At the same time, the temperature inside the slurry was recorded. The compressive strength and density of samples were tested referring to GB/T 11969-2008 [31]. The Hot Disk Thermal Constant Analyzer (Hot Disk 2500, Sweden) based on the Transient Plane Source Method (TPS) was utilized to evaluate the thermal properties (thermal diffusivity, thermal conductivity, specific heat, etc.). The pore structure was analyzed by the Image Pro Plus 6.0, as shown in Fig. 1. Phase compositions of AAC were identified by X-ray diffractometer (XRD, X’Pert Pro, PANalytical B.V., Netherlands), the working parameters of XRD: Cu Kα with wavelength (λ) of 1.54 Å; scan range (2θ) of 5–70°; step length of 0.02°. The morphology of the hydration products of AAC were observed by scanning electron microscope (SEM, Zeiss-EVO18, Germany).
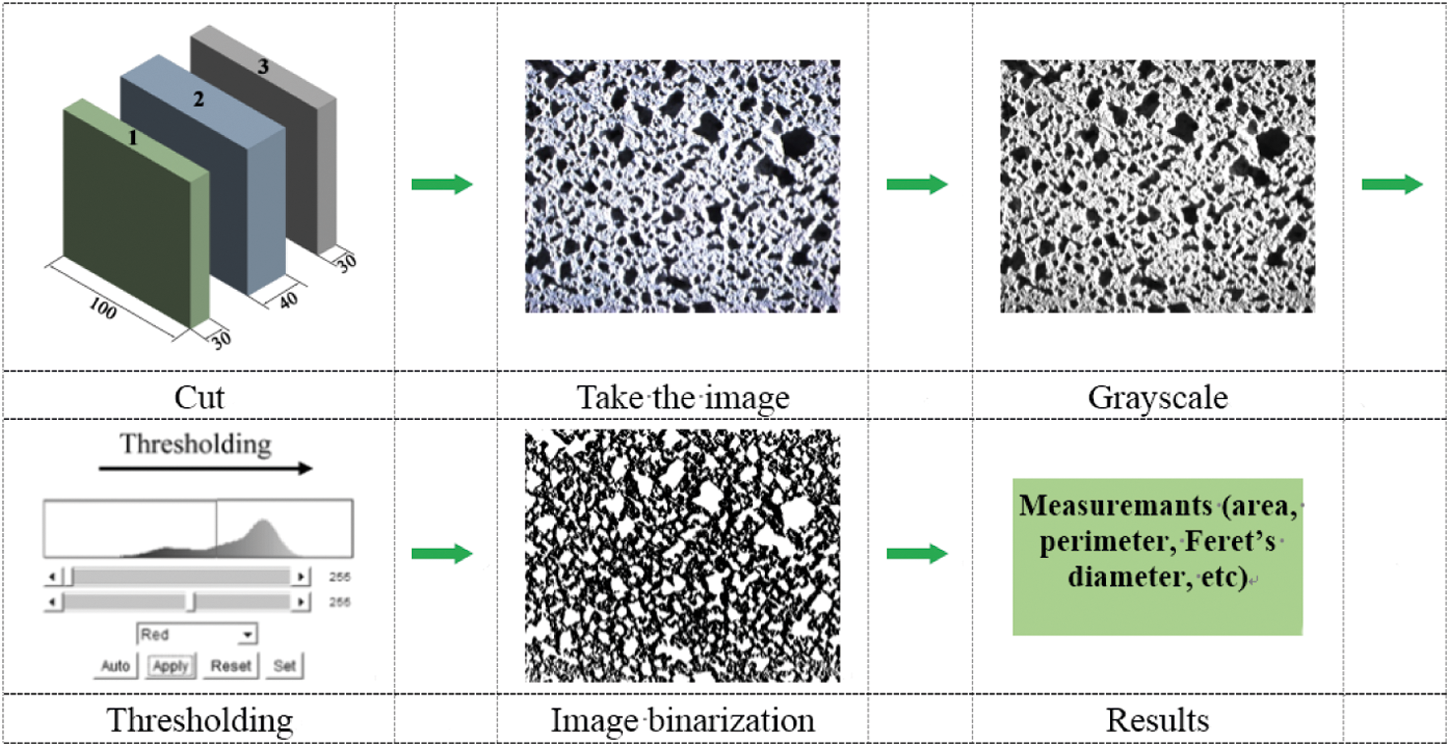
Figure 1: Flowchart of image analysis for the pore structure
3.1 Expansion Process and Temperature Development of AAC Slurry
The effects of MgO additions on the expansion process of AAC slurry are displayed in Fig. 2. It is found that the changing trends of all the curves are consistent, so the expansion process of the slurry after introducing MgO is basically unchanged. The expansion process is also divided into three stages: The first stage (0–15 min) is the rapid expansion stage; the second stage (15–20 min) is a stage where the expansion rate increases steadily; the third stage (after 20 min) is the stage, where the expansion process is almost over or the expansion rate remains almost the same. From Fig. 2a, the final expansion rate of the slurry decreases with MgO content. As the MgO/(CaO + MgO) ratio is less than 20%, the end time of slurry expansion is similar, and the decreasing degree of the final expansion rate is little. However, the final expansion rate is only about half of that of the control sample as the MgO/(CaO + MgO) ratio increases to 30%, and then the end of slurry expansion is advanced to within 20 min. This is because that MgO has weaker hydrolysis activity than CaO, resulting in low alkalinity, less reaction exotherm, and low slurry temperature.
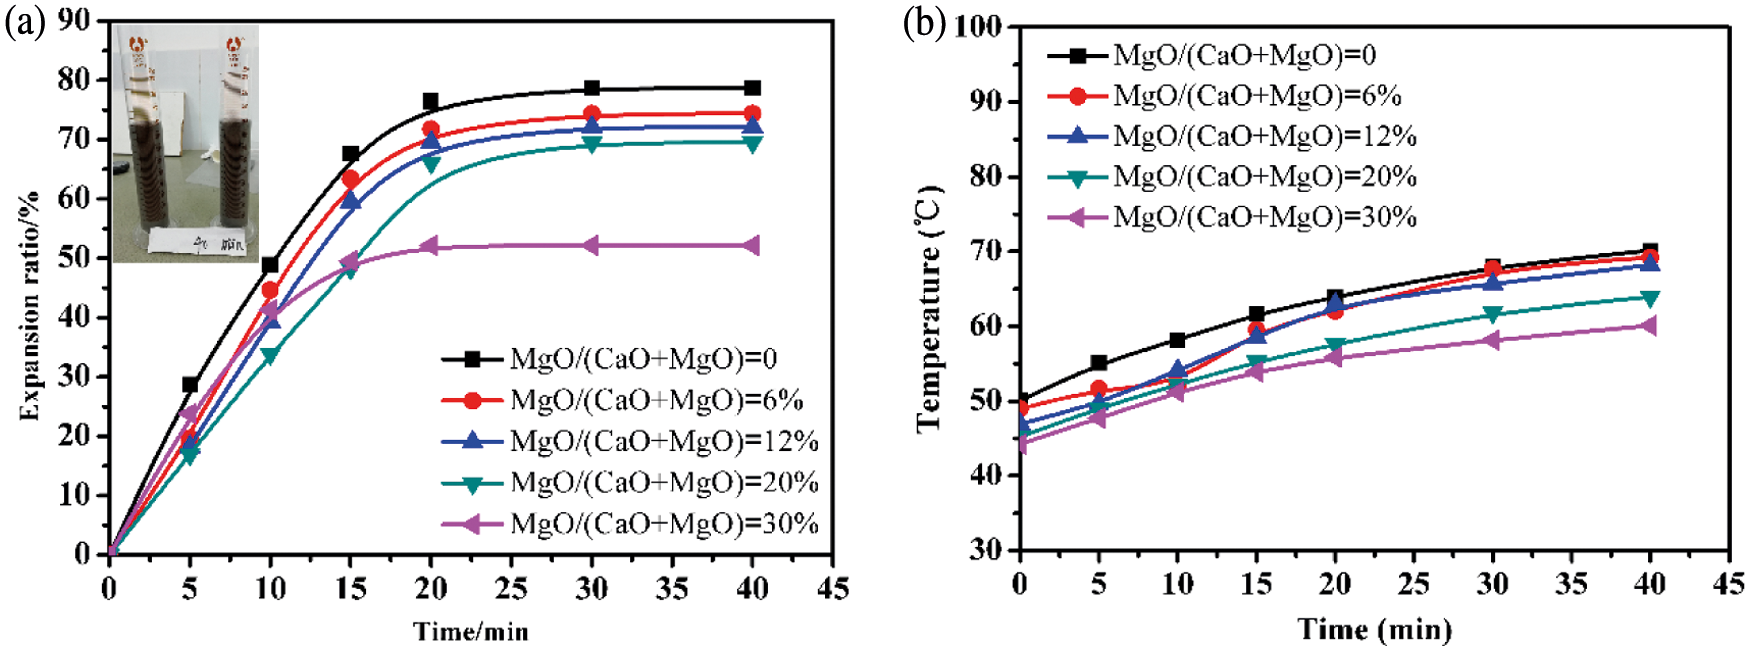
Figure 2: Expansion process (a) and temperature development (b) of AAC slurry with various MgO/(CaO + MgO) ratio
The slurry temperature is the key factor to thickening and expansion process. Fig. 2b shows the slurry temperature changes in the expansion process. It is indicated that the introduction of MgO leads to the slurry temperature lower. When the MgO/(CaO + MgO) ratio is 6%, the effect of MgO is not obvious, but the slurry temperature drops significantly as the MgO/(CaO + MgO) ratio exceeds 20%. In particular, the final slurry temperature is only about 55°C, indicating excessive MgO hinders the expansion process.
Equations in display format are separated from the paragraphs of the text. Equations should be flushed to the left of the column. Equations should be made editable. Displayed equations should be numbered consecutively, using Arabic numbers in parentheses. See Eq. (1) for an example. The number should be aligned to the right margin.
Abundant pores are the most important structural features of AAC. Porosity and air-void distributions determine the properties of AAC [32]. The porosity can be calculated by the Eq. (1):
where, ε is porosity, ρdry is the dry density, and ρsolid is the skeleton density (without gas generating agent). The porosity refers to the volume fraction of pores introduced by the air-entraining agent, and does not include the microscopic pores in the solid framework. In this paper, the skeleton density of AAC has passed the experimental test, and its value is 1300 kg/m3 (water-to-material ratio is 0.5).
As listed in Table 2, since the pores in AAC are introduced by the aluminum powders, the porosity has a positive correlation with the aluminum powder content. The porosity obtained by the image method is small compared with the value calculated by the Eq. (1), and the error is within 2%. This is due to the limitation of the image resolution. The color contrast difference between some small pores (less than 10 μm) and the solid matrix is too difficult to distinguish, thus the computer software treats these small pores as a solid phase.
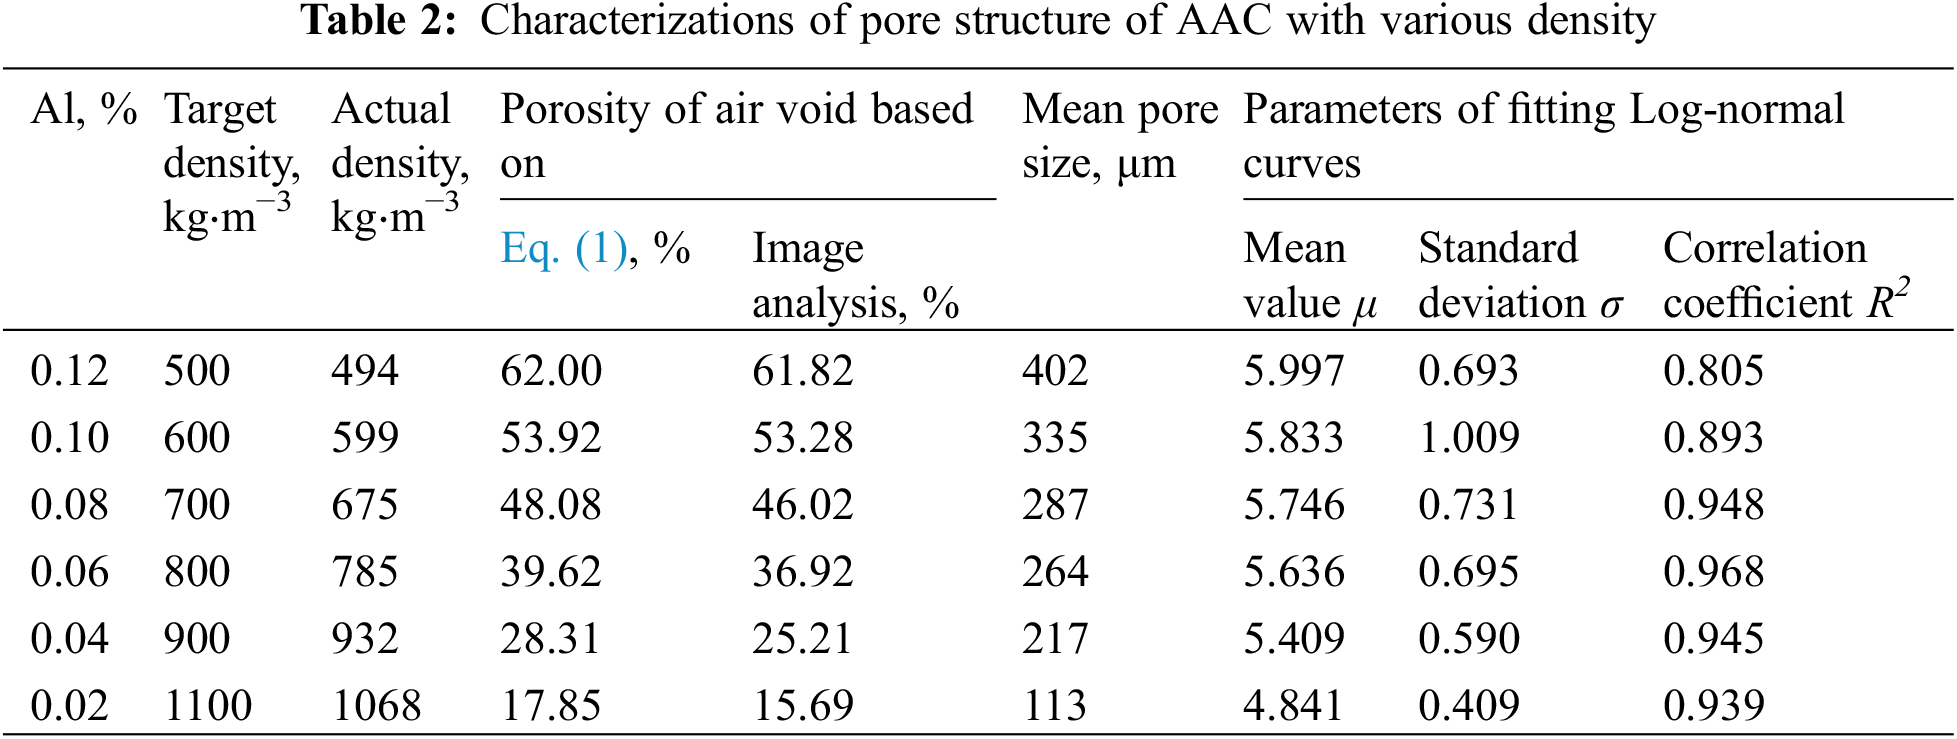
To better characterize the pore size of AAC, the mean “Feret” diameter is used to represent the mean pore size in this study. “Feret” diameter represents the distance between two parallel planes perpendicular to a certain direction of an object/pore (also called “caliper diameter”). The mean pore size changed with density of AAC, as presented in Table 2. It is observed that the mean pore size gradually increases from 113 to 402 μm as the density declines from 1100 to 500 kg/m3. Since the large number of bubbles in the slurry with high content of aluminum powder, as well as the reduction of the spacing between the bubbles, which leads to an increase in the probability of overlapping and merging between the bubbles, further resulting in the formation of large and irregular pores. This phenomenon is particularly pronounced in AAC with lower density. Fig. 3 visually presents the features of pores in AAC with density of 500 and 800 kg/m3. Obviously, the mean pore size of 500 kg/m3 AAC is significantly increased, and there is a large amount of overlap pores or connected pores, which means that when the macroscopic porosity is more than 60%, the mean pore size of AAC increases due to not enough slurry to separate and hinder the merging bubbles.
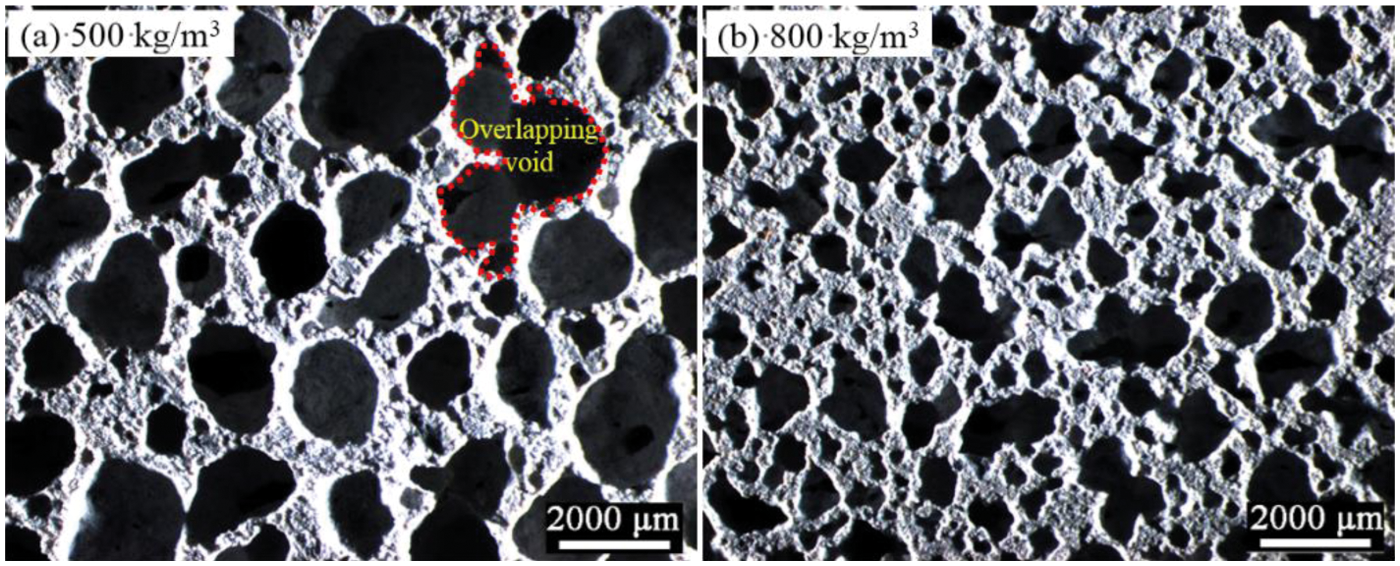
Figure 3: Optical micrographs of AAC
Fig. 4 shows the pore size distribution of three different densities of AAC. It is found that the pore size distributions of different densities are consistent, and most of the pores are distributed in a small interval. The overall range of the pore size distribution increases as the density decreases. The maximum pore size increases from 2000 μm at 1100 kg/m3 to 5000 μm at 500 kg/m3. This also indicates that with the increase in the number of bubbles in the slurry, the probability of overlapping and merging between bubbles increases. In addition, the high-density AAC has a smaller pore size distribution range compared with low-density, and the distribution is more concentrated in the small pore size range of 50–250 μm, which coincides with the pore distribution of porous building materials recorded in the literatures [33,34].
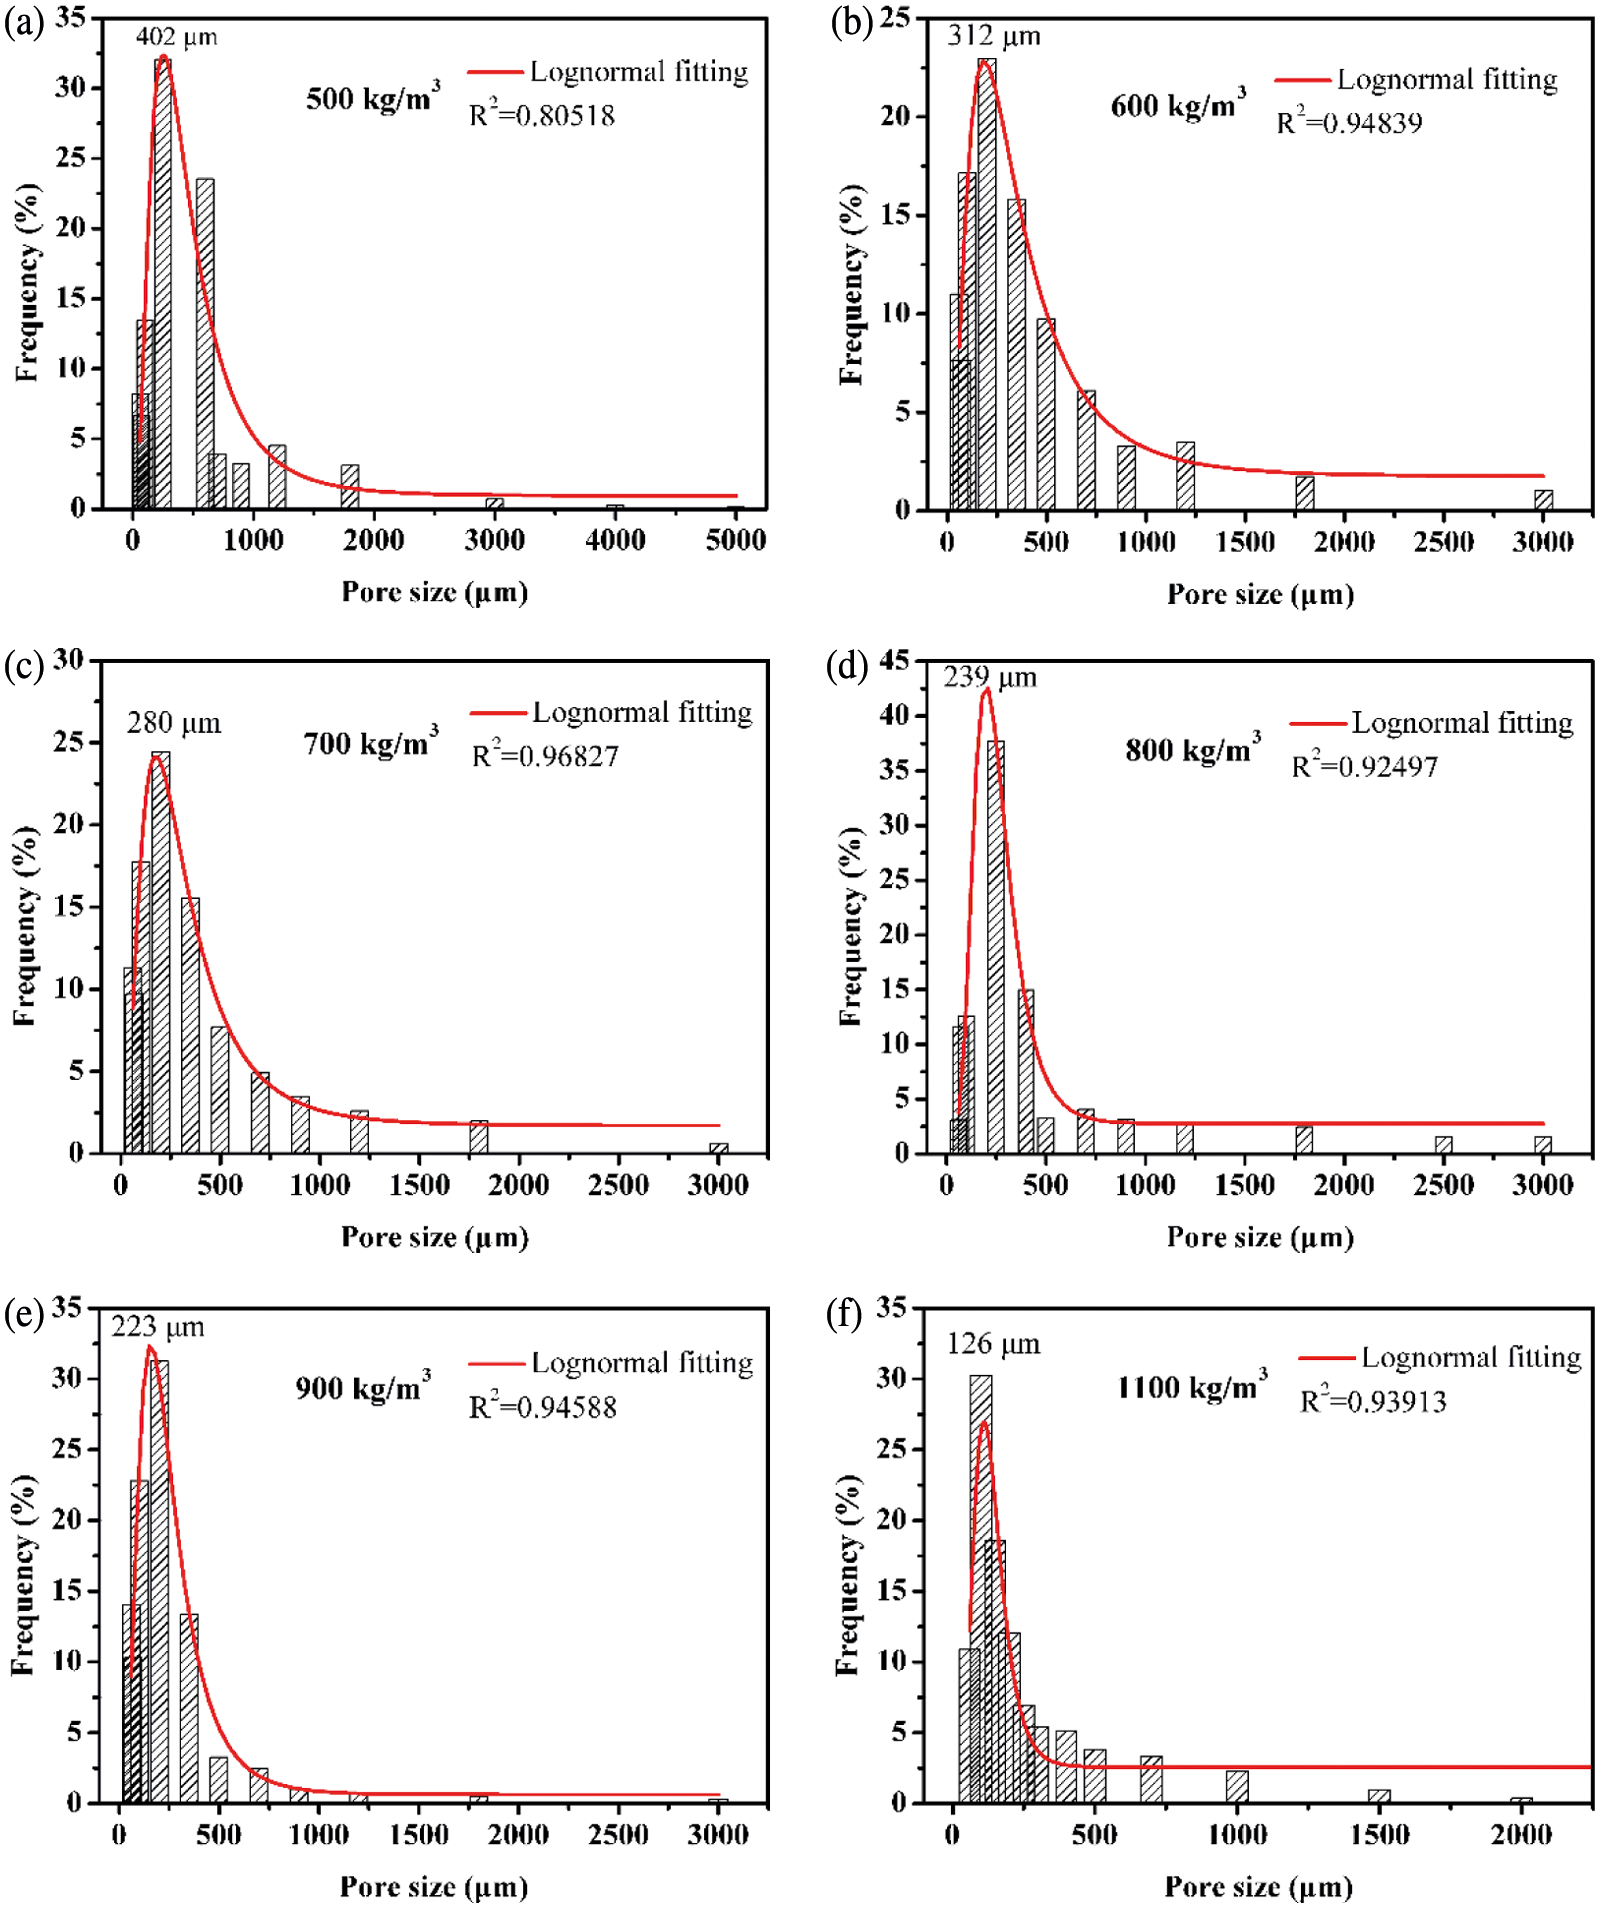
Figure 4: Pore size distributions of AAC with various density
The non-linear fitting of the pore distribution by Origin software shows that the pore size distribution in AAC is approximately log-normal. This distribution shows that most of the pores are concentrated in a certain interval, and a small number of large pores are caused by the overlap or merger between bubbles, which is similar to the pore size distribution of foamed concrete [35,36]. According to the fitting results, the probability density function of the pore distribution of AAC can be obtained, as shown in Eq. (2):
In the formula, μ and σ are the mean deviation and standard deviation, respectively. The fitting parameters of all densities of AAC are shown in Table 2.
3.3 Density and Compressive Strength of AAC
As presented in Fig. 5, the compressive strength of AAC declines linearly with density, which is consistent with previous results [3,6,37,38]. On the other hand, the density of porous concrete directly determines its porosity, so quantitatively determining the relation of strength to porosity has strong practical significance for its design and application. Among the analytical models that characterize the relation of compressive strength to porosity, the Balshin model [39] is the most widely used, and its expression is shown in Eq. (3):
where, σ is compressive strength; σ0 is compressive strength when the theoretical porosity is 0; ε is porosity; n is a constant.
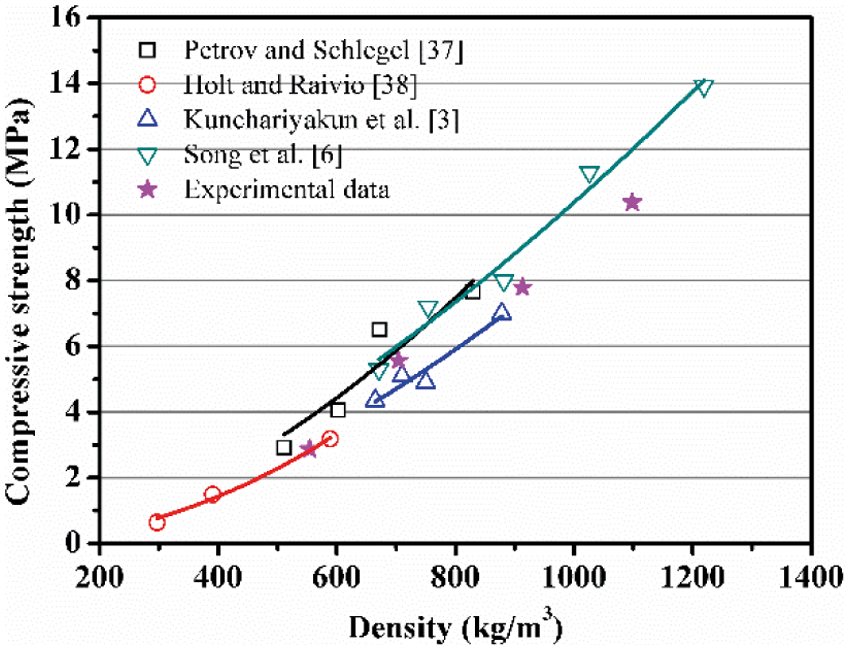
Figure 5: Compressive strength of AAC as a function of density: data summarized from literatures [3,6,37,38] and from our experiments
Fig. 6 displays the relation of compressive strength to porosity of AAC. By using the Balshin model, it can be concluded that n = 1.78 and the fitting coefficient is 0.99. Therefore, the Balshin model for AAC in this study can be described as:
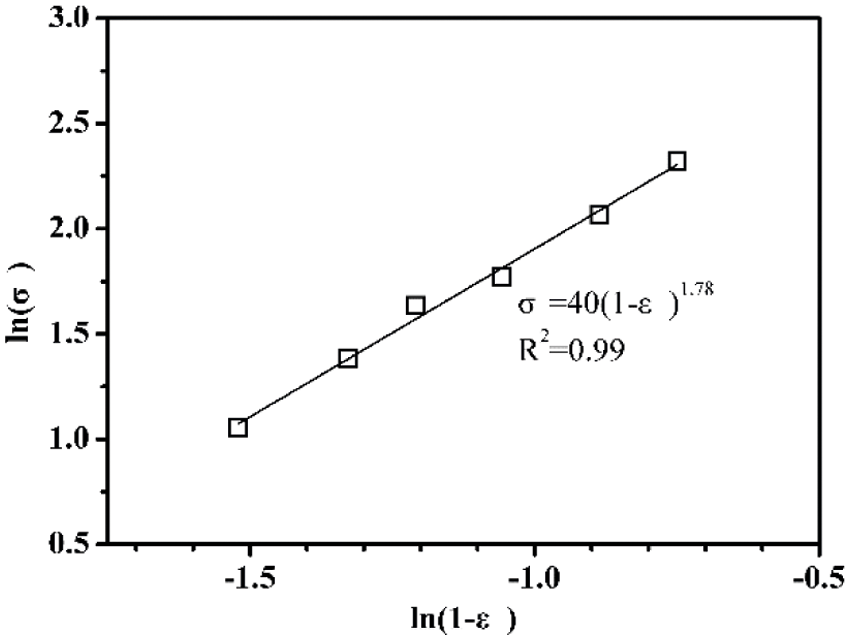
Figure 6: Compressive strength of AAC as a function of porosity
Besides, it can be derived from the above formula that the compressive strength of the dense matrix (without any pore) of AAC is 40 MPa. Of course, the compressive strength is also related to other factors except the porosity, for example, the capillary pores, gel pores, and the shape and pore size distribution [38].
In view of the effect of density on compressive strength, many researchers [4,40,41] proposed the specific strength (the ratio of compressive strength to density) as the evaluation index of the mechanical strength of AAC. It is observed from Fig. 7 that although the specific strength value varies with the density, the change trend with the MgO content is similar. The specific strength first increases and then reduces with the increasing MgO content, and the inflection point appears at MgO/(MgO + CaO) = 12%. For instance, when the MgO content is 12%, the specific strength of 600 kg/m3 AAC is increased by 10% and 5% for the autoclave temperature is 180°C and 210°C, respectively.
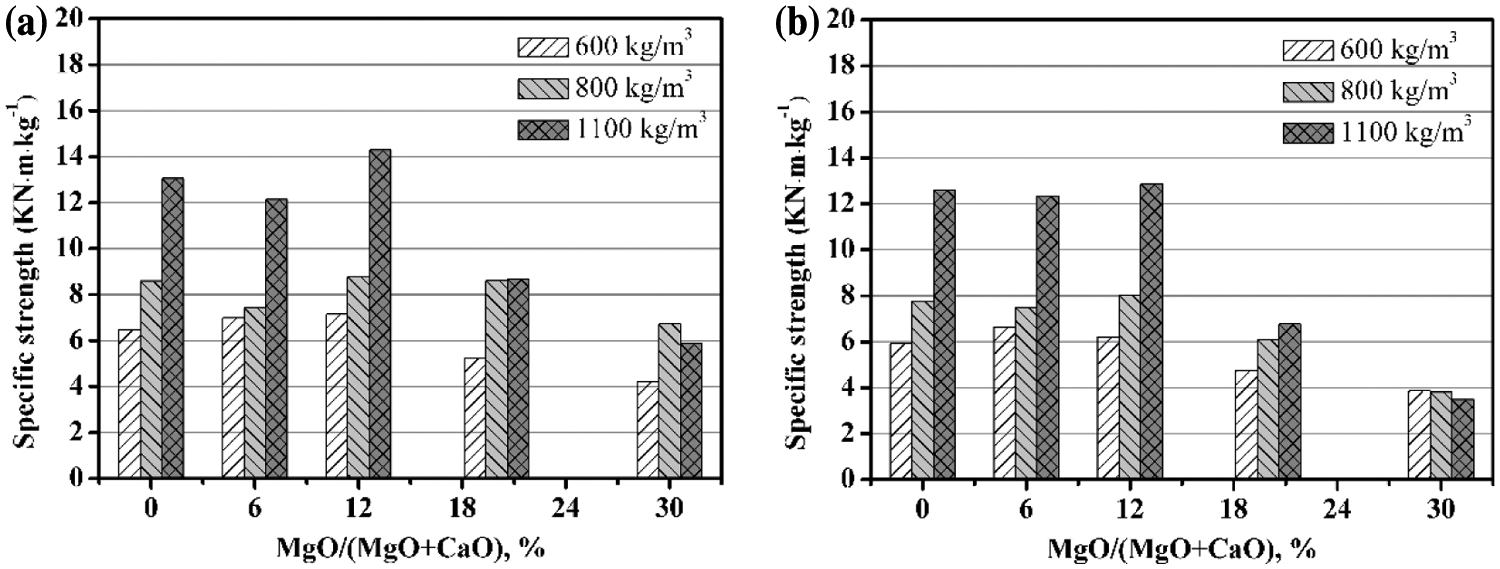
Figure 7: The specific strength of AAC with various MgO/(CaO + MgO) ratio: (a) 180°C, 9 h; (b) 210°C, 9 h
At the same time, it is found that when MgO/(MgO + CaO) < 12% and the autoclave temperature is 210°C, the specific strength is not much different from that at 180°C. However, when the MgO/(CaO + MgO) ratio is greater than 12%, the specific strength drops rapidly at a temperature of 210°C. This may be due to the fact that the content of Mg(OH)2 is higher than 180°C, and more microcracks are generated. Therefore, the optimal autoclave temperature of AAC is 180°C.
The strength mechanism of AAC is related to its hydration products, as identified by XRD. Fig. 8a shows that the tobermorite phase is distinguished at 2θ = 7.8°, 16.2°, 28.9° and 29.9°. By contrast, the tobermorite peaks become intense as the MgO content increases, indicating more tobermorite is formed. The aluminosilicate phase of katoite is formed, as confirmed by the diffraction peaks at 2θ = 17.5°, 20.3°, 28.8°, 32.3°, 39.9° and 45.2°. As the magnesium oxide content rises, the decreasing intensity of katoite peaks may be due to more formation of C-S-H. Obviously, the brucite peaks at 2θ = 18.5° and 37.9° are strengthened under higher MgO content. The additions of MgO may affect the environment in which katoite is formed, thereby causing the formation of katoite to be hindered or decomposed, so that releasing Si4+, Ca2+. Therefore, the increase of Si4+, Ca2+ concentration in the reaction system will promote the formation of C-S-H and the crystallization of tobermorite.
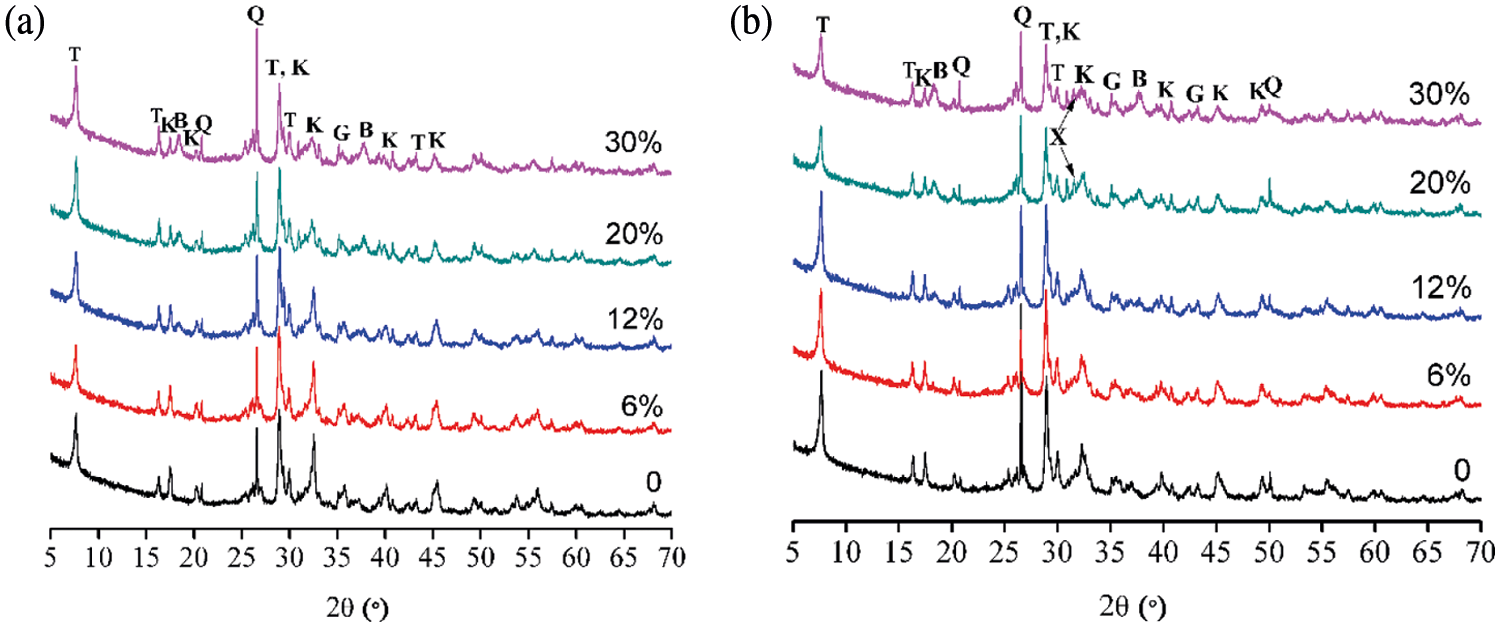
Figure 8: XRD patterns of AAC with various MgO/(CaO + MgO) ratio: (a) 180°C, 9 h; (b) 210°C, 9 h
Fig. 8b indicates that the tobermorite peaks are weakened with MgO content when the reaction temperature increases to 210°C. It is worth noting that xonotlite is detected at 2θ = 31.6° for the samples with MgO/(CaO + MgO) = 20%, 30%. The appearance of xonotlite suggests that tobermorite is recrystallized to xonotlite, as reported in previous investigation [42].
From the XRD analyses, MgO can promote the formation of hydration products under hydrothermal conditions, which is beneficial to improve the compressive strength. This is because that C-S-H gel and tobermorite are the main source of matrix strength of AAC [43]. However, the compressive strength significantly decreases in the presence of excessive MgO, which is mainly due to the volume expansion derived from the formation of brucite (Mg(OH)2).
Fig. 9 displays the micro-morphology of AAC. As shown in Fig. 9a, the plate-like crystals are assigned to tobermorite [44–46], which has a side length of approximately 1–2 μm. It is observed in Fig. 9b that the morphology of tobermorite phase seems to become smaller with the addition of magnesium oxide. Particularly, these slender shape of tobermorite crystals overlap with each other, then bringing more lapping joints, this may be beneficial to the mechanical strength of AAC.
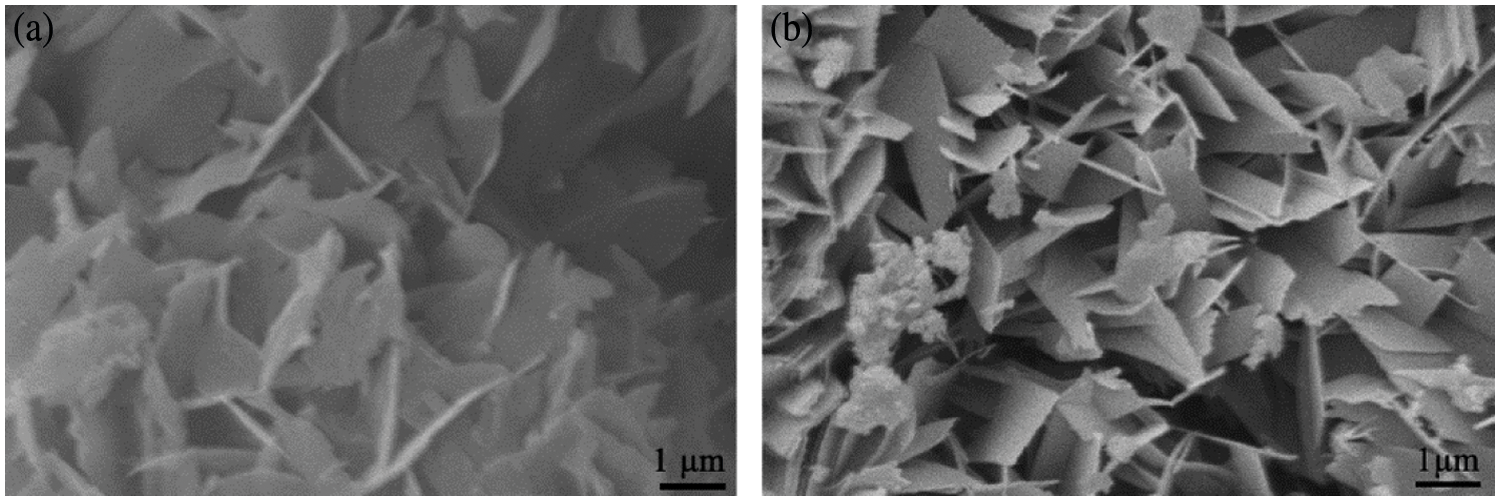
Figure 9: SEM images of AAC autoclaved at 180°C for 9 h: (a) MgO/(CaO + MgO) = 0; (b) MgO/(CaO + MgO) = 20%
Figs. 10 and 11 present the thermal properties of AAC with various MgO content at 180°C and 210°C, respectively. It is concluded that the thermal conductivity of AAC gradually rises with the magnesium oxide content. For instance, when the autoclave temperature is 180°C, the highest thermal conductivity of 600, 800, 1100 kg/m3 AAC is obtained at the MgO/(CaO + MgO) ratio of 30%, where the thermal conductivity is increased by 10%, 9%, 11%, respectively, compared to AAC. At 210°C, the thermal conductivity corresponding to the above three densities increases up to 14%, 5%, and 13%, respectively.
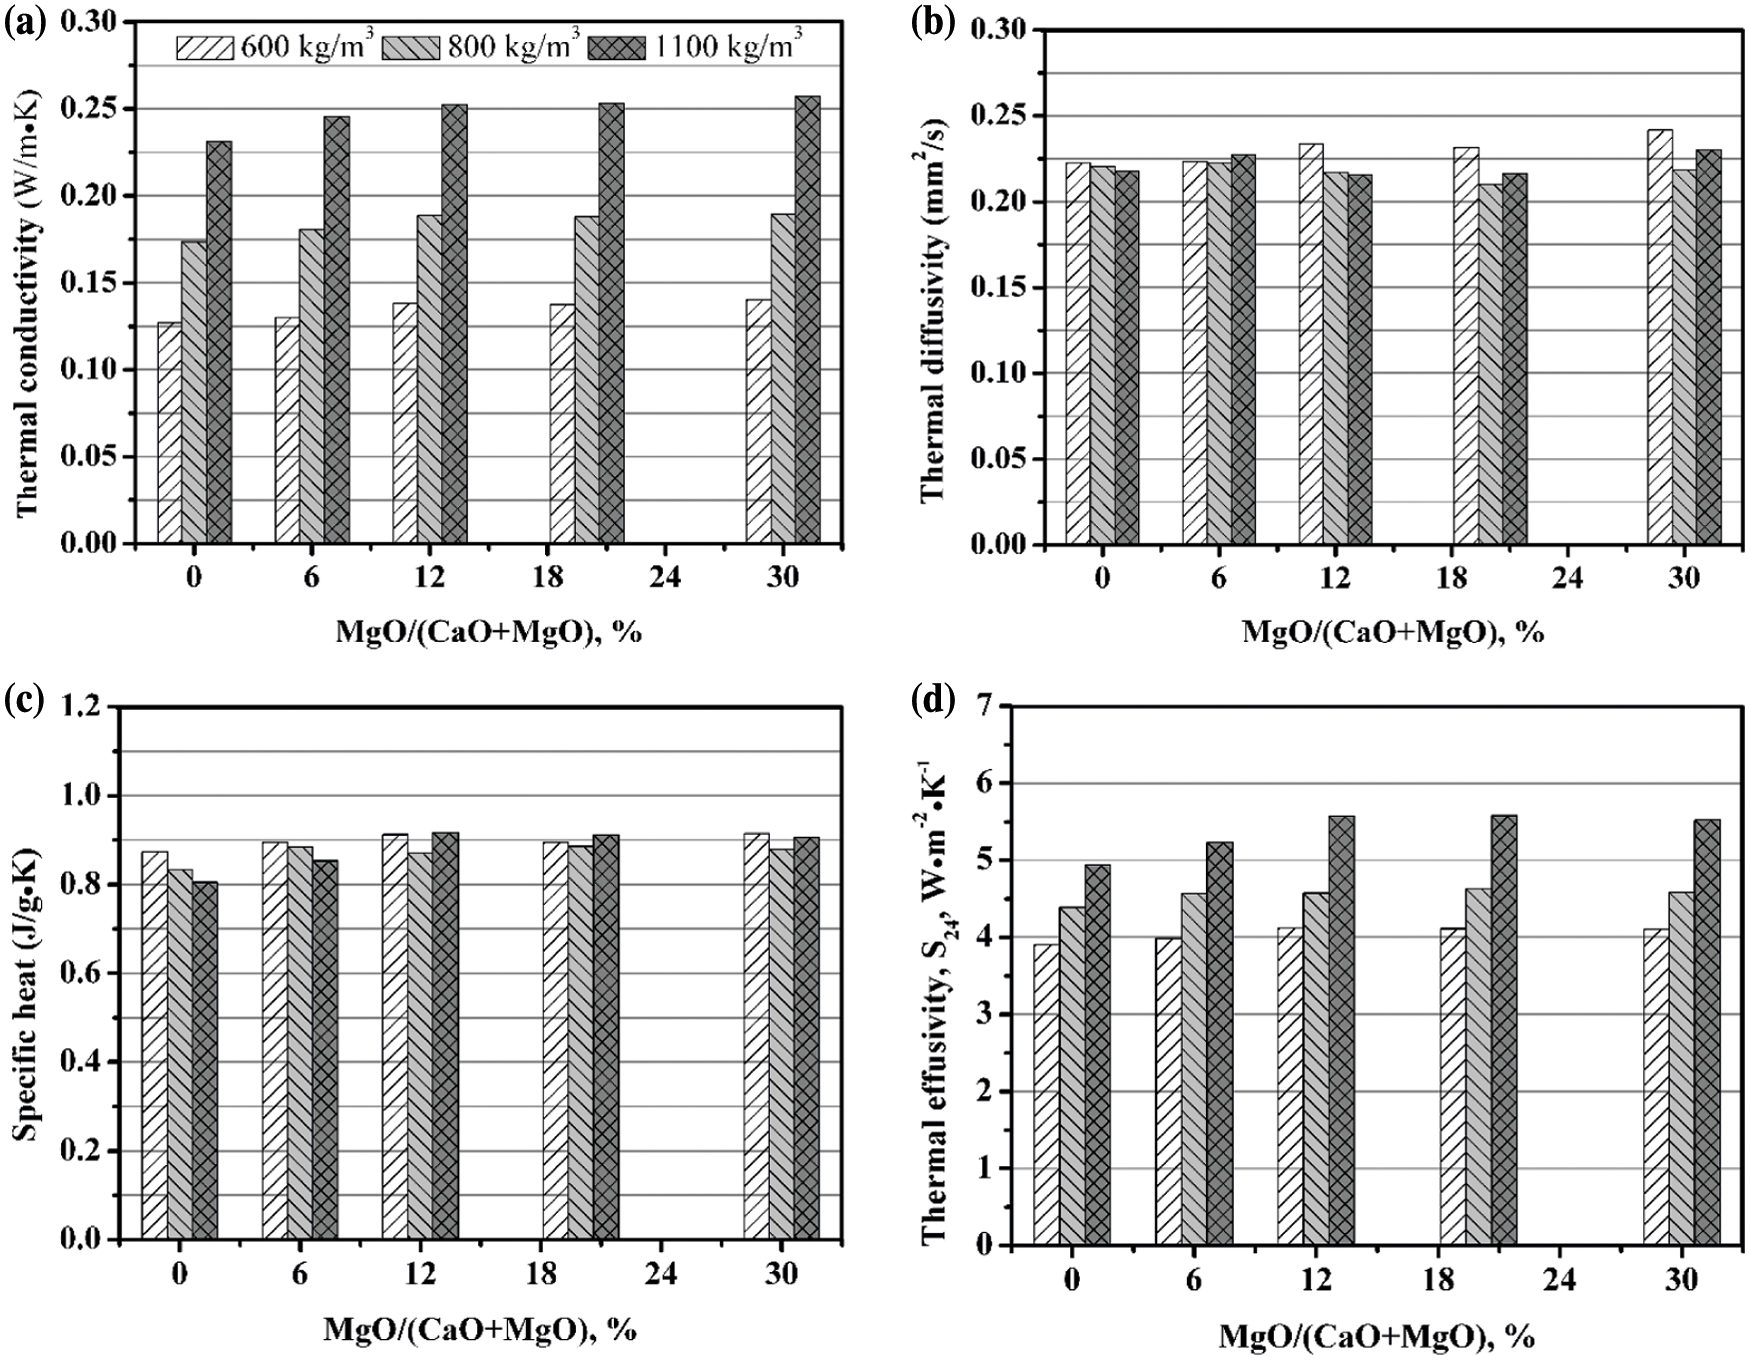
Figure 10: Thermal properties of AAC with various MgO/(CaO + MgO) ratio (180°C, 9 h): (a) Thermal conductivity; (b) Thermal diffusivity; (c) Specific heat; (d) Thermal effusivity
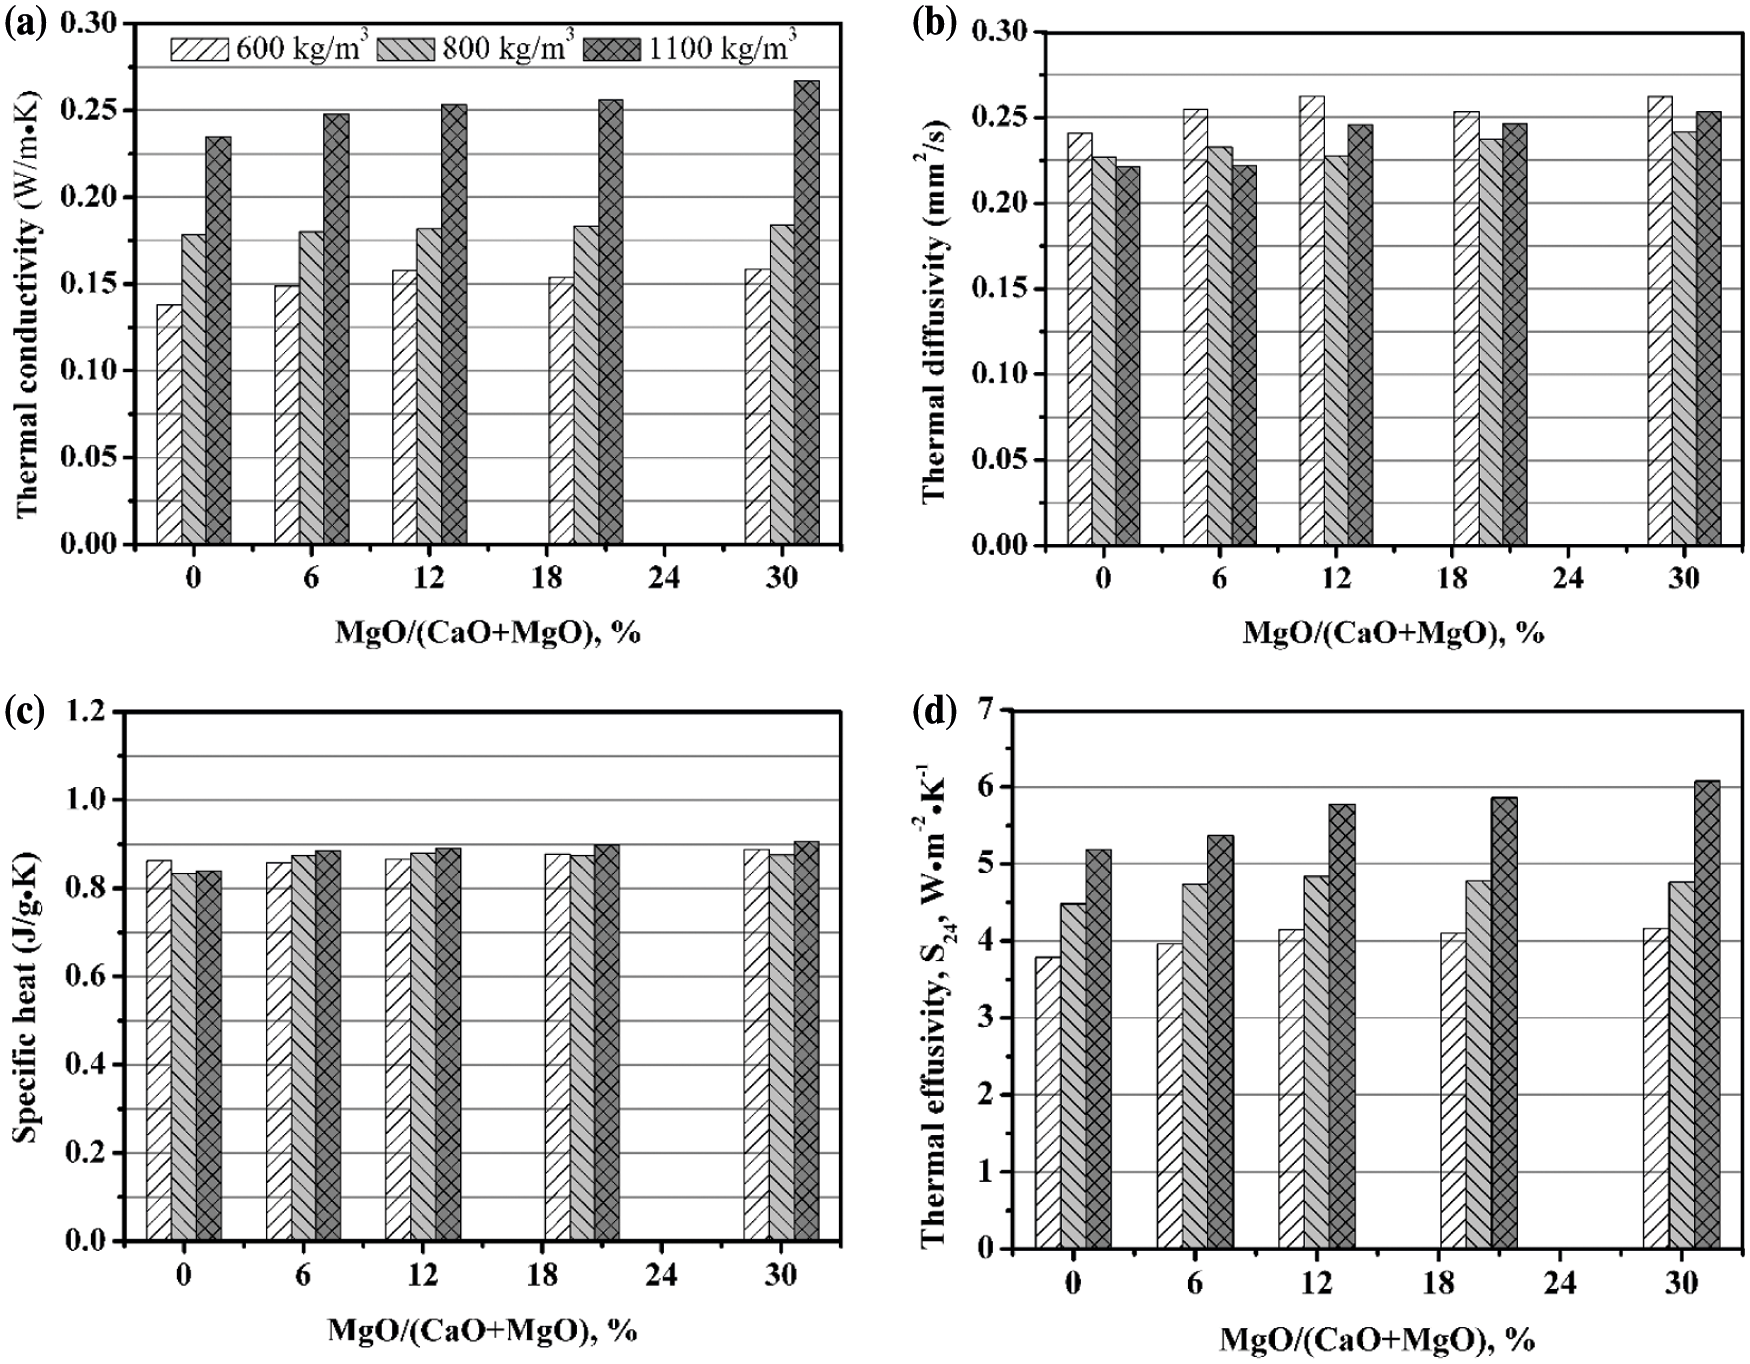
Figure 11: Thermal properties of AAC with various MgO/(CaO + MgO) ratio (210°C, 9 h): (a) Thermal conductivity; (b) Thermal diffusivity; (c) Specific heat; (d) Thermal effusivity
In comparison, MgO has a small effect on the thermal diffusivity. At 180°C, the thermal diffusivity is between 0.21 and 0.25 mm2/s. When the autoclave temperature is 210°C, the thermal diffusivity has a tendency to rise with the magnesium oxide content, and is between 0.22 and 0.27 mm2/s. The thermal diffusivity at 210°C is slightly larger than that at 180°C, which is consistent with the change of thermal conductivity with the autoclave temperature. This may be due to more formation and crystallization of hydration products in the matrix at high temperature, as confirmed in the XRD analyses. Therefore, the heat transfer is speeded up assisted by the increasing mean free path of phonons [47,48].
It is found that MgO can improve the specific heat of AAC to a certain extent. As the magnesium oxide content rises, the maximum increase rate of specific heat is 25%, 10% at 180°C, 210°C, respectively. According to the additivity principle of specific heat, this is caused by the fact that the specific heat of MgO (0.869 J⋅g−1⋅K−1) is greater than that of CaO (0.748 J⋅g−1⋅K−1) [49].
In addition, the thermal effusivity of AAC increases significantly after introduction of MgO. As the MgO content rises, the maximum increase rate of thermal effusivity is 10%, 17% at 180°C, 210°C, respectively. This is helpful to improve the ability of AAC blocks to resist external ambient temperature fluctuations.
Based on the design principle of AAC, different types of AAC were prepared. The relationship between the compositions of the AAC slurry and its expansion was investigated, and density, pore structure, compressive strength, and thermal properties were analyzed.
1. With the increase of the MgO content, the expansion rate of the AAC slurry is delayed. A reasonable amount (MgO/(CaO + MgO) < 20%) of MgO can help increase the specific strength of AAC. MgO can promote the formation of tobermorite, which is beneficial to improve the strength. However, the strength significantly decreases in the presence of excessive MgO.
2. The porosity of AAC has a positive correlation with the aluminum powder content, and varies from 15.69% to 61.82% as the aluminum powder content changes from 0.02% to 0.12%. The mean pore size gradually increases from 113 to 402 μm as the density declines from 1100 to 500 kg/m3. The maximum pore size increases from 2000 μm at 1100 kg/m3 to 5000 μm at 500 kg/m3, and the pore size distribution in AAC is approximately log-normal. The compressive strength of AAC is related with its density and porosity, which can be quantitatively described as: compressive strength = 40(1-porosity)1.78.
3. The thermal conductivity of AAC rises with the magnesium oxide content, and the increasing range also rises with the magnesium oxide content and autoclave temperature, but it basically has no effect on the thermal diffusion coefficient. MgO improves the specific heat and heat storage coefficient of AAC to a certain extent.
Funding Statement: This work is financially supported by National Natural Science Foundation of China (52002245), Natural Science Foundation of Guangdong (Nos. 2019A1515012172, 2021A1515010671), Key Platform and Major Scientific Research Project of Guangdong (No. 2018KQNCX232), Science and Technology Plan Project of Shaoguan (Nos. 2019sn057, 210726194533404), Scientific Research Projects of Shaoguan University (SY2020KJ12, SY2020KJ02, 408-99000623, 408-230083990402), Innovation and Entrepreneurship Program for College Students (S202110576030). The authors thank South China University of Technology for the supply of materials and measurements.
Conflicts of Interest: The authors declare that they have no conflicts of interest to report regarding the present study.
1. Yan, D., Hong, T. Z., Li, C., Zhang, Q., An, J. J. et al. (2017). A thorough assessment of China’s standard for energy consumption of buildings. Energy and Buildings, 143, 114–128. DOI 10.1016/j.enbuild.2017.03.019. [Google Scholar] [CrossRef]
2. Shi, J. Y., Liu, B. J., He, Z. H., Liu, Y. C., Jiang, J. Y. et al. (2021). A green ultra-lightweight chemically foamed concrete for building exterior: A feasibility study. Journal of Cleaner Production, 288, 125085. DOI 10.1016/j.jclepro.2020.125085. [Google Scholar] [CrossRef]
3. Kunchariyakun, K., Asavapisit, S., Sombatsompop, K. (2015). Properties of autoclaved aerated concrete incorporating rice husk ash as partial replacement for fine aggregate. Cement and Concrete Composites, 55, 11–16. DOI 10.1016/j.cemconcomp.2014.07.021. [Google Scholar] [CrossRef]
4. Rong, H., Zhang, J., Zhang, Y., Yang, Y., Shang, W. (2021). Foaming mechanism of microbial foaming agent and its application in foam concrete. Journal of Building Materials, 24(2), 419–426. DOI 10.3969/j.issn.1007-9629.2021.02.027. [Google Scholar] [CrossRef]
5. Qu, X. L., Zhao, X. G. (2017). Previous and present investigations on the components, microstructure and main properties of autoclaved aerated concrete–A review. Construction and Building Materials, 135, 505–516. DOI 10.1016/j.conbuildmat.2016.12.208. [Google Scholar] [CrossRef]
6. Song, Y., Li, B., Yang, E. H., Liu, Y. Q., Ding, T. (2015). Feasibility study on utilization of municipal solid waste incineration bottom ash as aerating agent for the production of autoclaved aerated concrete. Cement and Concrete Composites, 56, 51–58. DOI 10.1016/j.cemconcomp.2014.11.006. [Google Scholar] [CrossRef]
7. Mostafa, N. Y. (2005). Influence of air-cooled slag on physicochemical properties of autoclaved aerated concrete. Cement and Concrete Research, 35(7), 1349–1357. DOI 10.1016/j.cemconres.2004.10.011. [Google Scholar] [CrossRef]
8. Wongkeo, W., Chaipanich, A. (2010). Compressive strength, microstructure and thermal analysis of autoclaved and air cured structural lightweight concrete made with coal bottom ash and silica fume. Materials Science and Engineering A, 527(16), 3676–3684. DOI 10.1016/j.msea.2010.01.089. [Google Scholar] [CrossRef]
9. Thongtha, A., Maneewan, S., Punlek, C., Ungkoon, Y. (2014). Investigation of the compressive strength, time lags and decrement factors of AAC-lightweight concrete containing sugar sediment waste. Energy and Buildings, 84(4), 516–525. DOI 10.1016/j.enbuild.2014.08.026. [Google Scholar] [CrossRef]
10. Bonakdar, A., Babbitt, F., Mobasher, B. (2013). Physical and mechanical characterization of fiber-reinforced aerated concrete (FRAC). Cement and Concrete Composites, 38(4), 82–91. DOI 10.1016/j.cemconcomp.2013.03.006. [Google Scholar] [CrossRef]
11. Karakurt, C., Kurama, H., Topçu, İ. B. (2010). Utilization of natural zeolite in aerated concrete production. Cement and Concrete Composites, 32(1), 1–8. DOI 10.1016/j.cemconcomp.2009.10.002. [Google Scholar] [CrossRef]
12. Alexanderson, J. (1979). Relations between structure and mechanical properties of autoclaved aerated concrete. Cement and Concrete Research, 9(4), 507–514. DOI 10.1016/0008-8846(79)90049-8. [Google Scholar] [CrossRef]
13. Isu, N., Ishida, H., Mitsuda, T. (1995). Influence of quartz particle size on the chemical and mechanical properties of autoclaved aerated concrete (I) tobermorite formation. Cement and Concrete Research, 25(2), 243–248. DOI 10.1016/0008-8846(95)00003-8. [Google Scholar] [CrossRef]
14. Isu, N., Teramura, S., Ishida, H. (1995). Influence of quartz particle size on the chemical and mechanical properties of autoclaved aerated concrete (II) fracture toughness, strength and micropore. Cement and Concrete Research, 25(2), 249–254. DOI 10.1016/0008-8846(95)00004-6. [Google Scholar] [CrossRef]
15. Isu, N., Sasaki, K., Ishida, H. (1994). Mechanical property evolution during autoclaving process of aerated concrete using slag: I, tobermorite formation and reaction behavior of slag. Journal of the American Ceramic Society, 77(8), 2088–2092. DOI 10.1111/j.1151-2916.1994.tb07101.x. [Google Scholar] [CrossRef]
16. Yan, B. L., Wang, L. Z., Xiao, Z. M., Liu, C., Zhang, Q. Y. et al. (2007). GB/T 175, Common Portland Cement. [Google Scholar]
17. Hwang, C. L., Vo, D. H., Tran, V. A., Yehualaw, M. D. (2018). Effect of high MgO content on the performance of alkali-activated fine slag under water and air curing conditions. Construction and Building Materials, 186, 503–513. DOI 10.1016/j.conbuildmat.2018.07.129. [Google Scholar] [CrossRef]
18. Park, S., Park, H. M., Yoon, H. N., Seo, J., Yang, C. M. et al. (2020). Hydration kinetics and products of MgO-activated blast furnace slag. Construction and Building Materials, 249, 118700. DOI 10.1016/j.conbuildmat.2020.118700. [Google Scholar] [CrossRef]
19. Yi, Y., Liska, M., Al-Tabbaa, A. (2014). Properties of two model soils stabilized with different blends and contents of GGBS, MgO, lime, and PC. Journal of Materials in Civil Engineering, 26(2), 267–274. DOI 10.1061/(ASCE)MT.1943-5533.0000806. [Google Scholar] [CrossRef]
20. Al-Tabbaa, A., Liska, M., Yi, Y. (2013). Properties and microstructure of GGBS-magnesia pastes. Advances in Cement Research, 26(2), 114–122. DOI 10.1680/adcr.13.00005. [Google Scholar] [CrossRef]
21. BenHaha, M., Lothenbach, B., Le Saout, G., Winnefeld, F.(2011). Influence of slag chemistry on the hydration of alkali-activated blast-furnace slag-part I: Effect of MgO. Cement and Concrete Research, 419, 955–963. DOI 10.1016/j.cemconres.2011.05.002. [Google Scholar] [CrossRef]
22. Jin, F., Gu, K., Al-Tabbaa, A. (2015). Strength and hydration properties of reactive MgO-activated ground granulated blastfurnace slag paste. Cement and Concrete Composites, 57, 8–16. DOI 10.1016/j.cemconcomp.2014.10.007. [Google Scholar] [CrossRef]
23. Jin, F., Gu, K., Abdollahzadeh, A. (2015). Effects of different reactive MgOs on the hydration of MgO-activated GGBS paste. Journal of Materials in Civil Engineering, 27(7), B4014001. DOI 10.1061/(ASCE)MT.1943-5533.0001009. [Google Scholar] [CrossRef]
24. Ali, M. M., Mullick, A. K. (1998). Volume stabilisation of high MgO cement: Effect of curing conditions and fly ash addition. Cement and Concrete Research, 28(11), 1585–1594. DOI 10.1016/S0008-8846(98)00140-9. [Google Scholar] [CrossRef]
25. Nakagawa, Z., White, E. L., Roy, D. M. (1983). Rheological and physical properties of magesium oxide and silica fume-modified cement mortars cured at high temperature. MRS Online Proceedings Library, 15, 1–5. DOI 10.1557/PROC-15-97. [Google Scholar] [CrossRef]
26. Tang, Y. J., Chen, W. (2020). Effect of magnesium on the structure and chemical composition of calcium silicate hydrate at elevated temperature. Construction and Building Materials, 240, 117925. DOI 10.1016/j.conbuildmat.2019.117925. [Google Scholar] [CrossRef]
27. Bernard, E., Lothenbach, B., Chlique, C. (2019). Characterization of magnesium silicate hydrate (M-S-H). Cement and Concrete Research, 116, 309–330. DOI 10.1016/j.cemconres.2018.09.007. [Google Scholar] [CrossRef]
28. Bernard, E., Lothenbach, B., Goff, F. L. (2017). Effect of magnesium on calcium silicate hydrate (C-S-H). Cement and Concrete Research, 97, 61–72. DOI 10.1016/j.cemconres.2017.03.012. [Google Scholar] [CrossRef]
29. Mostafa, N. Y., Kishar, E. A., Abo-El-Enein, S. A. (2009). FTIR study and cation exchange capacity of Fe3+ and Mg2+ substituted calcium silicate hydrates. Journal of Alloys and Compounds, 473(1–2), 538–542. DOI 10.1016/j.jallcom.2008.06.029. [Google Scholar] [CrossRef]
30. Fernandez, L., Alonso, C., Andrade, C. (2008). The interaction of magnesium in hydration of C3S and CSH formation using 29Si MAS-NMR. Journal of Materials Science, 43, 5772–5783. DOI 10.1007/s10853-008-2889-2. [Google Scholar] [CrossRef]
31. Jiang, Y., Su, Y. F., Bao, J. H., Qi, Z. G., Cheng, A. N. et al. (2008). GB/T 11969. Test Methods of Autoclaved Aerated Concrete. [Google Scholar]
32. Hoff, G. C. (1972). Porosity-strength considerations for cellular concrete. Cement and Concrete Research, 2(1), 91–100. DOI 10.1016/0008-8846(72)90026-9. [Google Scholar] [CrossRef]
33. Hilal, A. A., Thom, N. H., Dawson, A. R. (2015). On entrained pore size distribution of foamed concrete. Construction and Building Materials, 75, 227–233. DOI 10.1016/j.conbuildmat.2014.09.117. [Google Scholar] [CrossRef]
34. Nambiar, E. K. K., Ramamurthy, K. (2007). Air-void characterisation of foam concrete. Cement and Concrete Research, 37(2), 221–230. DOI 10.1016/j.cemconres.2006.10.009. [Google Scholar] [CrossRef]
35. She, W., Chen, Y., Zhang, Y., Jones, M. R. (2013). Characterization and simulation of microstructure and thermal properties of foamed concrete. Construction and Building Materials, 47(10), 1278–1291. DOI 10.1016/j.conbuildmat.2013.06.027. [Google Scholar] [CrossRef]
36. Korat, L., Ducman, V., Legat, A., Mirtič, B. (2013). Characterisation of the pore-forming process in lightweight aggregate based on silica sludge by means of X-ray micro-tomography (micro-CT) and mercury intrusion porosimetry (MIP). Ceramics International, 39(6), 6997–7005. DOI 10.1016/j.ceramint.2013.02.037. [Google Scholar] [CrossRef]
37. Petrov, I., Schlegel, E. (1994). Application of automatic image analysis for the investigation of autoclaved aerated concrete structure. Cement and Concrete Research, 24(5), 830–840. DOI 10.1016/0008-8846(94)90003-5. [Google Scholar] [CrossRef]
38. Holt, E., Raivio, P. (2005). Use of gasification residues in aerated autoclaved concrete. Cement and Concrete Research, 35(4), 796–802. DOI 10.1016/j.cemconres.2004.05.005. [Google Scholar] [CrossRef]
39. Tada, S. (1986). Material design of aerated concrete-an optimum performance design. Materials and Structures, 19(1), 21–26. DOI 10.1007/BF02472306. [Google Scholar] [CrossRef]
40. Ma, B. G., Cai, L. X., Li, X. G., Jian, S. W. (2016). Utilization of iron tailings as substitute in autoclaved aerated concrete: Physico-mechanical and microstructure of hydration products. Journal of Cleaner Production, 127, 162–171. DOI 10.1016/j.jclepro.2016.03.172. [Google Scholar] [CrossRef]
41. Cong, X. Y., Lu, S., Yao, Y., Wang, Z. (2016). Fabrication and characterization of self-ignition coal gangue autoclaved aerated concrete. Materials and Design, 97, 155–162. DOI 10.1016/j.matdes.2016.02.068. [Google Scholar] [CrossRef]
42. Smalakys, G., Siauciunas, R. (2018). The synthesis of 1.13 nm tobermorite from carbonated opoka. Journal of Thermal Analysis and Calorimetry, 134, 493–502. DOI 10.1007/s10973-018-7418-1. [Google Scholar] [CrossRef]
43. Różycka, A., Pichór, W. (2016). Effect of perlite waste addition on the properties of autoclaved aerated concrete. Construction and Building Materials, 120, 65–71. DOI 10.1016/j.conbuildmat.2016.05.019. [Google Scholar] [CrossRef]
44. Maeda, H., Ishida, E. H., Kasuga, T. (2012). Hydrothermal preparation of tobermorite incorporating phosphate species. Materials Letters, 68, 382–384. DOI 10.1016/j.matlet.2011.11.017. [Google Scholar] [CrossRef]
45. He, X. Y., Zheng, Z. Q., Yang, J., Su, Y., Wang, T. W. et al. (2020). Feasibility of incorporating autoclaved aerated concrete waste for cement replacement in sustainable building materials. Journal of Cleaner Production, 250, 119455. DOI 10.1016/j.jclepro.2019.119455. [Google Scholar] [CrossRef]
46. Yang, J., Zeng, J. J., He, X. Y., Hu, H. C., Su, Y. et al. (2021). Eco-friendly UHPC prepared from high volume wet-grinded ultrafine GGBS slurry. Construction and Building Materials, 308, 125057. DOI 10.1016/j.conbuildmat.2021.125057. [Google Scholar] [CrossRef]
47. Topçu, İ. B., Uygunoğlu, T. (2007). Properties of autoclaved lightweight aggregate concrete. Building and Environment, 42(12), 4108–4116. DOI 10.1016/j.buildenv.2006.11.024. [Google Scholar] [CrossRef]
48. Grandjean, S., Absi, J., Smith, D. S. (2006). Numerical calculations of the thermal conductivity of porous ceramics based on micrographs. Journal of the European Ceramic Society, 26(13), 2669–2676. DOI 10.1016/j.jeurceramsoc.2005.07.061. [Google Scholar] [CrossRef]
49. Xi, T. G. (1981). Thermophysical properties of inorganic materials (in Chinese). Shanghai: Shanghai Science and Technology Press. [Google Scholar]
 | This work is licensed under a Creative Commons Attribution 4.0 International License, which permits unrestricted use, distribution, and reproduction in any medium, provided the original work is properly cited. |