| Journal of Renewable Materials |
DOI: 10.32604/jrm.2022.020681
ARTICLE
Measurement and Analysis of Three-Dimensional Surface Topography of Sawn Timber Based on Scanning Probe Method
1Jiangsu Co-Innovation Center of Efficient Processing and Utilization of Forest Resources, College of Materials Science and Technology, Nanjing Forestry University, Nanjing, 210037, China
2College of Civil Engineering, Nanjing Forestry University, Nanjing, 210037, China
3College of Mechanical and Electronic Engineering, Nanjing Forestry University, Nanjing, 210037, China
*Corresponding Author: Zheng Wang. Email: wangzheng63258@163.com
Received: 06 December 2021; Accepted: 18 January 2022
Abstract: In order to explore the characteristics of the three-dimensional surface morphology of sawn timber, a three-dimensional wood surface morphology tester based on the scanning probe method and the principle of atomic force microscope was used to test the three-dimensional surface morphology of three kinds of sawn timber and calculate its surface roughness. This study also analyzed the reasonable plan for the value of wood surface roughness and the advantages of the three-dimensional shape tester, as well as the influence of tree species, three sections, air-dry density and other factors on the surface roughness of the specimen after mechanical processing. The results have shown that it is a more appropriate method to select the calculated values of Sa and Sq as the evaluation of the surface roughness of wood with random surface characteristics. The three-dimensional wood surface topography tester can efficiently, conveniently and accurately display the three-dimensional topography of wood at a micron-level resolution, and is characterized by high efficiency and good durability. The three-dimensional surface morphology characteristics of the three sawn woods correspond to their roughness. The surface roughness of woods is arranged as follows: Sitka spruce > Larch > Beech. For the same tree species, the roughness of the corresponding section after sawing is as follows: chordwise section > crosswise section > radial section. The radial section has lower roughness than the other surfaces. The surface roughness of the wood after sawing is mainly related to its air-dry density. The above is intended to provide a useful reference for the application of measuring and evaluating the surface roughness of sawn timber using the three-dimensional surface topography test method.
Keywords: Scanning probe; sawn timber; three-dimensional topography test; surface roughness
As a green and renewable material, wood has excellent decoration, structure and beauty, and has been widely used in decoration, construction, shipping, packaging and other fields [1–5]. Currently, wood processing is mainly based on mechanical sawing technology, which can be low-cost and efficient to perform a variety of conventional production operations. Among them, circular saw processing occupies a very important position. Its structure is simple and all inertial forces are fully balanced. Even if the feed speed is too high, the processing quality of the wood surface can be guaranteed [6,7]. The characteristic parameters of wood surface morphology are important indices for evaluating the surface quality of wood, which significantly affect the quality of appearance, bonding strength and performance of surface finishing wood. Therefore, it is very important to test and study the three-dimensional surface topography of sawn wood [8–12].
Currently, research into the surface morphology of wood mainly includes the probe method and the optical method. Due to the anisotropy, variability and porosity of wood, both the probe method and the optical method have their limitations [13–16]. For example, the probe method takes a long time and the structure is more complicated. Although optical method is a non-contact measurement and has high accuracy, the high cost of the instrument largely restricts its practical application. In addition, the study of the surface morphology of wood is usually carried out in two dimensions, which can only reflect the roughness of the surface on a straight line, and lacks a general intuitive comparison. In 2011, Nzokou et al. used the surface profilometer system (RC 4000 type) manufactured by Hommel America to evaluate the changes in the wood surface after weathering. The wood surface was swept with a 25 mm stylus, the relevant data were recorded and the roughness parameters were calculated [17]. In 2014, Tolvaj et al. used a fast optical method to clarify the intensity of wood surface roughness caused by light radiation. With this new baseline shift method, the small changes in roughness caused by the leaching effect of water can be visualized and determined [18]. In 2020, Baradit et al. performed a two-dimensional test of wood surface roughness using speckle interferometry. The results show that the system performance of speckle interferometry in terms of spatial and temporal resolution can be improved by using a large-area CCD/CMOS sensor [19].
Compared with the above-mentioned two-dimensional test methods which can only reflect the surface roughness of the test object on a single straight line, the three-dimensional surface topography test can intuitively and efficiently reflect the topography and roughness of the material. Since it is an anisotropic material, the surface quality of wood can be effectively determined. In 2005, Temiz et al. used electrical contact (stylus) instruments according to DIN 4768 to test the surface roughness of accelerated aging anticorrosive wood [20]. In 2013, Zhong et al. used a stylus profiler and a 3D image analyzer to determine the surface roughness of boards commonly used in furniture industry, such as particleboard, medium density fiberboard (MDF), and plywood. The results showed that these two methods could evaluate the surface quality of samples well and provide objective values [21].
In this paper, the three-dimensional wood surface topography tester based on the scanning probe method was used to test the three-dimensional surface topography of three types of wood truncated with a circular saw with selected working parameters. The surface roughness of Sitka spruce, Larch and Beech was determined. The best expression method of surface roughness value and the advantages and characteristics of three-dimensional profiler were analyzed and pointed out, as well as the influence of tree species, three sections, air-dry density and other factors on the surface roughness of sawed specimens. This paper is expected to provide a reference for the application of the three-dimensional wood surface topography tester in wood processing.
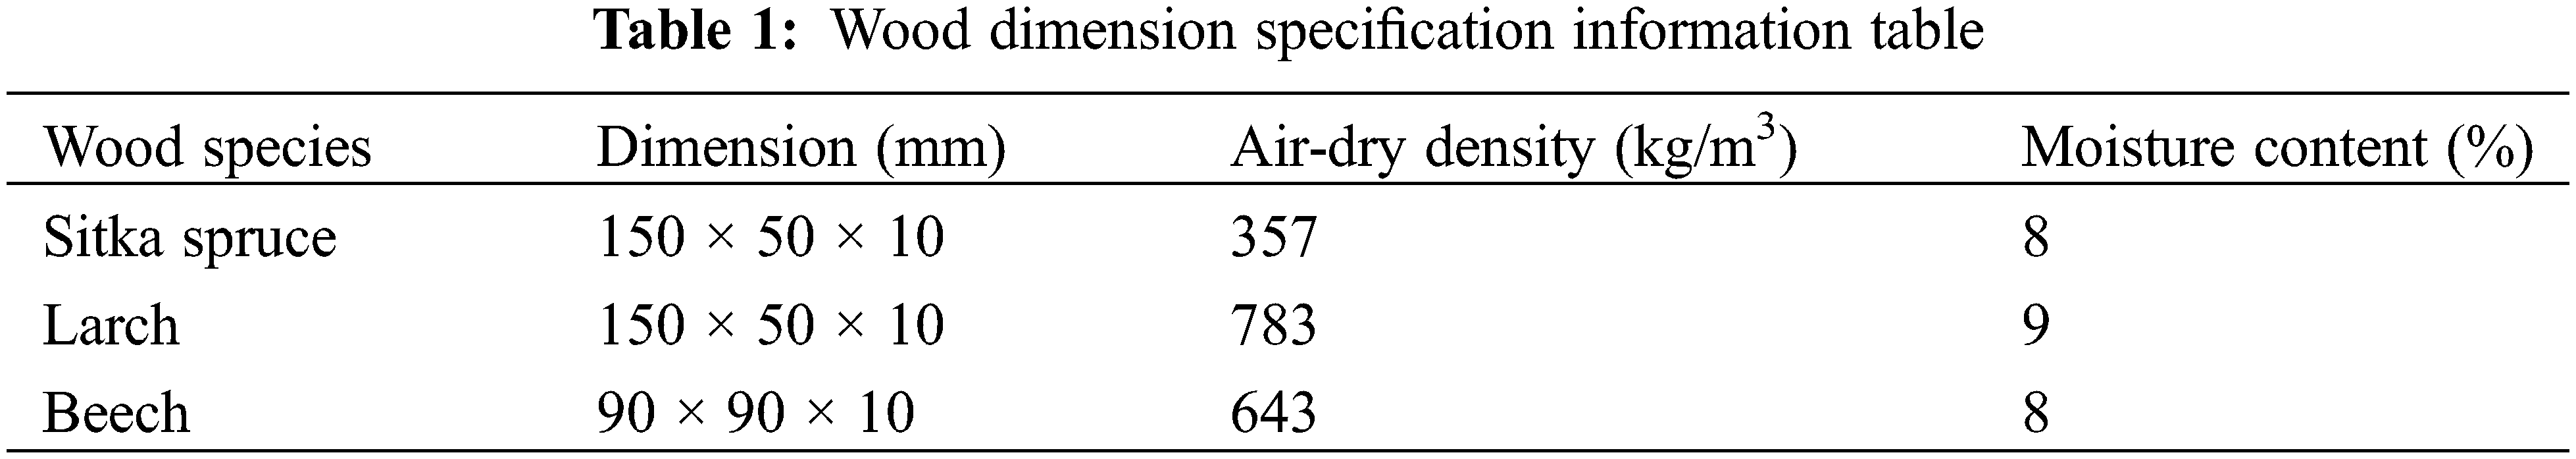
Three wood species from different tree species were selected for this study. Sitka spruce (Picea spp.) is produced in the United States. Larch (Larix gmelinii (Rupr.) Kuzen.) is produced in the Greater Khingan Range, China. Beech (Fagus longipetiolata) is produced in North America. The dimensions, air-dry density and moisture content of woods are shown in Table 1. Three species of wood were sawn to obtain a crosswise section, radial section and chordwise section. Sitka spruce was numbered X, Larch was numbered L, and Beech was numbered S. Among them, the numbers 1, 2, and 3 of the letter suffixes represented the radial section, chordal section, and cross section of the samples.
A test equipment set for the three-dimensional topography of the wood surface is used. The system is composed of a module laser, two fine-tuning reflectors, a cantilever probe, a CCD charge-coupled element and a three-dimensional stage. Each fine-tuning reflector which is connected to the outer frame of the reflector through small iron rods is composed of 4 mm steel balls and four tension springs. The fine-tuning of the reflector is done by screwing on the bolts. The cantilever probe adopts a tip with a diameter of 300 nm. The scanning speed is 1~10 s per measuring point, which is depending on the flatness of the measuring point. The CCD is powered by a 3.3 V DC power supply. Pin 4 (φM) is used as an input working signal of the CCD and is connected to a clock frequency of 2 MHz. The running accuracy of the X- and Y-axes of the three-dimensional stage can reach 0.625 μm, and the running accuracy of the Z-axis can reach 0.0184 μm. The instrument meets the accuracy requirements after the surface roughness comparison sample test. It has the characteristics of faster signal transmission rate, good operability, stable system operation, and high durability. It is suitable for three-dimensional topography testing of micron-level wood surfaces, as shown in Fig. 1. An HK-30 wood moisture meter is used (Shenzhen Jumaoyuan Technology Co., Ltd., China). An MJ164A circular saw machine is used, and the feeding speed range is 500–2400 mm/min. Wood sawing direction is longitudinal. The parameters of the circular saw blade include an outer diameter of 300 mm, a mounting aperture of 30 mm, a blade thickness of 3.2 mm, and a number of teeth of 70. The tooth type is T-shaped, and the working speed is 1000 RPM.

Figure 1: Three-dimensional wood surface topography tester
3 Test Principle and Main Steps
The test principle of the three-dimensional wood surface topography tester used in this experiment was modified and designed based on the principle of atomic force microscope. The test principle is:
By outputting a fixed number of pulses, the stepper motors are controlled in the X-axis and Y-axis directions to reach the position of the sample to be detected, and the Z-axis slowly ascends, recording the number of ascending pulses. During the ascent, the surface of the sample eventually touches the probe with the micro cantilever, causing the micro cantilever to generate a repulsive force on the surface of the sample. This tiny repulsive force is detected by the optical sensor after being amplified by the optical structure of the principle of multi-level optical lever amplification. The optical sensor has a significant difference between the optical signal when the sample and the probe are in contact and when they are not. When the difference occurs, the pulse number of Z-axis at this time is recorded, the height of Z-axis rise is restored according to the pulse number, and the information is transmitted to the upper computer. The upper computer draws the three-dimensional surface topography under the microscopic view according to the adjustment values of the X-, Y- and Z-axes. Based on this information, some parameter values for surface characteristics evaluation can be calculated to obtain a more concrete and vivid understanding of the three-dimensional topography characteristics of the surface of the measured object. The test principle of the profiler is shown in Fig. 2.

Figure 2: Test principle of the profiler
First, the personal computer and the instrument platform are connected with a USB cable, and the 3D scanning measurement executable file is opened. Secondly, the graphical operation interface is opened. When the USB status is connected, “Sampling/Lofting” is clicked, the sample to be tested is placed and the coordinates set. By the way of operating the corresponding software, the platform is moved to the detection position of the sample. The specific detection parameters are set in the main interface. Specifically, the test section dimension is set to 1250 μm × 1250 μm, the resolution is set to 100 × 100, and then the starting scan coordinates are recorded. Thirdly, the thumb screws behind the reflector A are adjusted so that the reflected light spot from the reflector falls on the front end of the micro cantilever. The thumb screw of the reflector B is adjusted so the reflected light point of the reflector is at 1/3 of the CCD. After the above procedures are completed, the conversion period, exposure period and reference value are adjusted to facilitate determine the current light spot position, until the three-dimensional profile scan is completed. An overview of the test process is shown in Fig. 3.

Figure 3: Overview of the test process
As the unit places high demands on the light during the inspection process, the box cover made of acrylic board cannot be easily opened. Alternatively, the main interface of the software program can be used for detection during operation, and the internal operating conditions can also be observed in real time at close range through the camera located at the upper end of the cantilever. The on-site operation equipment and camera monitoring are shown in Figs. 1 and 4.

Figure 4: Camera monitoring
4.1 Surface Roughness Check Calculation
According to GB/T 1031-2009 “Geometrical Product Specifications (GPS), surface texture: Profile method, surface roughness parameters and their values” and ISO 25178-2 “Geometrical product specifications (GPS)-Surface texture: Areal-Part 2: Terms, definitions and surface texture parameters”, Ra, Sa and Sq are selected as the roughness calculation values. Among them, the average arithmetic deviation value Ra of the contour refers to the average arithmetic deviation of the absolute value of the distance from each point on the contour to the center line within a certain length and orientation. The calculation formula is as follows:
The arithmetic average height Sa refers to the average value of the absolute value of the distance from each point on the surface profile to the average surface in the selected area, which is the expansion of the average arithmetic deviation value Ra of the line profile on the surface. The calculation formula is as follows:
The root means square height Sq refers to the sampling length, which is the root mean square defining the height of each point on the surface of the selected area, which is equivalent to the standard deviation value of the height. The calculation formula is as follows:
Table 2 shows the surface roughness results of three wood species after mechanically sawing.
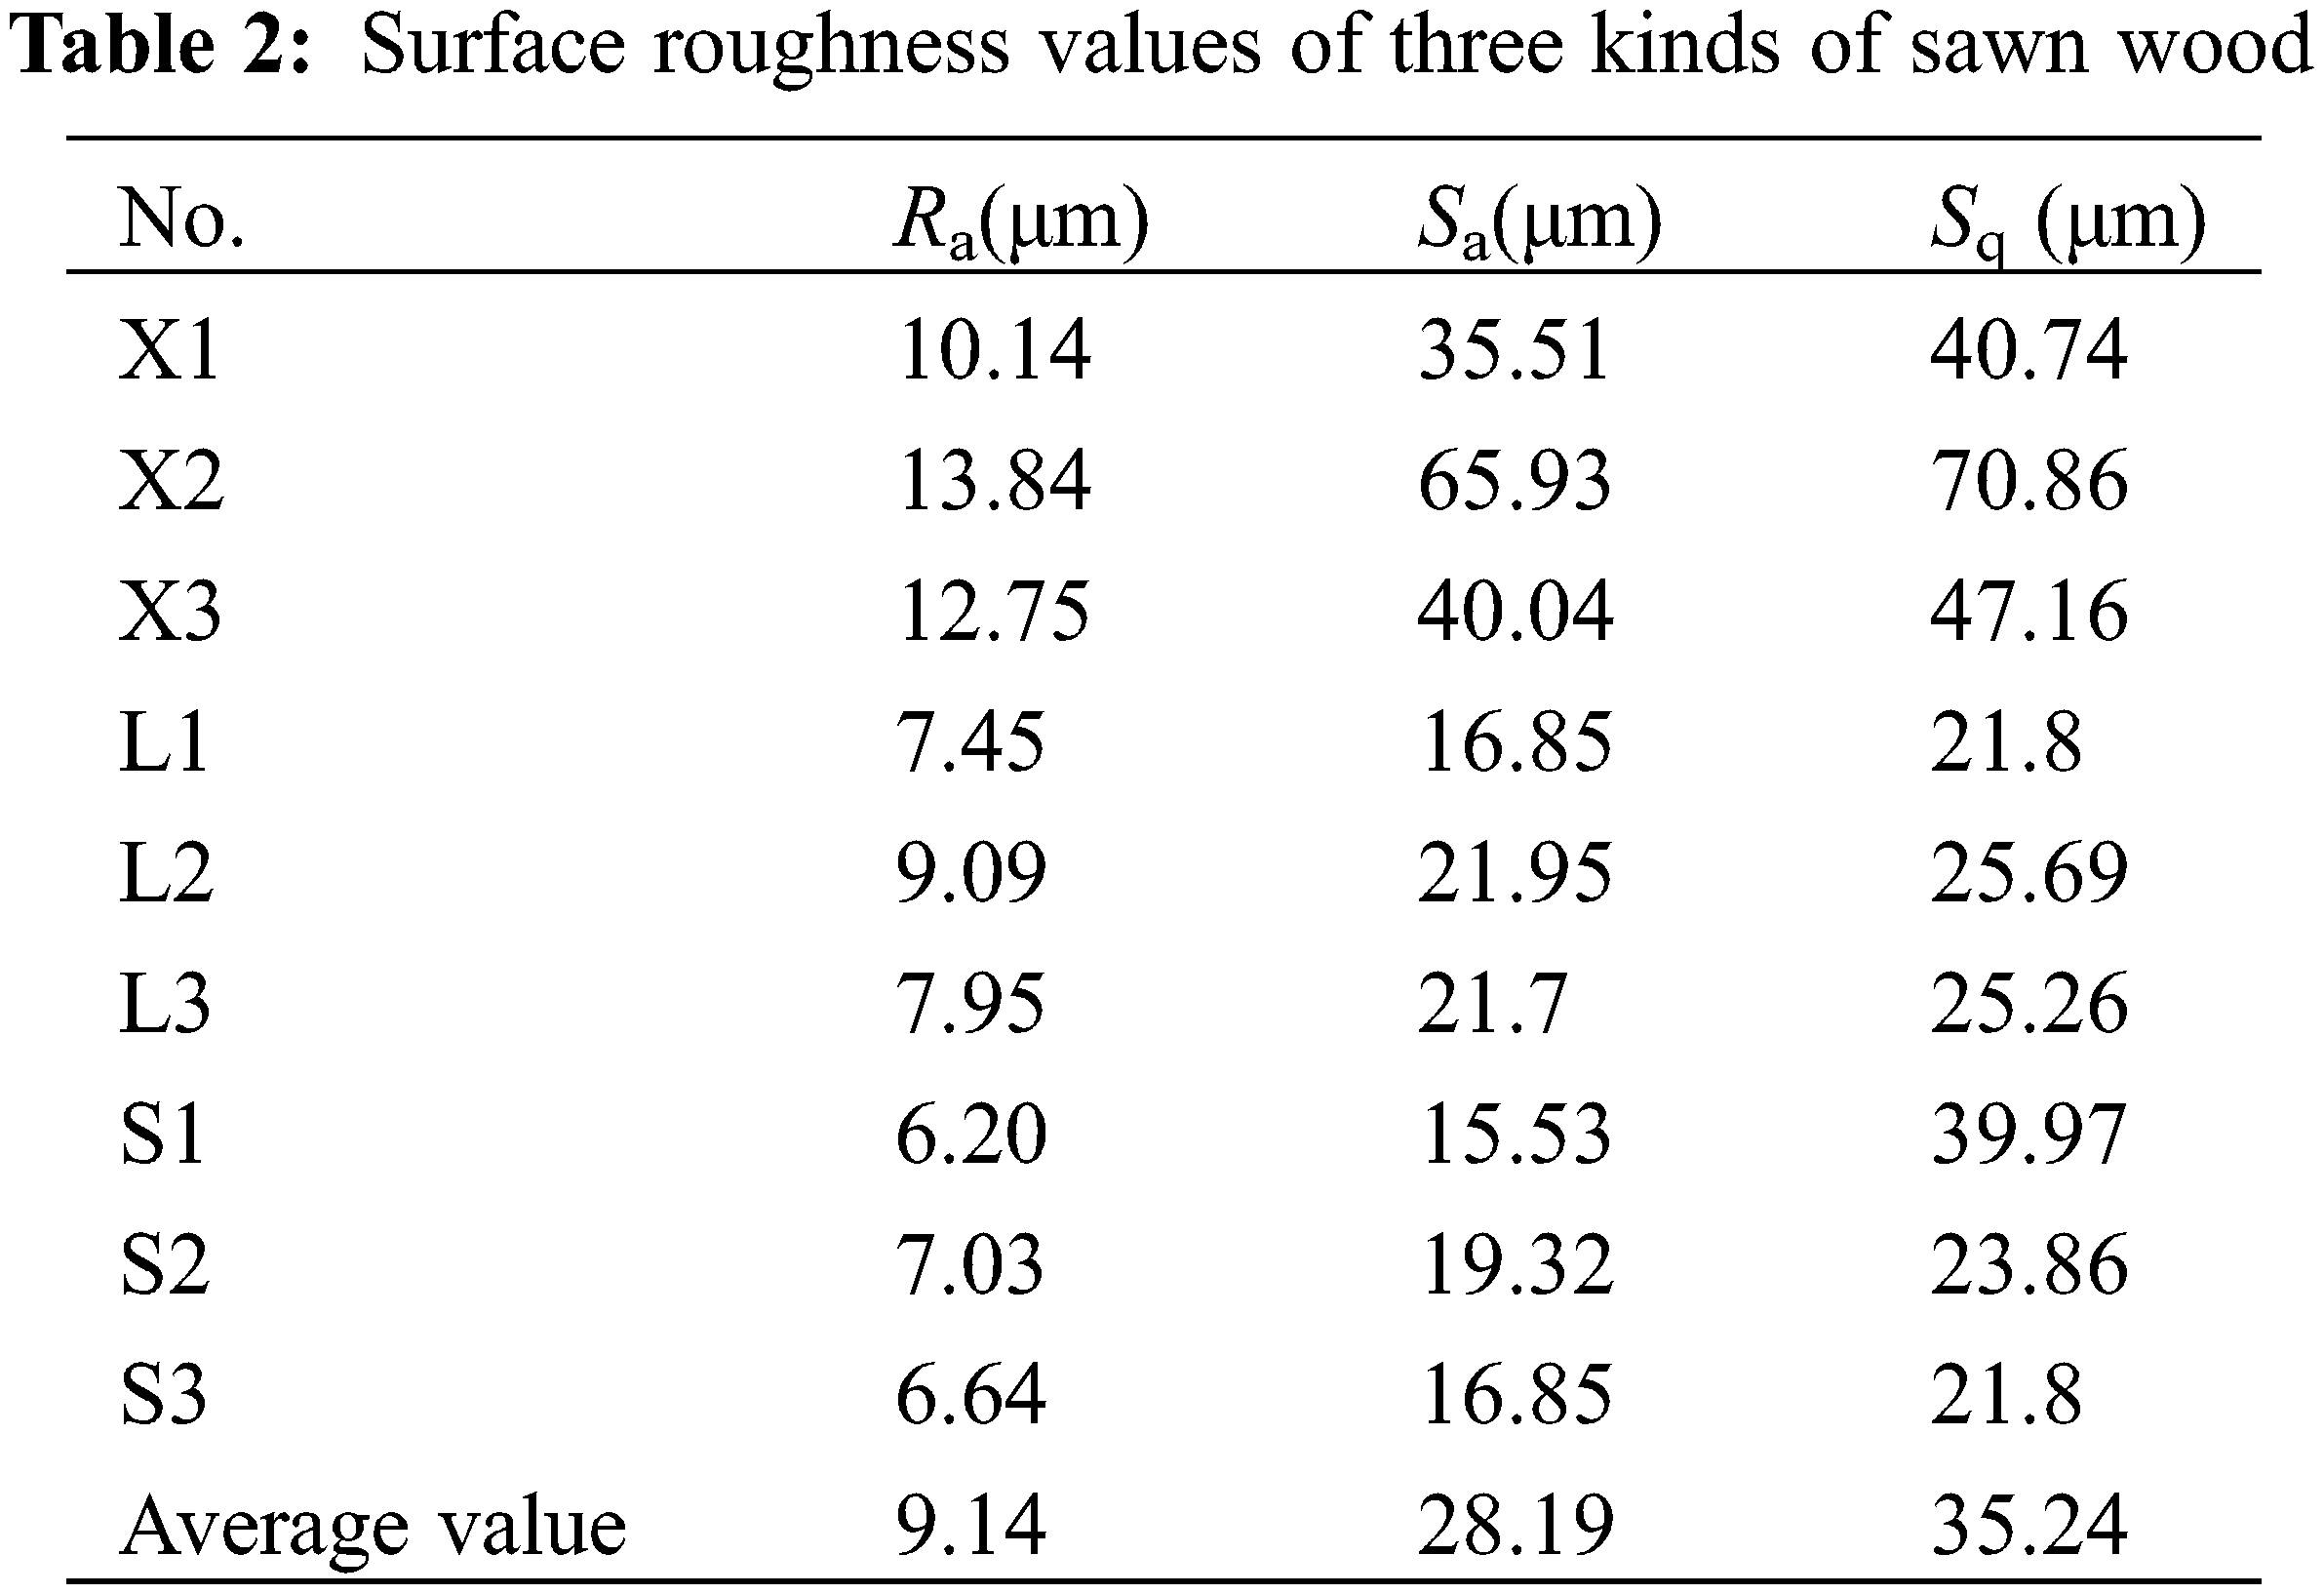
It can be seen from Table 2 that the surface roughness of the three woods after sawing are all different under the specified parameters, and the roughness is Sitka spruce, Larch and Beech in descending order. The change tendency of the values Ra, Sa and Sq, which measure the roughness, is basically the same for all three woods. But the values of Sa and Sq are similar, and both are much larger than the value of Ra. Because the value of Ra here represents the randomly selected two-dimensional roughness in the three-dimensional topography. The units of the three test values are μm. Ra can only reflect the roughness of the two-dimensional topography, and has a better reflection of periodic surface, but for random surfaces, the measured value is relatively random. Both values of Sa and Sq measure the distance relationship between a point on the surface contour of the selected area and the average plane. They all analyze the characteristics of the height parameters in the surface topography from the three-dimensional angle. Compared with the two-dimensional test parameter Ra, they are more appropriate for the overall evaluation of the surface roughness of the wood with random characteristics. Both values can objectively characterize the three-dimensional morphological characteristics of the wood surface.
4.2 Analysis of Three-Dimensional Wood Surface Topography
It can be seen from Fig. 5 that the three-dimensional wood surface topography tester used in this study can intuitively and accurately reflect the surface topography characteristics of the wood after sawing. The depth of the color in the topography diagram represents the degree of the surface depression tested. Using the control indicators (the unit is μm) on the side, the general topography characteristics of each area can be quickly and accurately determined. The dimensional scale of every graph from Fig. 5 is 20:1. Compared to the ordinary two-dimensional profile test method, this method can use the surface as the test unit to accurately represent the different topographical characteristics of the wood surface caused by fiber anisotropy.
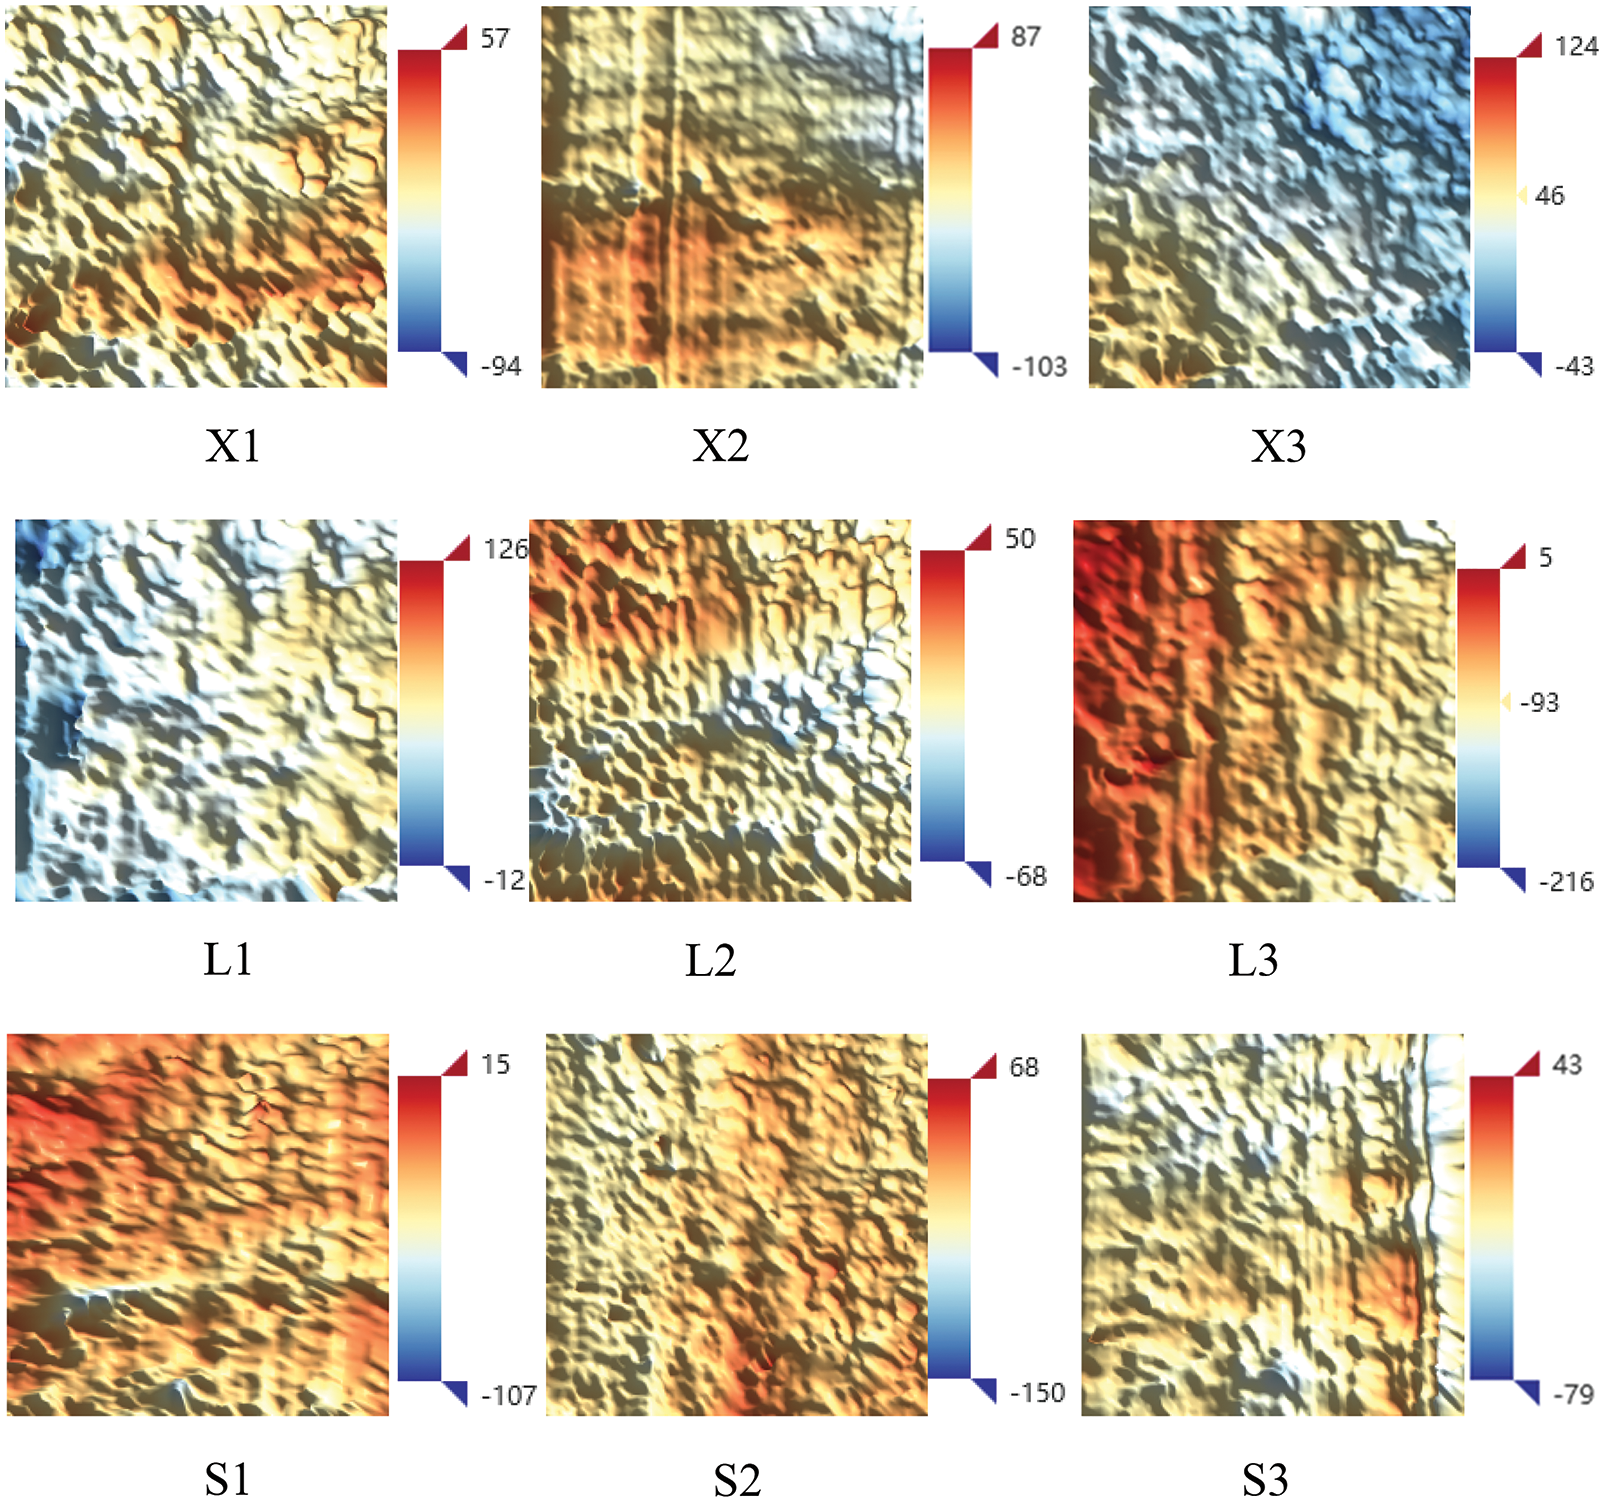
Figure 5: Three-dimensional topography of wood surface
It is showed in Table 2 and Fig. 5 that the surface roughness of the sawing surface of X2 is the largest, while the surface roughness of S1 is the smallest. Compared to S1, the color of the three-dimensional topography of X2 is not uniform and there are some areas with large gaps. This is because the top edge of the circular saw blade for sawing wood has some longitudinal run out, which is unavoidable. Depending on the density of the processed wood, the degree of runout of the saw blade also varies. Sitka spruce has a light texture and its air-dry density is much lower than that of Beech, only 357 kg/m3. During processing, the saw blade deflects more noticeably, which means that the cut surface is not smooth. The Beech with a density of 643 kg/m3 has a smaller surface roughness and a better three-dimensional topography.
For the different sections of the three species of wood, the roughness value of the circular saw blade is chordwise section > crosswise section > radial section. This is related to the angle formed by the direction of the cell fiber of the wood and the direction of the grain.
Although the air-dry density of Larch is higher than that of Beech, the roughness of the latter is smaller and the three-dimensional surface topography is flat. The maximum Sa value of Larch is 21.95 μm, while the minimum Sa value of Beech is 15.53 μm. This is due to the fact that the fiber structure of wood significantly affects the surface roughness. Larch belongs to the coniferous wood with resin canals and it contains a large amount of resin secretion compared to other genera. During the sawing process, the saw blade swayed significantly in the radial direction due to the obstruction and influence of the resin in the resin channel, which caused the surface roughness Sa of Larch to be slightly larger than that of Beech.
(1) Provided that the three-dimensional profiler achieves the micron-level resolution, it can display the three-dimensional profile of wood efficiently, conveniently and accurately, and is characterized by high efficiency and good durability.
(2) The three-dimensional surface topography and roughness of the three types of sawn wood correspond to each other. Their surface roughness is arranged as follows: Sitka spruce > Larch > Beech. Both Sa and Sq values measure the height parameter characteristics of the surface profile of the selected area from the three-dimensional angle. Compared with the two-dimensional roughness calculation value Ra, it is more appropriate for the overall evaluation of the surface roughness of wood with random surfaces.
(3) The Sa value of Sitka spruce specimen X2 is the largest of all specimen at 65.93 μm, and the Ra value of the Beech specimen S1 is 15.53 μm. This indicates that the density difference caused by wood species is one of the main reasons for determining the value of the three-dimensional surface roughness.
(4) For the same tree species, the roughness of the corresponding cut surface after sawing is as follows: chordwise section > crosswise section > radial section. The radial section has a lower roughness than other sections.
(5) With similar density, the fiber structure of the wood also has a significant influence on the surface roughness and the three-dimensional topography after sawing. The wood containing resin channels is affected by the resin so that the circular saw blade swings significantly when cutting, resulting in obvious unevenness of the three-dimensional surface of the wood specimen.
Funding Statement: The authors received no specific funding for this study.
Conflicts of Interest: The authors declare that they have no conflicts of interest to report regarding the present study.
1. Wang, Z., Xie, W. B., Lu, Y., Li, H. T., Wang, Z. H. (2019). Dynamic and static testing methods for shear modulus of oriented strand board. Construction and Building Materials, 216(4), 542–551. DOI 10.1016/j.conbuildmat.2019.05.004. [Google Scholar] [CrossRef]
2. Wang, Z., Xie, W. B., Wang, Z. H., Cao, Y. (2018). Strain method for synchronous dynamic measurement of elastic, shear modulus and Poisson’s ratio of wood and wood composites. Construction & Building Materials, 182(1), 608–619. DOI 10.1016/j.conbuildmat.2018.06.139. [Google Scholar] [CrossRef]
3. Yang, R. Y., Li, H. T., Lorenzo, R., Sun, Y. F., Ashraf, M. (2021). Flexural behaviour of steel timber composite (STC) beams. Steel and Composite Structures, 41(2), 193–207. DOI 10.12989/scs.2021.41.2.193. [Google Scholar] [CrossRef]
4. Zhang, H., Li, H. T., Li, Y. J., Xiong, Z. H., Zhang, N. N. et al. (2021). Effect of nodes onmechanical properties and microstructure of laminated bamboo units. Construction and Building Materials, 304(6), 124427. DOI 10.1016/j.conbuildmat.2021.124427. [Google Scholar] [CrossRef]
5. Hong, C. K., Li, H. T., Xiong, Z. H., Lorenzo, R., Li, X. et al. (2021). Axialcompressive behavior of laminated bamboo columns with a chamfered section. Structures, 33(6), 678–692. DOI 10.1016/j.istruc.2021.04.083. [Google Scholar] [CrossRef]
6. Licow, R., Chuchala, D., Deja, M., Orlowski, K. A., Taube, P. (2020). Effect of pine impregnation and feed speed on sound level and cutting power in wood sawing. Journal of Cleaner Production, 272(1), 122833. DOI 10.1016/j.jclepro.2020.122833. [Google Scholar] [CrossRef]
7. Li, S. Y., Wang, C. Y., Zheng, L. J., Wang, Y. J., Xu, X. P. et al. (2016). Dynamic stability of cemented carbide circular saw blades for woodcutting. Journal of Materials Processing Technology, 238(2), 108–123. DOI 10.1016/j.jmatprotec.2016.07.018. [Google Scholar] [CrossRef]
8. Luo, B., Zhang, J., Bao, X., Liu, H. G., Li, L. (2020). The effect of granularity on surface roughness and contact angle in wood sanding process. Measurement, 165(1), 108133. DOI 10.1016/j.measurement.2020.108133. [Google Scholar] [CrossRef]
9. Zhong, Z. W., Hiziroglu, S., Chan, C. T. M. (2013). Measurement of the surface roughness of wood based materials used in furniture manufacture. Measurement, 46(4), 1482–1487. DOI 10.1016/j.measurement.2012.11.041. [Google Scholar] [CrossRef]
10. Hiziroglu, S., Zhong, Z. W., Ong, W. K. (2014). Evaluating of bonding strength of pine, oak and nyatoh wood species related to their surface roughness. Measurement, 49, 397–400. DOI 10.1016/j.measurement.2013.11.053. [Google Scholar] [CrossRef]
11. Li, G. Y., Wu, Q. L., He, Y. L., Liu, Z. K. (2018). Surface roughness of thin wood veneers sliced from laminated green wood lumber. Maderas-Ciencia y Tecnologia, 20(1), 3–10. DOI 10.4067/S0718-221X2018005001101. [Google Scholar] [CrossRef]
12. Laina, R., Sans-Lobera, A., Villasante, A., Lopez-Espi, P., Martinez-Rojas, J. A. et al. (2017). Effect of the anatomical structure, wood properties and machining conditions on surface roughness of wood. Maderas-Ciencia y Tecnologia, 19(2), 203–212. DOI 10.4067/S0718-221X2017005000018. [Google Scholar] [CrossRef]
13. Zhang, K., Richman, R. (2021). Wood sheathing durability from moisture sorption isotherm variability due to age and temperature. Construction and Building Materials, 273(3), 121672. DOI 10.1016/j.conbuildmat.2020.121672. [Google Scholar] [CrossRef]
14. Da Ros, L. M., Thomas, B. R., Mansfield, S. D. (2021). Wood quality trait associations with climate: Room for improvement in two northern commercial tree species? Forest Ecology and Management, 497(1), 119492. DOI 10.1016/j.foreco.2021.119492. [Google Scholar] [CrossRef]
15. O’Ceallaigh, C., Conway, M., Mehra, S., Harte, A. M. (2021). Numerical investigation of reinforcement of timber elements in compression perpendicular to the grain using densified wood dowels. Construction and Building Materials, 288(3), 122990. DOI 10.1016/j.conbuildmat.2021.122990. [Google Scholar] [CrossRef]
16. Rolleri, A., Roffael, E. (2010). Influence of the surface roughness of particleboards and their performace towards coating. Maderas-Ciencia y Tecnologia, 12(2), 143–148. DOI 10.4067/SO718-221X2010000200009. [Google Scholar] [CrossRef]
17. Nzokou, P., Kamdem, D. P., Temiz, A. (2011). Effect of accelerated weathering on discoloration and roughness of finished ash wood surfaces in comparison with red oak and hard maple. Progress in Organic Coatings, 71(4), 350–354. DOI 10.1016/j.porgcoat.2011.03.028. [Google Scholar] [CrossRef]
18. Tolvaj, L., Molnar, Z., Magoss, E. (2014). Measurement of photodegradation-caused roughness of wood using a new optical method. Journal of Photochemistry and Photobiology B: Biology, 134, 23–26. DOI 10.1016/j.jphotobiol.2014.03.020. [Google Scholar] [CrossRef]
19. Baradit, E., Gatica, C., Yáñez, M., Figueroa, J. C., Guzman, R. et al. (2020). Surface roughness estimation of wood boards using speckle interferometry. Optics and Lasers in Engineering, 128(1), 106009. DOI 10.1016/j.optlaseng.2020.106009. [Google Scholar] [CrossRef]
20. Temiz, A., Yildiz, U. C., Aydin, I., Eikenes, M., Alfredsen, G. et al. (2005). Surface roughness and color characteristics of wood treated with preservatives after accelerated weathering test. Applied Surface Science, 250(1–4), 35–42. DOI 10.1016/j.apsusc.2004.12.019. [Google Scholar] [CrossRef]
21. Zhong, Z. W., Hiziroglu, S., Chan, C. T. M. (2013). Measurement of the surface roughness of wood based materials used in furniture manufacture. Measurement, 46(4), 1482–1487. DOI 10.1016/j.measurement.2012.11.041. [Google Scholar] [CrossRef]
 | This work is licensed under a Creative Commons Attribution 4.0 International License, which permits unrestricted use, distribution, and reproduction in any medium, provided the original work is properly cited. |