| Journal of Renewable Materials |
DOI: 10.32604/jrm.2022.022090
ARTICLE
Mechanical Properties, Biocompatibility and Anti-Bacterial Adhesion Property Evaluation of Silicone-Containing Resin Composite with Different Formulae
1Hospital of Stomatology, Guanghua School of Stomatology, Sun Yat-sen University, Guangzhou, China
2Guangdong Provincial Key Laboratory of Stomatology, Guangzhou, China
3College of Materials Science and Engineering, South China University of Technology, Guangzhou, China
*Corresponding Authors: Sui Mai. Email: maisui@mail.sysu.edu.cn; Jingwei He. Email: msjwhe@scut.edu.cn
#The first two authors contributed equally to this work
Received: 21 February 2022; Accepted: 24 March 2022
Abstract: Novel branched silicone methacrylate was developed. The mechanical and biological properties of the resin system were investigated to select the formula proportion with the best overall performance. The novel silicone-containing monomers were combined with an incremental sequence of glass filler concentrations in commonly used Bis-GMA/TEGDMA (50/50, wt./wt.) dental resin systems. Physicochemical properties, surface properties, anti-bacterial adhesion effect, anti-biofilm effect, protein adsorption, and cytotoxicity were evaluated. The results showed that BSMs did not affect the double bond conversion of dental resin, but could reduce volumetric shrinkage (p < 0.05). The BSM containing resins can resist protein and bacteria adhesion (S. mutans) because it has increased hydrophobicity and a lower free energy surface (p < 0.05). However, there were no statistically significant differences in cytotoxicity, surface roughness, and double bond conversion rate. Overall, the results indicate that changes in a material’s properties are not strictly proportional to its composition. Synthetic silicone resin methacrylate can reduce the polymerization shrinkage, have low surface energy and anti-adhesion properties. Silicone composite resin containing 70% matrix has the best comprehensive properties. The silicone methacrylate composite represents an innovative method to improve the properties and reducing secondary caries.
Keywords: Dental resin composites; silicone; hydrophobicity; anti-biofilm; physicochemical property
Dental resin composites (DRCs) are widely used biomaterials that have been designed to counteract dental caries. Their excellent aesthetic and biocompatible properties have made them popular and are gradually replacing the amalgams that were previously the first choice of dental restorations [1,2]. Although great efforts have been made to optimize the physicochemical and mechanical properties of resin composites [3], these materials still exhibit several disadvantages, such as tending to accumulate more biofilm than other restorative materials [4]. Secondary caries, which is associated with the accumulated biofilm, is the primary complication of resin composite restorations [5]. A common modification strategy is to directly add antibacterial agents into resin composites. In the past, many antibacterial agents have been added to dental resin composites, including chlorhexidine (CHX) [6], silver, zinc-oxide [7], 12-methacryloxydodecylpyridium bromide (MDPB) [8], dimethylaminohexadecyl methacrylate (DMAHDM) [9], and bioactive glass (BAG) [10].
To extend the lifetime of an oral cavity restoration, the susceptibility of restorative materials to the adhesion of microorganisms must be considered. Bacterial adhesion is the most essential phase in biofilm creation because it is a reversible adhesion [11]; thus, changing DRCs to be anti-adhesion against bacteria should also be an efficient strategy to limit biofilm formation. Microbial colonizer adhesion to dental materials is linked to the physical and chemical characteristics of the material surface [12]. The characteristics of the surface, such as the surface roughness, surface free energy, and surface chemistry, may substantially affect bacterial adhesion [13].
The most essential component that causes early bacterial adherence to a smooth surface appears to be surface free energy (SFE). The amount of germs that cling to material surfaces is affected by the presence of polar and nonpolar components [14]. Based on a previous study, polished titanium surfaces showed higher percentages of bacterial adhesion than the implant material with low SFE [15]. Due to the low SFE of silicone-based materials, they have been applied in the development of antifouling coatings [16]. In our previous research, we synthesized two types of silicone methacrylates (SMAs) named respectively as SMA-ME and SMA-MEO, and we incorporated them into a Bis-GMA/TEGDMA resin system. Our research found that SMAs containing cured resins could reduce bacterial adhesion due to their lower SFE. However, the flexural strength of SMAs with cured resins was only half that of controls [17].
Commercial dental resin composites usually contain inorganic fillers with a mass ratio of 60–80 wt% [18]. The role of inorganic fillers is endowing resin composites with excellent mechanical properties, and reducing polymerization shrinkage and water absorption [19]. In this research, SMA-MEO-20% resin system was introduced as resin matrix and mixed with an series of concentrations of glass fillers (65%, 70%, and 72% mass ratio) to prepare dental resin composites. We investigated the effect of filler concentration on the degree of double bond conversion, mechanical properties, surface free energy, surface roughness, biocompatibility, protein repellency, and so on of SMA-MEO containing resin composites. The hypotheses were as follows: (1) a certain amount of inorganic fillers could reinforce SMA-MEO to satisfy the ISO standard requirement on flexural properties; (2) SMA-MEO containing dental resin composites would still have an anti-adhesion effect against S. mutans and the anti-adhesion effect would not be influenced by the filler concentration.
The silicon methacrylate SMA-MEO was synthesized according to our previous research [17]. 2,2-Bis[4- (2-hydroxy-3-methacryloxy-propoxy)-phenyl]propane (Bis-GMA) and triethyleneglycol dimethacrylate (TEGDMA) were obtained from Sigma–Aldrich Co., USA. Mucin from bovine submaxillary was provided by Hefei Biomei Biotechnology Co., Ltd., China. Dental glass fillers (GM 27884, 0.7 μm) were from SCHOTT AG (Mainz, Germany).
2.2 Preparation of Dental Resin Composites
SMA-MEO was introduced to Bis-GMA/TEGDMA (50 wt%/50 wt%) at a mass ratio of 20 wt%, followed by 0.7 wt% CQ and 0.7 wt% DMAEMA as a photoinitiation system. The mixture was stirred until a uniform resin system was obtained. Subsequently, inorganic fillers were introduced into the prepared resin system and mixed with a high-speed mixer (DAC150 FVZ-K, Hauschild, Hamm, Germany) at a speed of 2500 rpm until well-combined. The prepared dental resin composites were marked as SMA-MEO-65%, SMA-MEO-70%, and SMA-MEO-72% according to content of inorganic fillers in the composite resin. Dental resin composites without SMA-MEO were prepared according to the same protocol and marked as control-65%, control-70%, and control-72%.
2.3 Measurement of Double Bond Conversion (DC)
The double band conversion of composites was obtained by the intensity variation of the characteristic peak attributed to the double bond in methacrylate before and after photopolymerization. The attenuated total reflection (ATR) spectra of dental resin composites were recorded with a Nicolet iS50 FT-IR instrument equipped with an ATR accessory at a resolution of 4 cm−1 through 4 scans. A mold with a diameter of 5.0 mm and a thickness of 2.0 mm was used to add each of the composites, and the spectra were recorded in the unpolymerized state. Afterwards, the samples were irradiated with a light-curing lamp (Demi Ultra, Kerr Co., USA) for 40 s. Finally, the spectrum of the cured sample was collected. DC was obtained according to the normalized peak area related to the double bond group (1638 cm−1) and internal phenyl ring (1608 cm−1) as follows:
where AC=C and Aph are the surface peak areas of C=C and phenyl ring, respectively. Every dental resin composite was measured in five replicates (n = 5).
2.4 Measurement of Volumetric Shrinkage
According to ISO 17304:2013(E), the volumetric polymerization shrinkage was assessed by measuring the density variations before and after photopolymerization through an analytical balance with a density test kit. Every sample was weighed separately in water and air before and after photopolymerization. The following equation determines the density of the specimens:
where ρ is the density of the specimen, M1 is the weight of the specimen in air, M2 is the weight of the specimen in water medium, and ρ0 is the density of the water medium at the measured temperature. Then the volume shrinkage (VS) can be calculated based on the following formula:
where ρu is the density of the sample before photopolymerization, and ρc is the density of the polymerized specimen. Every composite was measured in six replicates (n = 6) before and after polymerization.
2.5 Measurement of Water Sorption and Solubility
Water sorption (WS) and solubility (SL) of the resin composites were calculated basing on the ISO 4049:2019(E) standard. Every composite was placed into a cylindrical stainless-steel mold with 15 mm in diameter and 1 mm in thickness followed by a transparent Mylar sheet. Curing was applied by a light-curing lampfor 40 s. A total of five specimens were produced for each group. Afterwards, the specimens were kept in a desiccator until no significant mass change of specimens was detected, using by an analytical balance (with an accuracy of 0.1 mg) to obtain the equilibrium mass M1. Then, the specimens were kept in 50 mL deionized water in individual tubes at 37°C. At regular intervals, the specimens were carefully taken out of water, and weighed. This procedure was continued until an equilibrium mass was obtained (recorded as M2). Finally, the specimens were desiccated in a vacuum oven at 60°C and the mass at equilibrium state was recorded as M3. The WS and SL of the specimens were counted by the following equations:
where V is the volume of the specimens.
Rectangular specimens with a size of 2 mm × 2 mm × 25 mm were prepared in half-split stainless steel and photo-cured by a light-curing lamp as mentioned on each open side (40 s for one portion until the entire specimen was cured). Sixteen specimens were made for each composite and randomly separated into two groups. Before testing, half (n = 8) of the specimens were stored in a desiccator for one week, and another half (n = 8) of the specimens were immersed in distilled water at 37°C until no significant mass change of the specimens was observed. All specimens were subsequently fractured via a computer-controlled universal testing machine (AGS-10KN, Shimadzu Co., Japan) with a 20 mm span at a cross-head speed of 1.0 mm/min. The flexural strength (FS) and flexural modulus (FM) were calculated depending on ISO 4049:2019(E), and both values were directly gotten by the software according to the set procedure.
2.7 Measurement of Contact Angle and Surface Free Energy (SFE)
Every composite paste was added into a disc mold of 10 mm in diameter and 1 mm in thickness between two transparent Mylar sheets, and photo-cured by light-curing unit as mentioned for 40 s on each open side. Every specimen was polished using SiC papers (FEPA #4000) in a grinding machine (MPD-1, Guangxiangzhiyang Instrument, Ltd., Shanghai, China) using water as a lubricant to obtain a smooth surface. Then, every specimen was cleaned by sonication for 30 min in distilled water. Afterwards, the specimens were desiccated before testing. Six specimens (n = 6) were fabricated for every composite.
The contact angle on the surfaces of the specimens was measured at room temperature according to the sessile drop technique using a video contact angle system (SDC-100, Dongguan SINDIN Precision Instrument Co., Ltd., Dongguan, China). The contact angles were assessed with two liquids of known surface free energy (distilled water and diiodomethane), and the surface free energy of every specimen was calculated by Owens-Wendt approach. The results were directly obtained by the software according to the calculation procedure. All assessments were performed using a 2-μL droplet of liquid and measured after stabilization at the surface for 20 s.
2.8 Measurement of Surface Roughness
The specimens for the surface roughness test were made with the same fabrication process as the specimens for the contact angle measurement. The roughness of every specimen was measured by using a surface roughness tester (Leeb432, Chongqing Leeb17 Instrument Co., Ltd., Chongqing, China) with an accuracy of 0.001 μm. The surface of the specimen was in the same horizontal plane as the roughness sensor before testing, and the roughness value was directly obtained by the tester. Six specimens were prepared for each composite.
2.9 Measurement of Mucin Adsorption
The specimens for the mucin adsorption assessment were made with the same fabrication process as the specimens for the contact angle measurement. Six (n = 6) specimens were fabricated for every composite. The amount of mucin adsorption of every specimen was determined by Bradford method. All specimens were immersed in PBS for 2 h before testing. Then, the specimens were immersed in individual tubes with 1 mL mucin solution at 37°C for 24 h. This solution had a concentration of 0.4 mg of mucin per 1 mL PBS. After the specimen had been removed, 20 mL of Bradford reagent was mixed with the mucin solution and the mixture was homogenized by ultrasound for 1 min. The absorbance of the mixture at 595 nm was measured via a UV-vis spectrophotometer (UV755B, Shanghai Yoke Instrument Co., Ltd., Shanghai, China). The concentration of mucin solution was calculated as follows:
where C is the concentration of mucin solution, xOD is the optical density of mucin solution with Bradford solution.
From the concentration of mucin solution, the amount of mucin adsorbed on the specimen per area (AMA) was calculated as follows:
where
2.10 Measurement of Bacterial Adhesion
Streptococcus mutans (S. mutans, ATCC 25175) was cultured in brain heart infusion (BHI) broth and adjusted to approximately 1 × 10⁷ CFU/mL for the bacterial adhesion experiment.
After sterilization by ultraviolet rays for 1 h, the composite flakes (10 mm in diameter and 1 mm in thickness) were separated in one well of the 24-well culture plate, where 1 mL of bacteria suspension was inoculated. The samples were anaerobically incubated at 37°C for 24 h and then washed twice with PBS. Afterwards, every specimen was transferred into a 5-ml centrifuge tube containing 3 ml PBS and vigorously vortexed to collect the bacteria from the surface. The suspension was serially diluted, and colonies were counted using anaerobic cultures for one day on BHI plates The colony counts of S. mutans were calculated. The experiment was repeated three times.
2.11 Evaluation of Anti-Biofilm Properties
The specimens for the live-dead staining experiment and MTT assay were prepared using the method in 2.7. Each specimen was placed into 1 ml of bacterial solution adjusted to approximately 1 × 10⁷ CFU/ml in a 24-well microplate. After 24 h of anaerobic incubation at 37°C, the disks were washed twice with PBS and stained using the BacLight live/dead kit (Invitrogen Life Technologies, Carlsbad, CA, USA). In short, 1.5 μL SYTO 9 and 1.5 μL propidium iodide were mixed in 1 ml of distilled water to stain each sample for 15 min. After being gently rinsed with distilled water, the specimen was examined by a confocal laser scanning microscope (CLSM; FV3000, Olympus, Japan), where living bacteria appear green and dead bacteria appear red. The biomass of biofilm formed on the composite was calculated using the Image J program. CLSM experiments were repeated three times, and one representative image of each experiment is presented.
The metabolic activity of S. mutans biofilms was investigated using the MTT test. Biofilm-covered disks were inserted into a fresh 24-well plate after they had grown for 24 h. Each well was filled with 30 μL of MTT dye (5.0 mg/mL) and 300 μL of BHI medium, which was incubated for 4 h at 37°C in 5% CO2. Afterwards, the samples were transferred into a new 24-well plate, and 300 μL of Formazan reagent was added to solubilize the crystals. After treating each well for 3.5 h in a darkroom, 100 μl of the solution was collected and analyzed at 570 nm using a microplate reader (SpectraMax M5, Molecular Devices, Sunnyvale, CA, USA).
2.12 Evaluation of Cytotoxicity
The discs were prepared as described in 2.7 and disinfected by UV light for 1 h in an aseptic environment. The extract solution of the composite resins was obtained by immersing these materials in culture medium (2 ml/dick) at 37°C for 1 day. Each concentrate was diluted with fresh culture medium to 1:1 of its original concentration and stored at 4°C. In addition, L-929 mouse fibroblasts were used for this cytotoxicity test. Specifically, these cells were cultured in minimum essential medium (MEM) with 10% fetal bovine serum and 1% penicillin/streptomycin at 37°C in 5% CO2, and then placed into 96-well plates (100 μL/well) at a density of 4 × 10⁴ cells/mL in medium. After the cells sufficiently adhered to the wall (after 24 h), the cultivation medium was substituted with the extracts and incubated for another 24 h. Cytotoxicity was detected using the CCK8 assay. The negative control group was cells cultured in pure cell medium, and the blank control (no cells) was used. Ten microliters of CCK-8 reagent (Dojindo, Kyushu, Japan) and 90 μL of fresh medium were added to each well and incubated for 2 h in the dark. Then, the value of optical density (OD) at 450 nm was measurement by a microplate reader. The experiment was replicated four times.
The date analysis was performed by the SPSS 25.0 (IBM SPSS Software, USA), using the one-way analysis of variance (ANOVA) and Bonferroni post hoc test with a significance level of p < 0.05.
Dental resin composites mainly consist of resin matrices filled with silanated inorganic particles of different shapes and sizes (macro-, micro- and nanofillers) [20]. The resin matrix is a mixture of polymerizable monomers that contain methacrylate, acrylate, or allylic groups to package the fillers [21]. In addition to the optical and radiopacity properties required for the composite resin, filler particles bestow most of the observable mechanical properties in the finished material. In clinic, the failure of composite resin restorations is primarily due to secondary caries, which is caused by an adhering pathogen on the material surface, such as S. mutans [22]. Optimizing the formula of dental fillers is a frequent method to increase the performance of DRCs [23]. In the preliminary study, we designed and synthesized a methacrylate monomer containing an organosilicon group. The synthesized SMAs could reduce the VS of dental resin, and provide an antibacterial adhesion effect and resistance to protein adsorption to cured resin. However, it was necessary to address the reduced the flexural characteristics and increased the water sorption, and solubility after adding SMAs. The current study was designed to explore the properties of new siloxane containing resin composites, and investigate the influence of the inorganic filler concentration on the overall properties. Considering the operative property, the maximum filler proportion was designed at 72 wt% in the resin composite.
In general, the hydrophilicity, mobility, and kinetic parameters of the comonomers dictate the degrees of conversion, which in turn will influence the degrees of conversion, while there is a significant correlation between higher conversion rates and improved mechanical properties [24]. The results of the present study pointed that regardless of the proportion of the fillers, there was no negative effect on the DC of the composite in Table 1.
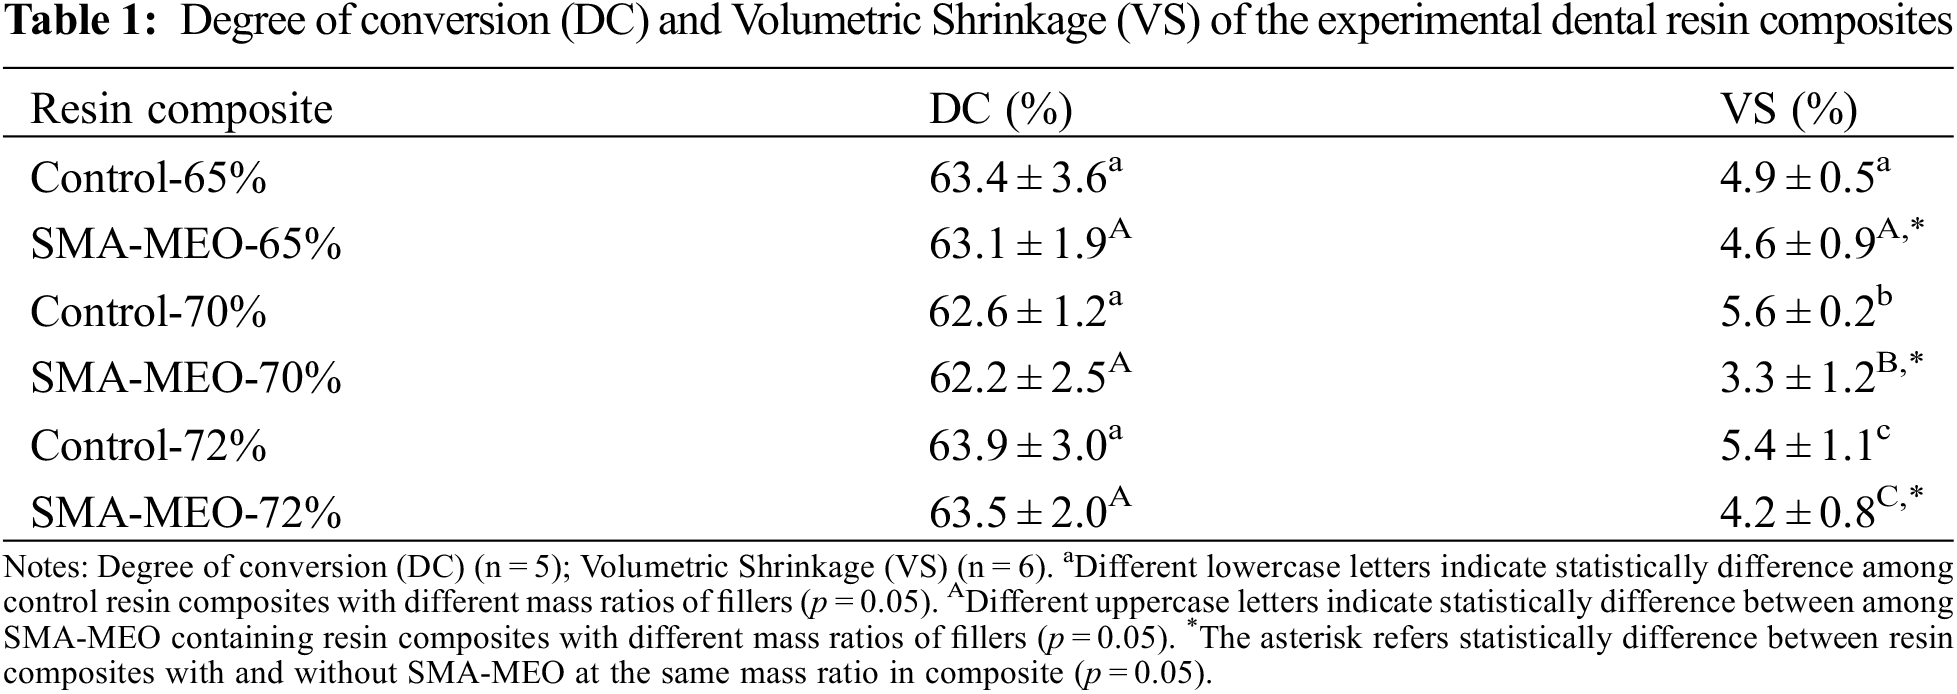
Volumetric shrinkage is one of the most significant defects in composite restorations. The shrinkage stress created by polymerization causes microleakages and microcracks in the material inside and between the material and the tooth tissue interface, which will lead to postoperative tooth sensitivity, secondary caries, and other complications [25]. The filler volume percentage, the molecular weight and degree of double bond conversion of the resin matrix, determine the volumetric shrinkage of the composite [26].
Under the premise that the DCs were at the same level, all groups containing silicon had lower VS (p < 0.05), and VS has a decreasing trend with increasing glass filler content (p < 0.05) Table 1. Low-molecular-weight molecules have higher polymerization shrinkage than high- molecular-weight molecules because the concentration of double bonds in the monomers decreases with the increase in molecular weight [27,28]. According to our previous research, the newly synthesized methacrylate has a much higher molecular weight than Bis-GMA. Because the volume of inorganic filler remains constant before and after curing, increasing its content can help reduce the volume change caused by polymerization shrinkage [29]. This result can explain the decrease in polymerization shrinkage with an increase in filling content in the resin composites.
Table 2 shows the water sorption (WS) and solubility (SL) of the composite resins. All SMA-MEO-containing resin composites had lower WS. The SMA-MEO-72% samples had the lowest WS among all groups (p < 0.05). For SL, the results of the control decreased with the increasing filler fraction. One-way ANOVA indicates that there was a significant difference between the results obtained from the experimental groups and control groups (p < 0.05). The control-65% was higher than the SMA-MEO-65%, while the control-70% and control-72% were lower than the silicon resin group (p < 0.05).
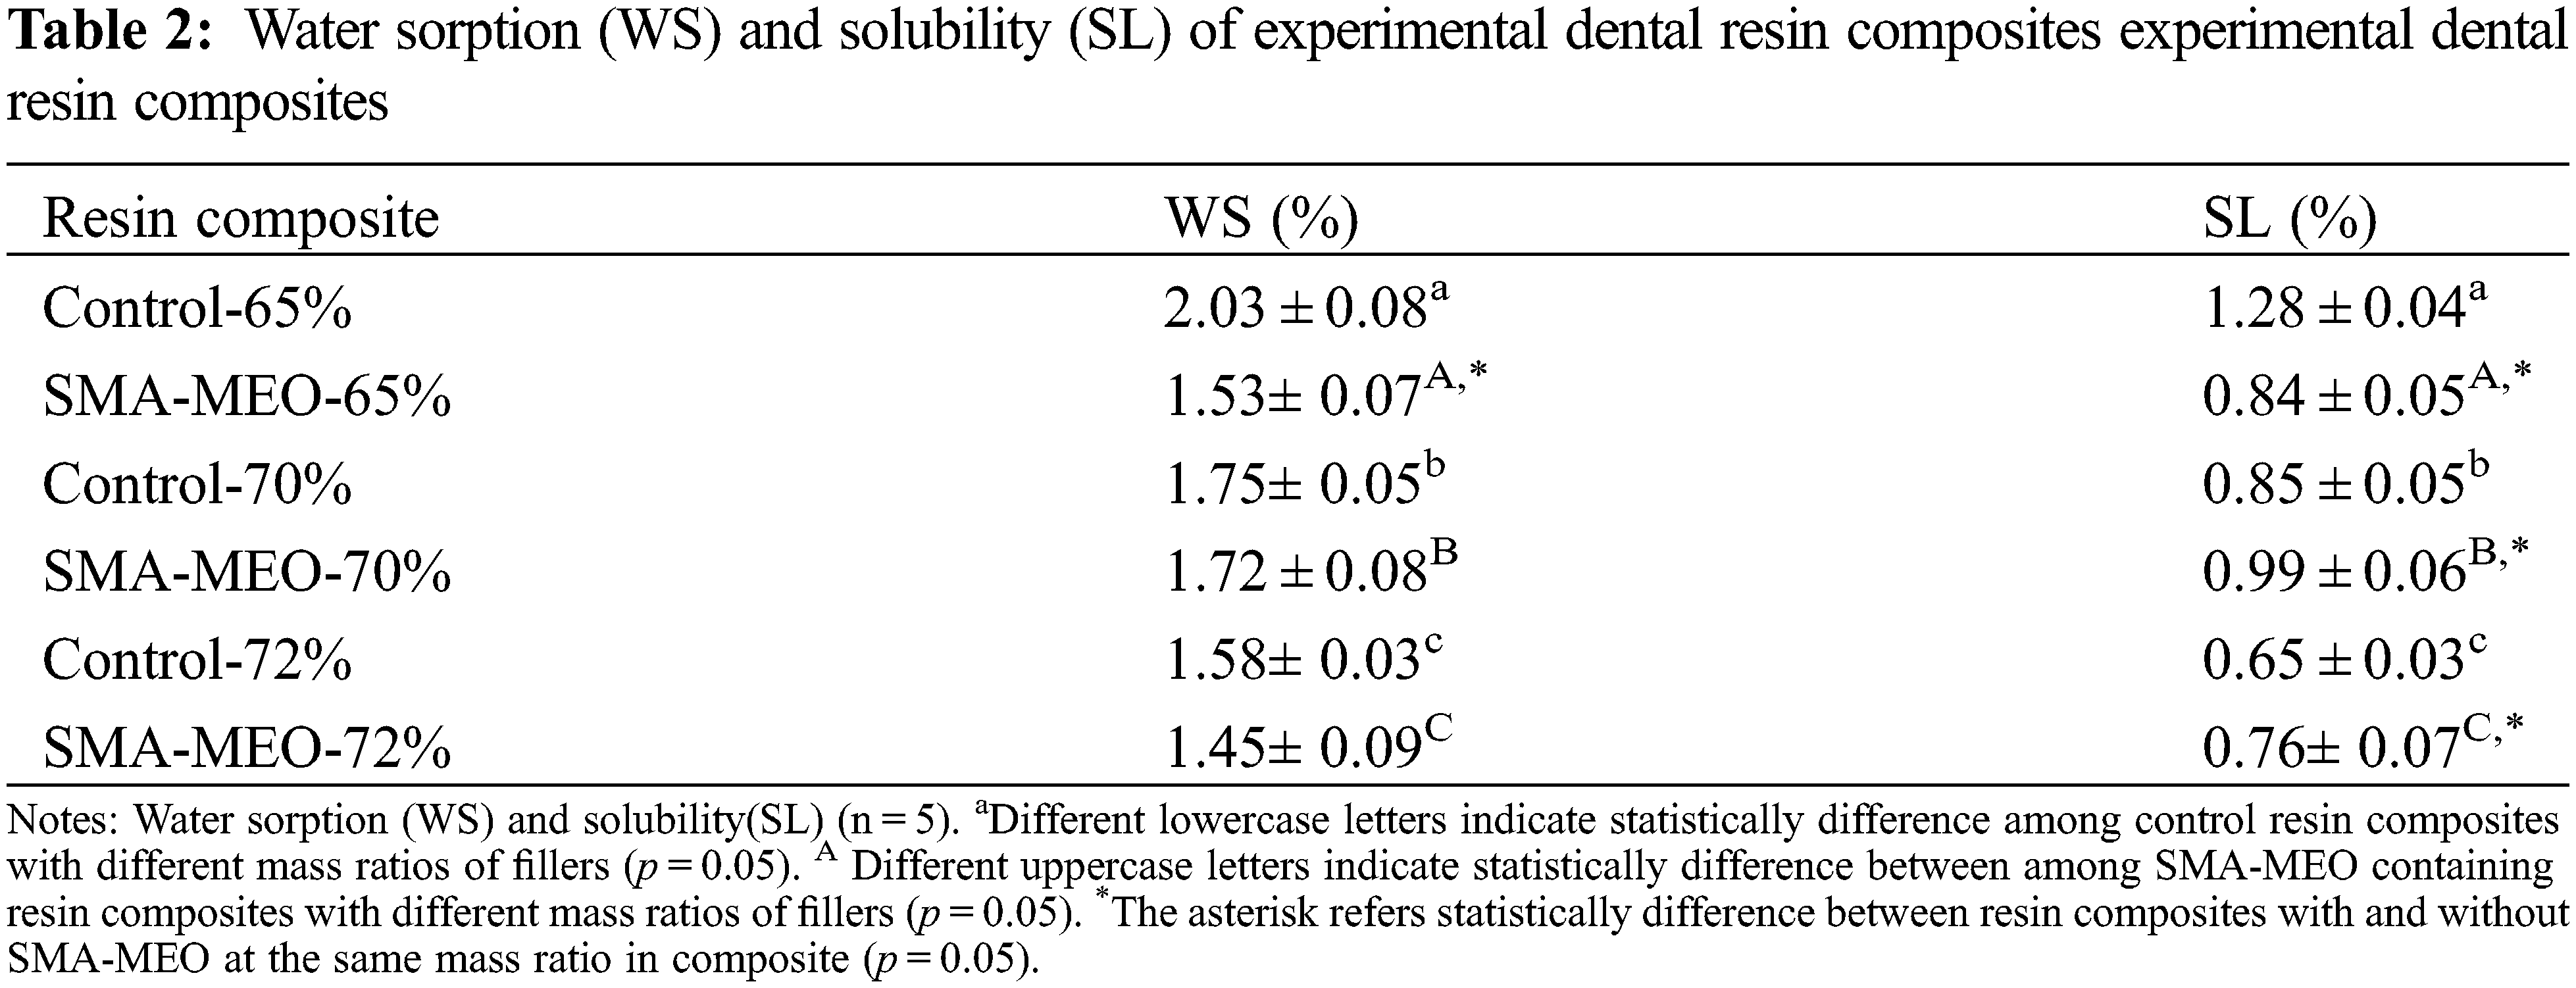
Oral fluids, especially water, can degrade composites. The degree of degradation depends on a number of factors, such as the chemical composition of the monomer, degree of polymer crosslinking, and environmental conditions [30]. The values of WS and SLare usually used to evaluate the water resistance of resin composites. The filler load was reported to be negatively correlated with water sorption [31]; thus, the WS of control group decreased with increasing fillers concentration. However, the influence of the filler concentration was not linear for SMA-MEO-containing composites. Compared with the the control group, the SMA-MEO-containing resin composites seemed to have lower WS. One of the most crucial criteria in predicting water sorption is the hydrophobicity of monomer. All silicone-containing groups are more hydrophobic than the control groups in Fig. 3A, water contact angle > 90°); thus, silicone-containing composites have lower WS than the control groups. Similar to the neat resin system, SMA-MEO-containing composites had higher SL than the control, which should be due to the decreased interaction between polymeric chains [17].
Figs. 1 and 2 exhibite the flexural strength (FS) and flexural modulus (FM) results before and after the water immersion (n = 8). Whether before or after water immersion, the FS and FM showed an increasing trend with increasing of filler concentration in the composites, and the FS of all samples was higher than 50 MPa. The introduction of SMA-MEO had a significant negative influence on FS. After the water immersion, the FS and FM of all samples significantly decreased (p < 0.05).
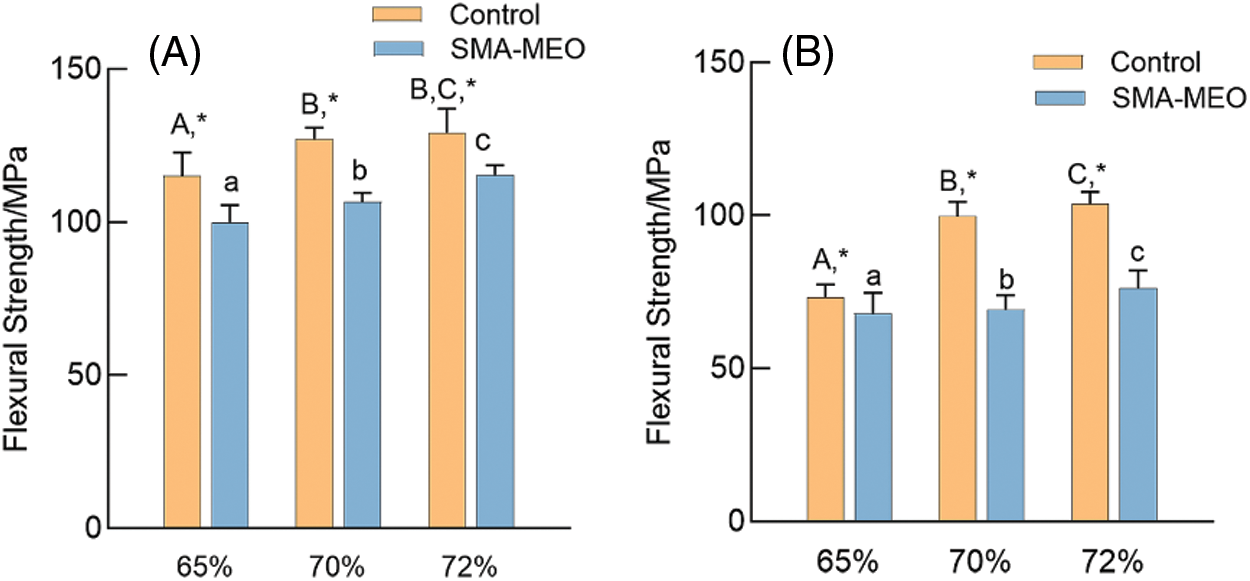
Figure 1: Flexural Strength of experimental dental resin composites before and after water immersion. (A) before immersion; (B) After immersion
Notes: aDifferent lowercase letters indicate statistically difference among control resin composites with different mass ratios of fillers (p = 0.05). ADifferent uppercase letters indicate statistically difference between among SMA-MEO containing resin composites with different mass ratios of fillers (p = 0.05). *The asterisk refers statistically difference between resin composites with and without SMA-MEO at the same mass ratio in composite (p = 0.05).
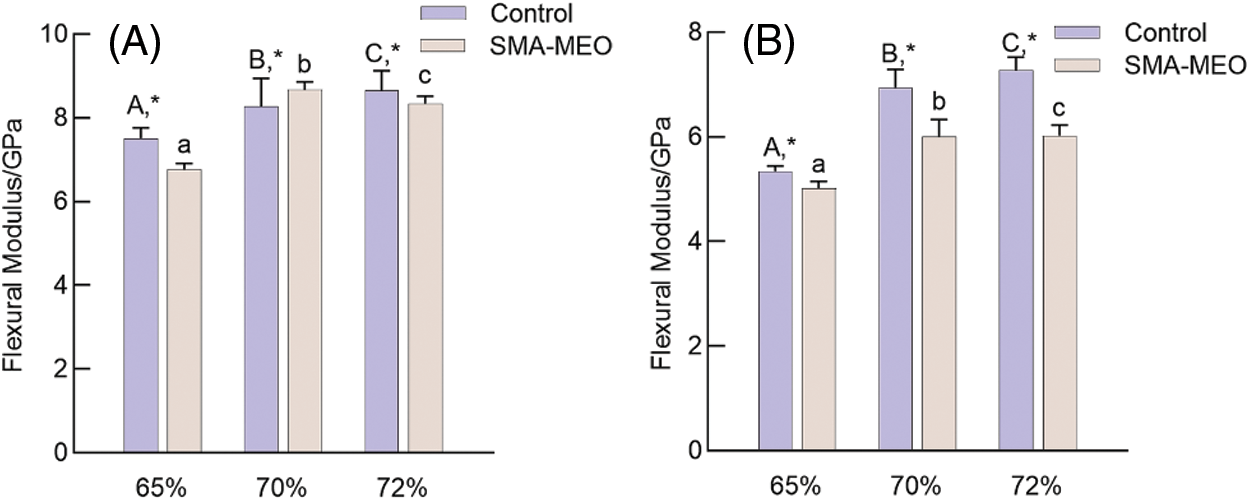
Figure 2: Flexural Modulus of experimental dental resin composites before and after water immersion. (A) Before immersion (B) After immersion
Notes: aDifferent lowercase letters indicate statistically difference among control resin composites with different mass ratios of fillers (p = 0.05). ADifferent uppercase letters indicate statistically difference between among SMA-MEO containing resin composites with different mass ratios of fillers (p = 0.05). *The asterisk refers statistically difference between resin composites with and without SMA-MEO at the same mass ratio in composite (p = 0.05).
The mechanical properties of resin composites are determined by the properties of the fillers and resin matrix [32]. It is obvious that the mechanical properties of composites were positively correlated with the content of glass fillers for all groups. The -containing composites had lower flexural strength than the control, which can be due to the long silicone side chain of SMA-MEO and the lower concentration of rigid benzene rings, which results in a looser and weaker polymer network structure [33]. Although the FS of all the SMA-MEO containing resin composites were lower than those of the control groups, they were all much higher than the requirements of ISO standards in FS; thus, hypothesis (1) is acceptable.
Table. 3 exhibited the surface roughness and the amount of adsorbed mucin of all experimental resin composites. All polished samples had identical surface roughness. With the same mass ratios of fillers, the amount of adsorbed mucin on the surface of the SMA-MEO-containing composite was lower than that on the surface of the control (p < 0.05). For the same resin formulation, resin composites with 65 wt% and 70 wt% fillers had the same amount of adsorbed mucin (p > 0.05), and the amount increased when the mass ratio of fillers increased to 72 wt%.
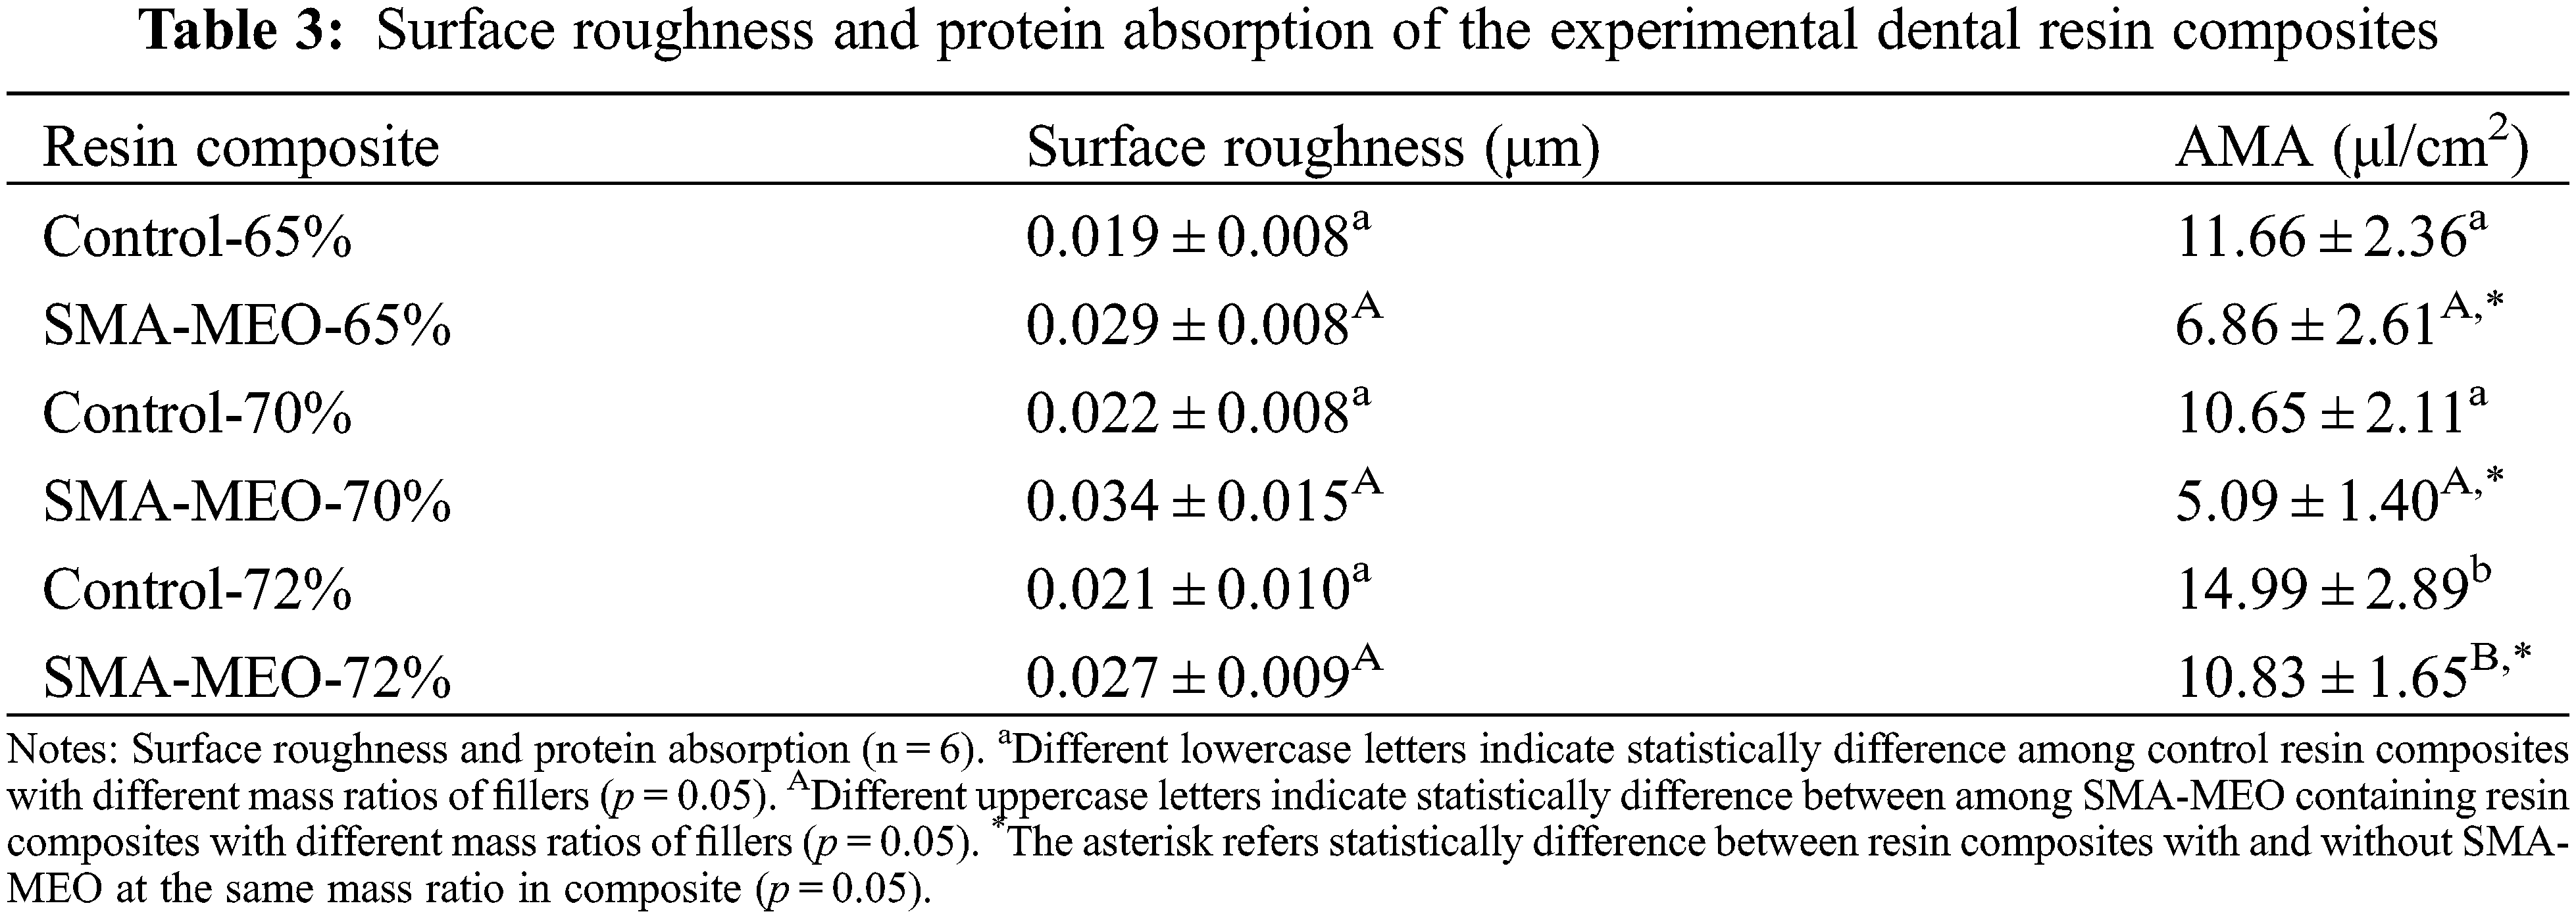
Fig. 3 shows the contact angle (A) and SFE (B) of experimental resin composites. With the same mass ratio of fillers, the SMA-MEO-containing groups had a higher water contact angle and lower surface free energy than the control groups (p < 0.05). For the same resin formulation, the mass ratio of fillers had no influence on the water contact angle and surface free energy (p > 0.05).
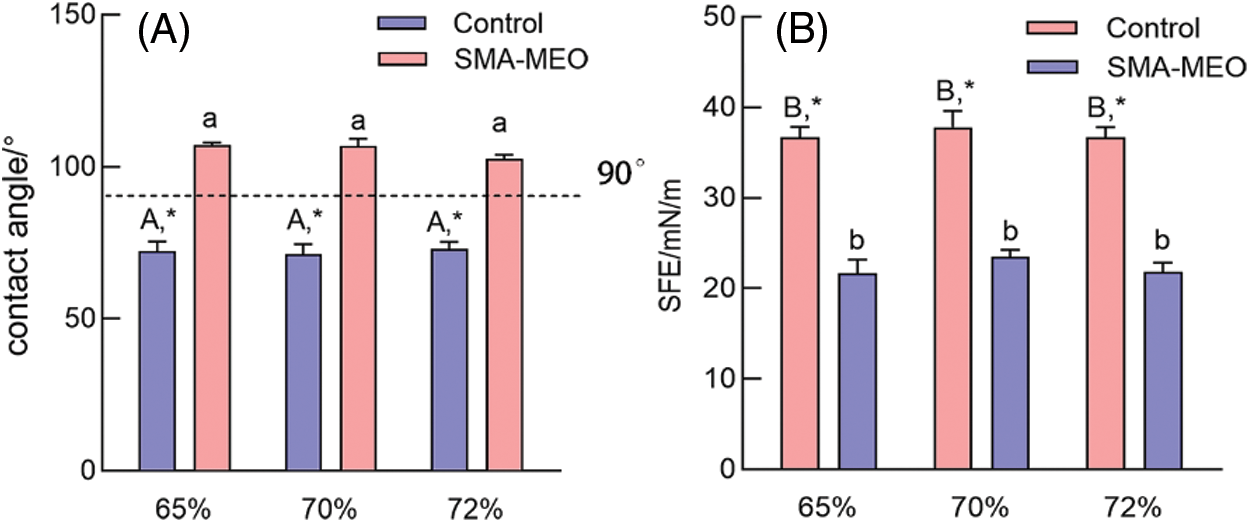
Figure 3: The water contact Angle (A) and SFE (B) of experimental dental resin composites
Notes: aDifferent lowercase letters indicate statistically difference among control resin composites with different mass ratios of fillers (p = 0.05). ADifferent uppercase letters indicate statistically difference between among SMA-MEO containing resin composites with different mass ratios of fillers (p = 0.05). *The asterisk refers statistically difference between resin composites with and without SMA-MEO at the same mass ratio in composite (p = 0.05).
Biomaterial surface properties, such as surface roughness (SR) and surface free energy (SFE), have a large influence on bacterial adherence. A rough surface promotes bacterial colonization by enhancing attachment regions and preventing bacterial colonies from being dislodged. Thermodynamic laws dictate that a material with a high SFE draws more germs to its surface than one with a low SFE [34]. The roughness of the material surface will not significantly change with the same polishing technique, so the surface energy of the material will have a more important impact on the biological adhesion of the surface. Therefore, to achieve the purpose of anti-adhesion, we need to pay attention to the surface energy of materials in clinical applications. Silicone-based materials with low surface energy have already been employed in various industries for bacterial adhesion prevention, anti-fouling, and anti-contamination [16]. This was the inspiration to introduce silicone groups in the resin matrix. There was no significant difference between all resin composite in terms of surface roughness (p > 0.05), and the value of SR was below 0.04 μm. Recently, it was reported that surface roughness had no effect on the early bacterial attachment on extremely smooth surfaces (Ra 0.02–0.06 m), and there was a positive association between bacterial adhesion and the surface SFE [35], which was supported by the results of our study.
The result of CFU counts is shown in Fig. 4. The colonies of S. mutans adherence on the samples of the SMA-MEO-containing groups were significantly lower than those of the control groups (p < 0.05). The experimental results of the anti-biofilm property are depicted in Fig. 5. In the CLSM analysis (a), mature and multilayer biofilm structures were observed on the surfaces of all groups. The living cells are shown in green while the dead cells are shown in red. The amount of biomass in S. mutans biofilms (c) was quantified by Image J. The 24 h biofilms formed on the SMA-MEO containing specimens were reduced in visible biomass compared to the corresponding control groups (p < 0.05). There was no statistical difference between the groups in the MTT test (d) (p > 0.05).
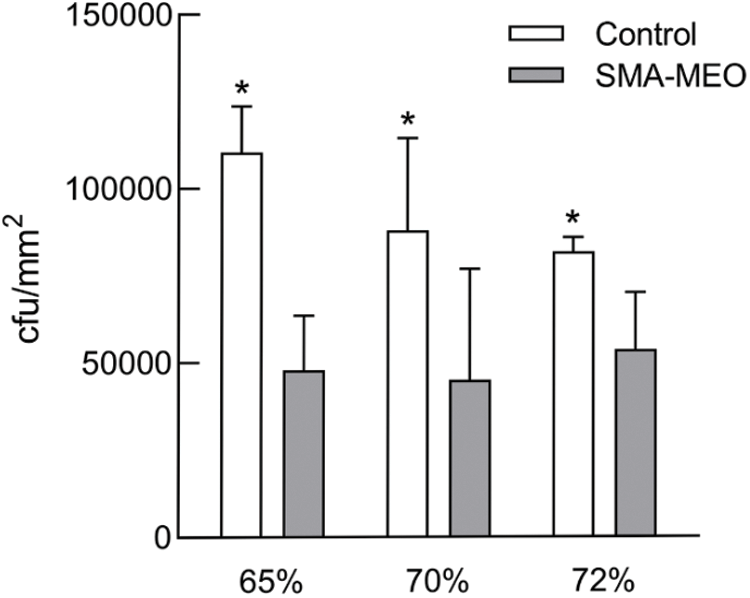
Figure 4: The colony counts of S. mutans on the surfaces of experimental dental resin composites after 24 h incubation
Note: *The asterisk refers the statistical difference between resin composites with and without SMA-MEO at the same mass ratio in composite (p = 0.05).
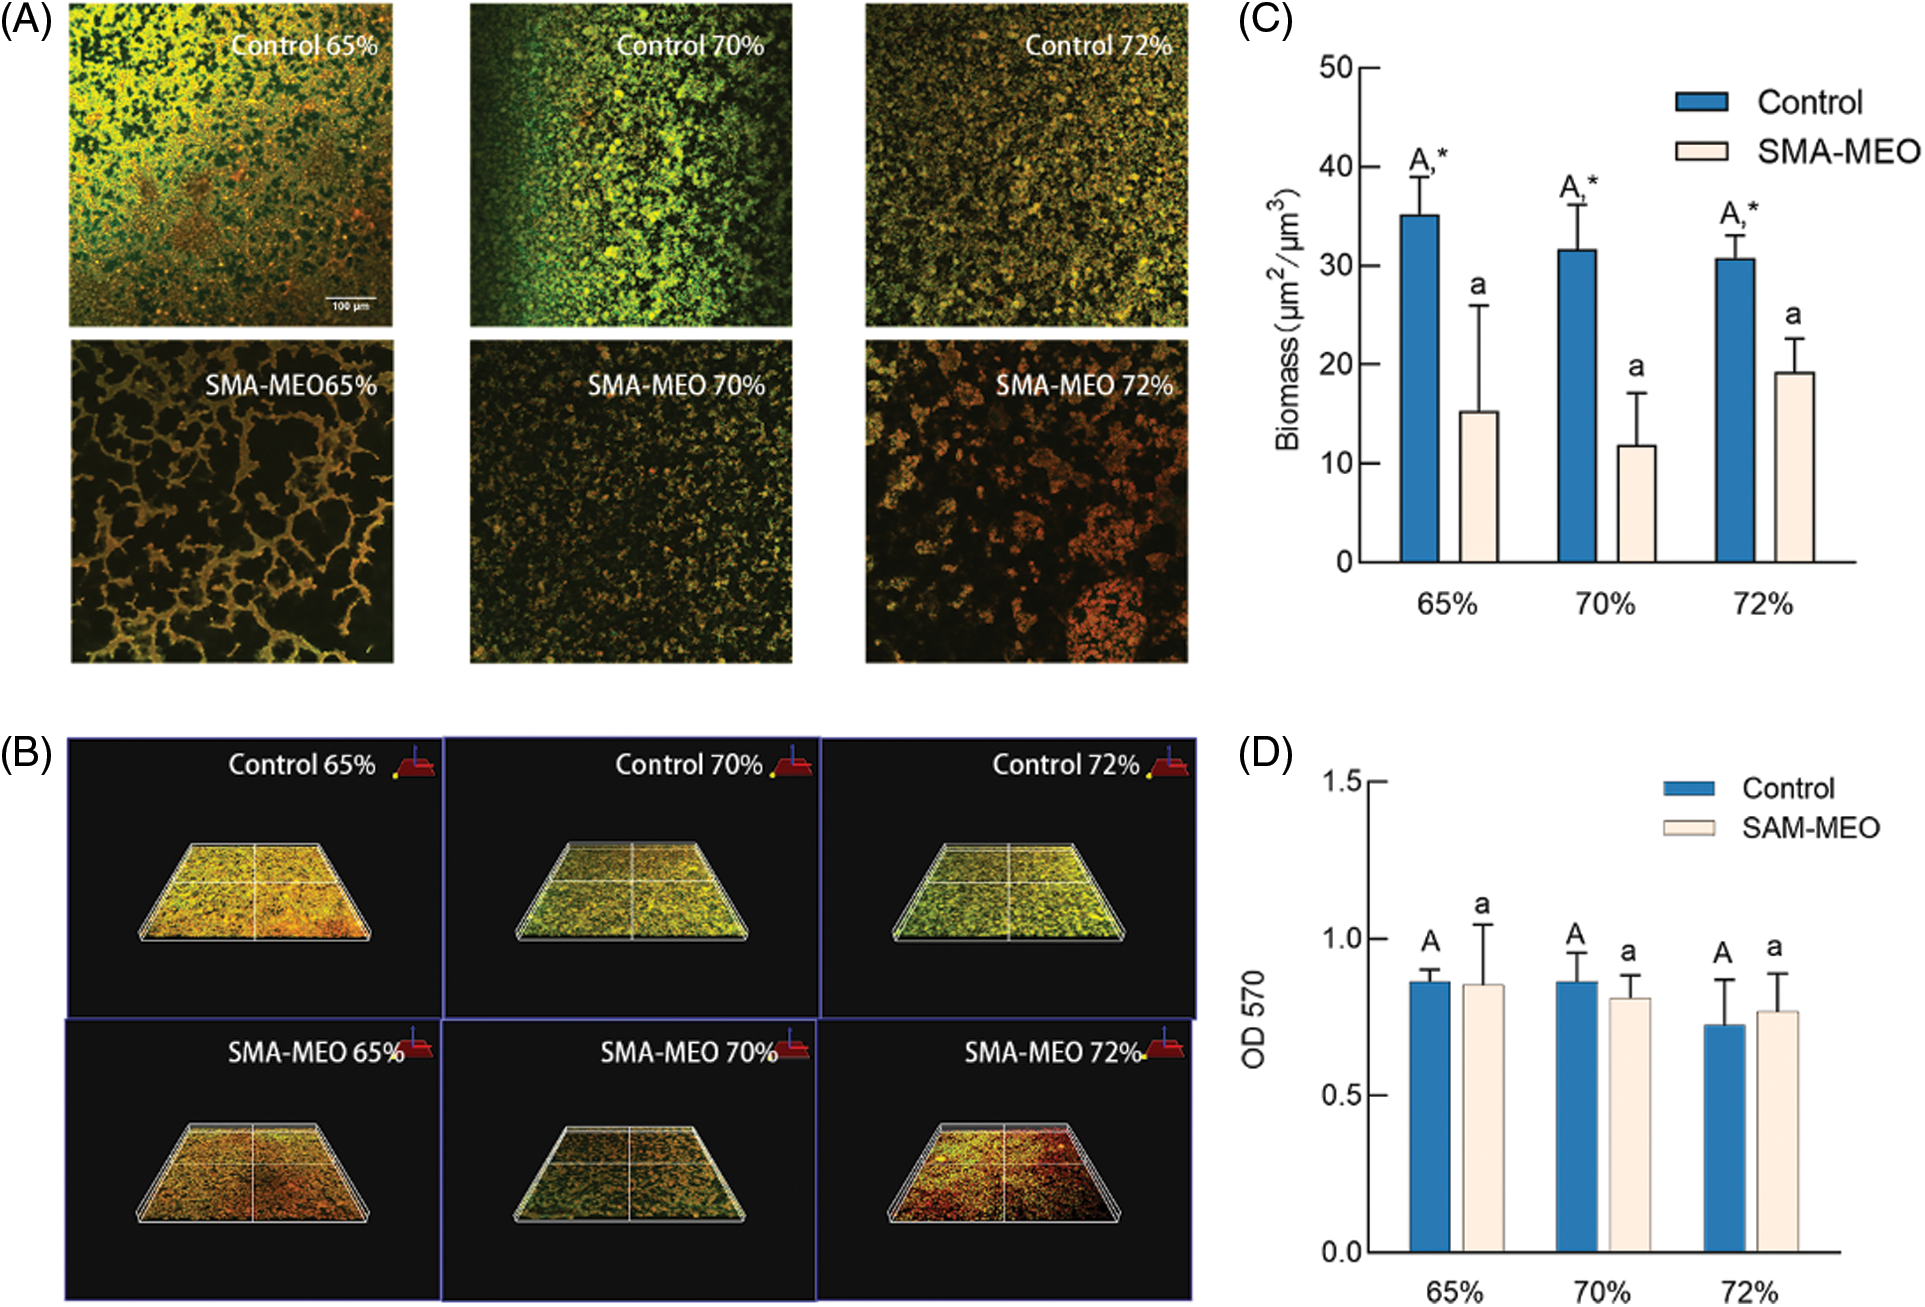
Figure 5: The results of anti-bacterial biofilm test. (A) Live/Dead staining (B) Three dimensional imaging of plaque biofilm staining (C) Biomass (D) MTT
Notes: aDifferent lowercase letters indicate statistically difference among control resin composites with different mass ratios of fillers (p = 0.05). ADifferent uppercase letters indicate statistically difference between among SMA-MEO containing resin composites with different mass ratios of fillers (p = 0.05). *The asterisk refers statistically difference between resin composites with and without SMA-MEO at the same mass ratio in composite (p = 0.05).
Upon exposure to the oral environment, the tooth surfaces are immediately covered with a layer of salivary protein, which is as acquired enamel pellicle [36]. The initial attachment of oral bacteriato the tooth surface and the subsequent formation of dental biofilms depend on the composition of the acquired salivary pellicle [37]. This was related to the development of caries. Mucin, which is an active saliva protein [38], was used to explore the adhesion ability of the new resin protein in this study. As a result of its low surface energy, SMA-MEO can offer resin composites with resistance to mucin adsorption.
The formation of plaque biofilm is based on the early colonized bacteria [39]. The first colonizing bacteria in the oral cavity are streptococci and actinomycetes [40]. The results of adhesion and film formation of S. mutans on each composite group showed that the colonies and biomass on the surface of SMA-MEO-containing composites were significantly lower, but there was no apparent color difference in the images presented by live/death staining, and the results of MTT test also showed no statistical difference from the control groups. Furthermore, no statistically significant difference was evident between the mean scores of groups with various filler contents in regard to the adhesive resistance of silicone resin. We could assume that hypothesis (2) is true. Although investigations of enzymatic tetrazolium salt reduction were initially employed in eukaryotic cell research, MTT tests are now routinely used for microbial cell viability assessments [41]. All of the above results indicated that the SMA-MEO-containing composites can only reduce bacterial adhesion, but not kill or inhibit the growth of bacteria. Interestingly, the SMA-MEO-70% had the lowest protein adhesion. It was consistent with some results from mechanical property tests, suggesting that this ratio had the best overall performance.
Fig. 6 shows the results of cytotoxicity test (CCK-8). The toxicity was generally low for all experimental resins tested, as shown in the graph. Biocompatibility is necessary for the safety of dental resin composites. When polymerization reactions are incomplete or the resin matrix is degraded, residual monomers and byproducts can leak into the oral environment, causing cytotoxicity [42]. CCK-8 has been widely used to study cell proliferation and cytotoxicity because of its ease of use, quick detection, high sensitivity, and great reproducibility [43]. The cytotoxicity of the three groups of produced resin composites revealed that they are possibly safe for clinical use based on cytotoxicity grade requirements. Composite resins containing SMA-MEO had a higher monomer dissolution rate but did not inhibit cell growth, which suggested that the new monomer may be more biocompatible than the conventional monomer.
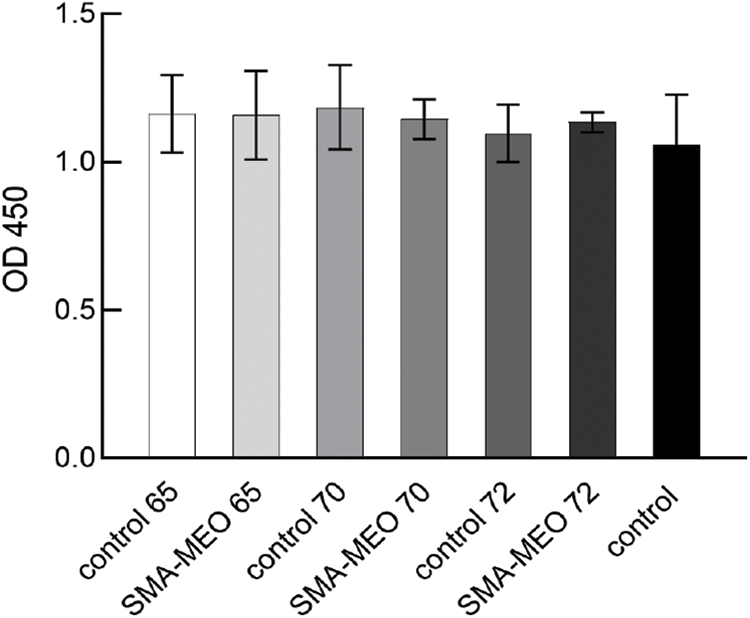
Figure 6: CCK-8 results from extractions of experimental dental resin composites (p = 0.05)
Inorganic fillers of 65 wt% to 72 wt% can be added to SMA-MEO resin composites to meet ISO standard requirements regarding flexural properties. In conclusion, silicon based resin composites could be used to decrease polymerization shrinkage, bacterial adhesion, and protein adsorption. They had no negative effects on the biocompatibility of the complex. Moreover, the 70% BSM group had the best mechanical and biological properties, which could guide the further formulation of composite materials.
Acknowledgement: The authors gratefully acknowledge the financial support from the National Natural Science Foundation of China (Nos. 81970974, 82071162) and Guangdong Financial Fund for High-Caliber Hospital Construction (174-2018-XMZC-0001-03-0125/D-15).
Funding Statement: This work was funded by the National Natural Science Foundation of China (Nos. 81970974, 82071162), and Guangdong Financial Fund for High-Caliber Hospital Construction (174-2018-XMZC-0001-03-0125/D-15).
Conflicts of Interest: The authors declare that they have no conflicts of interest to report regarding the present study.
1. Şaramet, V., Meleşcanu-Imre, M., Ţâncu, A. M. C., Albu, C. C., Ripszky-Totan, A. et al. (2021). Molecular interactions between saliva and dental composites resins: A way forward. Materials, 14(10), 2537. DOI 10.3390/ma14102537. [Google Scholar] [CrossRef]
2. Ferracane, J. L. (2011). Resin composite--State of the art. Dental Materials, 27(1), 29–38. DOI 10.1016/j.dental.2010.10.020. [Google Scholar] [CrossRef]
3. Fugolin, A. P. P., Pfeifer, C. S. (2017). New resins for dental composites. Journal of Dental Research, 96(10), 1085–1091. DOI 10.1177/0022034517720658. [Google Scholar] [CrossRef]
4. Beyth, N., Domb, A. J., Weiss, E. I. (2007). An in vitro quantitative antibacterial analysis of amalgam and composite resins. Journal of Dentistry, 35(3), 201–206. DOI 10.1016/j.jdent.2006.07.009. [Google Scholar] [CrossRef]
5. Wang, Y., Costin, S., Zhang, J., Liao, S., Wen, Z. T., Lallier, T. et al. (2020). Synthesis, antibacterial activity, and biocompatibility of new antibacterial dental monomers. American Journal of Dentistry, 31(Sp Is B), 17B–23B. [Google Scholar]
6. Boaro, L. C. C., Campos, L. M., Varca, G. H. C., dos Santos, T. M. R., Marques, P. A. et al. (2019). Antibacterial resin-based composite containing chlorhexidine for dental applications. Dental Materials, 35(6), 909–918. DOI 10.1016/j.dental.2019.03.004. [Google Scholar] [CrossRef]
7. Kasraei, S., Sami, L., Hendi, S., Alikhani, M. Y., Rezaei-Soufi, L. et al. (2014). Antibacterial properties of composite resins incorporating silver and zinc oxide nanoparticles on streptococcus mutans and lactobacillus. Restorative Dentistry and Endodontics, 39(2), 109–114. DOI 10.5395/rde.2014.39.2.109. [Google Scholar] [CrossRef]
8. Imazato, S., Kinomoto, Y., Tarumi, H., Ebisu, S. R., Tay, F. (2003). Antibacterial activity and bonding characteristics of an adhesive resin containing antibacterial monomer MDPB. Dental Materials, 19(4), 313–319. DOI 10.1016/S0109-5641(02)00060-X. [Google Scholar] [CrossRef]
9. Bhadila, G., Baras, B. H., Weir, M. D., Wang, H., Melo, M. A. S. et al. (2020). Novel antibacterial calcium phosphate nanocomposite with long-term ion recharge and re-release to inhibit caries. Dental Materials Journal, 39(4), 678–689. DOI 10.4012/dmj.2019-203. [Google Scholar] [CrossRef]
10. Chatzistavrou, X., Lefkelidou, A., Papadopoulou, L., Pavlidou, E., Paraskevopoulos, K. M. et al. (2018). Bactericidal and bioactive dental composites. Frontiers in Physiology, 9. DOI 10.3389/fphys.2018.00103. [Google Scholar] [CrossRef]
11. Gyo, M., Nikaido, T., Okada, K., Yamauchi, J., Tagami, J. et al. (2008). Surface response of fluorine polymer-incorporated resin composites to cariogenic biofilm adherence. Applied and Environmental Microbiology, 74(5), 1428–1435. DOI 10.1128/AEM.02039-07. [Google Scholar] [CrossRef]
12. Katsikogianni, M., Missirlis, Y. F. (2004). Concise review of mechanisms of bacterial adhesion to biomaterials and of techniques used in estimating bacteria-material interactions. European Cells & Materials, 8, 37–57. DOI 10.22203/eCM.v008a05. [Google Scholar] [CrossRef]
13. Han, A., Tsoi, J. K. H., Lung, C. Y. K., Matinlinna, J. P. (2020). An introduction of biological performance of zirconia with different surface characteristics: A review. Dental Materials Journal, 39(4), 523–530. DOI 10.4012/dmj.2019-200. [Google Scholar] [CrossRef]
14. de Avila, E. D., Lima, R. B. P., Lux, R., Shi, W., Junior, M. J. et al. (2016). The impact of physical chemical characteristics of implant abutment surfaces on bacteria adhesion. Journal of Oral Implantology, 42(2), 153–158. DOI 10.1563/aaid-joi-D-14-00318. [Google Scholar] [CrossRef]
15. Al-Radha, A. S., Dymock, D., Younes, C., O’Sullivan, D. (2012). Surface properties of titanium and zirconia dental implant materials and their effect on bacterial adhesion. Journal of Dentistry, 40(2), 146–153. DOI 10.1016/j.jdent.2011.12.006. [Google Scholar] [CrossRef]
16. Lin, X., Xie, Q., Ma, C., Zhang, G. (2021). Self-healing, highly elastic and amphiphilic silicone-based polyurethane for antifouling coatings. Journal of Materials Chemistry B, 9(5), 1384–1394. DOI 10.1039/D0TB02465A. [Google Scholar] [CrossRef]
17. Tong, H., Liao, M., Huang, X., Liu, F., Mai, S. et al. (2021). Physicochemical properties, anti-adhesion effect against S. mutans, and resistance to mucin adsorption of dental resins contained synthesized silicone methacrylates. Silicon, 1–11. DOI 10.1007/s12633-021-01344-5. [Google Scholar] [CrossRef]
18. Weng, Y., Howard, L., Guo, X., Chong, V. J., Gregory, R. L. et al. (2012). A novel antibacterial resin composite for improved dental restoratives. The Journal of Materials Science: Materials in Medicine, 23(6), 1553–1561. DOI 10.1007/s10856-012-4629-z. [Google Scholar] [CrossRef]
19. Delaviz, Y., Finer, Y., Santerre, J. P. (2014). Biodegradation of resin composites and adhesives by oral bacteria and saliva: A rationale for new material designs that consider the clinical environment and treatment challenges. Dental Materials, 30(1), 16–32. DOI 10.1016/j.dental.2013.08.201. [Google Scholar] [CrossRef]
20. Krüger, J., Maletz, R., Ottl, P., Warkentin, M. (2018). In vitro aging behavior of dental composites considering the influence of filler content, storage media and incubation time. PLoS One, 13(4), e0195160. DOI 10.1371/journal.pone.0195160. [Google Scholar] [CrossRef]
21. Pérez-Mondragón, A. A., Cuevas-Suárez, C. E., Trejo-Carbajal, N., Piva, E., Fernandes da Silva, A. et al. (2019). Evaluation of monomers derived from resorcinol as eluents of bisphenol a glycidyl dimethacrylate for the formulation of dental composite resins. Journal of Applied Polymer Science, 137(16). DOI 10.1002/app.48576. [Google Scholar] [CrossRef]
22. Astvaldsdottir, A., Dagerhamn, J., van Dijken, J. W., Naimi-Akbar, A., Sandborgh-Englund, G. et al. (2015). Longevity of posterior resin composite restorations in adults–A systematic review. Journal of Dentistry, 43(8), 934–954. DOI 10.1016/j.jdent.2015.05.001. [Google Scholar] [CrossRef]
23. Wang, Y., Zhu, M., Zhu, X. X. (2021). Functional fillers for dental resin composites. Acta Biomaterialia, 122, 50–65. DOI 10.1016/j.actbio.2020.12.001. [Google Scholar] [CrossRef]
24. Greener, E. H.,Ferracane, J. L. (1986). The effect of resin formulation on the degree of conversion and mechanical properties of dental restorative resins. Journal of Biomedical Materials Research, 20(1), 121–131. DOI 10.1002/jbm.820200111. [Google Scholar] [CrossRef]
25. Zhou, X., Huang, X., Li, M., Peng, X., Wang, S. et al. (2019). Development and status of resin composite as dental restorative materials. Journal of Applied Polymer Science, 136(44). DOI 10.1002/app.48180. [Google Scholar] [CrossRef]
26. Braga, R. R., Ballester, R. Y., Ferracane, J. L. (2005). Factors involved in the development of polymerization shrinkage stress in resin-composites: A systematic review. Dental Materials, 21(10), 962–970. DOI 10.1016/j.dental.2005.04.018. [Google Scholar] [CrossRef]
27. Herrera-Gonzalez, A. M., Perez-Mondragon, A. A., Cuevas-Suarez, C. E. (2019). Evaluation of bio-based monomers from isosorbide used in the formulation of dental composite resins. Journal of the Mechanical Behavior of Biomedical Materials, 100, 103371. DOI 10.1016/j.jmbbm.2019.103371. [Google Scholar] [CrossRef]
28. Luo, S., Liu, F., He, J. (2019). Preparation of low shrinkage stress dental composite with synthesized dimethacrylate oligomers. Journal of the Mechanical Behavior of Biomedical Materials, 94, 222–228. DOI 10.1016/j.jmbbm.2019.03.016. [Google Scholar] [CrossRef]
29. Xu, T., Li, X., Wang, H., Zheng, G., Yu, G. et al. (2020). Polymerization shrinkage kinetics and degree of conversion of resin composites. Journal of Oral Science, 62(3), 275–280. DOI 10.2334/josnusd.19-0157. [Google Scholar] [CrossRef]
30. Örtengren, U., Wellendorf, H., Karlsson, S., Ruyter, I. E. (2001). Water sorption and solubility of dental composites and identification of monomers released in an aqueous environment. Journal of Oral Rehabilitation, 28(12), 1106–1115. DOI 10.1046/j.1365-2842.2001.00802.x. [Google Scholar] [CrossRef]
31. Janda, R., Roulet, J. F., Latta, M., Ruttermann, S. (2007). Water sorption and solubility of contemporary resin-based filling materials. Journal of Biomedical Materials Research–Part B Applied Biomaterials, 82(2), 545–551. [Google Scholar]
32. Zhang, N., Xie, C. (2020). Polymerization shrinkage, shrinkage stress, and mechanical evaluation of novel prototype dental composite resin. Dental Materials Journal, 39(6), 1064–1071. DOI 10.4012/dmj.2019-286. [Google Scholar] [CrossRef]
33. Fugolin, A. P., de Paula, A. B., Dobson, A., Huynh, V., Consani, R. et al. (2020). Alternative monomer for BisGMA-free resin composites formulations. Dental Materials, 36(7), 884–892. DOI 10.1016/j.dental.2020.04.009. [Google Scholar] [CrossRef]
34. Selwitz, R. H., Ismail, A. I., Pitts, N. B. (2007). Dental caries. The Lancet, 369(9555), 51–59. DOI 10.1016/S0140-6736(07)60031-2. [Google Scholar] [CrossRef]
35. Yuan, C., Wang, X., Gao, X., Chen, F., Liang, X. et al. (2016). Effects of surface properties of polymer-based restorative materials on early adhesion of Streptococcus mutans in vitro. Journal of Dentistry, 54, 33–40. DOI 10.1016/j.jdent.2016.07.010. [Google Scholar] [CrossRef]
36. Heller, D., Helmerhorst, E. J., Gower, A. C., Siqueira, W. L., Paster, B. J. et al. (2016). Microbial diversity in the early in vivo-formed dental biofilm. Applied and Environmental Microbiology, 82(6), 1881–1888. DOI 10.1128/AEM.03984-15. [Google Scholar] [CrossRef]
37. Humphrey, S. P., Williamson, R. T. (2001). A review of saliva: Normal composition, flow, and function. The Journal of Prosthetic Dentistry, 85(2), 162–169. DOI 10.1067/mpr.2001.113778. [Google Scholar] [CrossRef]
38. Dawes, C., Pedersen, A. M., Villa, A., Ekstrom, J., Proctor, G. B. et al. (2015). The functions of human saliva: A review sponsored by the world workshop on oral medicine VI. Archives of Oral Biology, 60(6), 863–874. DOI 10.1016/j.archoralbio.2015.03.004. [Google Scholar] [CrossRef]
39. Rabin, N., Zheng, Y., Opoku-Temeng, C., Du, Y., Bonsu, E., et al. (2015). Biofilm formation mechanisms and targets for developing antibiofilm agents. Future Medicinal Chemistry, 7(4), 493–512. DOI 10.4155/fmc.15.6. [Google Scholar] [CrossRef]
40. Dige, I., Nilsson, H., Kilian, M., Nyvad, B. (2007). In situ identification of streptococci and other bacteria in initial dental biofilm by confocal laser scanning microscopy and fluorescence in situ hybridization. European Journal of Oral Sciences, 115(6), 459–467. DOI 10.1111/j.1600-0722.2007.00494.x. [Google Scholar] [CrossRef]
41. Grela, E., Kozlowska, J., Grabowiecka, A. (2018). Current methodology of MTT assay in bacteria–A review. Acta Histochemica, 120(4), 303–311. DOI 10.1016/j.acthis.2018.03.007. [Google Scholar] [CrossRef]
42. Candea Ciurea, A., Surlin, P., Stratul, S. I., Soanca, A., Roman, A. et al. (2019). Evaluation of the biocompatibility of resin composite-based dental materials with gingival mesenchymal stromal cells. Microscopy Research and Technique, 82(10), 1768–1778. DOI 10.1002/jemt.23343. [Google Scholar] [CrossRef]
43. Wu, X., Dai, S., Chen, Y., He, F., Xie, H. et al. (2019). Reinforcement of dental resin composite via zirconium hydroxide coating and phosphate ester monomer conditioning of nano-zirconia fillers. Journal of the Mechanical Behavior of Biomedical Materials, 94, 32–41. DOI 10.1016/j.jmbbm.2019.03.002. [Google Scholar] [CrossRef]
 | This work is licensed under a Creative Commons Attribution 4.0 International License, which permits unrestricted use, distribution, and reproduction in any medium, provided the original work is properly cited. |