| Journal of Renewable Materials |
DOI: 10.32604/jrm.2022.021157
ARTICLE
Research on Printing Quality Evaluation of Decorative Paper Based on AHP-EWM Model
1Faculty of Printing, Packaging Engineering and Digital Media Technology, Xi’an University of Technology, Xi’an, 710048, China
2Shaanxi Provincial Key Laboratory of Printing and Packaging Engineering, Xi’an University of Technology, Xi’an, 710048, China
*Corresponding Author: Shisheng Zhou. Email: zhoushisheng@xaut.edu.cn
Received: 30 December 2021; Accepted: 25 March 2022
Abstract: Printing quality evaluation is an important means to check whether prints are qualified. However, the current printing quality evaluation system for gravure decorative paper is not perfect. In order to solve this problem, a method for evaluating quality of decorative paper based on analytical hierarchy process (AHP) and the entropy weight method (EWM) model is proposed in this paper. So as to verify the proposed model, decorative paper of different grades was selected as the experimental objects. Firstly, the data about five indices reflecting printing quality were measured. Secondly, the evaluation model was used to assign weights to the indices, and scores in each index were calculated according to scoring tables. Finally, the evaluation scores were statistically analyzed. The results of data analysis showed that the 95% confidence intervals and coefficients of variation were small. The average error of the evaluation system was 0.2061. It indicates that the model can stably distinguish decorative paper of different grades, accuracy of which is high. The research in this paper can provide reference to the quality improvement of decorative paper and the printing quality evaluation of other paper.
Keywords: Quality evaluation; analytic hierarchy process; the entropy weight method; decorative paper
Nomenclature
| | Color difference value |
| K | Relative contrast value |
| Greek Symbols | |
| λ | Eigenvalue |
| σ | Standard deviation |
| μ | Mean value |
| Abbreviations | |
| AHP | Analytic hierarchy process |
| EWM | The entropy method |
| RIP | Raster image processor |
Printing quality evaluation is not only an important step to test prints’ quality, but also an important link to optimize printing processes [1]. Therefore, it is a very necessary subject to build an appropriate evaluation system. The construction of the evaluation system requires a detailed understanding of various factors affecting printing quality for the purpose of designing a real and effective evaluation system.
Petrovic et al. [2] studied the influence of the compressible sleeve exploitation on the process and print quality parameters through the measurement of optical density, tone value increase and trapping. Xu [3] proposed an evaluation method of ceramic 3D printing sample data based on a fuzzy algorithm to improve the evaluation score and accuracy of ceramic 3D printing sample data. Yi et al. [4] established the evaluation and prediction model of printing suitability of cotton fabric by using principal component analysis to evaluate and predict the printing quality of cotton fabric. Yuan et al. [5,6] used qualitative analysis and the quantitative analysis to study the standardization of coloring process and color quality evaluation in color 3D printing technology. Knez et al. [7] investigated the effects of selected printing parameters on the fire properties of additively produced composites from neat polylactic acid (PLA) and wood/PLA filaments. Schambach et al. [8] proposed an automated evaluation pipeline utilizing both light and confocal microscope images as well as multiple quality measures to quantitatively evaluate the quality of the printed microlens arrays. However, these studies did not establish an evaluation model for gravure decorative paper. In this paper, decorative paper was selected as research objects. Considering the tone coordination of the picture, the research on the color and tone of decorative paper is very important. The factors affecting color consistency should be fully considered when establishing the evaluation system.
The purpose of this paper is to design a method for evaluating quality of gravure decorative paper. The proposed model has been verified by experimental data, scoring tables and statistical analysis. This paper presents a subjective and objective evaluation method for decorative paper, which avoids the absoluteness of data and the subjectivity of human judgment. The method can give the evaluation results intuitively. It provides a theoretical basis for the printing quality evaluation and improvement of decorative paper.
2 Printing Processes of Decorative Paper
As shown in Fig. 1, the printing processes of decorative paper mainly include the plate assembly of copies, plate making, printing, impregnation and drying. Among them, printing, impregnation and drying can change the final color presentation of printed matter.
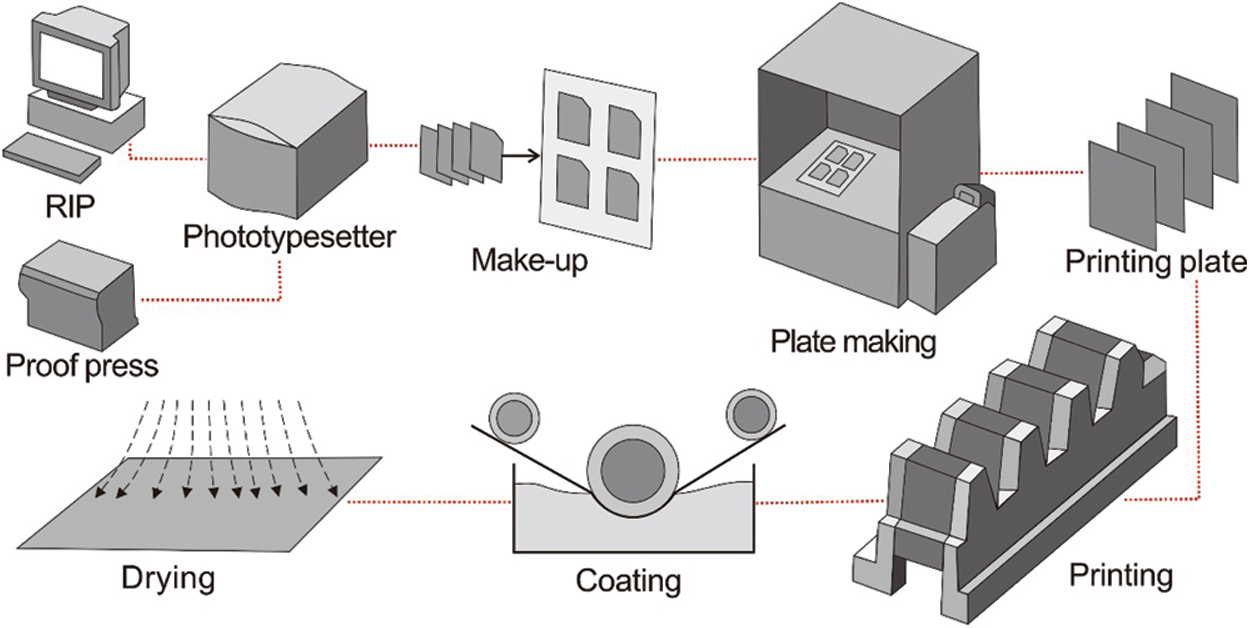
Figure 1: Printing processes of decorative paper
In this paper, decorative paper was obtained by gravure printing. The printing plate cylinder in gravure printing has ink cells structure. That is, decorative paper gets different tone levels by different inking volume [9,10]. The printing principle is presented in Fig. 2. In the printing process, printing speed, pressure and ink viscosity could affect the ink transfer, and then affect the clarity of prints [11,12]. During coating, the selection of different resins and coating processes can ultimately influence the color presentation [13,14]. Due to the immature development of domestic coating technology, color difference and clarity of coating paper are still the main reasons restricting the development of coating paper [15]. In the drying process, different drying methods and temperatures are able to affect the absorption of ink by the paper, and then affect the printing quality [16]. Therefore, this study selected evaluation indices that could reflect the color performance and clarity of printing to evaluate the printing quality of decorative paper.
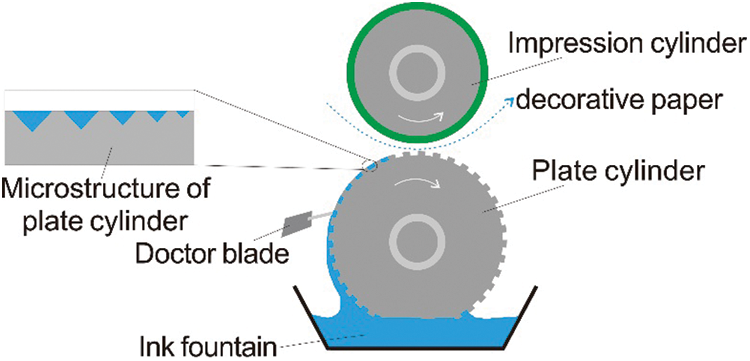
Figure 2: Schematic of gravure printing
So as to comprehensively and accurately evaluate the quality of decorative paper by gravure printing, an evaluation model was established by combining subjective and objective methods, and a complete scoring system was built. The establishment of the scoring system referred to The Paper Based Intaglio Prints for Decorating issued by China’s light industry.
AHP model was proposed by Thomas [17]. AHP is a subjective weighting model. It regards research objects as a system and makes decisions according to the thinking mode of decomposition, comparative judgment and synthesis.
The calculation steps of AHP are as follows:
a) Establish a hierarchical model.
The model consists of target layer, criterion layer and scheme layer. In this paper, the target layer is to evaluate the printing quality of decorative paper. The criterion layer consists of five evaluation indices. The scheme layer is the decorative paper sample to be evaluated.
b) Construct judgment matrix.
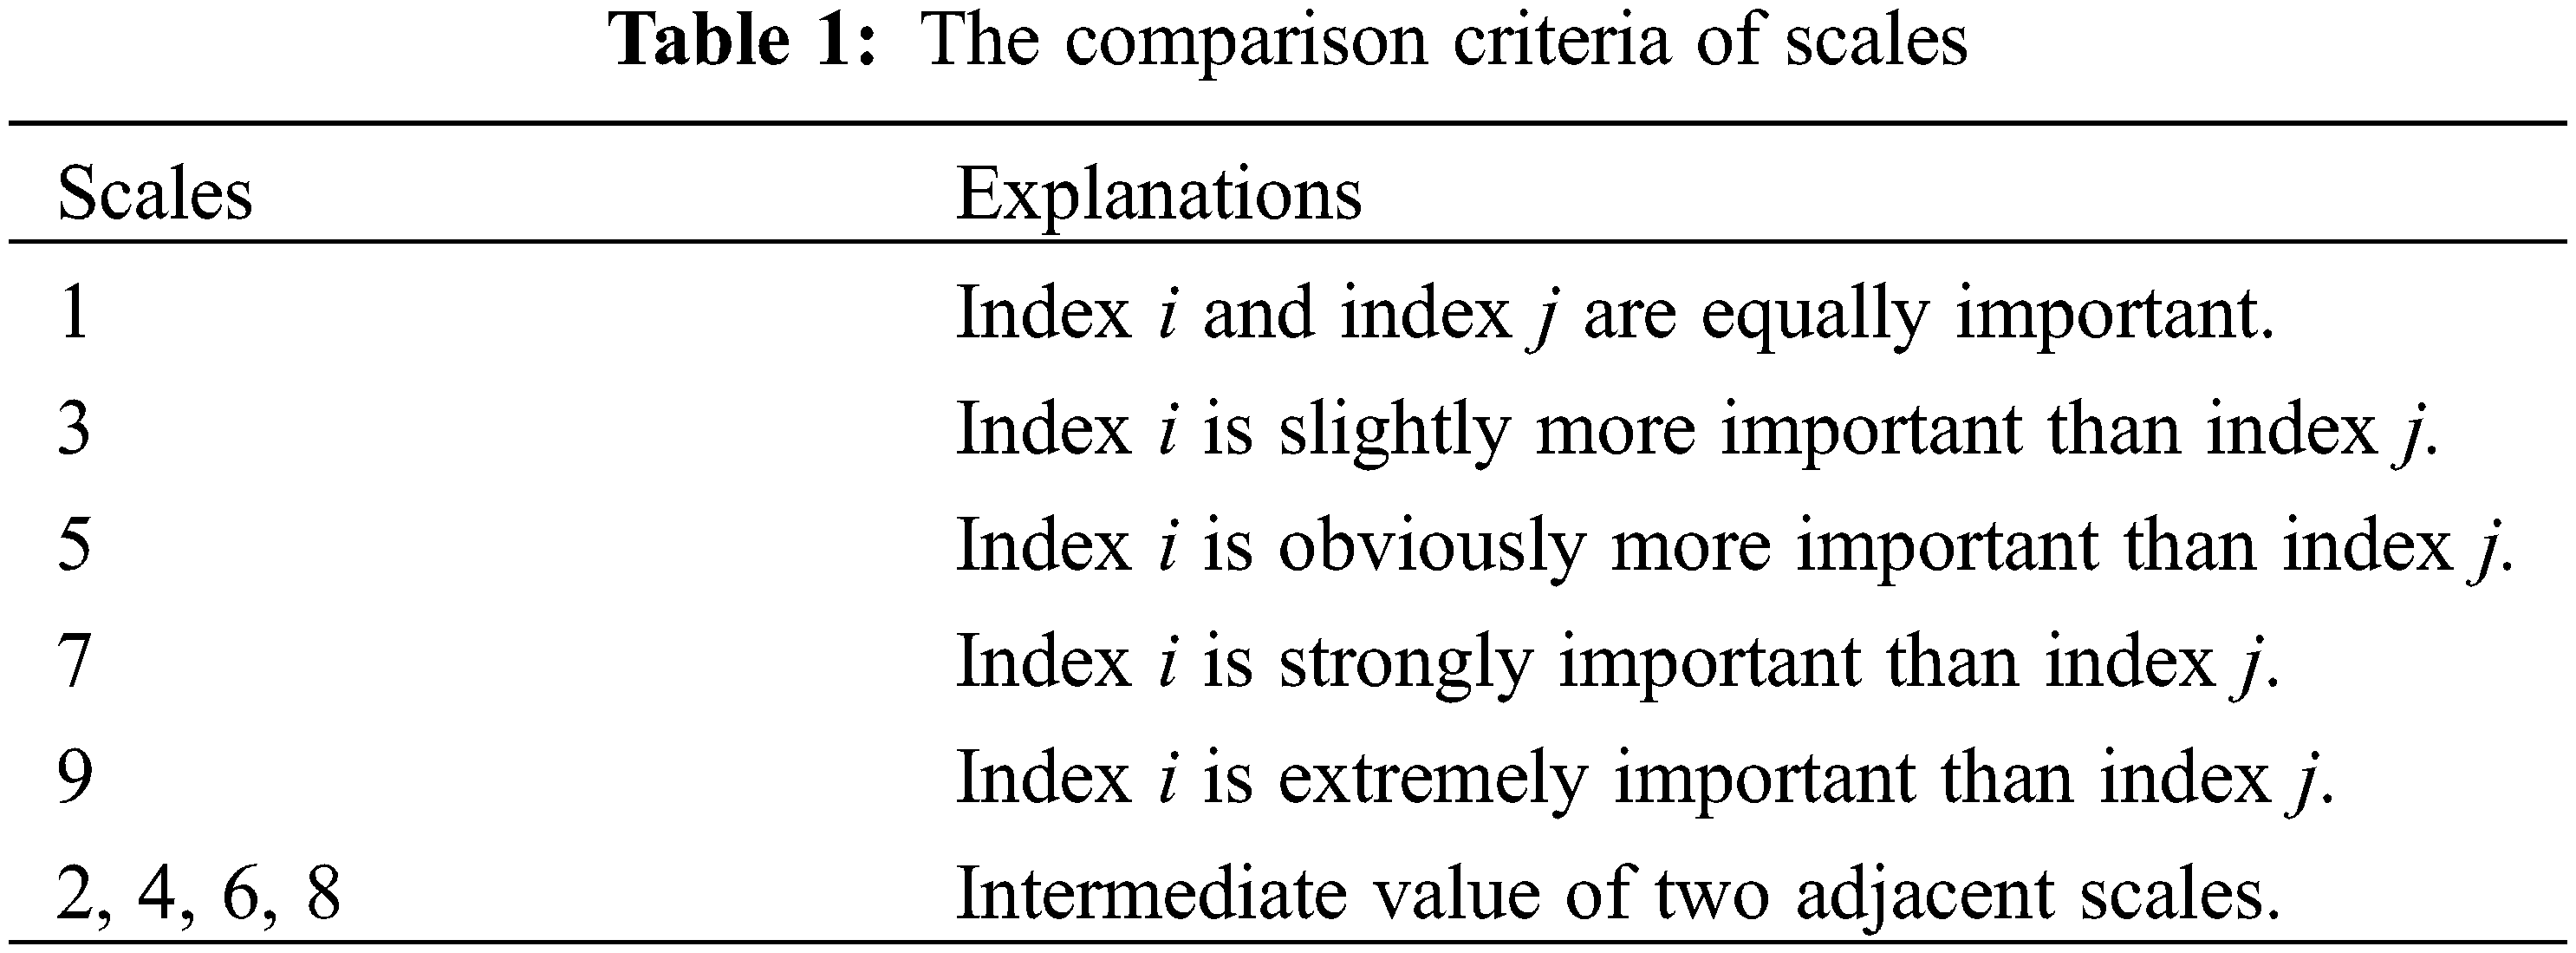
The method of constructing judgment matrix in AHP is to use consistent matrix. That is, they are compared with each other instead of factors together. In this regard, relative scales are adopted to reduce the difficulty of comparing different factors as much as possible and improve the accuracy. The meaning of scale is shown in Table 1.
where aij = 1/aji is the scale between the two indices.
c) Determine the index weight.
Test consistency.
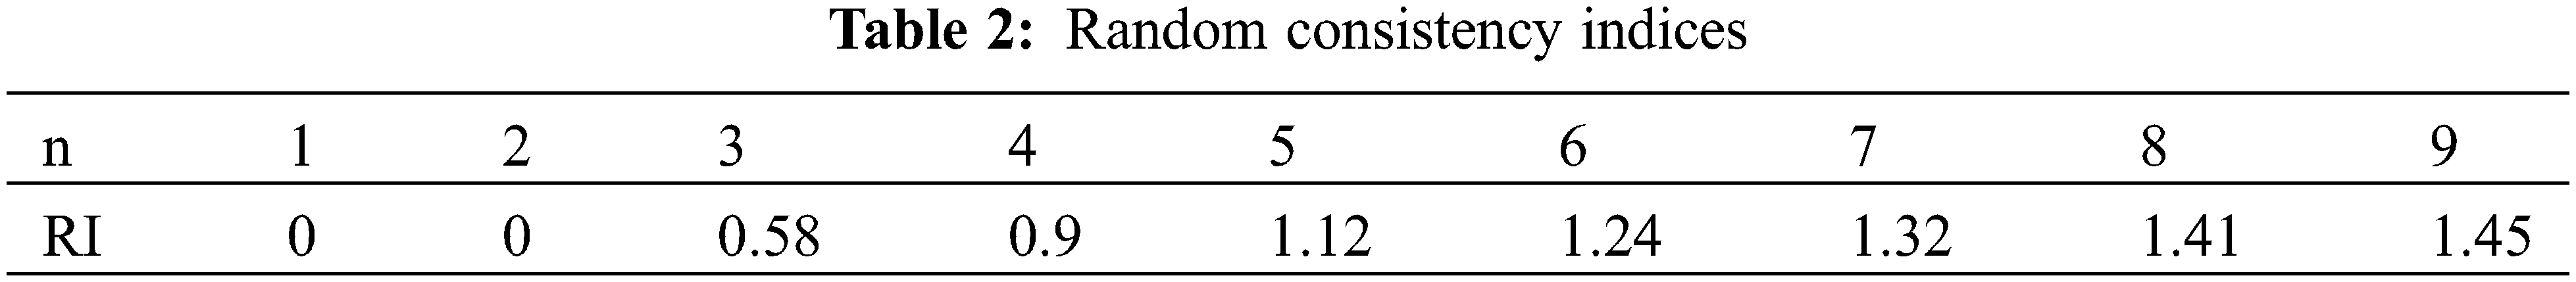
The establishment of judgment matrix is based on experts’ opinions. It is necessary to test its consistency in order to reduce the error caused by subjective factors.
where λmax is the maximum eigenvalue; CR is the random consistency ratio; CI is the consistency index; RI is a random consistency index.
Generally, when CR < 0.1, the matrix is considered to have satisfactory consistency. Otherwise, the judgment matrix needs to be adjusted. Random consistency indices are presented in Table 2.
EWM is an objective weighting method. In the process of specific use, according to the dispersion degree of data of each index, the entropy weight of each index is calculated by using information entropy, so as to obtain a more objective index weight.
The calculation steps of EWM are as follows [18]:
a) Determine indices.
Select n samples and m indices, where is the value of the jth index of the ith sample.
b) Normalize indices.
where j is a positive index.
where j is a negative index.
c) Calculate proportion.
where pij is the proportion of the ith sample in the jth index.
d) Calculate entropy.
e) Calculate redundancy.
f) Calculate the weight of each index.
AHP-EWM model corrects the absoluteness of subjective decision-making and takes into account the importance of indicators in actual production on the premise of ensuring data accuracy. This paper uses the method of combining two weights to obtain final weights.
where
3.2.1 Selection of Evaluation Indices
In this paper, five indices (color difference, ink trapping, relative contrast, dot-gain and overprint deviation) were selected to evaluate the printing quality of color and tone of decorative paper. These indices are explained below.
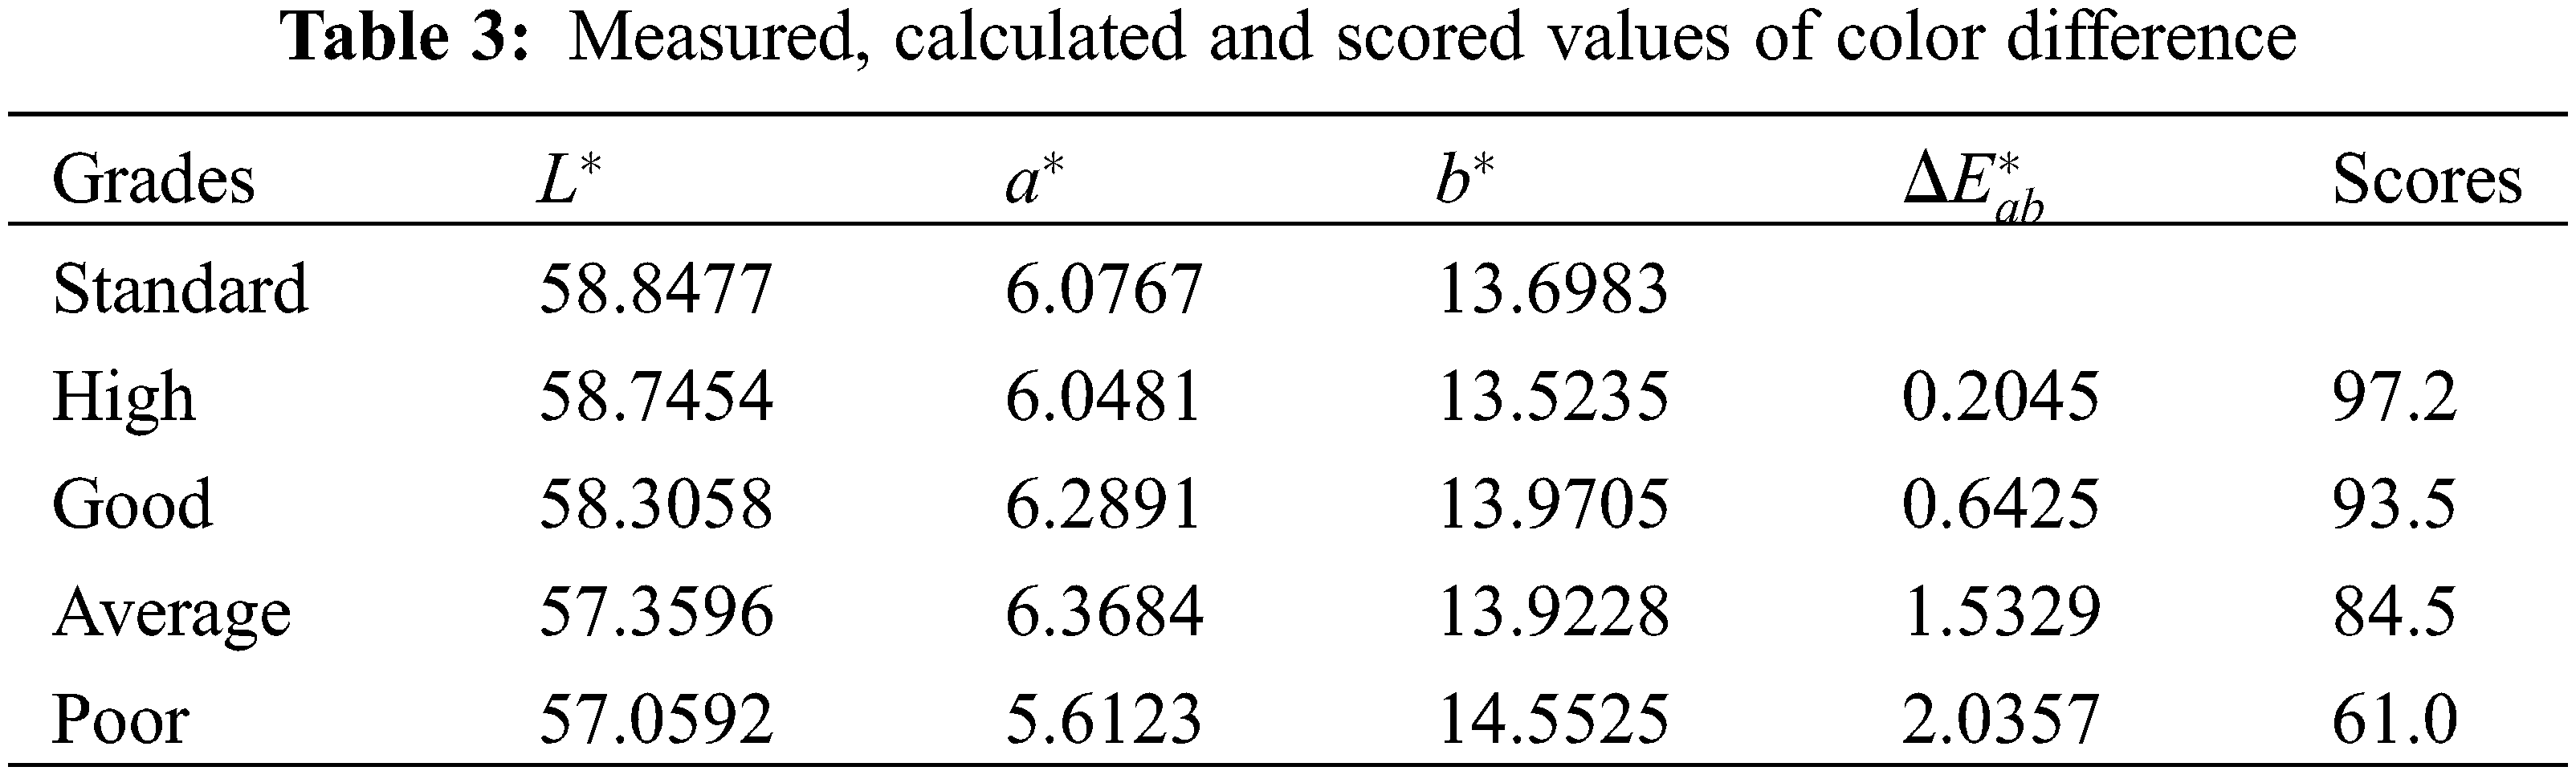
Standardized in 1976 as a uniform color space, CIELAB is extensively utilized in color science and engineering applications [19]. Therefore, the color performance of decorative paper can be characterized by CIE1976 color difference.
where
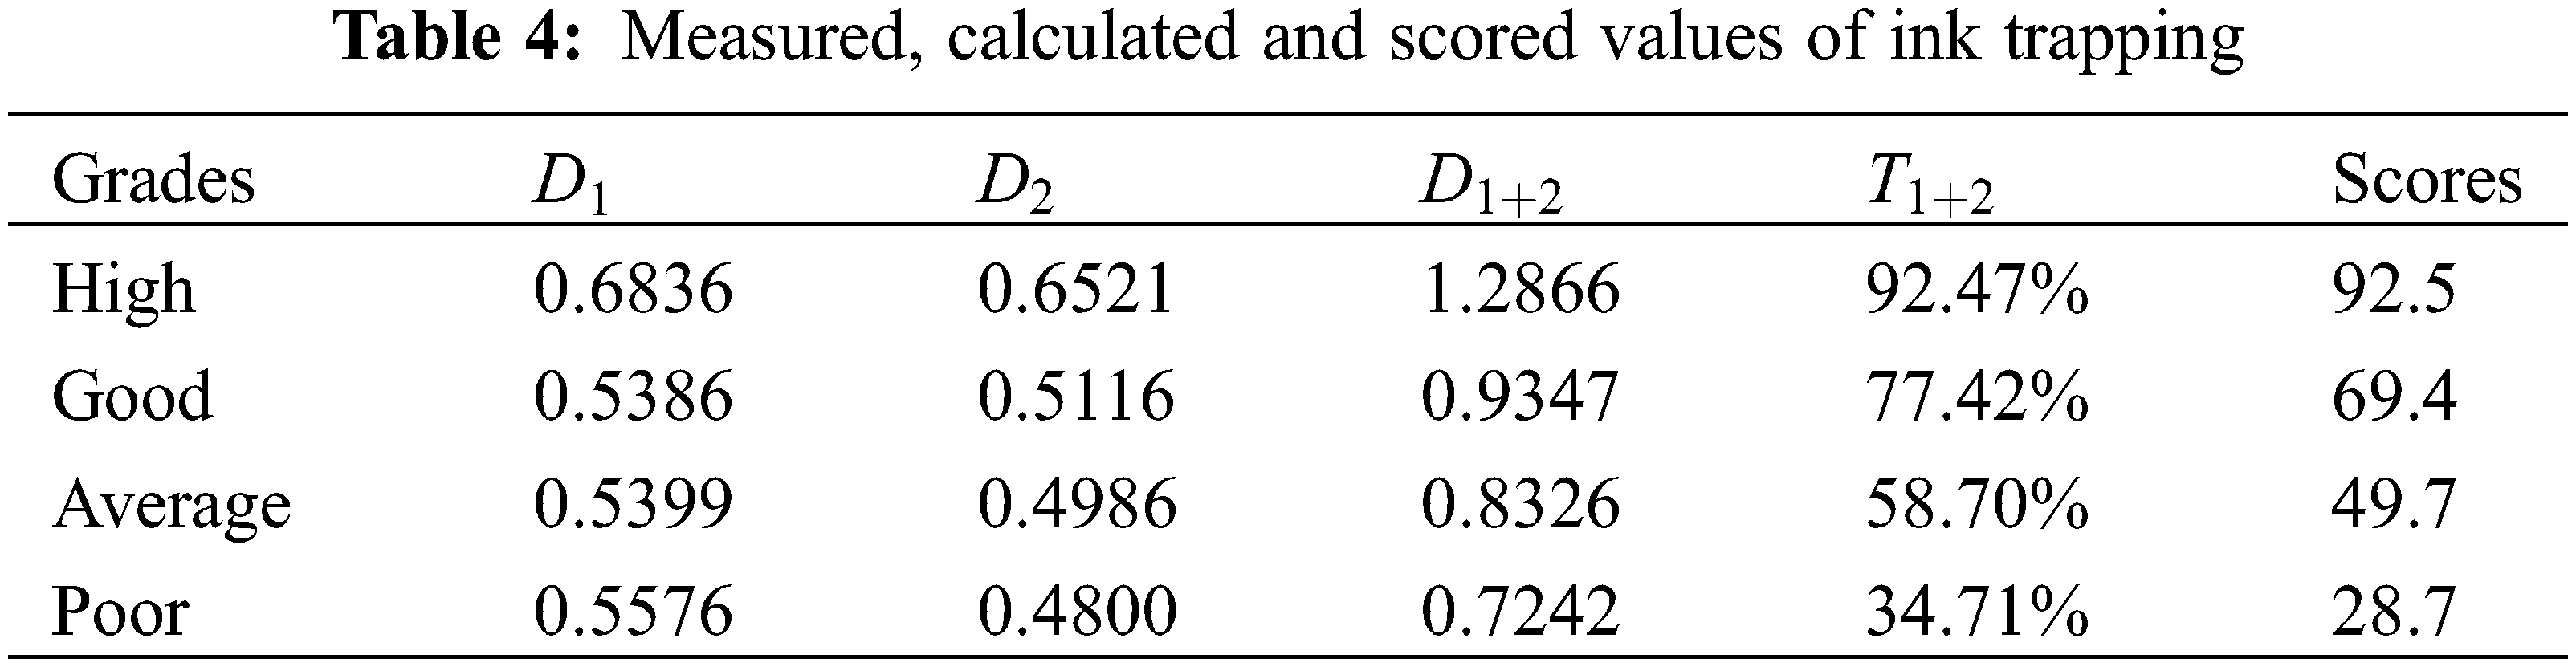
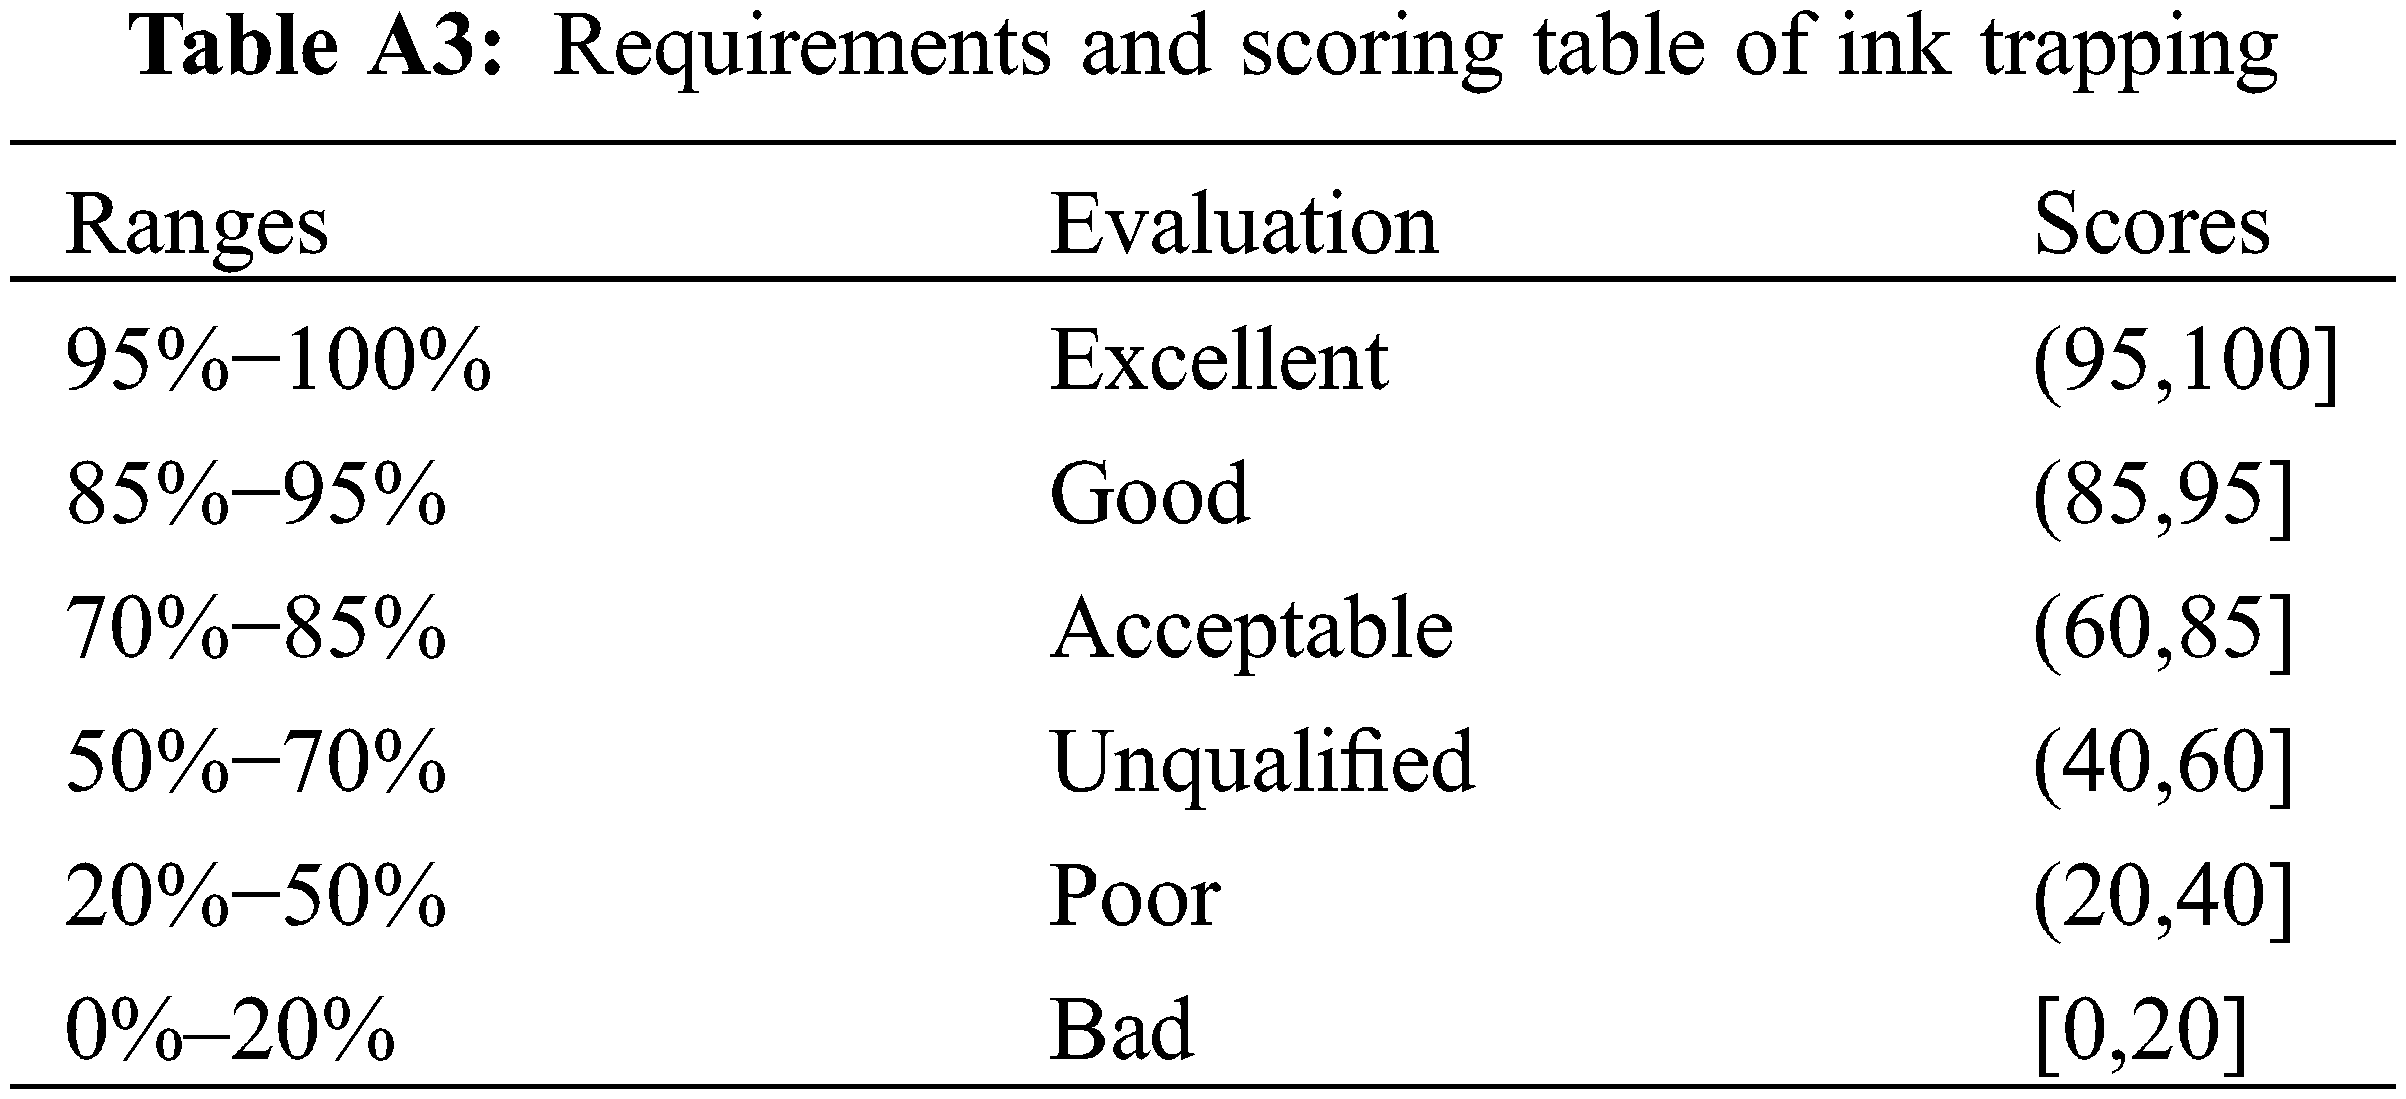
Ink trapping can reflect the color effect of overprint parts in multi-color printing, so quality levels of decorative paper can be divided according to it [20].
where T1+2 is ink trapping value; D1 is the density value of the first printed color; D2 is the density value of the second printed color; D1+2 is the color density value of the overprint part.
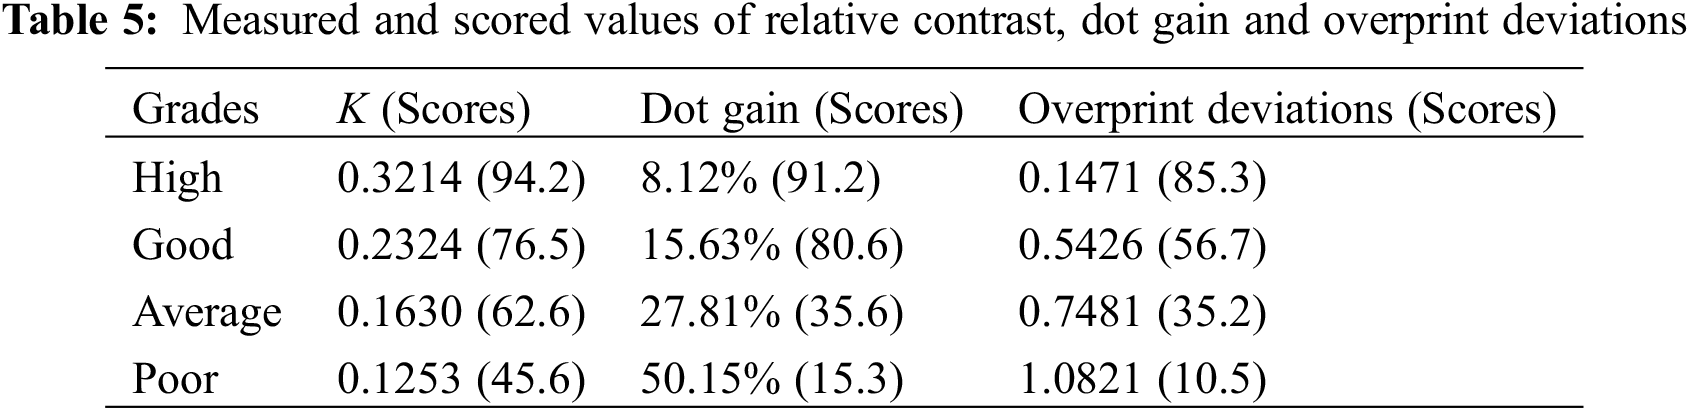
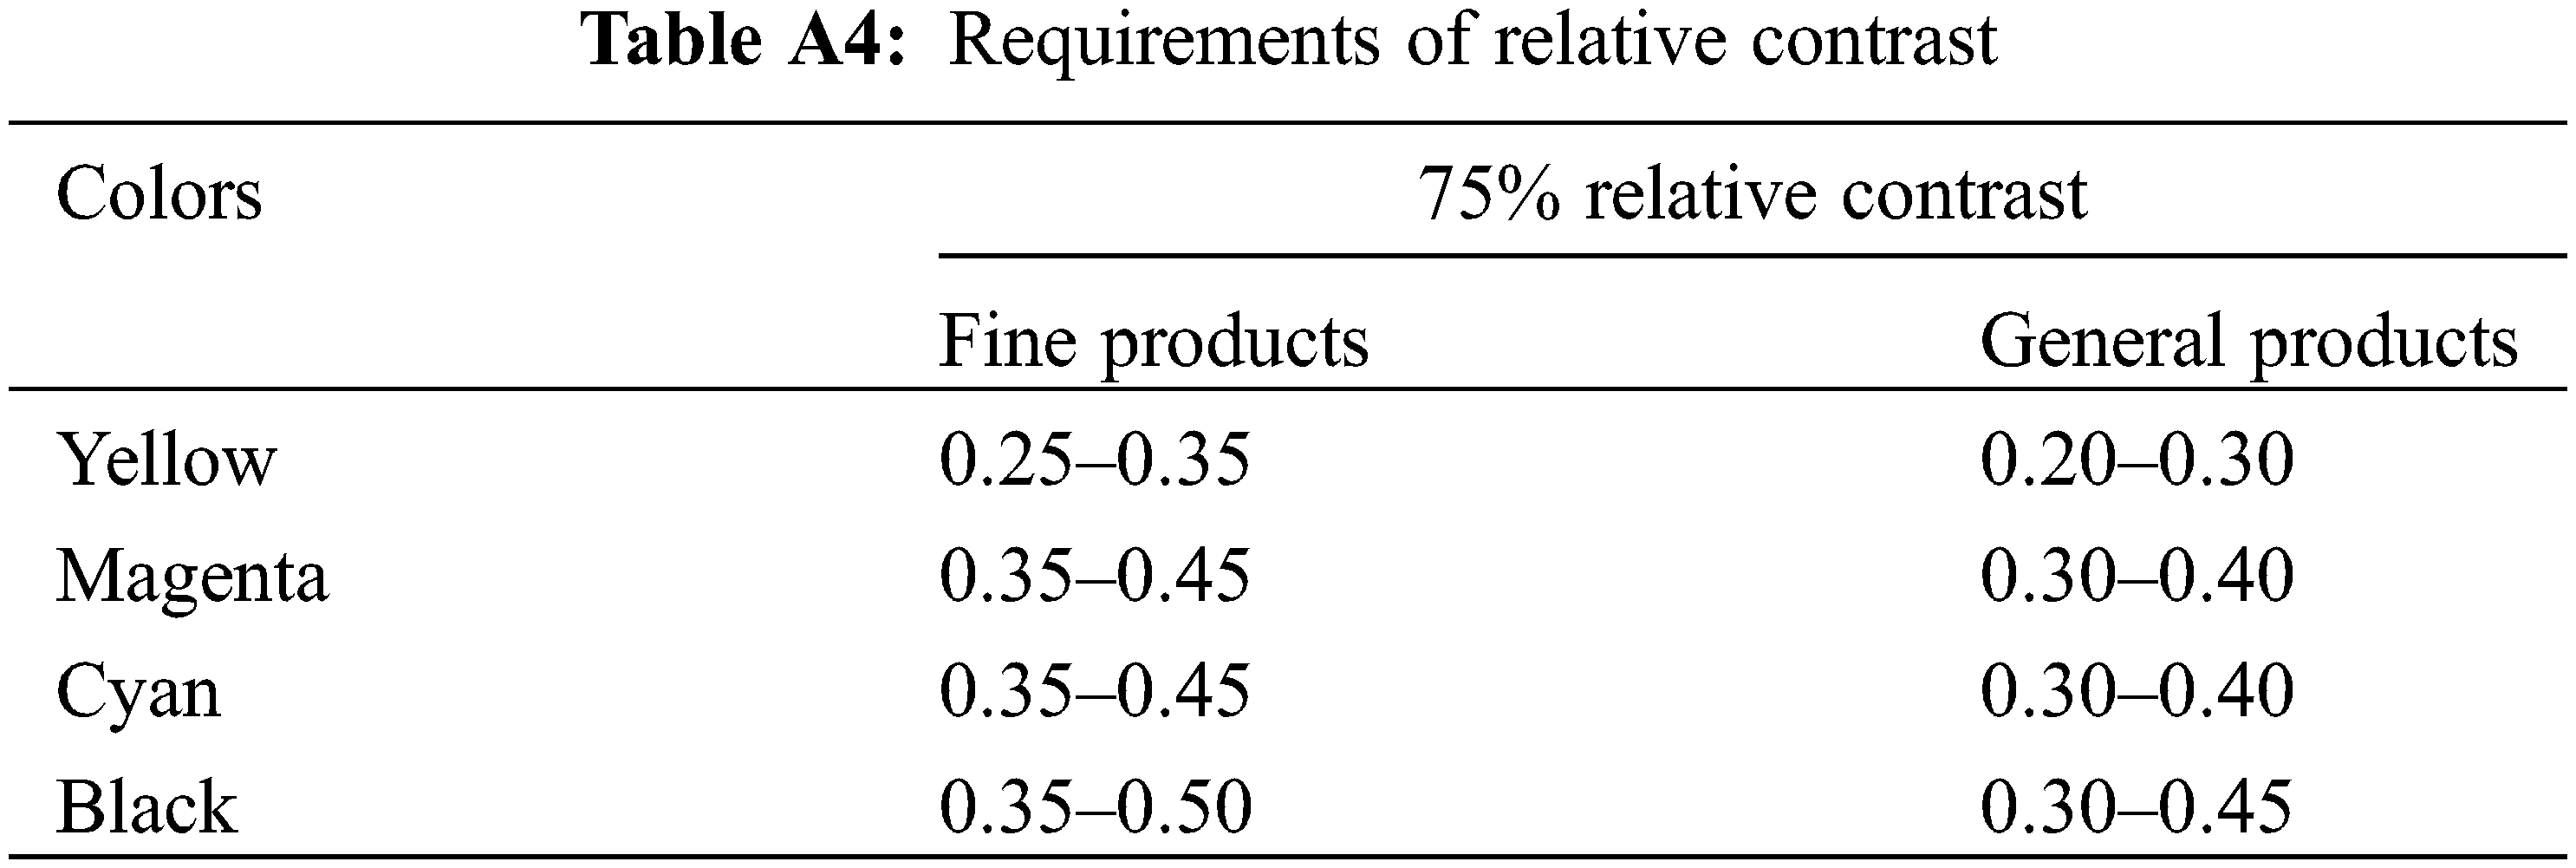
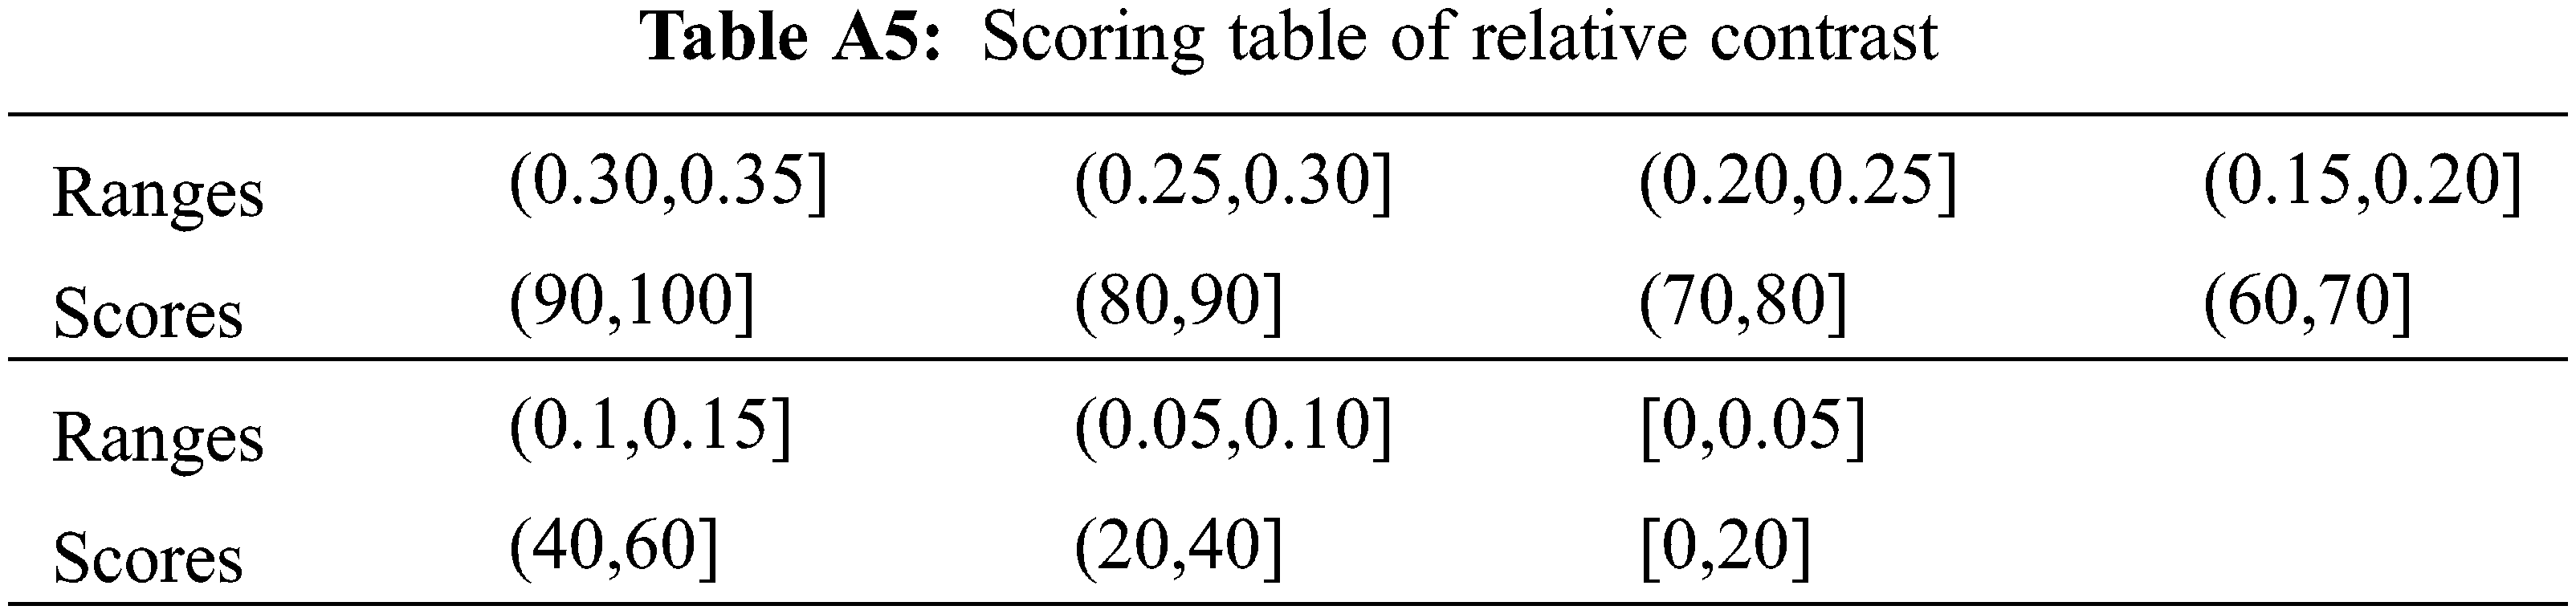
The area with dot area ratio of 75% is the part where the halftone print transits from middle tone to dark tone. Therefore, this area can best reflect whether decorative paper has enough sense of hierarchy and contrast. So it is selected to measure the relative contrast value (K).
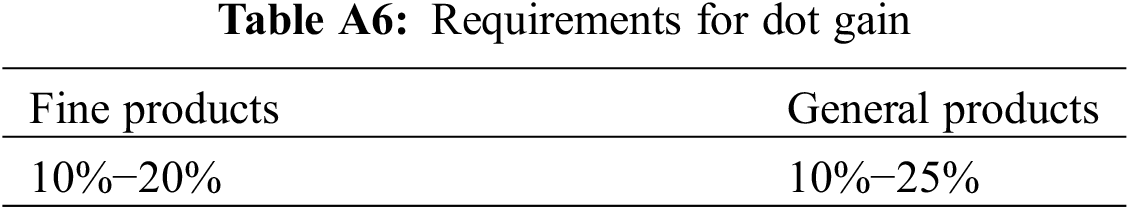
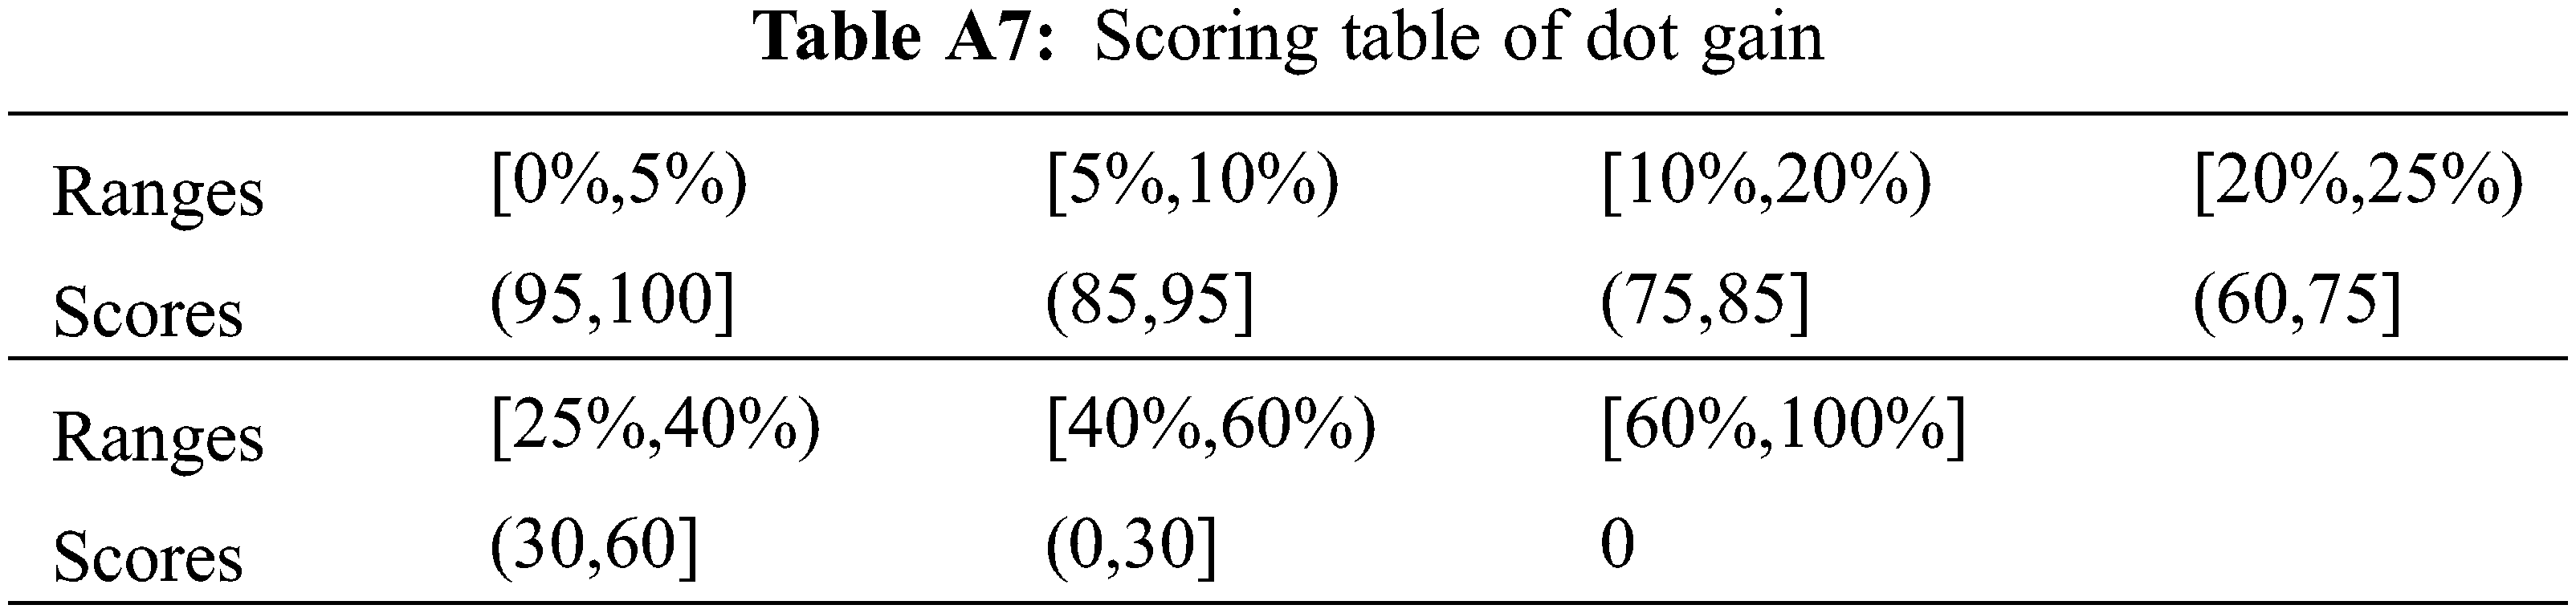
The micro changes of dots in printing change tone levels of decorative paper macroscopically [21]. Because the middle tone of the picture is the most, color blocks with dot area ratio of 50% are selected to measure dot gain. The middle tone areas of decorative paper are easily blurred, as shown in Fig. 3A.
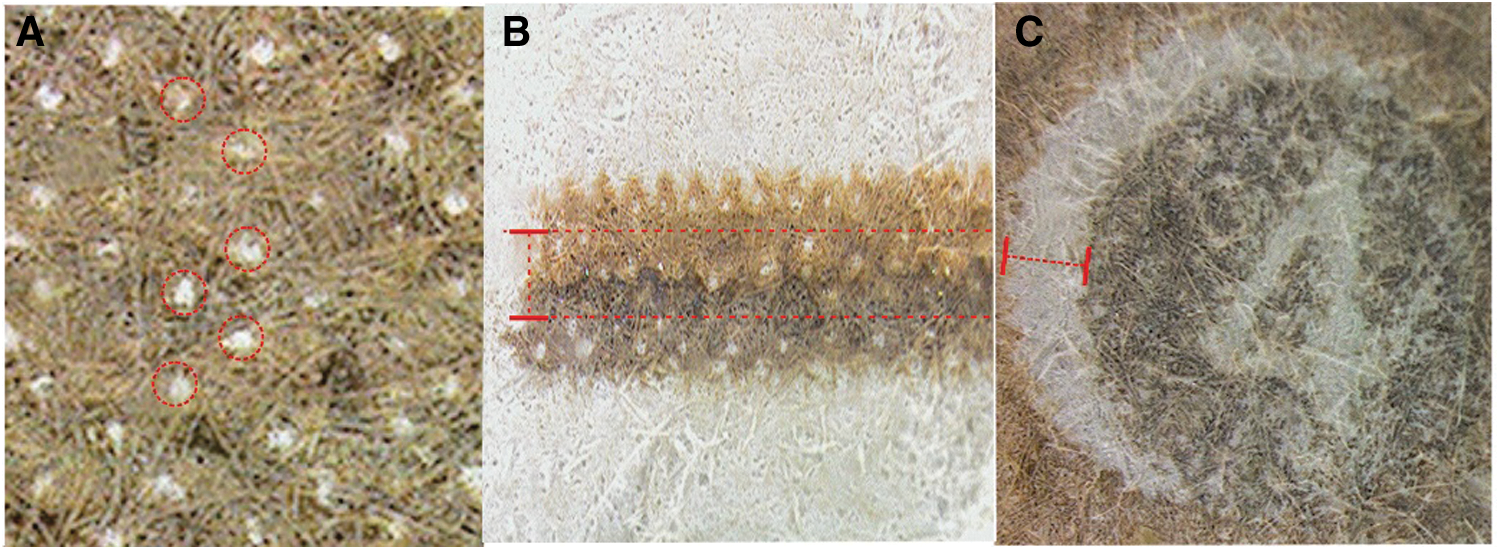
Figure 3: Micro changes of gravure printing
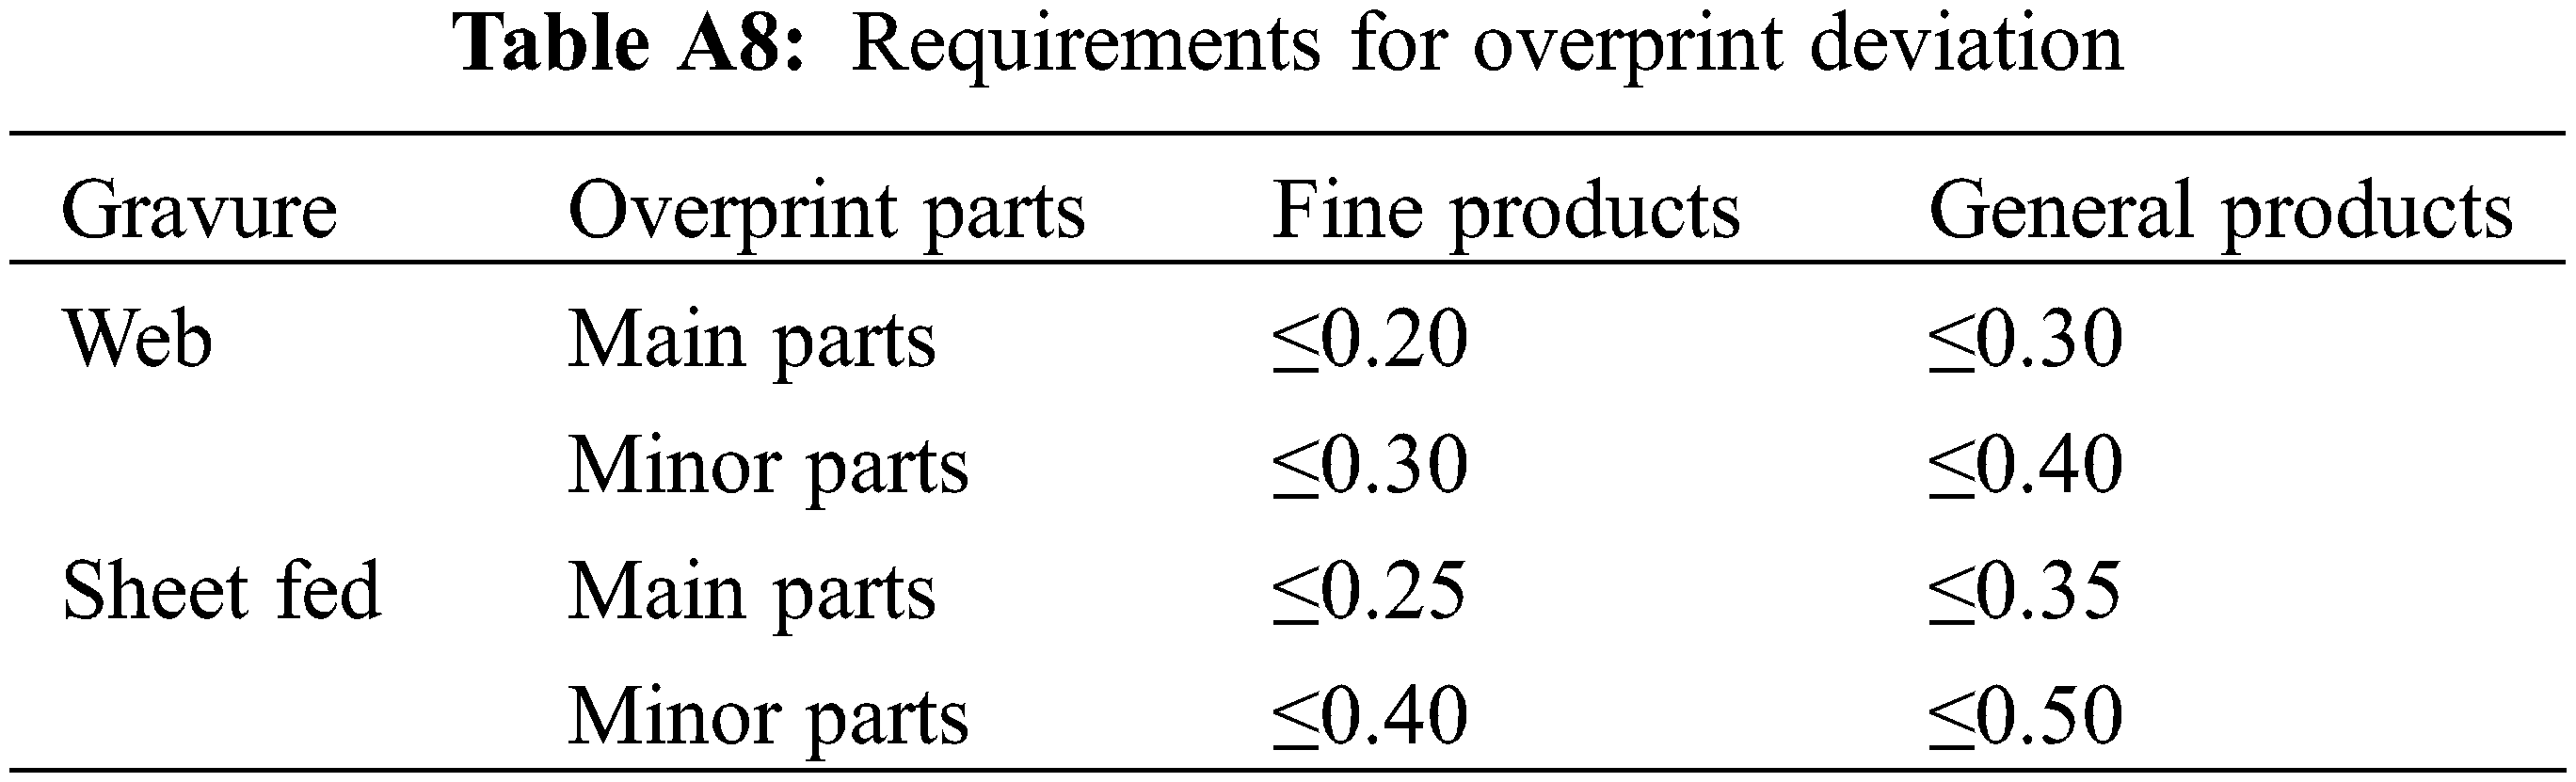
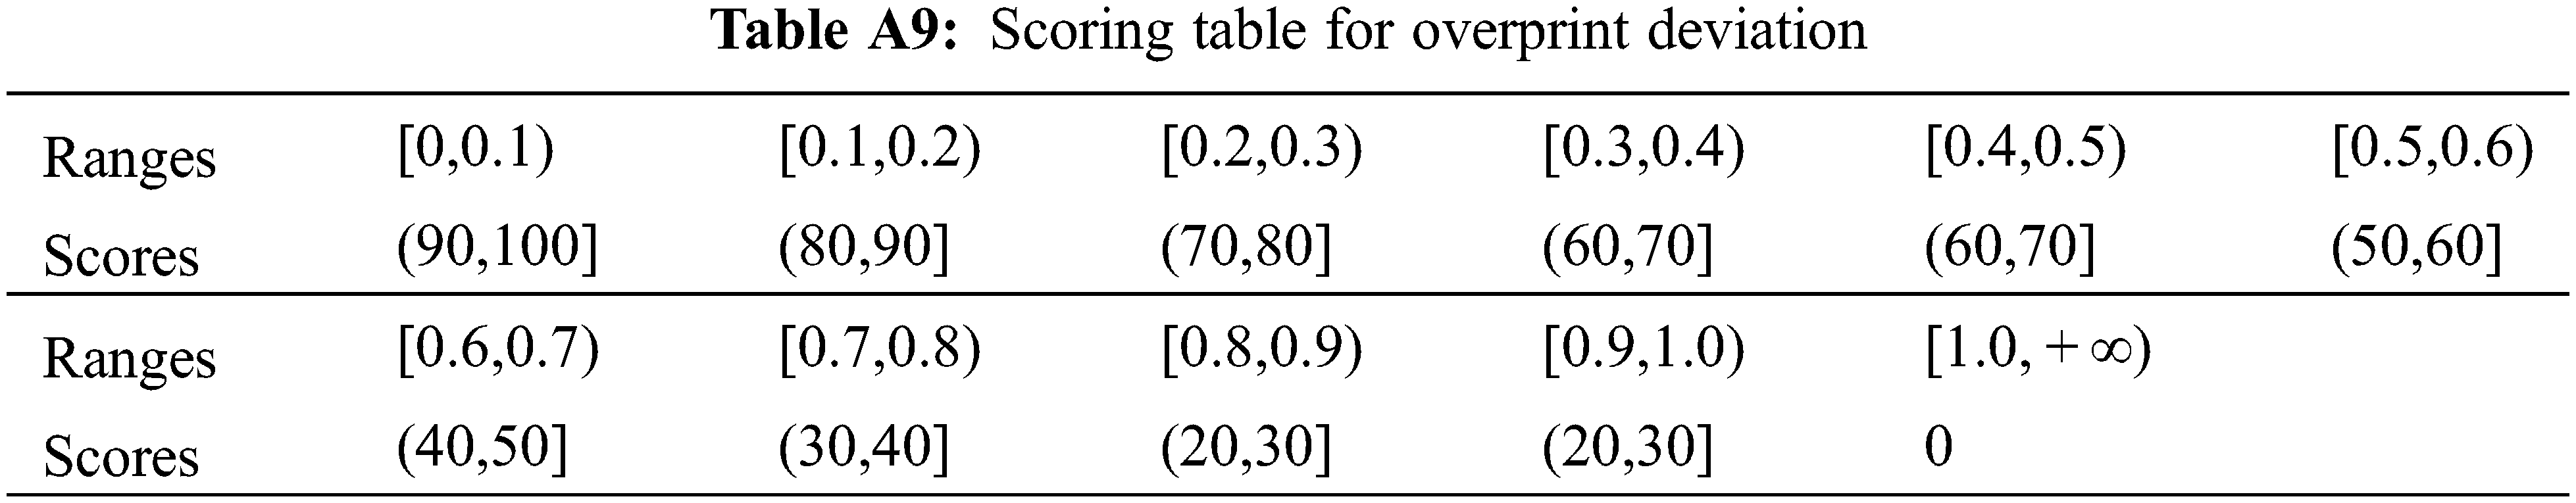
Although the overprinting deviation within the allowable range can not affect the tone and color reproduction of decorative paper, it can affect the clarity of decorative paper, as shown in Figs. 3B and 3C.
3.2.2 Measuring and Scoring of Samples
Decorative paper samples of high, good, average and poor grades were obtained from a gravure workshop. Chromaticity values and density values were measured by using the eXact spectrophotometer, and overprinting deviations were measured with the micro-measurement.
Take one piece of decorative paper of different grades to demonstrate the measuring and scoring. As follows:
The color blocks with different dot area ratio on the control strip of decorative paper were measured by a spectrophotometer. The values of color difference were calculated from Eq. (12). The maximum of each sample was recorded, as expressed in Table 3. The scoring process referred to Tables A1 and A2 in Appendix A.
The density values of the first spot color, the second spot color and the overprint of the two spot colors on the measurement and control strip were measured respectively with a spectrophotometer. Ink trapping values were calculated according to Eq. (13). Then Table 4 was obtained by scoring according to Table A3 in Appendix A.
Measured values of relative contrast and dot gain were obtained directly by measuring density values and dot gain of spot color blocks where dot area ratio is 75% with a spectrophotometer. Overprint deviations were gained by measuring marks on the control strip with the micro-measurement. Then a scoring process referred to Tables A5 and A7 and A9 in Appendix A. The relevant industry standards for these three indices are shown in Tables A4 and A6 and A8 in Appendix A. The results are presented in Table 5.
With the measurement data of standard samples brought into Subsection 3.1 “Model Description”, weights of five indices were obtained, as shown in Table 6.
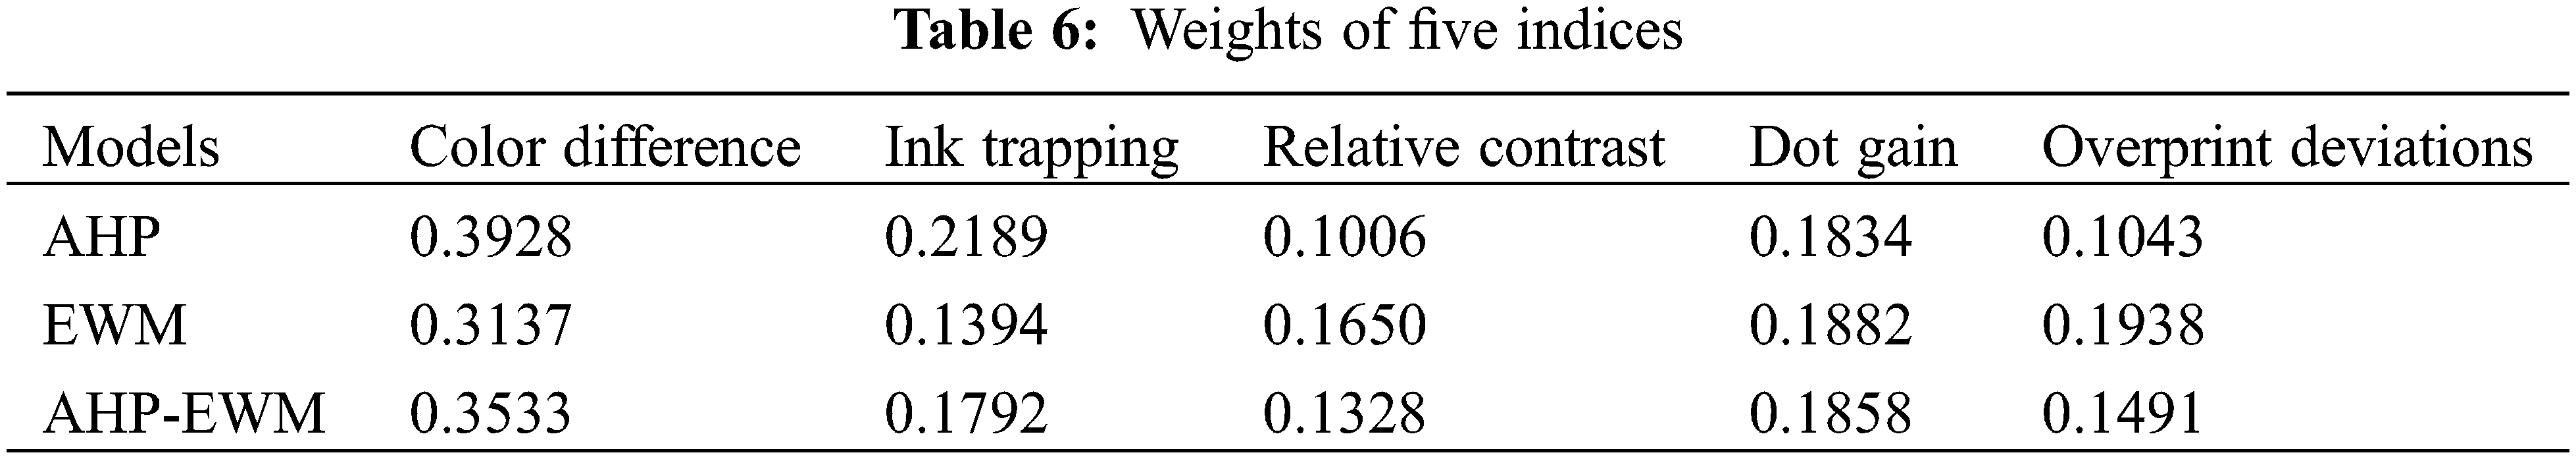
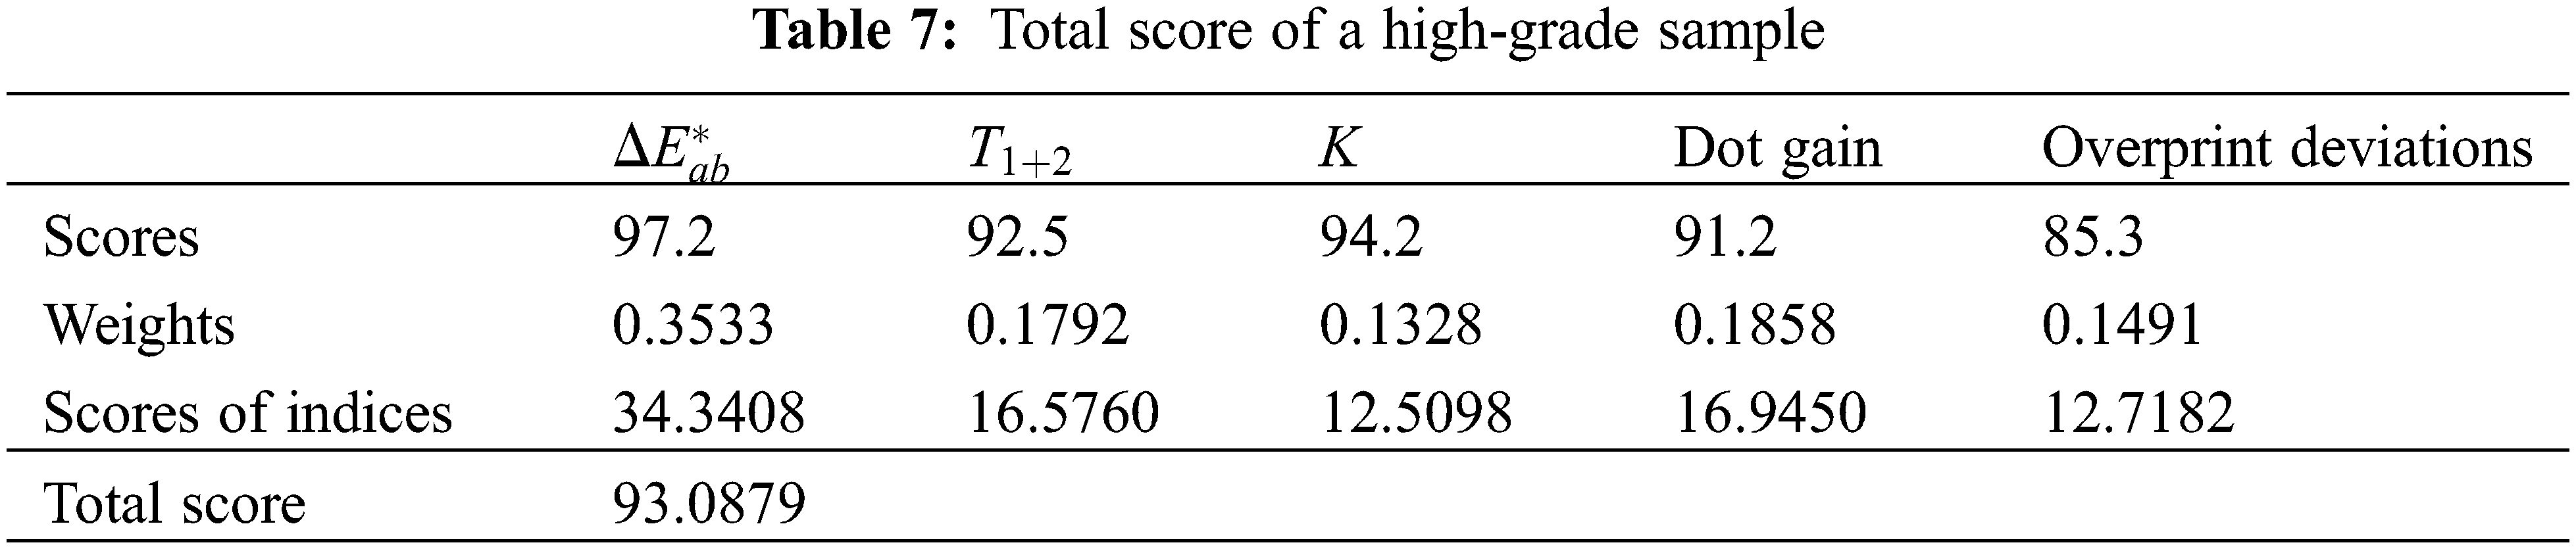
The score of each index is the weight of the index multiplied by the score. Table 7 shows scores of five indices and the total score of a high sample.
We took 30 samples for each grade. Similarly, the evaluation score of each sample was gotten as expressed in Fig. 4.
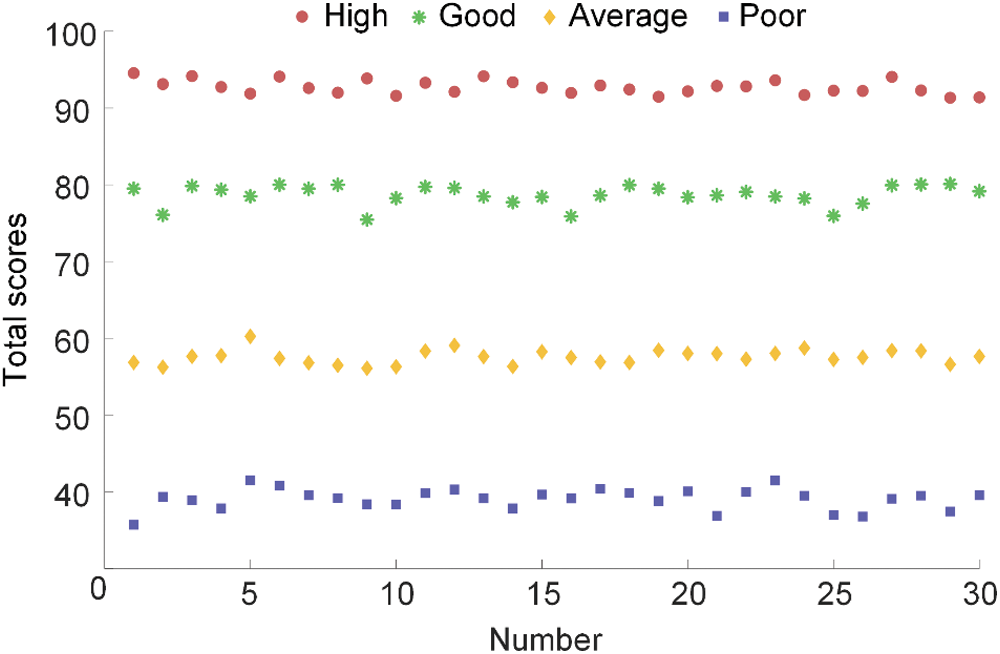
Figure 4: Evaluation scores of four grades
3.2.3 Statistical Analysis of Total Scores
95% confidence interval refers to the 95% probability that real values of overall parameters may fall within the interval of the measurement results. The coefficient of variation can judge the dispersion of data [22]. Therefore, 95% confidence interval and the coefficient of variation were adopted for statistical analysis of total scores.
where μ is mean value; σ is standard deviation; n is sample size.
In order to further verify the accuracy and error of the model, a subjective evaluation score table was established as the reference object of the comprehensive evaluation model. Relevant professionals were invited to rate the printing quality of decorative paper, as shown in Table 8. Spearman’s rank correlation coefficient can reflect the trend and correlation of the two groups of data [23,24]. The correlation between comprehensive evaluation and subjective evaluation is reflected by Spearman’s rank correlation coefficient.
where rsp is Spearman’s rank correlation coefficient; di is the grade difference between the two groups of data; n is sample size.
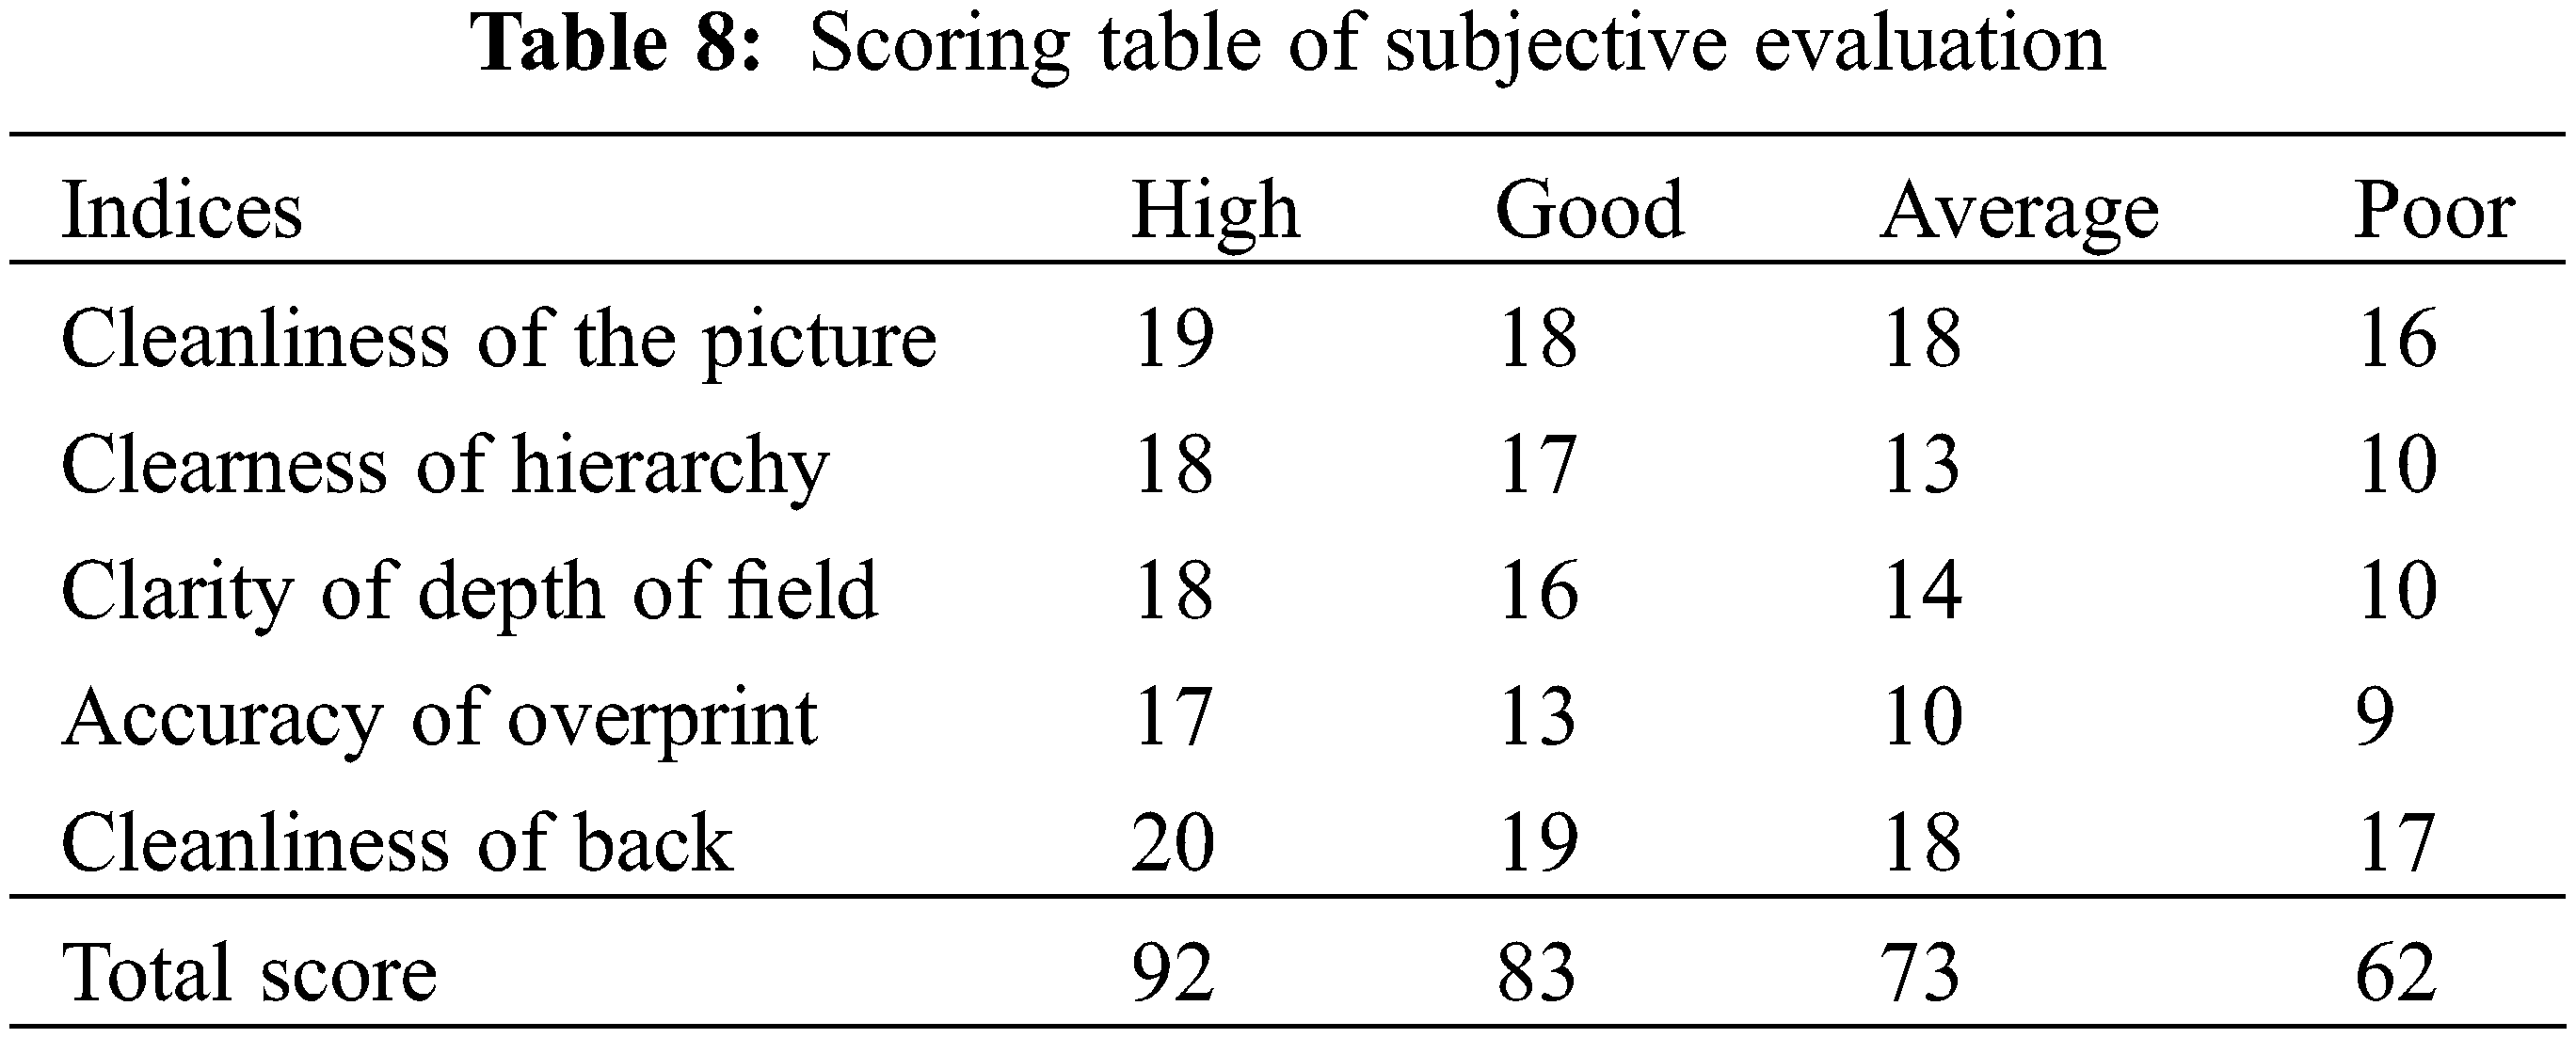
Fig. 5 shows the frequency distribution of total evaluation scores of 120 samples. Reading Fig. 5, the distribution of scores in each grade is relatively concentrated, and scores of samples of different grades are significantly distinct. It indicates that the evaluation model in this paper can accurately distinguish the printing quality of decorative paper samples of different grades.
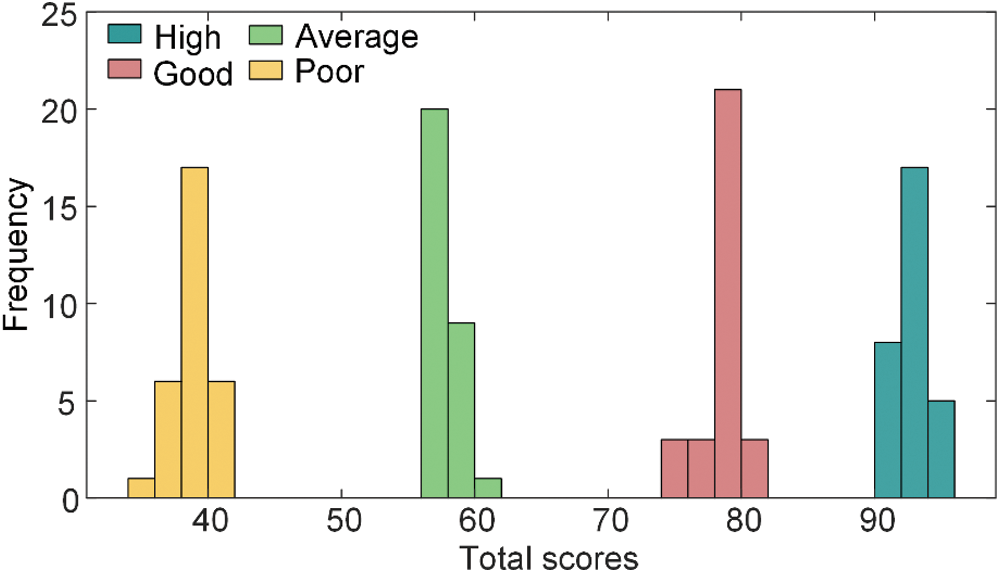
Figure 5: Frequency distribution of total evaluation scores
Eq. (14) was calculated 95% confidence intervals of four grades, which were [92.3636, 93.0672], [78.149, 79.1649], [57.2024, 57.9216], [38.5357, 39.5776] from high to low. The maximum width of 95% confidence intervals is 1.0419, which indicates scores are concentrated. Coefficients of variation were 1%, 1.7%, 1.64% and 3.51%, which were determined by following Eq. (15). According to coefficients of variation, evaluation results of the model are relatively stable. rsp (Eq. (16)) about these two groups scores is 0.9592, and the test probability is 1.3716 × 10−66, which is far less than 0.05. It shows that there is a significant grade correlation between comprehensive evaluation and subjective evaluation. Subjective evaluation can be used as a reference for comprehensive evaluation. The samples with the same score of subjective evaluation as a group was taken, and the average score and deviation of the group’s comprehensive evaluation was calculated. The error of the evaluation model is expressed by deviation. The average error of the results obtained by the evaluation system is 0.2061. It indicates that the evaluation model has good accuracy.
Considering Fig. 6, comparing the scores of different grades under the same index can reflect the printing quality of decorative paper. The scores of high-grade decorative paper are higher than other grades, indicating that its color reproduction and tone are excellent. The performance of good-grade and average-grade decorative paper is general, and good-grade scores in dot gain are significantly higher than average grade scores according to Fig. 6D. This shows that good-grade decorative paper performs obviously better than average grade in dark areas. Good-grade decorative paper performs poorly in terms of ink trapping and average performance in terms of overprinting deviation and relative contrast. The reason for this phenomenon may be that the printing speed is fast. Faster printing speed will not only reduce ink transfer, resulting in the reduction of ink trapping, but also affect the stability of paper transportation and thus increase overprint deviation [25]. The performance of average-grade decorative paper is general, among which dot gain is serious. This may be related to high ink viscosity and too fast printing speed. The ink viscosity is so high that the paper will stick to the surface of the roller, resulting in excessive instantaneous tension during the transportation of the paper on the color deck, which will lead to inaccurate overprint. The poor grade has the lowest scores. In particular, according to Fig. 6B, it shows that the color of the overprint part is terrible. Reading Figs. 6C and 6E, the scores of relative contrast and overprint deviation of poor-grade decorative paper are very low, which illustrates that the clarity of poor-grade decorative paper in the dark area is bad. The overprinting deviation is too large, which will produce printing failures such as ghosting. This is also one of the reasons for its color deviation. By analyzing the printing situation of poor-grade decorative paper, this paper believes that the poor printing quality may be caused by excessive ink viscosity and printing pressure. The higher the ink viscosity is, the greater the cohesion of the ink layer is. If the viscosity of the first printing ink is lower than that of the second printing ink, the second printing ink will peel off the first printing ink with its own cohesion, resulting in “reverse overprint” phenomenon and ink trapping reducing. Excessive printing pressure can not only deform dots, but also increase the amount of ink penetrating into the fiber gap of the paper, which may make the ink layer on the surface of the paper thinner, and finally lead to the decrease of overprint rate [26–28].
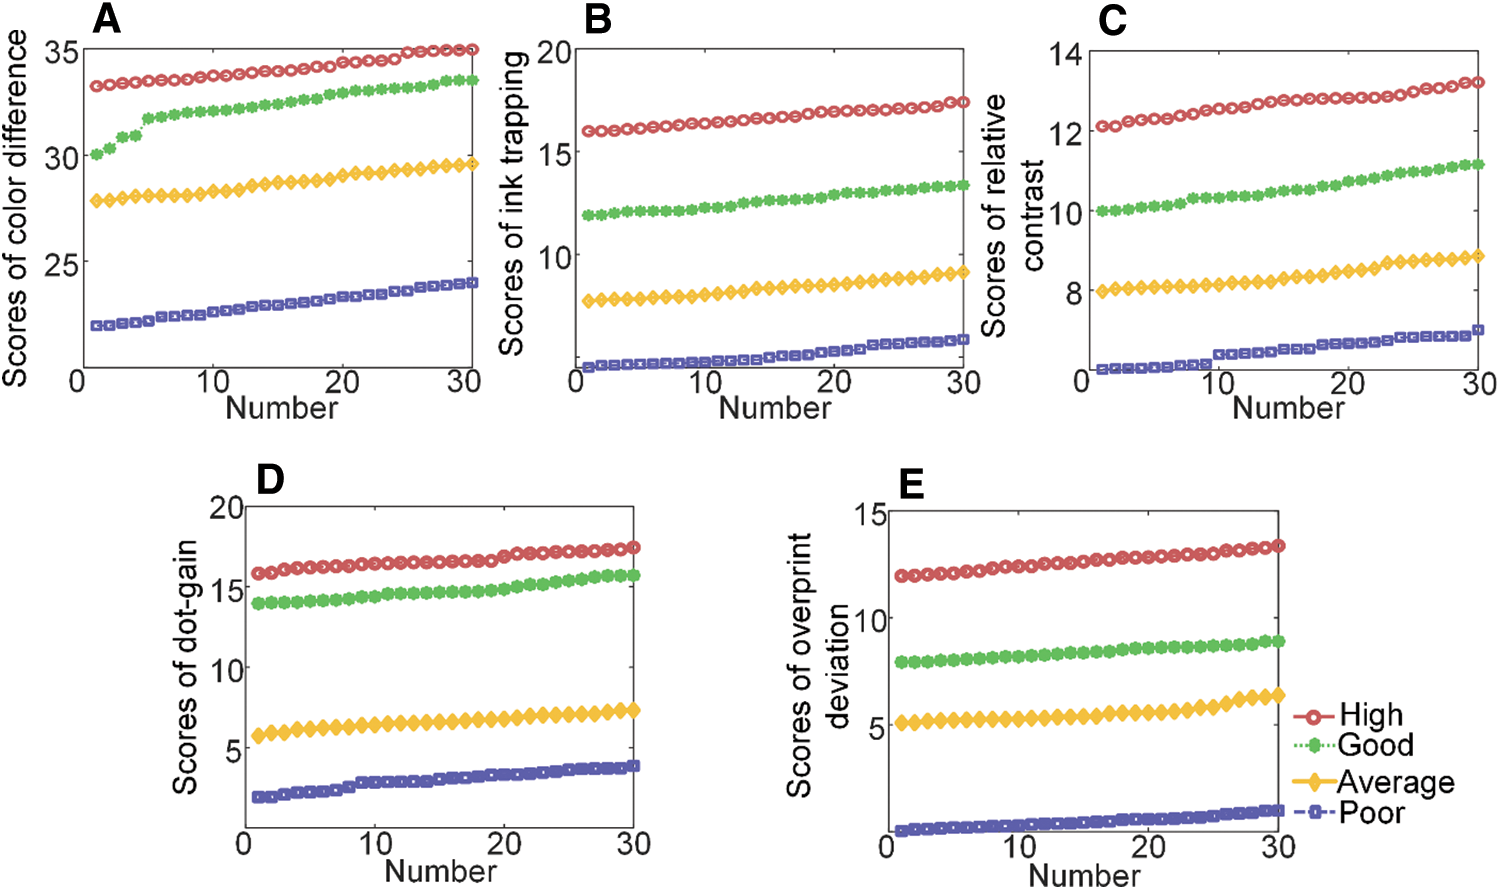
Figure 6: Scores of samples under the same index
To summarize the above, the AHP-EWM printing quality evaluation model in this paper can accurately and stably distinguish decorative paper of different grades. In addition, the analysis of scores of each index can also find out the factors affecting printing quality.
This paper proposes a method for evaluating the color quality of decorative paper by gravure. The measured values of chromaticity and density values of decorative paper were obtained by a spectrophotometer and the micro-measurement, and then samples were scored according to scoring tables. The AHP-EWM model was used to assign weights to evaluation indices. Eventually the comprehensive score of each sample was gained. We made a statistical analysis of the comprehensive scores of the samples. The statistical results demonstrate that the model has high accuracy. In addition, through the analysis of the scores of each index, we could be aware of reasons affecting printing quality of decorative paper’s colors. The results show that high-grade decorative paper performs well in colors and tones reproduction, while good-grade decorative paper is inferior to high grade. The tones of the dark areas of average-grade decorative paper are weak. The dots of poor-grade decorative paper expand seriously, whose color deviation is large, and the picture is maladjusted. The present study can provide reference to the improvement of printing quality of decorative paper and the establishment of printing quality evaluation system. Further research is needed to improve the accuracy of the model.
Funding Statement: The authors would like to thank their colleagues from the Printing Technology Research Group for helpful discussions and comments on this paper. This work was supported in part by the National Natural Science Foundation of China under Grant 62076199, the Opening Foundation of State Key Laboratory of Power System of Tractor under Grant SKT2022004, Humanities and Social Sciences Research Planning Project of the Ministry of Education under Grant 17YJC760007, and in part by Doctoral Scientific Research Foundation of Xi’an University of Technology under Grant 108–451121001 and Shaanxi Collaborative Innovation Center of Green Intelligent Printing and Packaging.
Conflicts of Interest: The authors declare that they have no conflicts of interest to report regarding the present study.
1. Elesini, U., Pancur, S., Mozina, K. (2021). Qualitative and quantitative evaluation of text printed with flexography on woven labels. Textile Research Journal, 91(13–14), 1670–1681. DOI 10.1177/0040517520981740. [Google Scholar] [CrossRef]
2. Petrovic, S., Kasikovic, N., Novakovic, D., Bosnjakovic, G., Kandirmaz, E. A. et al. (2021). Influence of the compressible flexographic sleeve exploitation on print quality. Thenicki Vjesnik-Technical Gazette, 28(2), 391–400. DOI 10.17559/TV-20191114164921. [Google Scholar] [CrossRef]
3. Xu, L. (2020). Data evaluation method for ceramic 3D printing samples based on fuzzy algorithm. Journal of Intelligenthe & Fuzzy Systems, 38(6), 7767–7778. DOI 10.3233/JIFS-179846. [Google Scholar] [CrossRef]
4. Yi, D., Wu, Z., Zhang, C., Xiao, R., Xue, W. (2021). A study on the applicability of pigment digital printing on cotton fabrics. Textile Research Journal, 91(19–20), 2283–2293. DOI 10.1177/0040517521997926. [Google Scholar] [CrossRef]
5. Yuan, J., Zhu, M., Xu, B., Chen, G. (2018). Review on processes and color quality evaluation of color 3D printing. Rapid Prototyping Journal, 24(2), 409–415. DOI 10.1108/RPJ-11-2016-0182. [Google Scholar] [CrossRef]
6. Yuan, J., Chen, G., Li, H., Prautzsch, H., Xiao, K. (2021). Accurate and computational: A review of color reproduction in full-color 3D printing. Material & Design, 209, 109943. DOI 10.1016/j.matdes.2021.109943. [Google Scholar] [CrossRef]
7. Knez, N., Kariz, M., Knez, F., Ayrilmis, N., Kuzman, M. K. (2021). Effects of selected printing parameters on the fire properties of 3D-printed neat polylactic acid (PLA) and wood/PLA composites. Journal of Renewable Materials, 9(11), 1883–1895. DOI 10.32604/jrm.2021.016128. [Google Scholar] [CrossRef]
8. Schambach, M., Zhang, Q., Lemmer, U., Heizmann, M. (2021). Automated quality assessment of inkjet-printed microlens arrays. tm-Technisches Messen, 88(6), 342–351. DOI 10.1515/teme-2021-0019. [Google Scholar] [CrossRef]
9. Lee, C., Hu, S., Liu, T., Tiu, C. (2012). Three-dimensional observation on the liquid emptying process from a scaled-up gravure cell. International Polymer Processing, 27(1), 128–137. DOI 10.3139/217.2483. [Google Scholar] [CrossRef]
10. Xiuyan, Y., Satish, K. (2006). Flow visualization of the liquid-emptying process in scaled-up gravure grooves and cells. Chemical Engineering Science, 61(4), 1146–1156. DOI 10.1016/j.ces.2005.07.039. [Google Scholar] [CrossRef]
11. Potts, S., Phillips, C., Jewell, E., Clifford, B., Lau, Y. et al. (2020). High-speed imaging the effect of snap-off distance and squeegee speed on the ink transfer mechanism of screen-printed carbon pastes. Journal of Coatings Technology and Research, 17(2), 447–459. DOI 10.1007/s11998-019-00291-6. [Google Scholar] [CrossRef]
12. Chang, Q., Cao, C., Qiao, H., Hu, Y., Xiao, G. et al. (2021). Ink transfer for printed flexible microsupercapacitors. Carbon, 178, 285–293. DOI 10.1016/j.carbon.2021.02.072. [Google Scholar] [CrossRef]
13. Lee, H., You, H., He, M., Chen, J. C. (2021). Back-trap mottle: A review of mechanisms and possible solutions. Bioresources, 16(3), 6426–6447. DOI 10.15376/biores.16.3.Lee. [Google Scholar] [CrossRef]
14. Jimenez-Francisco, M., Flores-Johnson, E., Carrillo, J. (2020). Effect of recycled polystyrene/Limonene coating on the mechanical properties of kraft paper: A comparative study with commercial coatings. Journal of Polymers and the Environment, 28(6), 1724–1736. DOI 10.1007/s10924-020-01721-y. [Google Scholar] [CrossRef]
15. Fu, J., Wang, G., Guo, M., Zhou, J., Wang, L. (2014). Prospect of impregnated decorative paper and surface decorated wood-based panels industry in China. World Forestry Research, 27(3), 62–66. DOI 10.13348/j.cnki.sjlyyj.2014.03.010. [Google Scholar] [CrossRef]
16. Li, Y., Gu, W., He, B. (2014). Research on the influence of drying method on Ink penetration of coated paper. Advanced Materials Research, 884–885, 312–315. DOI 10.4028/www.scientific.net/AMR.884-885.312. [Google Scholar] [CrossRef]
17. Thomas, L. S., (2005). Theory and applications of the analytic network process. Pittsburgh: RWS Publications. [Google Scholar]
18. Wang, J., Zhang, T., Guan, X. (2011). Study on fuzzy comprehensive evaluation model of printing quality based on AHP method. Advanced Materials Research, 174, 243–246. DOI 10.4028/www.scientific.net/AMR.174.243. [Google Scholar] [CrossRef]
19. Sharma, G., Rodriguez-Pardo, C. E. (2012). The dark side of CIELAB. Color Imaging Xvii: Displaying, Processing. Hardcopy, and Applications, 8292, 909960. DOI 10.1117/12.909960. [Google Scholar] [CrossRef]
20. Jiao, L., Zhang, M., Li, H. (2020). Preparation of 1, 3, 6, 8-pyrenesulfonic acid tetrasodium salt dye-doped silica nanoparticles and their application in water-based anti-counterfeit ink. Materials, 13(18), 4047. DOI 10.3390/ma13184074. [Google Scholar] [CrossRef]
21. Li, X., Liu, J., Li, X., Liu, Y., Xu, A. (2015). Research on secondary colour optical dot gain model in electrostatic digital colour printings. Tehnicki Vjesnik-Technical Gazette, 22(4), 845–851. DOI 10.17559/TV-20130830041144. [Google Scholar] [CrossRef]
22. Forkman, J. (2009). Estimator and tests for common coefficients of variation in normal distributions. Communications in Statistics-Theory and Methods, 38(2), 233–251. DOI 10.1080/03610920802187448. [Google Scholar] [CrossRef]
23. Cavallo, B. (2020). Functional relations and spearman correlation between consistency indices. Journal of the Operational Research Society, 71(2), 301–311. DOI 10.1080/01605682.2018.1516178. [Google Scholar] [CrossRef]
24. Song, H., Park, S. (2020). An analysis of correlation between personality and visiting place using spearman’s rank correlation coefficient. KSII Transactions on Internet and Information Systems, 14(5), 1951–1966. DOI 10.3837/tiis.2020.05.005. [Google Scholar] [CrossRef]
25. Nazir, A., Jeng, J. (2019). A high-speed additive manufacturing approach for achieving high printing speed and accuracy. Proceedings of the Institution of Mechanical Engineers Part C: Journal of Mechanical Engineering Science, 234(14), 2741–2749. DOI 10.1177/0954406219861664. [Google Scholar] [CrossRef]
26. Faisal, S., Ali, M., Siddique, S., Lin, L. (2021). Inkjet printing of silk: Factors influencing ink penetration and ink spreading. Pigment & Resin Technology, 50(4), 285–292. DOI 10.1108/PRT-12-2019-0120. [Google Scholar] [CrossRef]
27. Potts, S., Phillips, C., Claypole, T., Jewell, E. (2020). The effect of carbon ink rheology on ink separation mechanisms in screen-printing. Coatings, 10(10), 1008. DOI 10.3390/coatings10101008. [Google Scholar] [CrossRef]
28. Fernandez-Pradas, J., Serra, P. (2020). Laser-induced forward transfer: A method for printing functional inks. Crystals, 10(8), 651. DOI 10.3390/cryst10080651. [Google Scholar] [CrossRef]
Appendix A. Scoring tables of five indices
Establishing of scoring tables referred to The Paper Based Intaglio Prints for Decorating [1].
References
1. Zheng, S., Chen, Q., Lu, W., Ren, R., Kong, F. et al. (2008). The paper based intaglio prints for decorating. Beijing, China: China Light Industry Press.
 | This work is licensed under a Creative Commons Attribution 4.0 International License, which permits unrestricted use, distribution, and reproduction in any medium, provided the original work is properly cited. |