| Journal of Renewable Materials |
DOI: 10.32604/jrm.2022.021102
ARTICLE
Preparation of Kenaf Biochar and Its Adsorption Properties for Methylene Blue
1College of Textiles, Qingdao University, Qingdao, 266000, China
2State Key Laboratory of Bio-Fibers and Eco-Textiles, Qingdao University, Qingdao, 266071, China
3State Key Laboratory of New Textile Materials and Advanced Processing Technologies, Wuhan Textile University, Wuhan, 430000, China
4Key Laboratory of Textile Fiber and Products (Wuhan Textile University), Ministry of Education, Wuhan, 430200, China
*Corresponding Author: Wei Jiang. Email: weijiangqd@qdu.edu.cn
#These authors contributed equally to this work
Received: 28 December 2021; Accepted: 18 February 2022
Abstract: The toxic dyestuffs from printing and dyeing wastewater have caused serious damages to the ecological environment, thus exploring effective methods to remove them having become a key topic. Here, a series of biochar samples were synthesized form kenaf to adsorb methylene blue (MB), which was acted as the dye representative for the test of adsorption capacity due to the presence of abundant double bond and aromatic heterocyclic ring. By tuning the raw materials and pyrolysis temperature, a super adsorption capacity about 164.21 mg·g–1 was obtained over the biochar that pyrolyzed at 700°C with the kenaf fiber as raw material. Through the physical adsorption, elemental analysis, FTIR spectra and NH3-TPD, it was found the high surface area and pore volume of biochar played a key role in the adsorption of MB, and the acidic sites would also assist the adsorption process. Besides, the adsorption kinetic model was fitted and calculated, implying the MB physically adsorbed on the biochar rapidly and then occurred chemical adsorption on the acidic sites. In addition, through KBC700 recycling experiments, it was found that kenaf biochar had a good binding force to MB, which effectively avoided secondary pollution. This work provides important insights for the adsorption mechanism of MB by biochar, also offers some guidance for the further synthesis of biochar from various biomass.
Keywords: Kenaf biochar; pyrolysis temperature; adsorption; methylene blue; kinetic analysis
Though the technological development brings people a better life, it also incurs severe environmental pollution. Especially for the textile printing and dyeing industry, a large quantity of toxic dyestuffs and organic compounds in the waste effluent have caused huge irreversible damage of water contamination [1–3]. Therefore, the remove of harmful substances in dyeing wastewater has aroused widely attention and becomes a key point for the environmentally friendly production. Among the dyeing materials, methylene blue (C16H18N3ClS, MB) is widely used in the printing and dyeing industry due to its various color. However, the MB owns azo double bond and aromatic heterocyclic ring, which causes serious damages to the ecological environment. Also, because of the rich functional groups, it is often acted as the dye representative to measure the adsorption capacity of biochar in previous papers [4–6].
Biochar which could be produced by the thermochemical decomposition of biomass feedstock under anoxic environment has a great adsorption capacity owing to its porous structure [7–9]. Ozer et al. [10] used peanut shell biochar to adsorb MB and found that the adsorption was a spontaneous endothermic process with a maximum adsorption capacity of 20.08 mg·g–1. The adsorption mechanism mainly involved pore filling adsorption, surface adsorption, distribution adsorption, π-π conjugated structure adsorption and hydrogen bonding [11]. Notably, the properties of biochar are highly affected by the feedstock pretreatment and biochar post-treatment conditions [12–15]. Based on the raw material and the usage of biochar, the pretreatments including physical (drying, crushing, sieving, washing, etc.), chemical (treated with chemicals or functional materials, loaded with precursors and functional reagents, etc.) and biological (bacterial treatment, etc.) methods are varied. While the post-treatment mainly includes physical (ball milling, magnetization, etc.) and chemical (corrosion treatment, etc.) methods [16–19]. Xiang et al. [20–22] revealed that the maximum adsorption capacity of biochar for fluvoxamine was positively correlated with specific surface area, which indicated that the adsorption capacity had a great relationship with specific surface area. Even numerous researches have been conducted to employ the biochar for wastewater treatment, only a few articles highlight the relations between the treatment conditions and the resulted biochar properties. Also, their further impact on the adsorption performance is still unclear.
On the other hand, kenaf has a strong adaptability to the environment and thus be widely planted in the world owning to the waterlogging and cold resistance [23–25]. As one of the important source of biomass resources, its application ranges from paper making, kenaf spinning, building materials, feed and other fields [26,27]. In addition, kenaf could form biochar with a super surface area of 200~300 cm3·g–1 after high temperature carbonization. Whereas, kenaf production is abundant, and the supply exceeds the demand so far. Hence, making good use of the surplus resources has become an urgent problem [28–30].
Using kenaf to prepare biochar to adsorb MB is not only conducive to the full utilization of kenaf, but also provides a new idea for the treatment of printing and dyeing wastewater. Here by tuning the pretreatment and post-treatment conditions, a series of biochar with different properties were synthesized, which were further tested in the MB adsorption experiments. With various characterizations, the chemical and physical structures of biochar were explored. Meanwhile, the effect of biochar properties on MB adsorption performance and the adsorption mechanism were investigated.
Kenaf fibers, bark and stem used in this work were purchased from Lu’an, China. Prior to the usage, they were washed with distilled water for 3 times to clean the surface dirt, then dried in oven at 103°C for 24 h. The dye used in this study was purchased from Adamas (Shanghai, China), 1 g·L–1 MB solution was prepared and put on standby as the stock solution.
The kenaf bark, stem and fibers were pyrolyzed at 700°C with a heating rate of 6 °C·min–1 for 120 min under nitrogen protection in the tube furnace. Meanwhile, the kenaf fibers were also pyrolyzed at 400°C, 500°C, 600°C and 800°C with the same heating rate to study the effect of pyrolysis temperature. The above prepared biochar samples were then named as KBCT, where T represented as the pyrolysis temperature.
The biochar yield (Y, %) can be calculated by this formula:
M0 is the dry weight of kenaf that put into the tube furnace, g; M1 is the dry weight of the biochar, g.
The content of C, H and N elements was measured by elemental analyzer (EA). The specific surface area and pore size distribution were measured by the automatic specific surface and porosity analyzer BET (Micromeritics, ASAP2460). Prior to the experiments, the samples were degassed at 300°C for 6 h. Fourier transform infrared (FTIR) was used to analyze the functional group components of biochar. NH3 temperature programmed desorption (NH3-TPD) was measured by chemical desorption apparatus TPD/TPR (Host: Bel Cata II, Mass spectrometry: Bel Mass).
2.3 Biochar’ MB Adsorption Process
The stock solution (1 g·L–1 MB) was diluted 100, 125, 200, 250, 500, 1000 times, respectively. The absorbance was measured at a wavelength of 665 nm, which then obtained a standard curve. 50 mg of biochar was placed in an erlenmeyer flask with 100 mL of the diluted MB solution (5 mg·L–1). After 0, 15, 30, 45, 60, 120, 240, 480 min under stirring at 200 rpm, the absorption amount of MB was calculated by measuring the change in the absorbance of solution with the standard curve as reference.
where R means the removal rate, Qt represents the adsorption amount at one point, mg·g–1, C0 and Ce respectively represent the initial and equilibrium concentration of the solution, Ct represents the concentration of the solution at different times, g·L–1. V represents the solution volume, mL, and m represents the mass of the added biochar, g.
In order to determine the best dynamic model, the pseudo-first-order kinetic equation and pseudo-second-order kinetic equation were used to fit the data obtained in the experiment. The following equations were used.
Pseudo-first-order kinetic equation,
Pseudo-second-order kinetic equation,
where qt is the adsorption capacity of unit biochar adsorbent at time t, mg·g–1, qe is the adsorption capacity of unit biochar on MB at adsorption equilibrium, mg·g–1, t is the adsorption time, min; K1 (min–1) and K2 (g·mg–1·min–1) are the rate constants of the pseudo-first-order model and the pseudo-first-order model, respectively.
50 mg biochar was weighed and added to 100 mg·L–1 MB solution. The adsorption process was carried out under stirring for 15, 30, 45, 60, 120, 240, 480 and 960 min. Subsequently, a certain amount of the solution was acquired through a needle and filtered by a filter head. The absorbance was measured and then the removal rate was calculated.
The spare simulated wastewater was diluted to 50, 100, 150, and 200 mg·L–1 respectively and placed in four conical flasks. The adsorption process was carried out under stirring as before. Then 50 mg of KBC700 was weighed and placed in the above wastewater. After 24 h until the adsorption reached equilibrium, the absorbance was measured. The maximum adsorption capacity of biochar at different concentrations was calculated by using the formula before.
For the adsorption reproducibility of biochar, the following experiments were performed. The best biochar adsorbent was filtered after the adsorption end, eluted with acetic acid and ethanol (volume ratio of 1:9), oscillated for 2 h, then sonicated for 10 min, dried and then used for the adsorption experiment of MB (5 mg·L–1). Eluted three times in total.
From the Fig. 1, it could be intuitively found that the adsorption capacity of biochar that prepared by kenaf fiber as raw material was much higher than that prepared by kenaf stem and bark under the same pyrolysis condition. Hence, here the kenaf fiber was employed as raw material for the subsequent experiments.
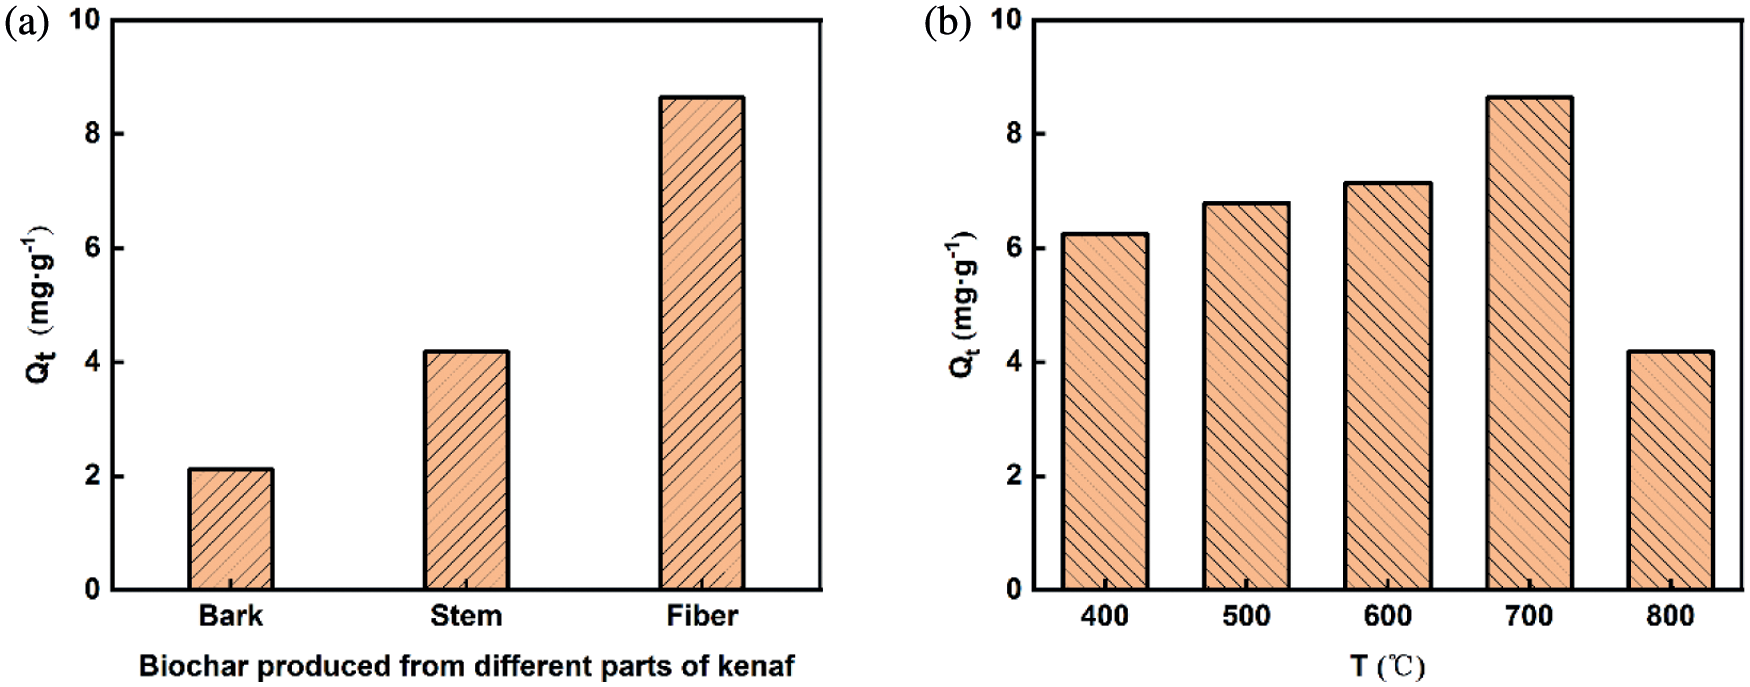
Figure 1: Effect of raw materials on adsorption at 700°C (a) and the relationship between adsorption capacity and pyrolysis temperature (b)
Next, different pyrolysis temperatures were employed for the synthesis of biochar from kenaf fiber. Their adsorption capacities were displayed in Fig. 1b. Obviously, the adsorption capacity of KBC700 was the highest (8.64 mg·g–1), followed by KBC600 (7.14 mg·g–1). KBC800 had the lowest capacity of about 4.18 mg·g–1. Since the adsorption performance related to the physicochemical properties of biochar [31,32], these phenomena indicated that the pyrolysis temperature had a significant role in the structural properties of biochar.
Furthermore, according to the adsorption experiment above, the best removal rate can reach 100% for the concentration of 10 mg·L–1 MB solution, which indicated that there was still the potential of adsorption for MB over these biochar samples. So, the initial concentration of MB solution was altered to explore the maximal adsorption capacity and the corresponding adsorption rate of KBC700. Fig. 2 showes the influence of initial concentration on the maximum adsorption capacity of biochar at adsorption equilibrium. It could be seen that the adsorption capacity of biochar significantly increased with the increasing of initial MB concentration, and the adsorption capacity approached a super value of 164.21 mg·g–1 at the initial MB concentration of 150 mg·L–1. This adsorption capacity was extremely excellent compared to other biochar like pepper stem, whose adsorption capacity was only 101.27 mg·g–1 [33]. Meanwhile, the removal rate decreased gradually from 100% at low concentration. When C0 was 50 mg·L−1, the removal rate reached 74%, but it respectively became 57%, 53% and 41% as the initial concentration increased to 100 mg·L−1, 150 mg·L−1 and 200 mg·L−1. This result made sense since the adsorption rate would slow down as it reached to adsorption equilibrium.
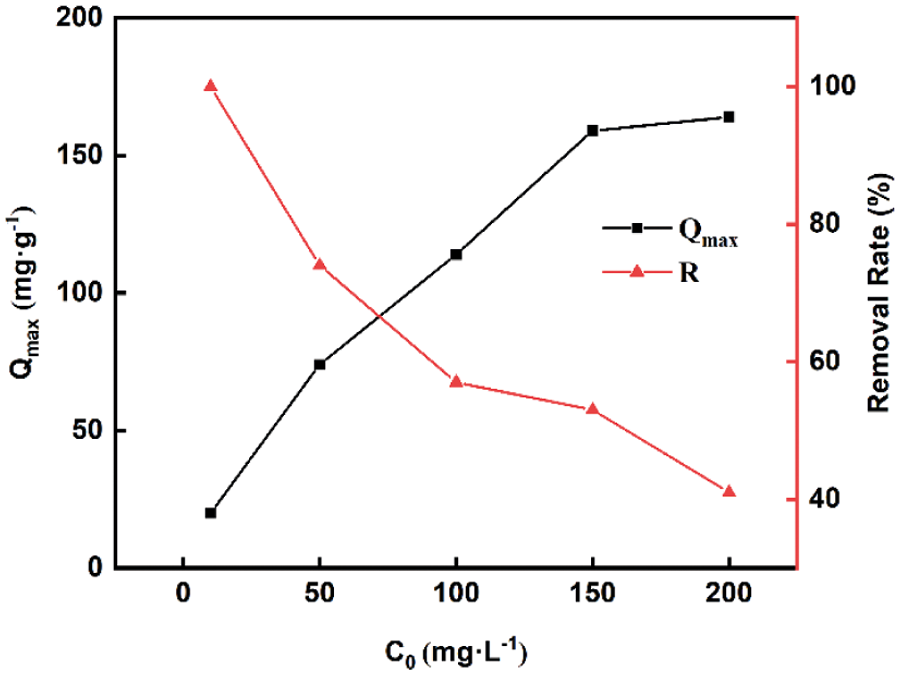
Figure 2: Influence of initial concentration on the maximum adsorption capacity at equilibrium
Note: R represents to removal rate.
3.2 Characterization of Biochar Properties
Since the surface area and pore size had a direct influence of adsorption performance, the samples were employed to test the structural differences. It can be seen from the Table 1 that the specific surface area and pore volume of biochar obtained from kenaf fiber were much higher than that of biochar obtained from kenaf bark and stem under the same pyrolysis conditions. This might be because the specific surface areas of kenaf bark and kenaf stem raw materials were much smaller than that of kenaf fiber, and the pyrolysis of kenaf bark and kenaf stem without degumming might contain components that affect the properties of biochar. Otherwise, the fibers were looser, so pyrolysis was more full and complete. It should be the reason of higher adsorption capacity of kenaf fiber biochar.

Pyrolysis temperature was an important thermodynamic parameter that affected the physicochemical properties of biochar [34]. Table 2 showes the specific surface area and pore volume data of biochar that prepared with different pyrolysis temperature, which showed an increasing trend with the pyrolysis temperature firstly. The specific surface area and pore volume of KBC400 were 3.5 m2·g–1 and 0.005 cm3·g–1, respectively. For KBC500, the specific surface area and pore volume became 377.9 m2·g–1 and 0.167 cm3·g–1, and for KBC600, they reached 479.5 m2·g–1 and 0.246 cm3·g–1. While the KBC700 had an almost same surface area and pore volume with KBC600, and the pore diameter was concentrated at about 3.7 nm (Fig. 3). Surprisingly, when further increasing the temperature, the specific surface area of KBC800 began to plunge, dropping to 1.5 m2·g–1.

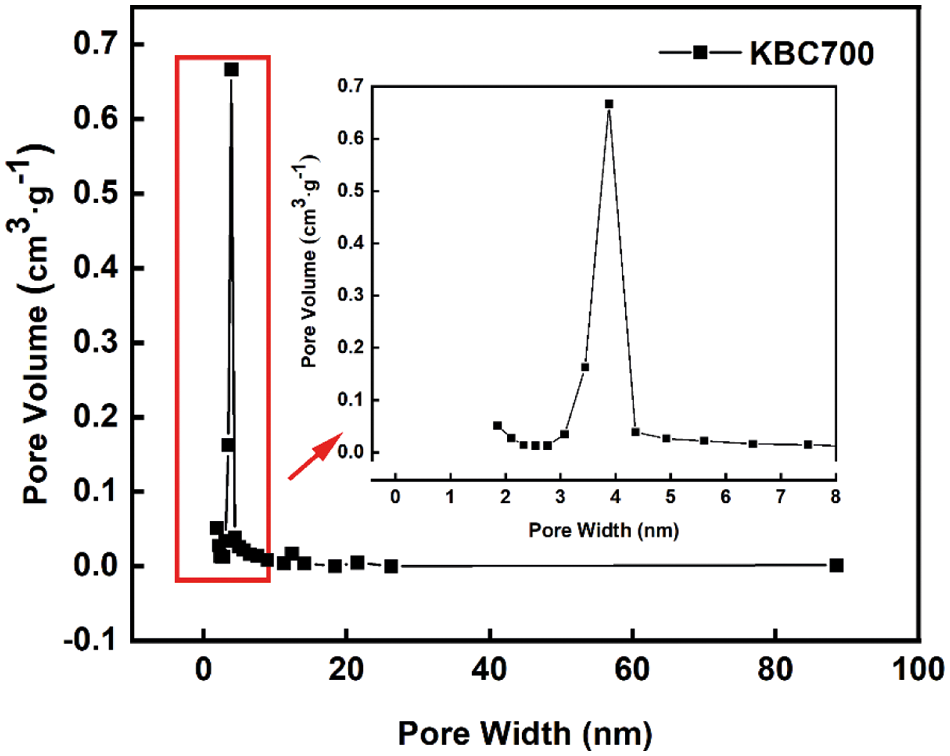
Figure 3: Pore size distribution of KBC700
Additionally, the SEM images of KBC700 and KBC800 were collected in Fig. 4. The biochar still maintained the original fibrous shape with large apertures. While, observing the surface carefully, it was found that it presented a very rough state, which should be caused by the micro- and mesoporous channel. Notably, the main ingredients of kenaf included cellulose, hemicellulose, lignin, water and inorganic components. Specifically, the content of cellulose was 80.13 ± 0.62, and hemicellulose was 6.99 ± 0.05, lignin was 1.71 ± 0.88. Thus, the carbonization process indeed involved the biomass pyrolysis, during which the intermolecular and intramolecular chemical bonds of biomass would rupture into the gas and organic liquids, such as carbon dioxide, biological oil and so on. As the organic compounds of the biomass volatilized during the pyrolysis process, there would generate a large number of micro- and mesopore structures. Besides, the pyrolysis characteristics of hemicellulose, cellulose and lignin were quite different. The proper pyrolysis of hemicellulose was about 250~340°C, while that of cellulose was about 300~400°C and lignin was about 160~900°C [35]. The lignin pyrolysis took place in a wide range. That meant the pyrolysis of biomass would become more thorough as the temperature climbed. Thus, the pore structure of biochar became finer, the particle size of biochar decreased gradually, and the specific surface area showed an upward trend as the temperature rose. Moreover, after the complete decomposition of compound, the specific surface area and pore volume would keep unchanged. These resulted in a similar surface area and pore volume of KBC600 and KBC700, which further contributed to the high adsorption capacity. While, if further increasing the temperature, the pore structure of biochar would be destroyed with small pores becoming larger and large pore structure collapsing. This would lead to a small surface area of KBC800, so as the low adsorption capacity. From Figs. 4a and 4d, it was found that KBC700 had a coarser surface with many narrow grooves. It could be seen easily that the pore size of KBC800 was larger than KBC700 from Figs. 4e and 4f, because with the continuous increasing of temperature, the micropores become larger and the macropores collapsed.

Figure 4: SEM images of KBC700 (a, b, c) and KBC800 (d, e, f) at different magnification
In addition to physical adsorption, the differences of chemical adsorption should also be considered. The yield of kenaf fiber biochar pyrolyzed at different pyrolysis temperature was shown in the Table 3. It could be seen that the yield decreased with the increase of pyrolysis temperature. Specially, the yield reached 30% at 400°C, but dropped to only 14% at 800°C. This might because the high temperature would cause a more intense pyrolysis of kenaf, which more compounds decomposed. Also, when all the compounds in biomass had broken down, the yield would gradually become stable even with further increasing of the temperature.

Further analyzing the elements of kenaf biochar, it was notable to find that there contained a large proportion of carbon, little nitrogen and hydrogen. The carbon content of biochar increased firstly with the increase of carbonization temperature, from 76.78% at 400°C to 90.1% at 600°C, while it decreased slightly to 88.3% at 800°C. Besides, the content of hydrogen element decreased from 4.5% at 400°C to 1.8% at 700°C, but rose slightly to 2.5% at 800°C. Surprisingly, the ratio of hydrogen to carbon in biochar showed a volcano shape with the smallest value at 700°C, about 0.2. Based on the report of Ahmad et al. [36] that the H/C atomic ratio was related to the aromaticity of samples, the change of H/C atomic ratio also suggested the KBC700 had a better aromaticity, which might affect its adsorption properties.
The FTIR spectra of these biochar offered detail information of functional groups [37]. From Fig. 5, there existed about six peaks at about 2848.97 cm–1, 2817.13 cm–1, 1600 cm–1, 1400 cm–1, 875 cm–1 and 650~800 cm–1, which respectively corresponded to C-H, -CH3, C=C skeleton vibration of aromatic hydrocarbons, C-C absorption peak of aromatic ring, C-H absorption peak of aromatic ring and multiple C-H vibration peaks of aromatic ring [38]. Carefully observing the spectra, it could be found that as the temperature raised, the absorption peak strength of C-H and -CH3 increased with the maximum of KBC700. While the strength of these two peaks decreased significantly with further increasing the temperature, indicating that the increment of temperature led to the rupture of C-H bond. This result was consistent with that of the elemental analysis.

Figure 5: FTIR analysis spectra of biochar at different temperature
As the previous study reported that the adsorption of MB by biochar might cause an ion exchange that brought by polar functional groups. At the same time, due to its aromatic structure, it would form π-π conjugated structure with MB [39]. This interaction would bring an increase of adsorption ability, which might be one reason of the higher adsorption capacity of KBC700 than that of KBC600. According to the reference, Qin et al. [40] proposed that the π-π dispersive interactions between the aromatic rings of dyes and graphene layers were the primary mechanism for the high adsorbability of BC for reactive brilliant blue. Pereira et al. [41] also mentioned that the interaction between the oxygen-free Lewis basic sites and the free electrons of the dye molecule was the main adsorption mechanism for anionic dyes. Adsorption might cause ion exchange which brought about by polar functional groups.
In addition, considering there might exist chemical adsorption of MB, the acidic properties of biochar over KBC600 and KBC700 were collected by NH3-TPD. From the desorption temperature of ammonia, the acid strength of these samples could be deduced [42]. The higher desorption temperature of NH3 represented the stronger acidity of biochar [43], and the bigger desorption area meant the larger content of acid. From Fig. 6 it showes all the samples owned acidic sites, which was benefit for the adsorption of MB since MB had basic functional groups. Meanwhile, the desorption temperature of NH3 for KBC600 was obviously smaller than that of KBC700, and the desorption area of KBC700 was larger from the curve integral. Specifically, the heat of cellulose was relieved of evaporation to produce H2O, CO2, CO, etc., and free radicals had emerged, which further formed carboxyl groups and carbonyl groups, etc. This process was often accompanied by the breaking and rearrangement of chemical bonds, and non-volatile polysaccharides were irreversibly converted into carbon in the heating zone [44]. Aliphatic components were also consumed or converted into aromatic compounds [45]. Hu et al. [46] performed FTIR on the products of cellulose and hemicellulose in pyrolysis, confirming that the precipitation of gas was accompanied by the cleavage or recombination of oxygen-containing functional groups. The carboxyl groups and free hydroxyl groups generated in the process would provide the acidic sites over the catalysts. These phenomena implied KBC700 owned larger acidic sites, which might be due to the formation of carboxyl and hydroxyl groups during the pyrolysis process. This also possibly brought in an increased adsorption amount of MB molecules because of the chemical binding effects.

Figure 6: NH3-MS of KBC600 and KBC700
To sum up, the adsorption performance of biochar was determined by their physical and chemical properties together. With kenaf fibers pyrolyzing at low temperature, the compounds of biomass couldn’t decompose completely, leading to a low surface area and pore volume. Whereas, as the pyrolysis temperature increased, the surface area and pore volume became larger accompanying with forming richer acidic sties. This resulted in the highest MB adsorption amount of KBC700. However, when the pyrolysis temperature reached 800°C, most of the pores collapsed and the adsorption capacity plummeted.
3.3 Adsorption Kinetic Calculation
In order to figure out the adsorption behavior of these kind of biochar, the adsorption amount was measured over time. For all samples, the initial adsorption displayed a quick rate, and then became slowly when it was close to the equipment. Fig. 7 showed that the equilibrium time of these biochar was close, about 120 min. Within expectation, the KBC700 had a quicker initial adsorption rate than other samples, of which the adsorption amount was 3.7 mg·L–1 after 15 min and 8.6 mg·L–1 after 8 h. While, the initial adsorption rates of KBC400 and KBC800 were relatively low. The pseudo-first-order and pseudo-second-order model were used to fit the adsorption process. From the fitting parameters of kinetic model, it was obvious that the initial adsorption curve fitted well with the pseudo-first-order kinetic model, while the latter part showed a good match with the pseudo-second-order kinetic model (Table 4).

Figure 7: Kinetic fitting diagram of adsorption of MB by different biochar: (a) Pseudo-first-order model and (b) Pseudo-second-order model
Based on the adsorption model, the adsorption process of MB could be described. Since physical adsorption was a quick process that mainly related to the surface area and pore volume of biochar, it was assumed that the initial adsorption of MB mainly caused by the physical adsorption. Moreover, as the MB entered into the pores of biochar, the chemical adsorption caused by richer acidic sites and functional groups would play the role in the further adsorption of MB. This adsorption process well explained the above adsorption curves.

In the actual printing and dyeing wastewater treatment, the recovery and recycling of adsorbents can not only avoid secondary pollution and realize the utilization of solid waste, but also reduce the cost of treatment. A total of three elution-resorption experiments were performed. The recovery and reuse experiments of the adsorbent were shown in Fig. 8. It can be seen that the recycling rate of KBC700 was low. The removal rate of MB was 84.3% after one elution, only 61.5% after secondary elution, and 47.3% after third elution. This showed that the force between KBC700 and MB was strong. Also due to the stable combination, it was not easy to cause secondary pollution.

Figure 8: Recycling experiment with three cycles of removing MB by KBC700
In this work, kenaf was used as raw material for the preparation of biochar, which further be employed for the adsorption of MB. The effect of raw materials (kenaf bark, stem and fiber) and pyrolysis temperature (400~800°C) on the adsorption performance of MB were studied. Results showed that kenaf fiber with pyrolyzing at 700°C had a super adsorption performance, about 164.21 mg·g–1. Combined with various characterizations, it indicated there were a large number of pores and little acidic sites forming during the pyrolysis process. With the increasing of pyrolysis temperature, the number of pores and acidic sites would increase, thus leading to a higher adsorption capacity. While, if further increasing the pyrolysis temperature, the pores collapsed, which led the adsorption became difficult. Besides, by fitting the curve of adsorption amount with time, the adsorption kinetic model was calculated. It suggested that the MB first followed the physical adsorption on the surface of biochar, and then occurred chemical adsorption on the acidic sites in the pores. Recycling experiments proved that kenaf biochar had a good binding force to MB.
Funding Statement: This work was supported by National Natural Science Foundation of China (51903131), Natural Science Foundation of Shandong Province (ZR2019QEM007), Key Research and Development Program of Shandong Province (2020CXGC011101), State Key Laboratory of Bio-Fibers and Eco-Textiles (Qingdao University) (ZKT16 and ZKT21) and Special Foundation of “Taishan Scholar” Construction Program (ts20190932).
Conflicts of Interest: The authors declare that they have no conflicts of interest to report regarding the present study.
1. Lei, L., Hu, X., Chu, H. P., Chen, G., Yue, P. L. (1997). Catalytic wet air oxidation of dyeing and printing wastewater. Water Science and Technology, 35(4), 311–319. DOI 10.2166/wst.1997.0145. [Google Scholar] [CrossRef]
2. Banat, M. I., Nigam, P., Singh, D., Marchant, R. (1996). Microbial decolorization of textile-dye containing effluents: A review. Bioresource Technology, 58(3), 217–227. DOI 10.1016/S0960-8524(96)00113-7. [Google Scholar] [CrossRef]
3. Huang, R., Xin, W., Chen, K. D. L. (2004). Study on the treatment of dyeing and printing wastewater for reuse. Industrial Water Treatment, 24, 33–35. DOI 10.3969/j.issn.1005-829X.2004.07.010. [Google Scholar] [CrossRef]
4. Bordoloi, N., Dey, M., Mukhopadhyay, R., Kataki, R. (2018). Adsorption of Methylene blue and Rhodamine B by using biochar derived from Pongamia glabra seed cover. Water Science & Technology, 77(3), 638–646. DOI 10.2166/wst.2017.579. [Google Scholar] [CrossRef]
5. Huang, W., Chen, J., Zhang, J. (2018). Adsorption characteristics of methylene blue by biochar prepared using sheep, rabbit and pig manure. Environmental Science and Pollution Research, 25(29), 29256–29266. DOI 10.1007/s11356-018-2906-1. [Google Scholar] [CrossRef]
6. Yang, Z., Liu, X., Liu, X., Wu, J., Zhu, X. et al. (2021). Preparation of beta-cyclodextrin/graphene oxide and its adsorption properties for methylene blue. Colloids and Surfaces B: Biointerfaces, 200(1), 111605. DOI 10.1016/j.colsurfb.2021.111605. [Google Scholar] [CrossRef]
7. Sohi, S. P., Krull, E., Lopez-Capel, E., Bol, R. (2010). A review of biochar and its use and function in soil. Advances in Agronomy, 105, 47–82. DOI 10.1016/S0065-2113(10)05002-9. [Google Scholar] [CrossRef]
8. Uzun, B. B., Apaydın Varol, E., Pütün, E. (2016). Pyrolysis: A sustainable way from biomass to biofuels and biochar. In: Biochar: A regional supply chain approach in view of climate change mitigation, pp. 239–265. USA: Cambridge University Press. [Google Scholar]
9. Sajjadi, B., Chen, W. Y., Egiebor, N. O. (2019). A comprehensive review on physical activation of biochar for energy and environmental applications. Reviews in Chemical Engineering, 35(6), 735–776. DOI 10.1515/revce-2017-0113. [Google Scholar] [CrossRef]
10. Ozer, D., Dursun, G., Ozer, A. (2007). Methylene blue adsorption from aqueous solution by dehydrated peanut hull. Journal of Hazardous Materials, 144(1–2), 171–179. DOI 10.1016/j.jhazmat.2006.09.092. [Google Scholar] [CrossRef]
11. Inyang, M., Dickenson, E. (2015). The potential role of biochar in the removal of organic and microbial contaminants from potable and reuse water: A review. Chemosphere, 134(19), 232–240. DOI 10.1016/j.chemosphere.2015.03.072. [Google Scholar] [CrossRef]
12. Cha, J. S., Park, S. H., Jung, S. C., Ryu, C., Jeon, J. K. et al. (2016). Production and utilization of biochar: A review. Journal of Industrial and Engineering Chemistry, 40, 1–15. DOI 10.1016/j.jiec.2016.06.002. [Google Scholar] [CrossRef]
13. Qambrani, N. A., Rahman, M. M., Won, S., Shim, S., Ra, C. (2017). Biochar properties and eco-friendly applications for climate change mitigation, waste management, and wastewater treatment: A review. Renewable and Sustainable Energy Reviews, 79(10), 255–273. DOI 10.1016/j.rser.2017.05.057. [Google Scholar] [CrossRef]
14. Li, B., Yang, L., Wang, C. Q., Zhang, Q. P., Liu, Q. C. et al. (2017). Adsorption of Cd(II) from aqueous solutions by rape straw biochar derived from different modification processes. Chemosphere, 175(7), 332–340. DOI 10.1016/j.chemosphere.2017.02.061. [Google Scholar] [CrossRef]
15. Luo, M., Lin, H., Li, B., Dong, Y., He, Y. et al. (2018). A novel modification of lignin on corncob-based biochar to enhance removal of cadmium from water. Bioresource Technology, 259, 312–318. DOI 10.1016/j.biortech.2018.03.075. [Google Scholar] [CrossRef]
16. Minh, N. N., Stefan, D., Georg, G. (2013). Effects of pretreatment and solution chemistry on solubility of rice-straw phytoliths. Journal of Plant Nutrition and Soil Science, 177(3), 349–359. DOI 10.1002/jpln.201300056. [Google Scholar] [CrossRef]
17. Kan, T., Strezov, V., Evans, T. J. (2016). Lignocellulosic biomass pyrolysis: A review of product properties and effects of pyrolysis parameters. Renewable and Sustainable Energy Reviews, 57, 1126–1140. DOI 10.1016/j.rser.2015.12.185. [Google Scholar] [CrossRef]
18. Yaashikaa, P. R., Kumar, P. S., Varjani, S., Saravanan, A. (2020). A critical review on the biochar production techniques, characterization, stability and applications for circular bioeconomy. Biotechnology Reports, 28, e00570. DOI 10.1016/j.btre.2020.e00570. [Google Scholar] [CrossRef]
19. Yang, Z., Yan, G., Song, Z., Zhang, J., Wang, C. et al. (2021). Study on adsorption of As(III) by a new bio-material from chitin pyrolysis. Water, 13(21), 2944. DOI 10.3390/w13212944. [Google Scholar] [CrossRef]
20. Yuan, J., Xu, R., Zhang, H. (2011). The forms of alkalis in the biochar produced from crop residues at different temperatures. Bioresource Technology, 102(3), 3488–3497. DOI 10.1016/j.biortech.2010.11.018. [Google Scholar] [CrossRef]
21. Yuan, J., Xu, R. (2012). Effects of biochars generated from crop residues on chemical properties of acid soils from tropical and subtropical China. Soil Research, 50, 570. DOI 10.1071/SR12118. [Google Scholar] [CrossRef]
22. Xiang, W., Zhang, X., Chen, J., Zou, W., He, F. et al. (2020). Biochar technology in wastewater treatment: A critical review. Chemosphere, 252, 126539. DOI 10.1016/j.chemosphere.2020.126539. [Google Scholar] [CrossRef]
23. Wambua, P., Ivens, J., Verpoest, I. (2003). Natural fibres: Can they replace glass in fibre reinforced plastics? Composites Science and Technology, 63(9), 1259–1264. DOI 10.1016/S0266-3538(03)00096-4. [Google Scholar] [CrossRef]
24. Angelova, V., Ivanova, R., Delibaltova, V., Ivanov, K. (2004). Bio-accumulation and distribution of heavy metals in fibre crops (flax, cotton and hemp). Industrial Crops and Products, 19(3), 197–205. DOI 10.1016/j.indcrop.2003.10.001. [Google Scholar] [CrossRef]
25. Hossain, M. D., Hanafi, M. M., Jol, H., Hazandy, A. H. (2011). Growth, yield and fiber morphology of kenaf (Hibiscus cannabinus L.) grown on sandy bris soil as influenced by different levels of carbon. African Journal of Biotechnology, 10, 10087–10094. DOI 10.1186/1471-2164-12-442. [Google Scholar] [CrossRef]
26. Aziz, S., Ansell, M., Clarke, S., Panteny, S. (2005). Modified polyester resins for natural fibre composites. Composites Science and Technology, 65(3–4), 525–535. DOI 10.1016/j.compscitech.2004.08.005. [Google Scholar] [CrossRef]
27. Tahir, M., Ahmed, P., Saiful, A., Azry, S., Ahmed, Z. (2011). Retting process of some bast plant fibres and its effect on fibre quality: A review. BioResources, 6(4), 5260–5281. [Google Scholar]
28. Saba, N., Paridah, M. T., Jawaid, M., Abdan, K., Azowa, N. (2015). Potential utilization of kenaf biomass in different applications. Springer International Publishing, USA. [Google Scholar]
29. Tatsumi, D., Zaima, N., Matsumoto, T., Sugiyama, H., Takahashi, H. (2006). Hydrotropic pulping and biobleaching of kenaf. Journal of the Society of Materials Science, 55(4), 363–366. DOI 10.2472/jsms.55.363. [Google Scholar] [CrossRef]
30. Maleque, M., Atiqah, A., Fazal, M., Iqbal, M. M., Paruka, P. (2015). Effect of electron beam radiation on water absorption of hybrid kenaf-glass unsaturated polyester composite. Advanced Materials Research, 1115, 266–269. DOI 10.4028/www.scientific.net/AMR.1115.266. [Google Scholar] [CrossRef]
31. Liu, B., Chen, Y., Meng, H., Yao, Z., Wang, X. (2014). Burning and adsorption characteristics of char obtained from pyrolysis of cotton stalk and rapeseed straw. Nongye Gongcheng Xuebao/Transactions of the Chinese Society of Agricultural Engineering, 30, 193–200. DOI 10.3969/j.issn.1002-6819.2014.10.024. [Google Scholar] [CrossRef]
32. Uchimiya, M., Wartelle, L., Klasson, K., Fortier, C., Lima, I. (2011). Influence of pyrolysis temperature on biochar property and function as a heavy metal sorbent in soil. Journal of Agricultural and Food Chemistry, 59(6), 2501–2510. DOI 10.1021/jf104206c. [Google Scholar] [CrossRef]
33. Ji, B., Wang, J., Song, H., Chen, W. (2019). Removal of methylene blue from aqueous solutions using biochar derived from a fallen leaf by slow pyrolysis: Behavior and mechanism. Journal of Environmental Chemical Engineering, 7(3), 103036. DOI 10.1016/j.jece.2019.103036. [Google Scholar] [CrossRef]
34. Keiluweit, M., Nico, P. S., Johnson, M. G., Kleber, M. (2010). Dynamic molecular structure of plant biomass-derived black carbon (Biochar). Environmental Science & Technology, 44(4), 1247–1253. DOI 10.1021/es9031419. [Google Scholar] [CrossRef]
35. Li, Y., Xing, B., Ding, Y., Han, X., Wang, S. (2020). A critical review of the production and advanced utilization of biochar via selective pyrolysis of lignocellulosic biomass. Bioresource Technology, 312(1), 123614. DOI 10.1016/j.biortech.2020.123614. [Google Scholar] [CrossRef]
36. Ahmad, M., Rajapaksha, A., Lim, J. E., Zhang, M., Bolan, N. et al. (2013). Biochar as a sorbent for contaminant management in soil and water: A review. Chemosphere, 99, 19–33. DOI 10.1016/j.chemosphere.2013.10.071. [Google Scholar] [CrossRef]
37. Sun, L., Wan, S., Luo, W. (2013). Biochars prepared from anaerobic digestion residue, palm bark, and eucalyptus for adsorption of cationic methylene blue dye: Characterization, equilibrium, and kinetic studies. Bioresource Technology, 140, 406–413. DOI 10.1016/j.biortech.2013.04.116. [Google Scholar] [CrossRef]
38. Afroze, S., Sen, T. K., Ang, M., Nishioka, H. (2016). Adsorption of methylene blue dye from aqueous solution by novel biomass Eucalyptus sheathiana bark: Equilibrium, kinetics, thermodynamics and mechanism. Desalination and Water Treatment, 57(13), 5858–5878. DOI 10.1080/19443994.2015.1004115. [Google Scholar] [CrossRef]
39. Li, G., Zhu, W., Zhang, C., Zhang, S., Liu, L. et al. (2016). Effect of a magnetic field on the adsorptive removal of methylene blue onto wheat straw biochar. Bioresource Technology, 206, 16–22. DOI 10.1016/j.biortech.2015.12.087. [Google Scholar] [CrossRef]
40. Qiu, Y., Zheng, Z., Zhou, Z., Sheng, G. D. (2009). Effectiveness and mechanisms of dye adsorption on a straw-based biochar. Bioresource Technology, 100(21), 5348–5351. DOI 10.1016/j.biortech.2009.05.054. [Google Scholar] [CrossRef]
41. Pereira, M., Soares, S. F., Orfao, J., Figueiredo, J. L. (2003). Adsorption of dyes on activated carbons: Influence of surface chemical groups. Carbon, 41, 811–821. DOI 10.1016/S1387-1811(01)00389-4. [Google Scholar] [CrossRef]
42. Lónyi, F., Valyon, J. (2001). On the interpretation of the NH3-TPD patterns of H-ZSM-5 and H-mordenite. Microporous and Mesoporous Materials, 47(2–3), 293–301. DOI 10.1016/S1387-1811(01)00389-4. [Google Scholar] [CrossRef]
43. Dai, L., Zeng, Z., Tian, X., Jiang, L., Yu, Z. et al. (2019). Microwave-assisted catalytic pyrolysis of torrefied corn cob for phenol-rich bio-oil production over Fe modified bio-char catalyst. Journal of Analytical and Applied Pyrolysis, 143, 104691. DOI 10.1016/j.jaap.2019.104691. [Google Scholar] [CrossRef]
44. Ozturk, Z. (1991). Pyrolysis of cellulose using a single pulse shock tube. Kansas State University, USA. [Google Scholar]
45. Rutherford, D. W., Wershaw, R. L., Cox, L. G. (2004). Changes in composition and porosity occurring during the thermal degradation of wood and wood components. Scientific Investigations Report, USA. [Google Scholar]
46. Hu, Y. M., Jiang, J. C., Sun, Y. J., Yang, Z. Z. (2014). Interaction during the pyrolysis process of cellulose and hemicellulose. Chemistry & Industry of Forest Products, 22, 1–8. [Google Scholar]
ERRATUM
Preparation of Kenaf Biochar and Its Adsorption Properties for Methylene Blue
1College of Textiles, Qingdao University, Qingdao, 266000, China
2State Key Laboratory of Bio-Fibers and Eco-Textiles, Qingdao University, Qingdao, 266071, China
3State Key Laboratory of New Textile Materials and Advanced Processing Technologies, Wuhan Textile University, Wuhan, 430000, China
4Key Laboratory of Textile Fiber and Products (Wuhan Textile University), Ministry of Education, Wuhan, 430200, China
*Corresponding Author: Wei Jiang. Email: weijiangqd@qdu.edu.cn
#These authors contributed equally to this work.
Journal of Renewable Materials, Vol.10, No.12, pp. 3391–3404, (2022)
The fourth author’s name in the original paper was incorrectly spelled as “Chenfeng Zhou”. The corrected spelling of the fourth author’s name is “Chengfeng Zhou”. The authors apologize for this error, which has now been corrected in the original article.
 | This work is licensed under a Creative Commons Attribution 4.0 International License, which permits unrestricted use, distribution, and reproduction in any medium, provided the original work is properly cited. |