| Journal of Renewable Materials |
DOI: 10.32604/jrm.2022.016374
ARTICLE
Process Evaluation, Tensile Properties and Fatigue Resistance of Chopped and Continuous Fiber Reinforced Thermoplastic Composites by 3D Printing
1School of Mechanical Engineering, Jiangnan University, Wuxi, 214122, China
2Jiangsu Province Key Laboratory of Advanced Food Manufacturing Equipment and Technology, Jiangnan University, Wuxi, 214122, China
*Corresponding Author: Qiuju Zhang. Email: qjzhang@jiangnan.edu.cn
Received: 03 March 2021; Accepted: 15 April 2021
Abstract: The aim of this article was to comprehensively evaluate the manufacturing process, tensile properties and fatigue resistance of the chopped and continuous fiber reinforced thermoplastic composites (CFRTPCs) by 3D printing. The main results included: the common defects of the printed CFRTPCs contained redundant and accumulation defects, scratch and warping defects; the continuous fiber contributed to the dimensional stability and accuracy of width and thickness; associations between mass percentage of fiber reinforcement and the averages of elastic modulus, strain at break and ultimate tensile strength were approximately linear based on tensile test results; the fatigue resistance improved with the increasing fiber reinforcement based on fatigue test results. As for specimens with four fiber rings, there was a good linear relationship between the stress level and logarithm value of cycles during the whole life while those of pure matrix and specimens with one and two fiber rings were piecewise linear, taking about 10,000 cycles as boundary. The micro morphology showed that the fatigue failure behaved as matrix fracture, large and small fiber bundles and single fibers extracted from matrix. Under the tension-tension fatigue load, the deformations where easily concentrating stress behaved as sunken surfaces along thickness and width directions, and the deformation along width direction was greater than that along thickness direction.
Keywords: CFRTPCs; 3D printing; tensile test; fatigue behavior; stress level; micro morphology
Continuous fiber reinforced thermoplastic composites (CFRTPCs) usually consist of thermoplastic resin matrix and continuous fiber reinforcement [1]. The thermoplastic matrix including Polylactic Acid (PLA), Acrylonitrile Butadiene Styrene plastic (ABS) and Nylon, etc., is reinforced by continuous fiber reinforcement such as carbon fiber, glass fiber, Kevlar fiber and so on [2,3]. Note that the ratio of continuous fiber length and diameter greater than or equal to the 5th power of 10. Compared with traditional metal materials and inorganic non-metal materials, the advantages of CFRTPCs include high specific strength and modulus, good anisotropy and designability, good dimensional stability and chemical resistance, simple molding process, outstanding vibration damping and electrical properties, low thermal conductivity and potential lightweight structures [4,5]. It has been one of the new strategic and basic composite materials with growing development in recent years mainly because of the recyclability performance in the environmental protection [6], widely applied in military equipment, aerospace, energy and power, biomedicine, marine engineering, transportation, sports and high-precision equipment, etc.
3D printing is a process of joining materials, layer upon layer, in order to create objects from 3D model data [7]. It has been an intelligent additive manufacturing technology for composites such as bio-plastic with carbon fibers and twisted Kevlar composites [8–10]. In comparison with conventional molding methods, the 3D printing process is more effective since it can reduce the design-manufacturing cycle and thus, decrease the production cost and increase the competitiveness [11]. Additionally 3D printing can realize the rapid prototyping of complex structures like honeycomb sandwich structure [12], without the need for molds and connection processes [13]. It provides an effective way for the low-cost and rapid manufacturing of the advanced composite parts, which has huge application prospects in the future [14,15].
The 3D printing technology offers a cleaner production pattern for high-performance CFRTPCs on the base of recycling and remanufacturing of the printed composites. Tian et al. [16] proposed that continuous carbon fiber and PLA matrix was recycled in the form of PLA impregnated carbon fiber filament from 3D printed composite components and reused as the raw material for further 3D printing process. Tensile performance of recycled carbon fiber filaments was evaluated, which was higher than that of originally printed composites. Remanufactured CFRTPCs specimens also exhibited a 25% higher bending strength than that of original ones, which experimentally demonstrated the first non-downgrade recycling process for CFRTPCs. A material recovery rate of 100% for continuous carbon fiber and 73% for PLA matrix were achieved for a better environmental impact, with a potential strategy for the low-cost industrial application of fully recyclable composites.
With the rapid development of 3D printing technology, some researches on the fatigue behaviors of 3D printed CFRTPCs have been conducted. The static and fatigue 3-point bending tests were implemented on a 3D printed sandwich composites with a re-entrant honeycomb core to evaluate the durability and the ability of this material to dissipate energy [17]. Ramakrishnan et al. [18] proposed a fatigue damage mathematical model based on stiffness degradation, which thoroughly considered the mechanical properties of the component materials and various influencing factors; Varvani-Farahani et al. [19,20] introduced the influence of ply angle and average stress on composite material fatigue damage into the model proposed by Ramakrishnan et al. and Pertuz et al. [21] studied tensile and fatigue tests of CFRTPCs and the results showed that carbon fiber isotropic layers had the higher ultimate tensile stress, with 165 MPa. And specimens with nylon matrix, triangular filling pattern and matrix density of 20%, reinforced with carbon fiber at 0-degrees, showed better fatigue performance, increasing significantly the number of cycles before specimen rupture. Krairi et al. [22] proposed two multiscale modeling approaches to predict the high cycle fatigue (HCF) failure of neat thermoplastic polymers and of short glass fiber reinforced thermoplastics.
The mechanical properties of composite materials are mainly determined by the properties of the three components of fiber, matrix, and fiber/matrix interface. The main damage forms of composite materials include [23–25]: fiber fracture, matrix cracking, fiber/matrix interface debonding, delamination expansion, fiber pull-out, fiber buckling, etc. At present, 3D printing continuous fiber reinforced composites still face outstanding problems such as low fiber volume content, low interface bonding strength, and high porosity. Many researches have shown that the interlayer cracking is the main reason for the failure of composites, and it is also the main obstacle that restricts the effective application of composites [26,27]. Caminero et al. [28] demonstrated that interlaminar shear strength (ILSS) values decreased as layer thickness increased due to higher porosity. And among continuous carbon, glass and Kevlar (R) fiber, carbon fiber reinforced nylon composites manufactured by fused deposition modeling (FDM) exhibited the best interlaminar shear performance with higher stiffness, and Kevlar (R) fiber reinforced composites have the lowest interlaminar shear performance due to poor wettability of Kevlar (R) fiber bundles by the nylon, leading to extensive delamination. Besides, Caminero et al. [29] also analyzed impact damage in 3D printed continuous glass fiber reinforced thermoplastic laminates using phased array ultrasonic testing to quantify the amount of damage in terms of delaminated area.
In this article, the specific 3D printing system of the CFRTPCs specimens was analyzed systematically and the printing quality including common defects was evaluated by the accuracy and stability comprehensively. To study the effect of fiber content and distribution pattern on the tensile and fatigue properties of 3D printed CFRTPCs, the content and distribution arrangement of continuous fibers were designed, and tensile tests were performed to characterize the static mechanical properties and also to provide stress levels for fatigue tests. Fatigue tests were carried out under different stress levels to analyze the durability behavior of 3D printed CFRTPCs. Finally the fracture morphology and the printing surface quality were analyzed by the Super Depth of Field 3D Microscope with DVM6 model provided by LEICA Inc., USA.
3D printing process of CFRTPCs consists of two steps: first, the printing paths are designed by the software in upper computer; second, the additive manufacturing process is completed automatically by the hardware actuator under the control of lower computer. The principle of 3D printer for CFRTPCs (Fig. 1) is based on the FDM technology. The thermoplastic filament is fed by the feeder in the first print head, melted in the inner pool and extruded in the molten state, then cooled and solidified to form samples on the hot bed. The pre-impregnated continuous fiber is fed in the second print head, crossing through the guide sleeve and cutter, and then the thermoplastic resin is melted to promote the bond between continuous fibers and matrix. Note that the feeder consists of active and driven shafts, and the hot bed provides some heat energy reducing internal stresses to ensure samples without distortion. Additionally, the embedded control system of lower computer receives the design commands from upper computer and sends feedback signals to upper computer, controlling the CoreXY mechanism to realize the movement on the XY plane, and it realizes the movement of printing table in the Z-axis direction by the roller screw.
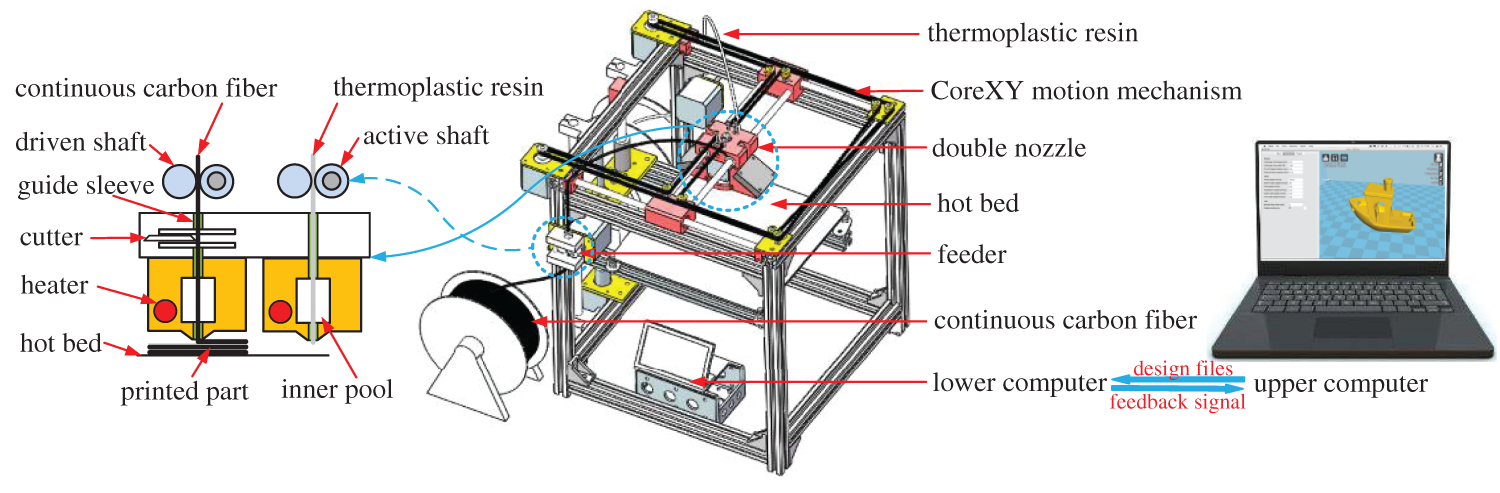
Figure 1: The scheme of 3D printing process for CFRTPCs parts
The cutter is specially designed for 3D printing of CFRTPCs because the continuity of fibers obstructs the freedom of path planning to a certain degree [30,31]. In the process of layer-by-layer accumulation, continuous fibers need to be cut between layers, between multiple closed printing paths in a single layer, and at some special printing positions to ensure surface quality and mechanical properties of 3D printed CFRTPCs. Therefore, the cutter is an indispensable part of the 3D printer for CFRTPCs.
In order to characterize the mechanical properties of the 3D printed CFRTPCs samples, the tensile tests and fatigue tests were carried out to study the static and dynamic mechanical properties. The monotonic tension tests were conducted first to determine the stress levels on tension-tension fatigue test of CFRTPCs specimens.
Samples for tensile test were fabricated using a desktop 3D printer (MarkTwo, MarkForged). The sample geometry was created according to GB/T 16779-2008 (GB/T 16779-2008, Test method for tension-tension fatigue of fiber reinforced plastic laminates) using a dumbbell geometry [32]. The geometry used in this study and critical dimensions are shown in Fig. 2. The test specimen geometry was created using a computer aided design (CAD) software package (SolidWorks 2016 SP4.0, Dassault Systems). The specimen geometry was exported as a stereolithography file (STL) and loaded into a 3D printer slicing software package (Eiger, MarkForged). The Eiger software package is required to control the placement of fiber reinforcement and printing paths of matrix as shown in Fig. 3. All samples were printed with Onyx matrix filaments (Onyx, MarkForged) with continuous carbon fiber reinforcement (CF Reinforcement, MarkForged). Note that the Onyx filament is made from Nylon mixed with chopped carbon fibers as a composite plastic matrix, and the fiber filament is composed of continuous carbon fiber bundles with approximately 1000 fiber filaments pre-impregnated by Nylon matrix (considered as composite filament) in order to provide strong interfacial bonding between fiber and plastic [33].
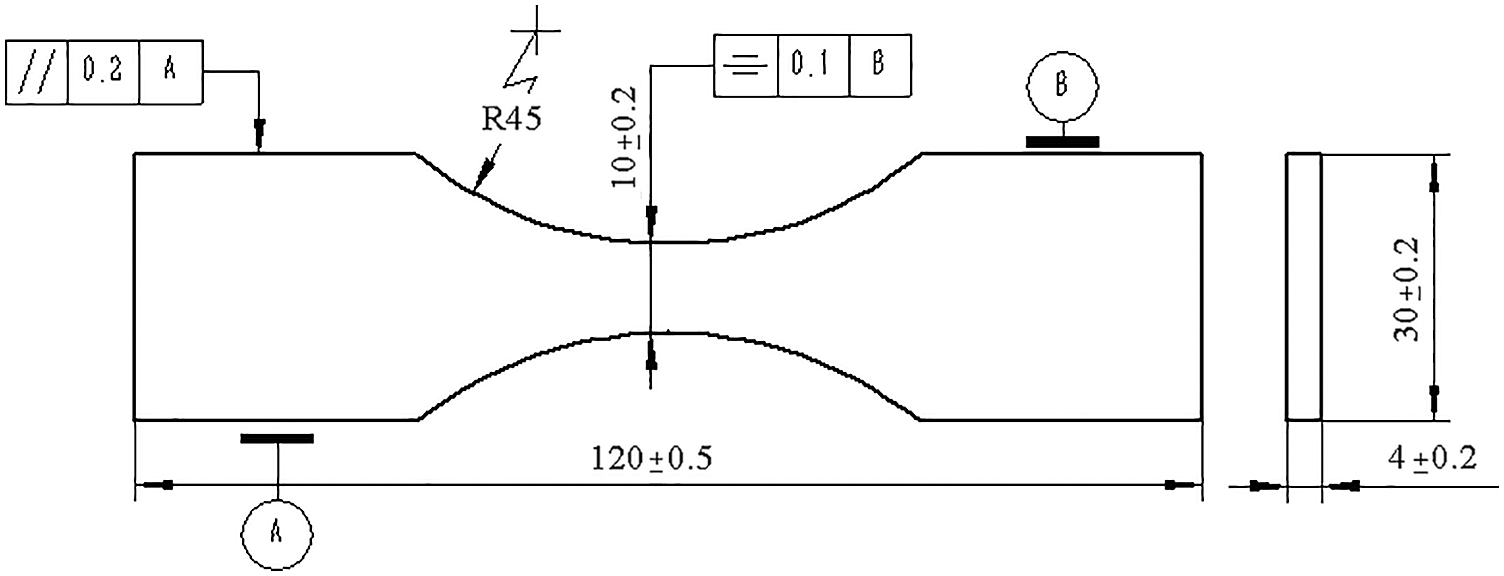
Figure 2: The general sizes of 3D printed specimen
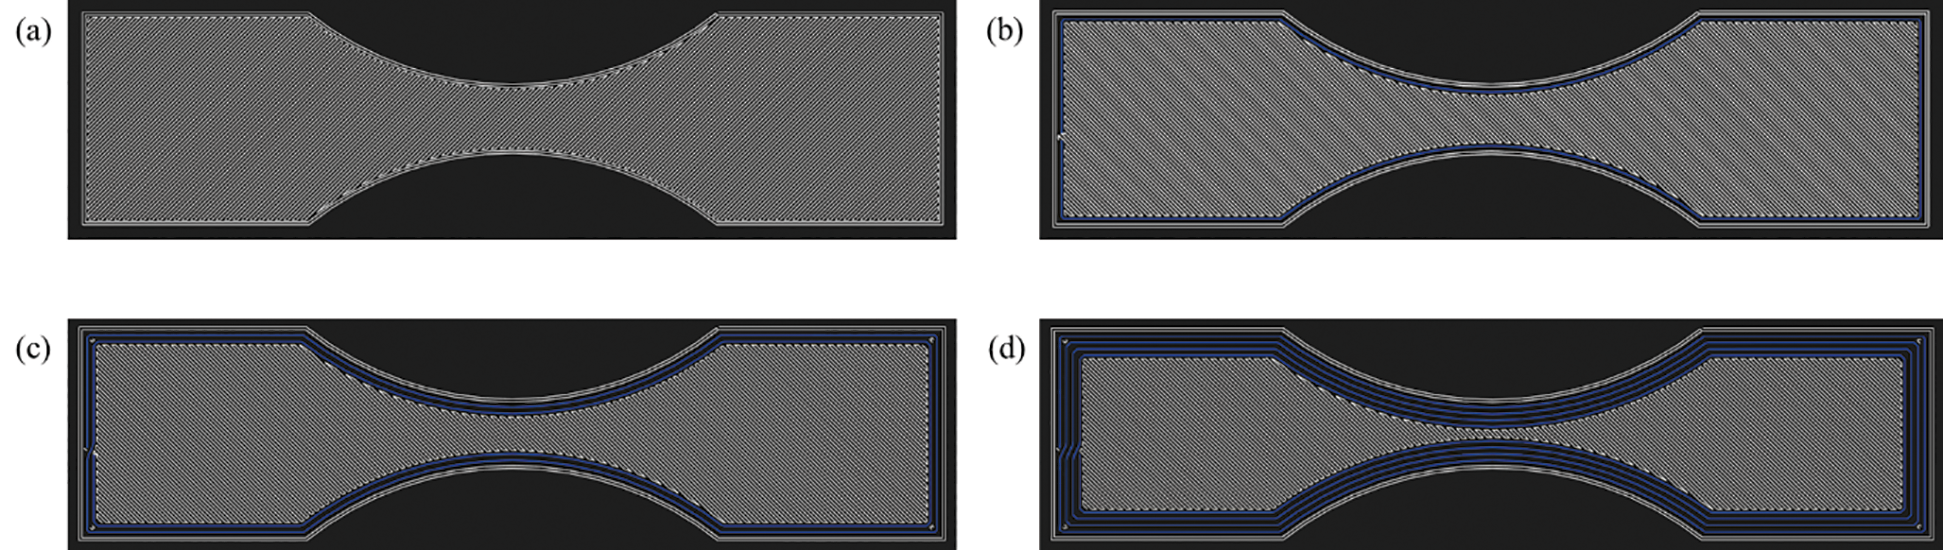
Figure 3: The inner design of layer constructions for CFRTPCs specimens: (a) Onyx with no CF, (b) 1CF with one CF ring, (c) 2CF with two CF rings, (d) 4CF with four CF rings
In particular, the desktop 3D printer MarkTwo and the printing materials including the matrix Onyx and the continuous carbon fiber reinforcement were provided by the Markforged Inc. (USA) which has a wide range of recognition in the 3D printing field of the CFRTPCs parts. Therefore, this research has the universal reference value for the improvement of the 3D printed CFRTPCs.
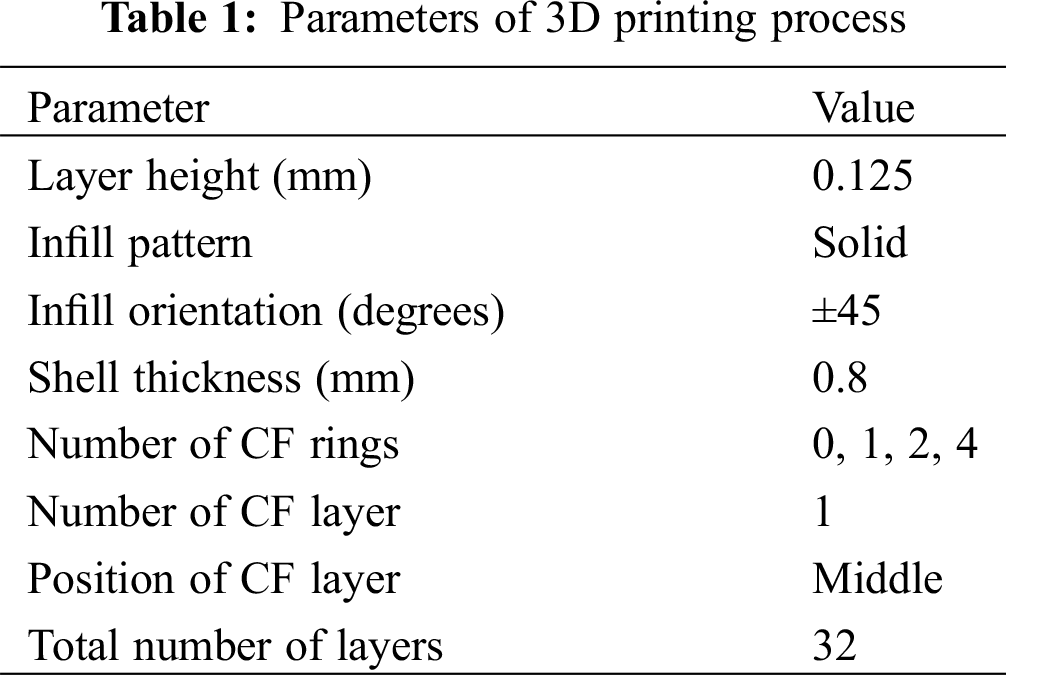
The printing parameters used to manufacture the test specimen are summarized in Tab. 1. The mechanical properties of a built part depend on several process parameters [34–36]. The MarkTwo 3D printer reinforces printed structures using continuous Kevlar, Carbon or Glass fibers. For this study, continuous carbon fibers were utilized due to its high specific strength, specific modulus, great fatigue resistance, great high temperature and low temperature resistance and so on [37]. The printed samples were reinforced with concentric fiber rings in the middle layer as shown in Fig. 3. It should be noted that the path junctions of shell and CF reinforcement were arranged at ends to avoid bearing much force. Besides, for the thermoplastic resin matrix, the infill pattern was solid and infill orientations of neighboring layers were ±45° to reduce the accumulation of filling gaps and achieve better mechanical properties.
The number of reinforced concentric CF rings ranged from zero (pure Onyx) to 4 rings for this geometry, with the limiting factor being the thin 10 mm (W) neck region. The CF reinforcement rings were distributed only in the middle layer named Onyx, 1CF, 2CF and 4CF, respectively, as shown in Fig. 3. The number of reinforced CF rings were varied to quantify the effect of continuous carbon fibers on the fatigue properties of the 3D printed CFRTPCs specimens.
Under the action of cyclic loading, the damage modes of composite materials are more complicated, including matrix cracking, interface debonding, delamination failure, fiber breaking, fracture and a combination of the above failure modes [38,39]. The generation, expansion, coupling and failure of different damage modes will lead to the degradation of composite stiffness. The evolution process of fatigue damage and stiffness degradation law of composite materials can be roughly divided into three stages, as shown in Fig. 4.
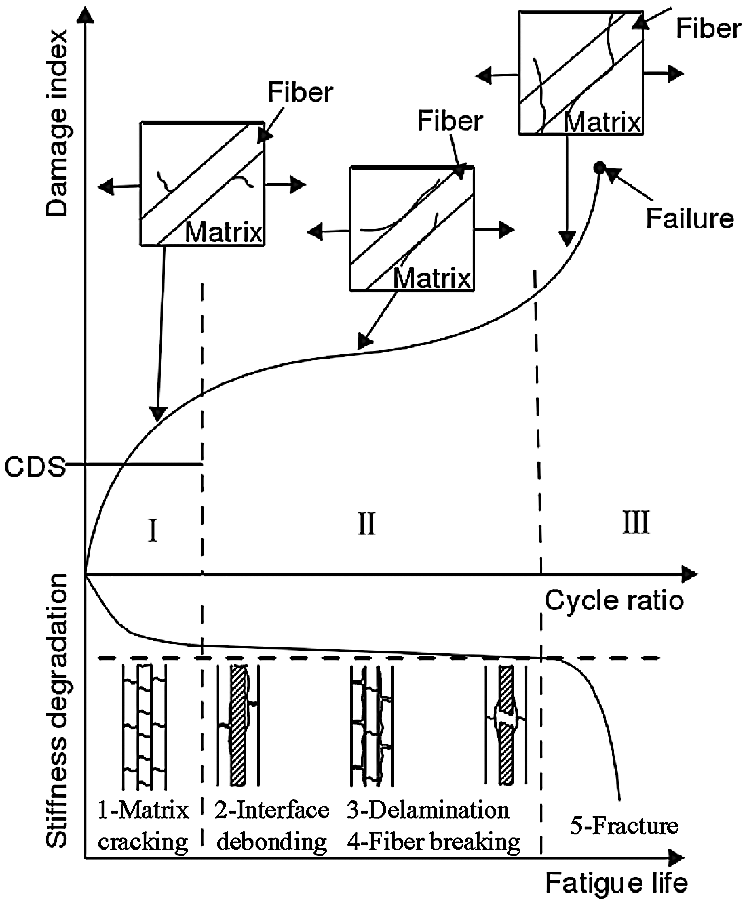
Figure 4: Fatigue damage mechanism and stiffness degradation of CFRTPCs
In the Stage I, the damage curve tends to change linearly, and the stiffness degradation is very significant. The reason is that, on the one hand, the thermal expansion coefficients of fiber and matrix are different, so there is a large residual tensile stress in the matrix after being solidified, causing the initial small cracks of matrix and regional cracks between fiber and matrix. On the other hand, relative to fibers, the load-bearing capacity of matrix is poor, so in the initial stage the damage is manifested as the transverse dispersion and cracking of matrix between fibers. And the crack density will reach the highest characteristic damage state (CDS) [40], resulting in the sudden decrease in stiffness. Then cracks are generated and spread to adjacent fiber layers, and the local damage and adjacent layers will be affected but the integrity of 3D printed laminate is still preserved. The proportion of life in Stage I is generally less than 20%, and the end flag is the saturated state of cracks so-called CDS.
In the Stage II, when the diffuse cracks become saturated, most of the load is converted and redistributed, mainly borne by fibers. At this stage, the fatigue life of composite materials is longer, and the stiffness degradation is not rapid. The main reason is that the fiber has a strong bearing capacity and inhibits the expansion of damage.
The Stage III is the last stage near fatigue failure, where the damage curve rises sharply and the stiffness degradation is more rapid. After the first and second stages of the accumulation of fatigue damage and the concentrated evolution of the local damage, the fiber appears to be fractured in a large area, and the residual stiffness decreases rapidly, resulting in the final fatigue failure for composite materials. The proportion of life span at this stage is very small, and laminates show “sudden failure” characteristics.
The evolution law of composite fatigue damage can be used to predict the structural fatigue life of composite materials, but fatigue damage cannot be directly measured. Therefore, using the elastic modulus of composite materials can quantitatively evaluate fatigue damage. The normalized fatigue damage amount is defined as Eq. (1), where D is the normalized fatigue damage index, E is the elastic modulus of the damaged material, E0 is the initial elastic modulus of the material.
Based on the mechanical properties of component materials and the influencing factors of the fatigue strength, Shirazi et al. [41] proposed a normalized fatigue damage model described in Eq. (2), where η(0 < η < 1) is the weighting factor, the subscripts m, f and θ respectively indicate the matrix, fiber and the infill angle of paths. The parameters Emθ and Efθ are respectively shown in Eqs. (3) and (4).
Here Ef is the elastic modulus in the direction of fibers, Em is the elastic modulus of the matrix material, Vf and Vm are the fiber and matrix volume percentages of composite materials. The parameters
To determine the stress levels on tension-tension fatigue test of CFRTPCs, firstly, monotonic tension tests were conducted on four kinds of sample configurations including Onyx, 1CF, 2CF, 4CF. The test specimens were mounted in the universal testing machine QJ211S-5KN with 0.5 grade accuracy and they were tested with a constant strain rate of 2 mm/min until failure occurred.
To study the effect of different stress levels on fatigue residual stiffness of 3D printed CFRTPCs, tension-tension fatigue tests were conducted on four kinds of samples including Onyx, 1CF, 2CF, 4CF. The test specimens were mounted in the fatigue testing machine MTS Landmark 370.10. They were tested with a tension-tension rate of 10 Hz and with a stress ratio of 0.1, until fracture failure occurred.
The tensile force of tension-tension fatigue for the four kinds of specimens is shown in Fig. 5, as sine and cosine function curves. It can be seen that the maximum stress and the minimum stress are both pulling stresses. The main feature parameters including the maximum stress Smax, average stress Sm, amplitude of stress Sa and stress ratio R, are shown in Eqs. (10)–(13), where σ is the fracture stress and p is the stress level.
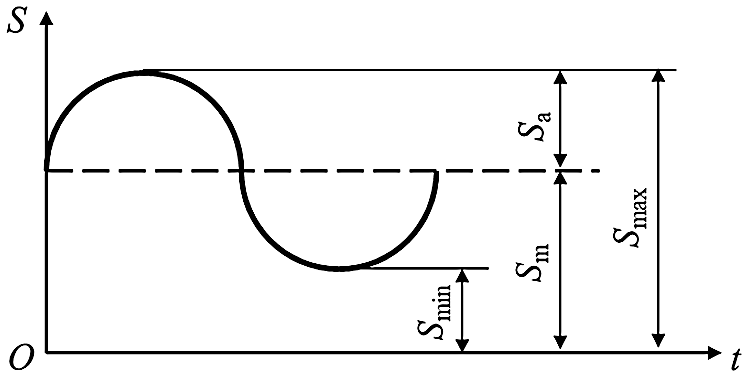
Figure 5: Stress-time curves applied in tension-tension fatigue test
This section discusses the results and gives possible explanations on why certain results are the way they are. First, the printing precision and stability of 3D printer MarkTwo are measured and discussed. Second, a general comparison of tension-tension fatigue properties between the designed CFRTPCs specimens with different carbon fiber volumes is made. Third, the mathematical models to describe the effect of different stress levels on fatigue lives of 3D printed CFRTPCs are constructed and evaluated to verify and predict more accurate fatigue resistance. Finally the micro-structural analysis of the 3D printed specimens with fatigue failure is addressed to explain the effect of tension-tension fatigue.
Before actually testing the mechanical performance of printed specimens, the printing quality of the MarkTwo 3D printer has to be analyzed first because the defects of printed samples generated during the printing process named the printing defects, probably have negative effect on the surface and mechanical performances. For this purpose a series of CFRTPCs specimens were printed to further understand the printing defects during 3D printing process of the MarkTwo printer.
The 3D printed specimens as shown in Fig. 6a revealed that most samples had smooth surface with few defects. However, there were still a small number of samples with redundant defects, accumulation defects, and scratch defects, shown in Fig. 6b, and it was likely to affect the surface quality and mechanical properties of 3D printed specimens. The main factor resulting in redundant defects was the continuous extrusion even during the empty stroke, and the greater fluidity of the molten material or the stop delay of wire feeding mechanism. When the print head stopped at a certain position or the printing movement was stuck, the nozzle was still extruding the material to cause accumulation defects; upon the print head moving again, it was easy to cause scratch defects.
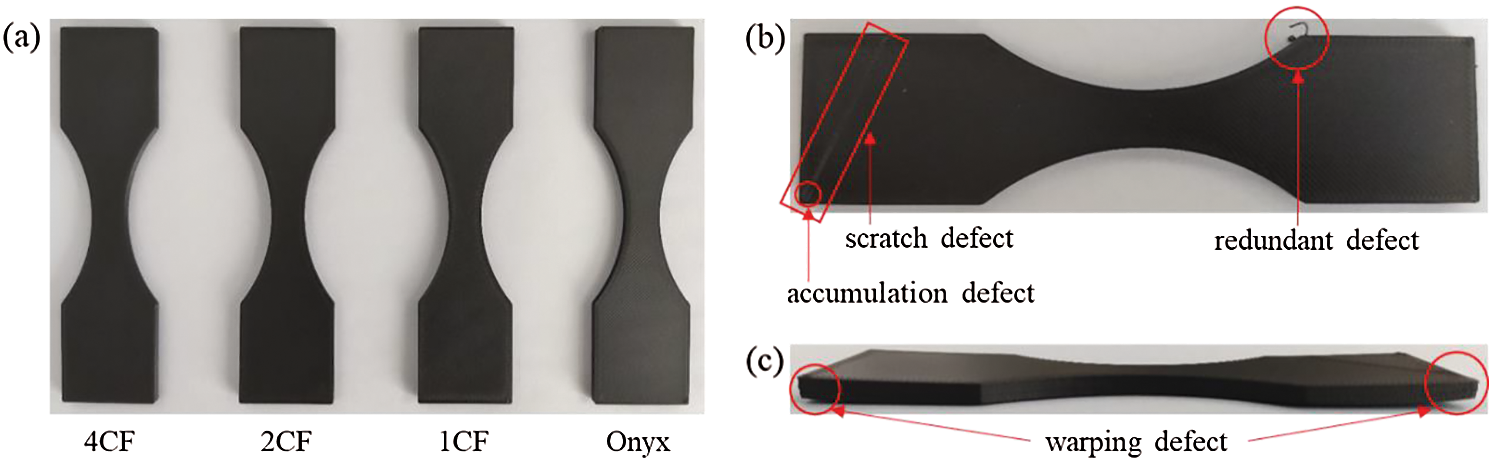
Figure 6: (a) The four kinds of 3D printed CFRTPCs specimens, (b) The classic 3D printed defects, (c) The side view of warping defect
The warping defect shown in Fig. 6c appeared less frequently in the printing process and it had an obvious negative impact on the accuracy and stability of printing sizes. Warping defects were often located at ends or edges of 3D printed samples, where samples were easy to lack material because of the matching error of the moving speed of printing head and the feeding speed of feeding mechanism. Moreover, the filling paths of the outer shell and the inner area were different resulting in large gap defects in the junction where was easier to concentrate internal stress at edges leading to warping defect. And the uneven thermal stress caused by temperature changes during the printing process also could be an important factor causing the warping defect. Additionally, the edge was printed first so it was not very easy to adhere to the printing table, possibly resulting in warping defects. It was noted that warping defects usually easily caused accumulation defects and scratch defects.
For a more detailed observation, the partial morphology of the printed surfaces by the digital optical microscope LEICA DVM6 are shown in Fig. 7 below and Fig. S1 provided in the supporting material.
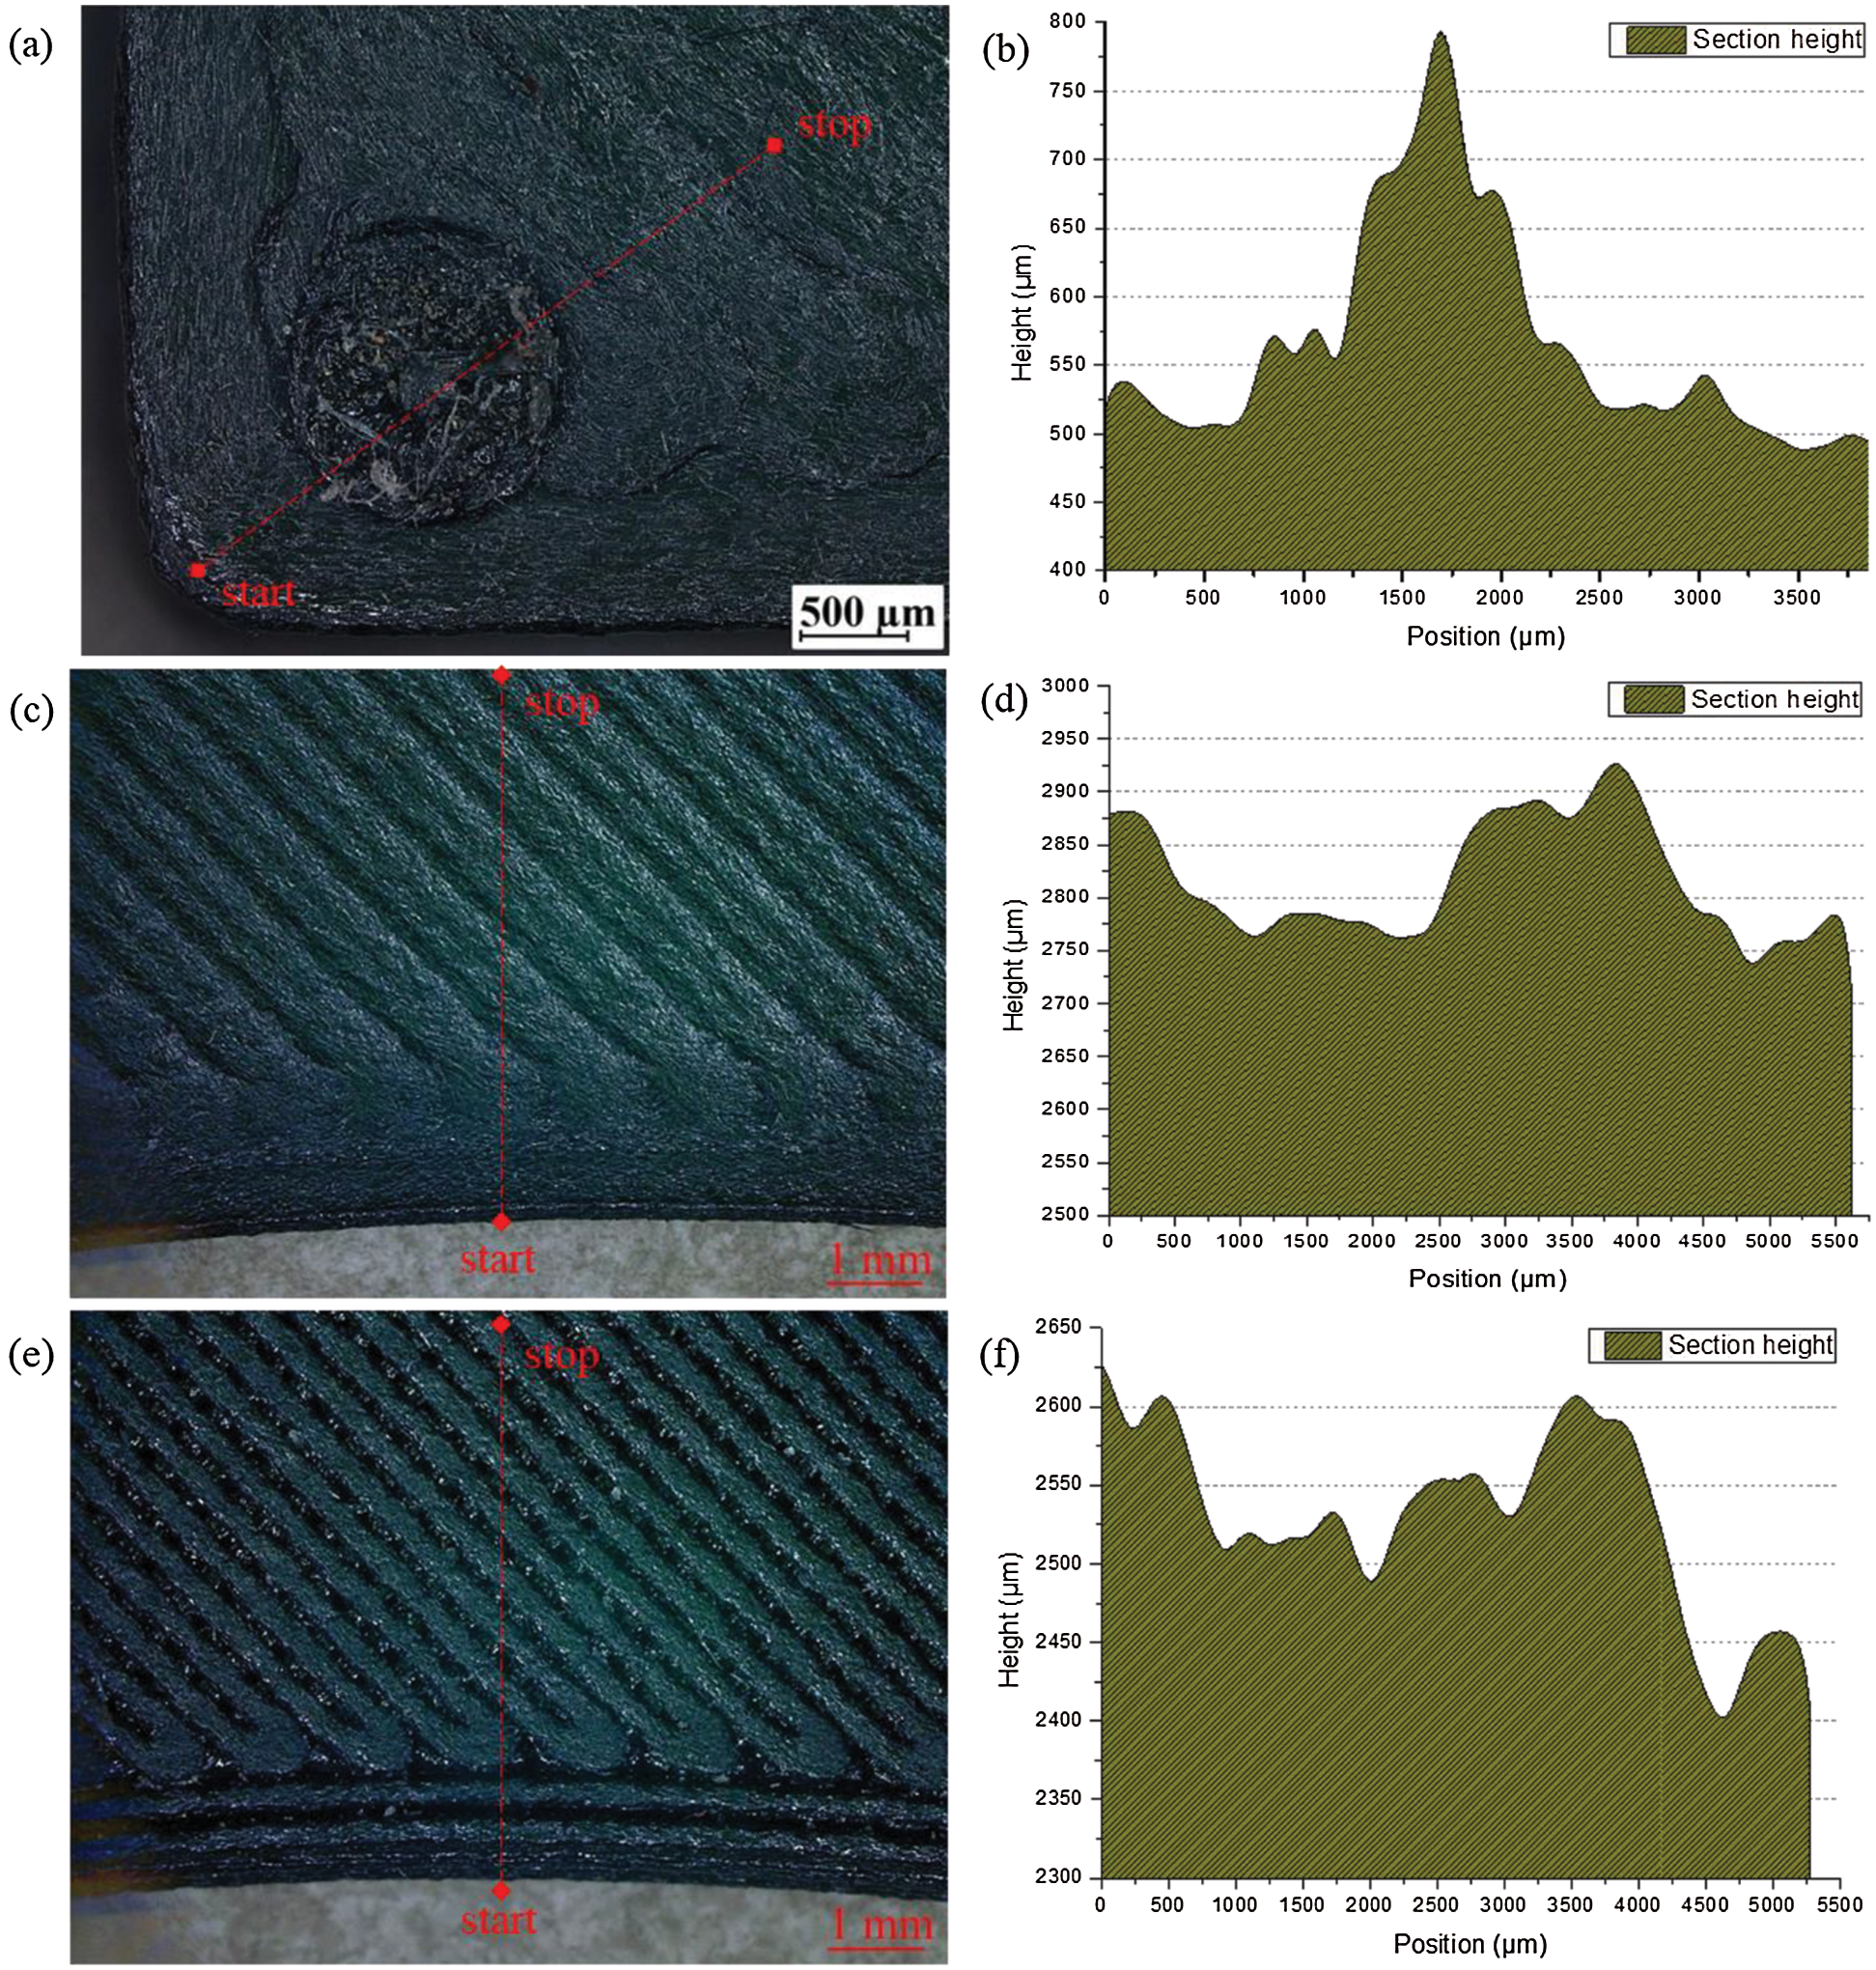
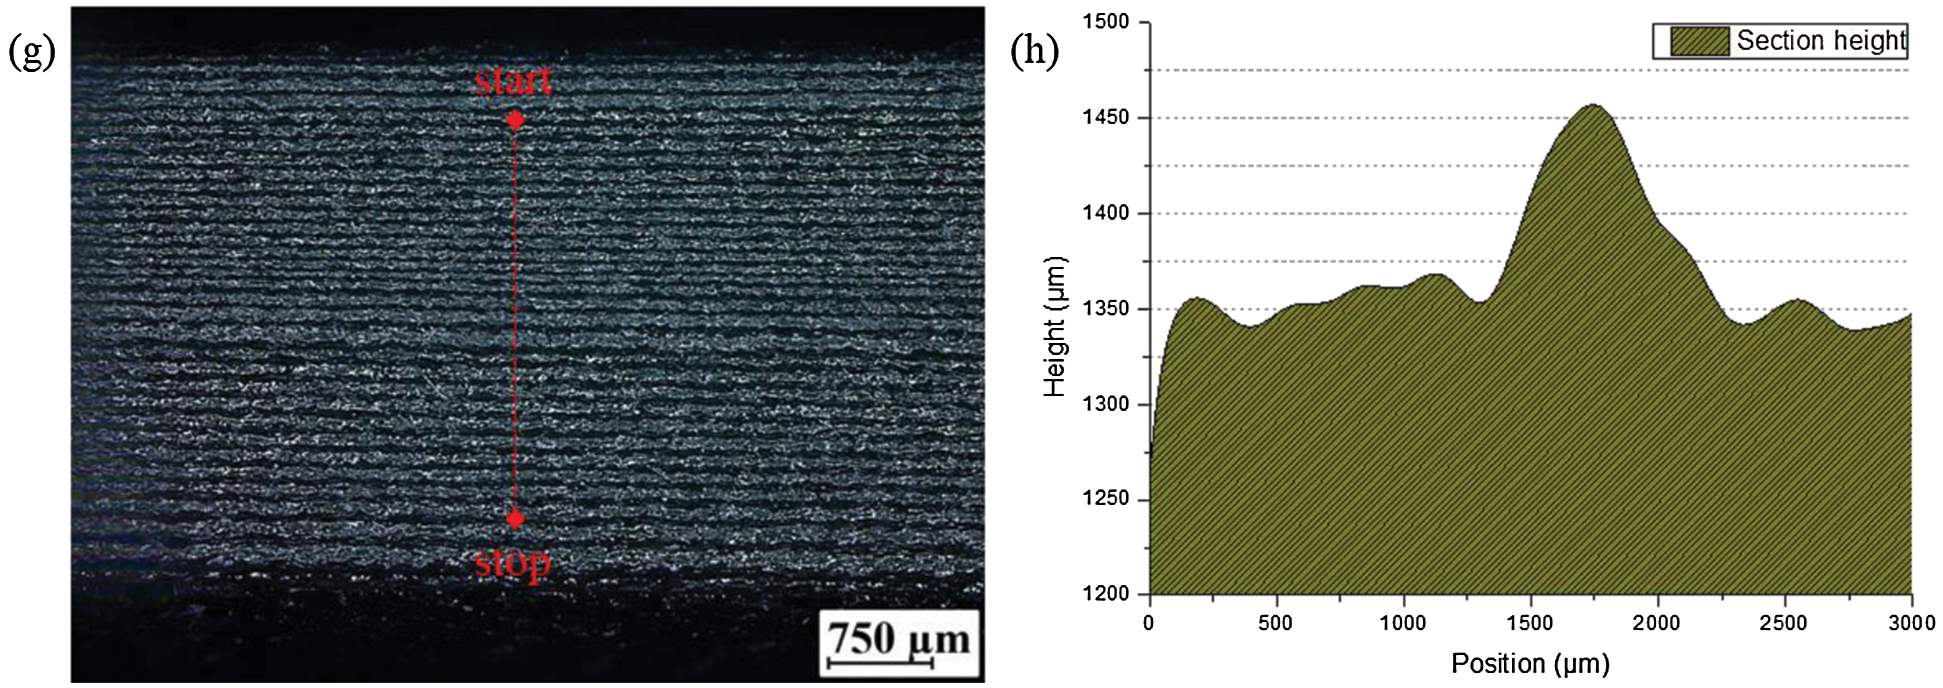
Figure 7: The partial morphology of the printed surfaces by LEICA DVM6: The enlarged partial morphology of the accumulation defects (a), front surface (c), back surface (e), side surface (g). The marked section height of the accumulation defects (b), front surface (d), back surface (f), side surface (h)
The area of accumulation defects was enlarged 200 times by the digital optical microscope in Fig. 7a. The cross-sectional height curve, the height thermal image and the 3D micro morphology of printed surface defects showed the distinct raised peak. And the extreme value of the section height difference and the standard deviation for the stacked peek area were up to 305.56 μm and 78.32 μm, respectively, which were much higher than those of front, back and side surfaces based on the statistic height data listed in Tab. S1 provided in the supporting material. That means accumulation defects obviously destroyed the flatness of the printed surface.
The front surface in Fig. 7c showed the printed path angle 45° and there were visible depressed defects between neighboring filled paths. Based on Figs. S1(c) and S1(d), the height of the edge was higher than that of the inner, and the surface height was decreasing from the edge to the inner, so as the back surface in Fig. 7e. From Tab. S1, the front and back surfaces had similar extreme value of the section height difference and the similar standard deviation, which means the fluctuations of the front and back surface height were similar. However, in the back surface, the gaps and depressed defects were more obvious than those of front surface. The possible reason should be the set of the first two thicker layer height at the start of printing process, in order to promoting bond between raw material and printing table.
The side surface in Fig. 7g showed obvious gap defects between layers. Besides, the dimension of CF reinforcement layer was apparent larger than that of the other Onyx layers. The possible reason should be that the continuous carbon fiber bundle hada certain degree of stiffness so the turning radius of filled path was larger. Note that the diameter and extrusion width of continuous carbon fiber bundle were about 0.5 mm and 0.9 mm respectively while those of Onyx matrix were about 1.75 mm and 0.4 mm. Based on Tab. S1, the extreme value of the section height difference and the standard deviation for the side surface were up to 245.97 μm and 63.88 μm, respectively, which were higher than those of front and back surfaces while lower than those of the accumulation defect area.
4.2 Printing Precision and Stability
To assess the printing precision and stability of 3D printer MarkTwo, two box plots of width and thickness dimensions were constructed shown in Fig. 8. It can be seen from Fig. 8a that the scattering of the width for all specimens varied quite a bit but all the widths were higher than the expected size 10 mm. Besides, the average width of pure Onyx specimens was almost higher than that of specimens with CF reinforcement. Simultaneously, the width fluctuating range of Onyx specimens was maximum while that of 4CF specimens was minimum. Note that in general, the width fluctuating range of specimens with CF reinforcement was smaller than that of specimens with pure Onyx resin matrix, and the width stability and accuracy of 4CF specimens were the best. Fig. 8b showed that the average thickness of all specimens was higher than the expected size 4 mm. The average thickness of Onyx specimens was maximum and the thickness fluctuating range of them was widest. Moreover, the average thickness of specimens with more reinforcement was closer to the expected size and the thickness fluctuating range of them was smaller generally. That meant the CF reinforcement could contribute to the dimensional stability and accuracy of width and thickness for 3D printed CFRTPCs.
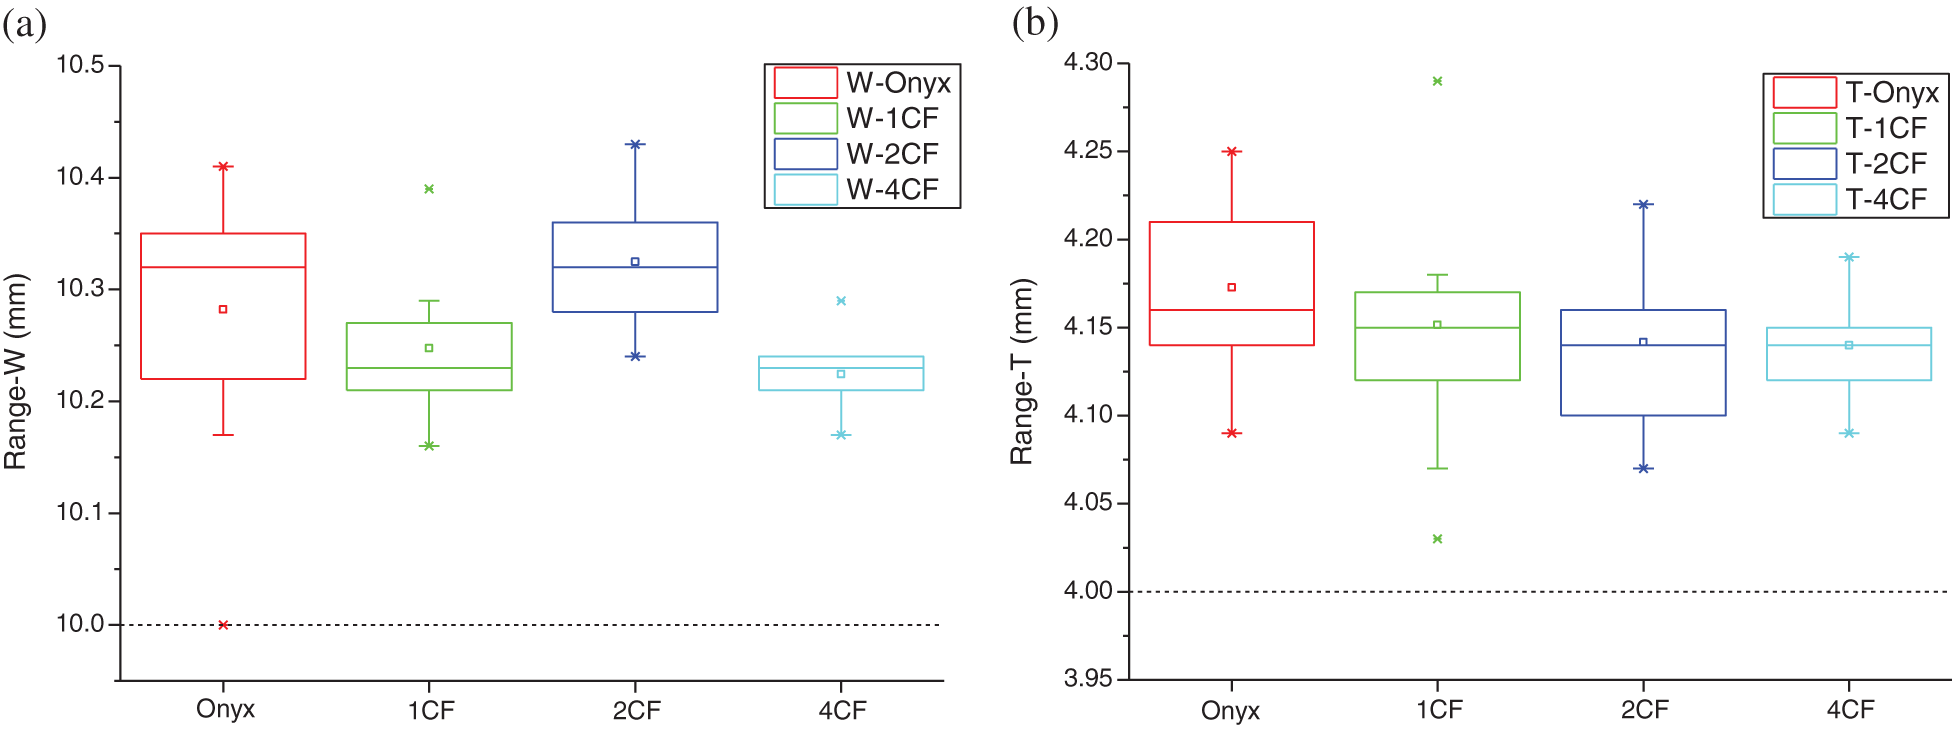
Figure 8: Box plots of sizes for printed specimens: (a) Box plot of the width W, (b) Box plot of the thickness T
The statistic data of width and thickness were counted in Tab. S2 provided in the supporting material, supporting the above analysis of Fig. 8. The main possible factors influencing the variations in the width and thickness dimensions could be the machine errors of 3D printer including under extrusion, uneven print bed, or improper fiber and plastic nozzle heights (bed leveling might be not precise) and the characteristics of the printed material itself including the material fluidity and adhesion and so on [33].
As for the weight precision of 3D printed CFRTPCs specimens, the average weight comparison results are shown in Fig. 9. From the design software of 3D printing called Eiger, the total mass (Eiger mass) and volumes of Onyx matrix and CF reinforcement were achieved automatically. Then the calculated total mass and respective mass of matrix and reinforcement were calculated by the density data from the MarkForged datasheet. Fig. 9 showed that the calculated mass and Eiger mass were obviously higher than the actual measured mass and the calculated mass was slightly higher than Eiger mass. The possible reason could be the void, crack and gap defects generated during the 3D printing process as mentioned in Section 4.1.
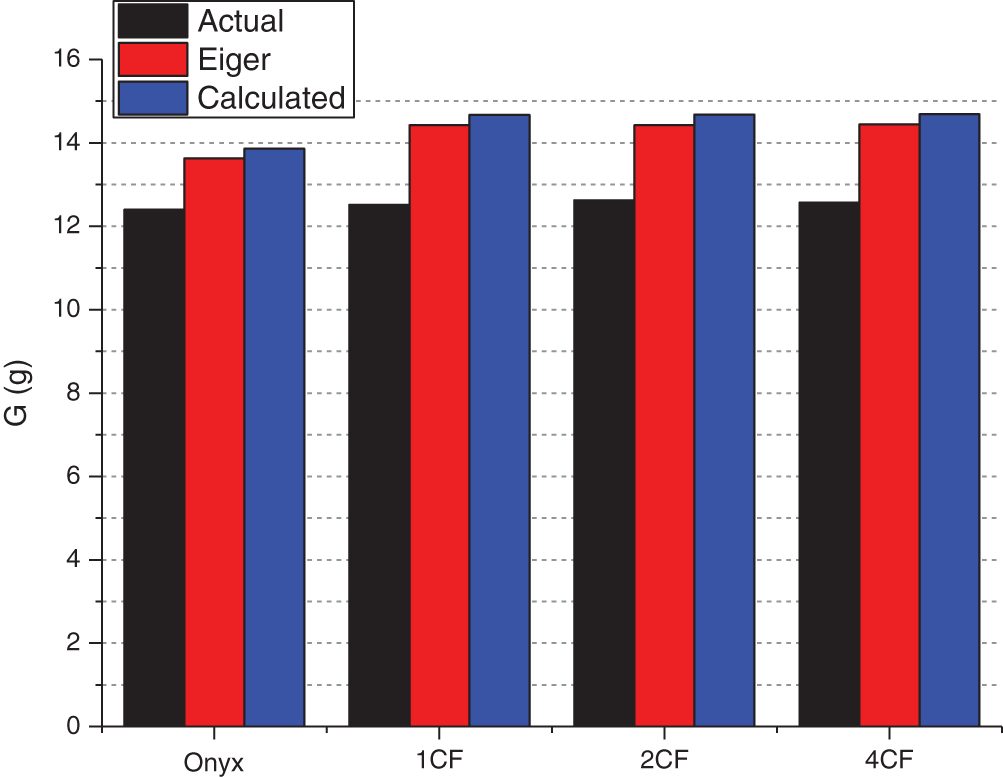
Figure 9: Mass values of actual measurement, Eiger display and calculated values
The absolute and relative errors between calculated mass, actual measured mass and Eiger mass are listed in Tab. S3 provided in the supporting material. The relative errors of actual measured mass for specimens with CF reinforcement were quite larger than those for specimens with pure Onyx. That meant the CF reinforcement could contribute to more defects reducing the weight accuracy of 3D printed CFRTPCs.
The resulting stress-strain diagrams for the four kinds of samples are shown in Fig. 10a and the elastic modulus (E, MPa), the strain at break (e, %) and the ultimate tensile strength (Rmmax, MPa) of the tensile test specimens are shown in Fig. 10b.
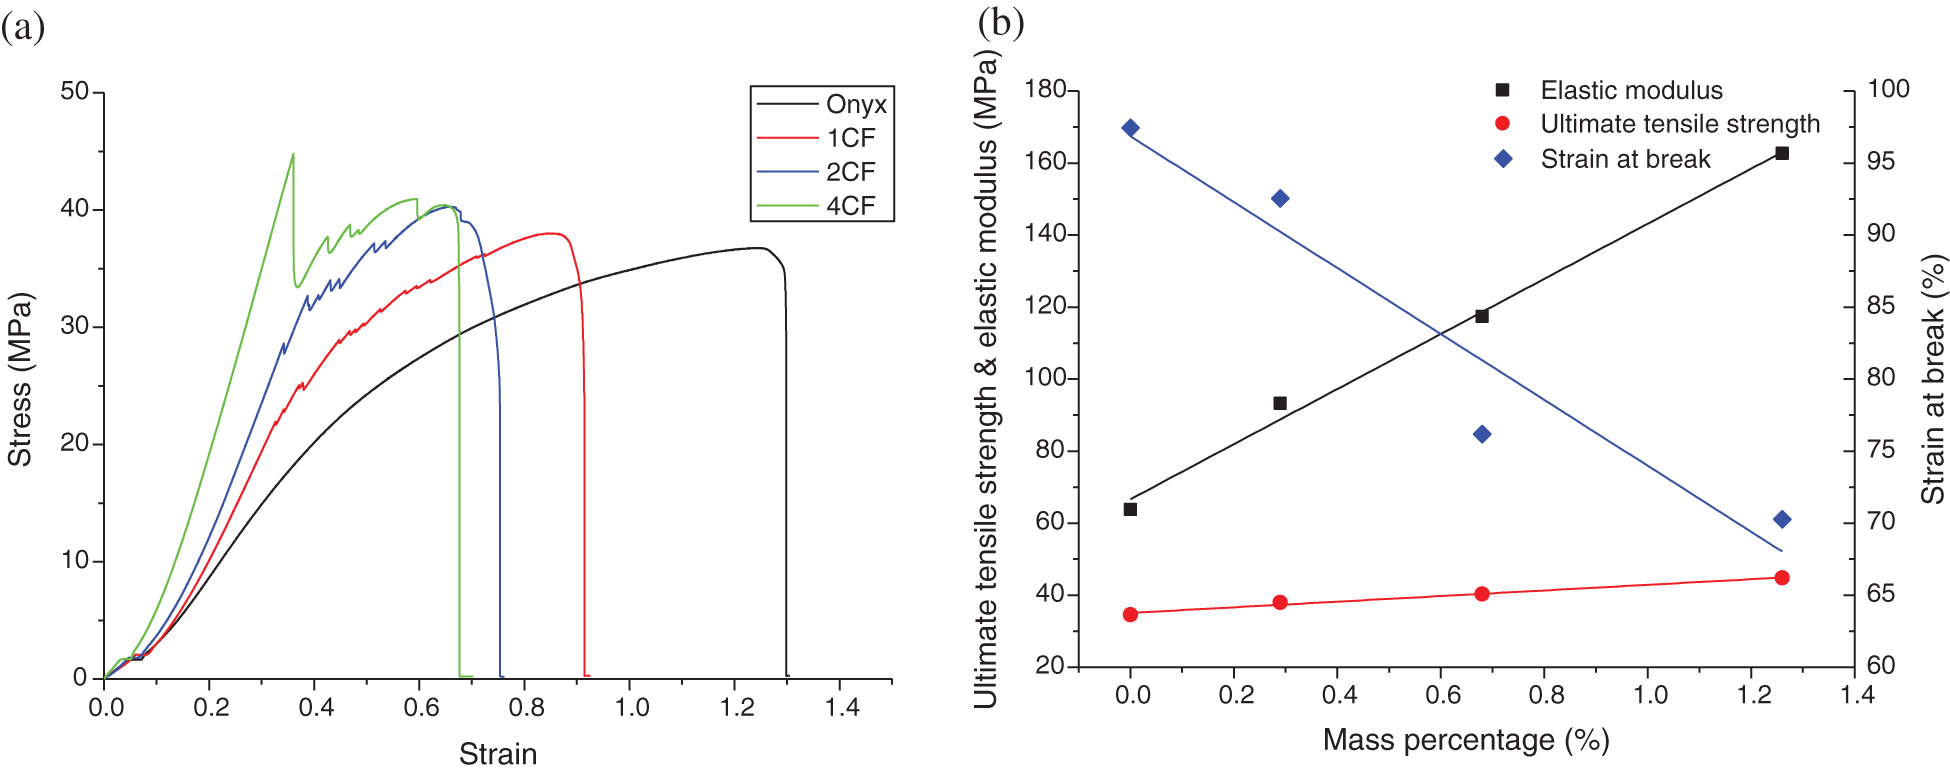
Figure 10: Results of monotonic tension tests: (a) Stress-strain curves, (b) Results and linear fitting curves of elastic modulus, strain at break and ultimate tensile strength
From Fig. 10a, it can be seen that there was a smooth transition between the stress-strain linear part and the nonlinear yield part of pure Onyx, without clear yield point. For samples with CF reinforcement, when the continuous fiber bundle began to break during the increase of strain, the stress dropped suddenly resulting in the sharp peek of stress-strain curve, and the remaining unbroken fibers and resin bore the tensile force. As more and more continuous carbon fiber fractured, the stress-strain curve appeared jittery peeks until the fracture occurred. The elastic modulus was calculated by the slope of stress-strain curves. Note that the initial parts of stress-strain curves were not accurate because of the pre-clamped errors of test machine. Therefore, the back part before yield part of stress-strain curve was more suitable for calculating accurate elastic modulus. This was the elastic modulus of the specimen as a whole.
From Fig. 10b, it can be seen that associations between the mass percentage of CF reinforcement and the averages of E, e, Rmmax were approximately linear. The linear fitting function is shown in Eq. (14), where y refers to E, e, Rmmax, and x refers to the mass percentage instead of volume percentage of CF reinforcement because the actual mass is convenient for weighing while the actual volume contains pore defects that are hard to be measured. The actual tensile performances and fitting errors of samples are listed in Tab. S4 provided in the supporting material.
The process of tension-tension fatigue test is shown in Fig. 11a. The specimens were clamped tightly by the up and down fixtures, and liquid oil driving fixtures provided horizontal pressure to clamp both ends of the sample. The upper clamp remained stationary, and the lower clamp reciprocated up and down to provide sin-cosine tension. After many cycles of sin-cosine tension, as shown in Fig. 11b, the middle narrow part of the sample was depressed, turning white and shiny because of the stress concentration. The front and side sample diagrams of strain are shown in Figs. 11c and 11d. It can be seen that the tensile force in the vertical direction caused the elongated deformation in the length direction and the compressed deformation in the thickness direction. The deformation area was mainly concentrated in the middle narrow area, and generally small depressions and deformations occurred at concentrated stress points first, then large depressions and deformations along the printing path were deformed. As the number of tensile fatigue cycles increased, the dent deformation at the edge of narrow area in the middle of the sample, gradually increased until a tearing gap appeared, and then it continued to tear along the printing path until the specimen completely broke and failed.
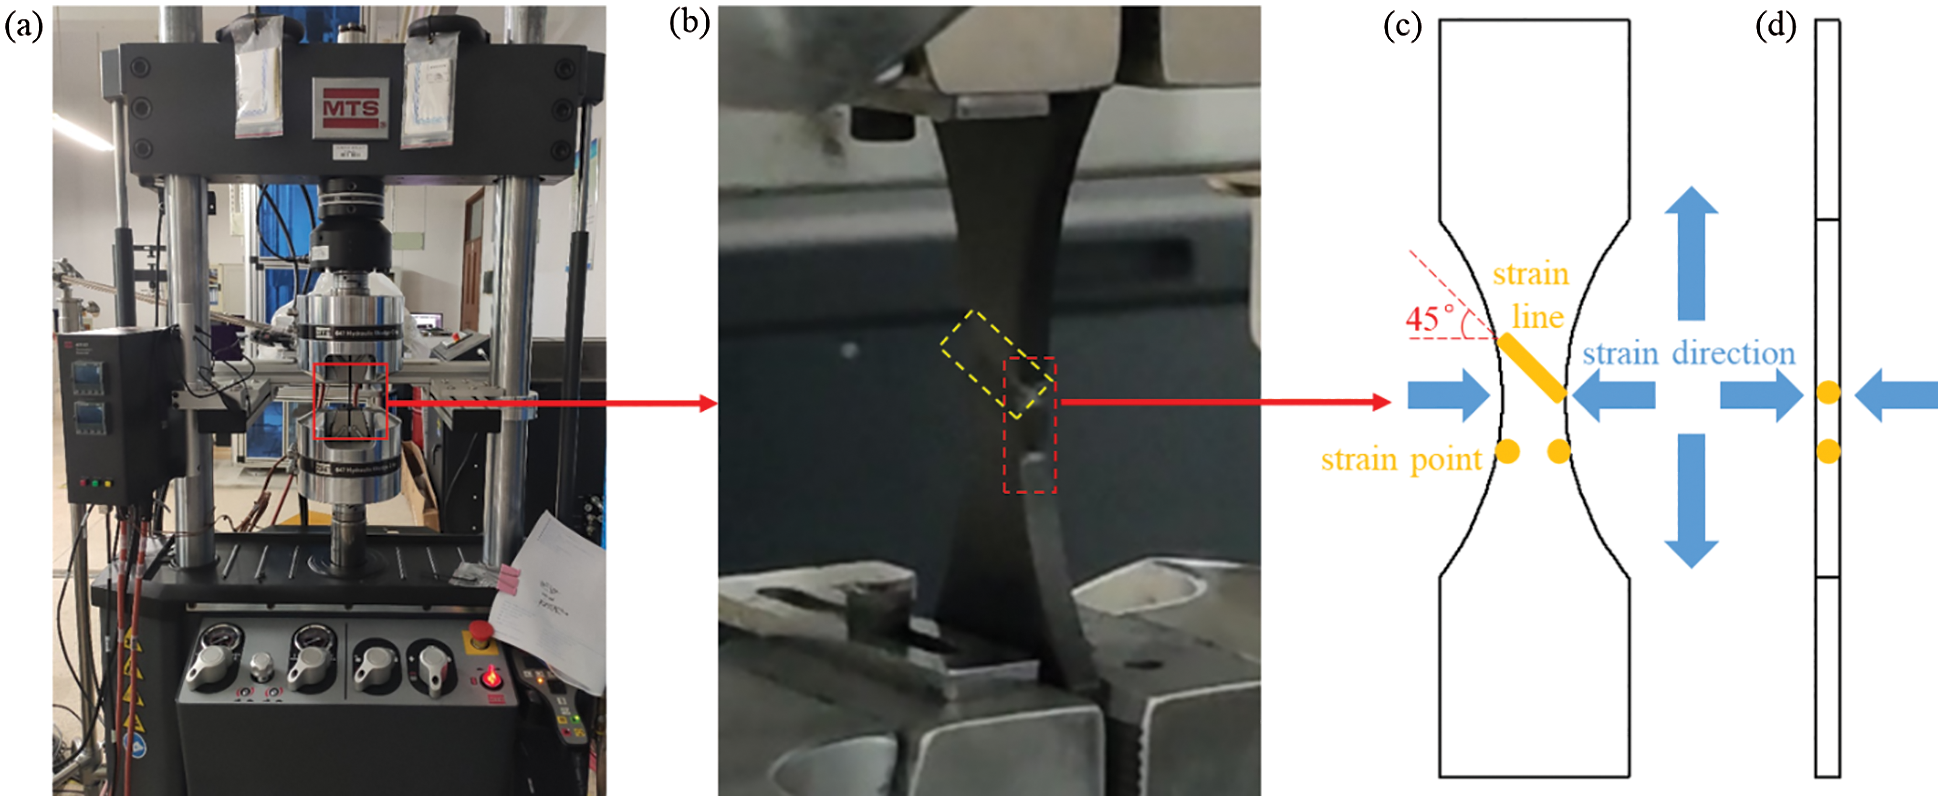
Figure 11: (a) Fatigue test process with MTS Landmark 370.10, (b) Partial enlarged view of sample clamped by the fixture, (c) The front view of stress and strain, (d) The side view of stress and strain
According to the tension-tension fatigue fracture results shown in Fig. 12, the break locations of pure Onyx and CF reinforced composites with concentric CF rings in the middle layer, were almost similar in the middle of specimens, meeting the ideal experimental results. Moreover, the breaking direction was basically along the printing path direction. It need to be noted that the fracture surfaces of 1CF and 4CF were relatively flat. The possible reason should be that the path angles of neighboring layers were mutually perpendicular with ±45°, resulting in a certain degree of isotropy for the printed samples. Note that the large and small fiber bundles and single fiber filament were broken and pulled out. From Fig. 12b, the side of the broken sample showed that the stress concentration area had obvious concave deformation in the thickness direction.
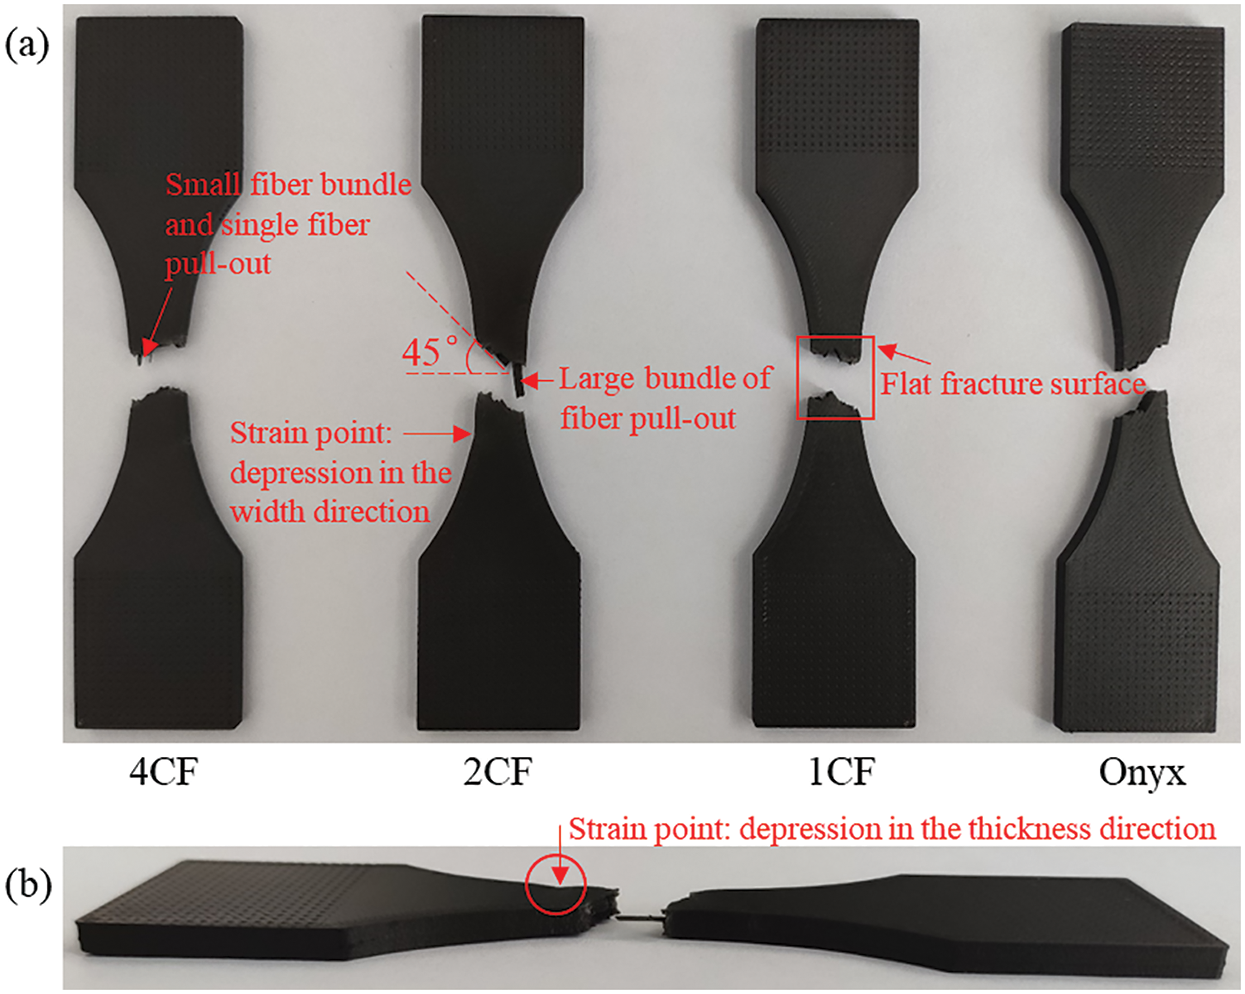
Figure 12: The fracture results of tension-tension fatigue: (a) The front view of fracture samples, (b) The side view of fracture samples
Fatigue testing was performed on four kinds of sample configurations (Onyx, 1CF, 2CF, 4CF) to examine the effect of CF reinforcement on the fatigue resistance. The resulting diagram of stress levels and fatigue lives for the four kinds of samples is shown in Fig. 13a. Under different sine and cosine tensile stress levels (the ordinate), the cycle number taking logarithm for the abscissa was fit by B-spline curve.
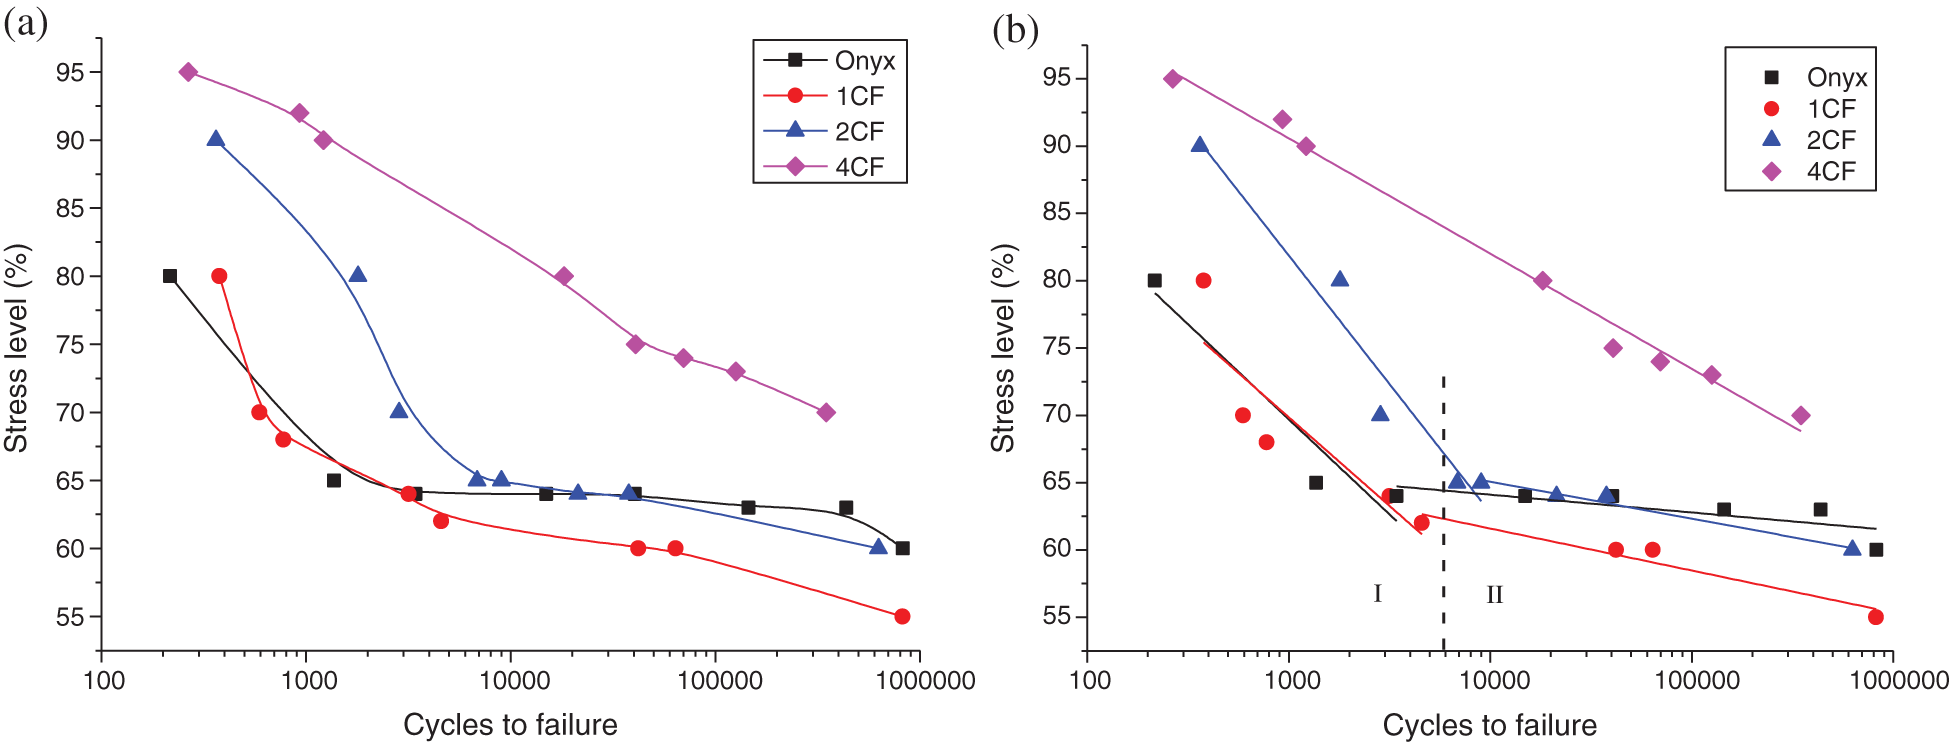
Figure 13: (a) The B-spline curves of stress level and cycles to failure, (b) The linear fitting curves of stress level and cycles to failure
The curve trends in Fig. 13 were similar that the number of cycles to failure increased with the stress level decreasing. Besides, the fatigue life trends of pure Onyx, 1CF and 2CF were closer. During the first half of cycle number close to 10,000, the stress level dropped rapidly while during the second half of fatigue cycles beyond 10,000, the stress level decreased slowly. Note that the curve trends of Onyx, 1CF and 2CF were closely linear during the two ranges of fatigue life. In addition, there was a good linear relationship between the stress level of 4CF and the logarithm value of the cycle number. Therefore, the relationships between stress levels of Onyx, 1CF, 2CF and the logarithm value of fatigue life were fitted with two-stage linear functions while single-stage linear function for that of 4CF, shown in Fig. 13b. The linear fitting function is shown in Eq. (15), where P referred to the stress level and x referred to the fatigue cycles to failure, and the fitting parameters are listed in Tab. S5 provided in the supporting material.
As shown in Fig. 13, the fatigue resistance of 4CF was best while that of 2CF was better than that of 1CF under the same stress level. Under the same fatigue life condition, the required stress levels for 4CF, 2CF and 1CF were decreasing. Note that the fatigue resistance of 1CF was not entirely better than that of Onyx, even in the life range beyond 10,000, the stress level that 1CF could withstand was lower than that of Onyx at the same fatigue life. Although the fatigue resistance of 2CF was significantly better than that of Onyx in the life range less than 10,000, it was not completely better than that of Onyx in the life range beyond 10,000. The main reason affecting the fatigue resistance was the volume content of CF reinforcement. However, when the volume fraction of CF reinforcement was not more than 0.57% (2CF), the continuous carbon fiber played a major role in enhancing fatigue life within the life range less than 10,000; when the fatigue life was beyond 10,000, defects such as pores caused by CF reinforcement reduced the fatigue life enhancement effect of CF reinforcement. With the increase volume of CF reinforcement, continuous carbon fibers bore the most tension-tension load and the fatigue life enhancement effect of CF was greater than the weakening effect of pore defects caused by CF reinforcement.
The curve trend of Fig. 13 met the process of fatigue test as mentioned in Section 3.1. Under the condition that the volume fraction of CF reinforcement was less than 1.06% (4CF), the matrix tended to fracture quickly when the stress level was high, resulting in the quick fatigue process including interface debonding, delamination and fiber fracture, and finally the specimen failed rapidly with lower fatigue life; when the stress level was low, the matrix could be stressed for a long time instead of rapid failure, which means the matrix had a certain protective effect on the interface, printed layer and fiber, thereby delaying fatigue fracture failure.
The fitting parameters of the mathematical model describing the relationship between stress level and fatigue life are listed in Tab. S5 provided in the supporting material. The slopes of the first stage for Onyx, 1CF and 2CF were smaller than those of the second stage while the intercepts of the first stage were larger than those of the second stage. That means the change of stress level in the higher stage had less influence on the fatigue life than the change of stress level in the lower stage. Besides, the standard errors of fitting parameters for the first stage of Onyx, 1CF and 2CF were far larger than those for the second stage, meaning that the linearity of the second stage was better than that of the first stage. It need to be noted that the standard errors of fitting parameters for 4CF were relatively low, meaning the 4CF sample could have a good linear relationship between the stress level and the logarithm value of fatigue life.
Note that the curve of 4CF is the only one with no obvious turning point, which is not strictly in line with the fatigue failure process of composites mentioned in Section 3.2. The possible reason could be that the fiber content of the 4CF specimen was highest so that the continuous fiber reinforcement bore the most tension-tension load, slowing down the process of matrix cracking. Therefore, the curve of 4CF in Fig. 13 shows more linear characteristics of the CF reinforcement with no obvious turning point.
In the process of tension-tension fatigue test, the maximum (upper scatters) and minimum (lower scatters) of deformation and tension for Onyx, 1CF, 2CF, 4CF samples under two different stress levels are shown in Fig. 14. It demonstrated that the extreme values of tension were very stable, except for sudden changes at the beginning and end of fatigue life. Besides, it also showed that for the same specimens, the deformation of sample under higher stress level had a larger range of continuous growth, while that under lower stress level remained stable over a long range of fatigue life with little slow growth, except for sudden changes at the beginning and end of fatigue life. Moreover, with the increase content of CF reinforcement, the range of deformation was decreasing on the whole. Therefore, the main factors affecting sample deformation might be the reinforcement content and stress level. When the CF reinforcement bore the main stress, the deformation was small; when the stress level exceeded the CF bearing range, the deformation became larger. Additionally, under a lower stress level, the deformation of sample remained relatively stable in a longer life span. And with the increase content of CF reinforcement, the life span where the deformation remained relatively stable was increasing. Note that in Fig. 14f, the deformation curve had obvious jumping points, where the continuous carbon fibers started to break so the load exceeded the CF bearing range and the deformation suddenly increased. And when the load exceeded the CF bearing range too much, the fiber bundle broke completely in short time and the specimen started to fracture rapidly, as shown in Fig. 14h.
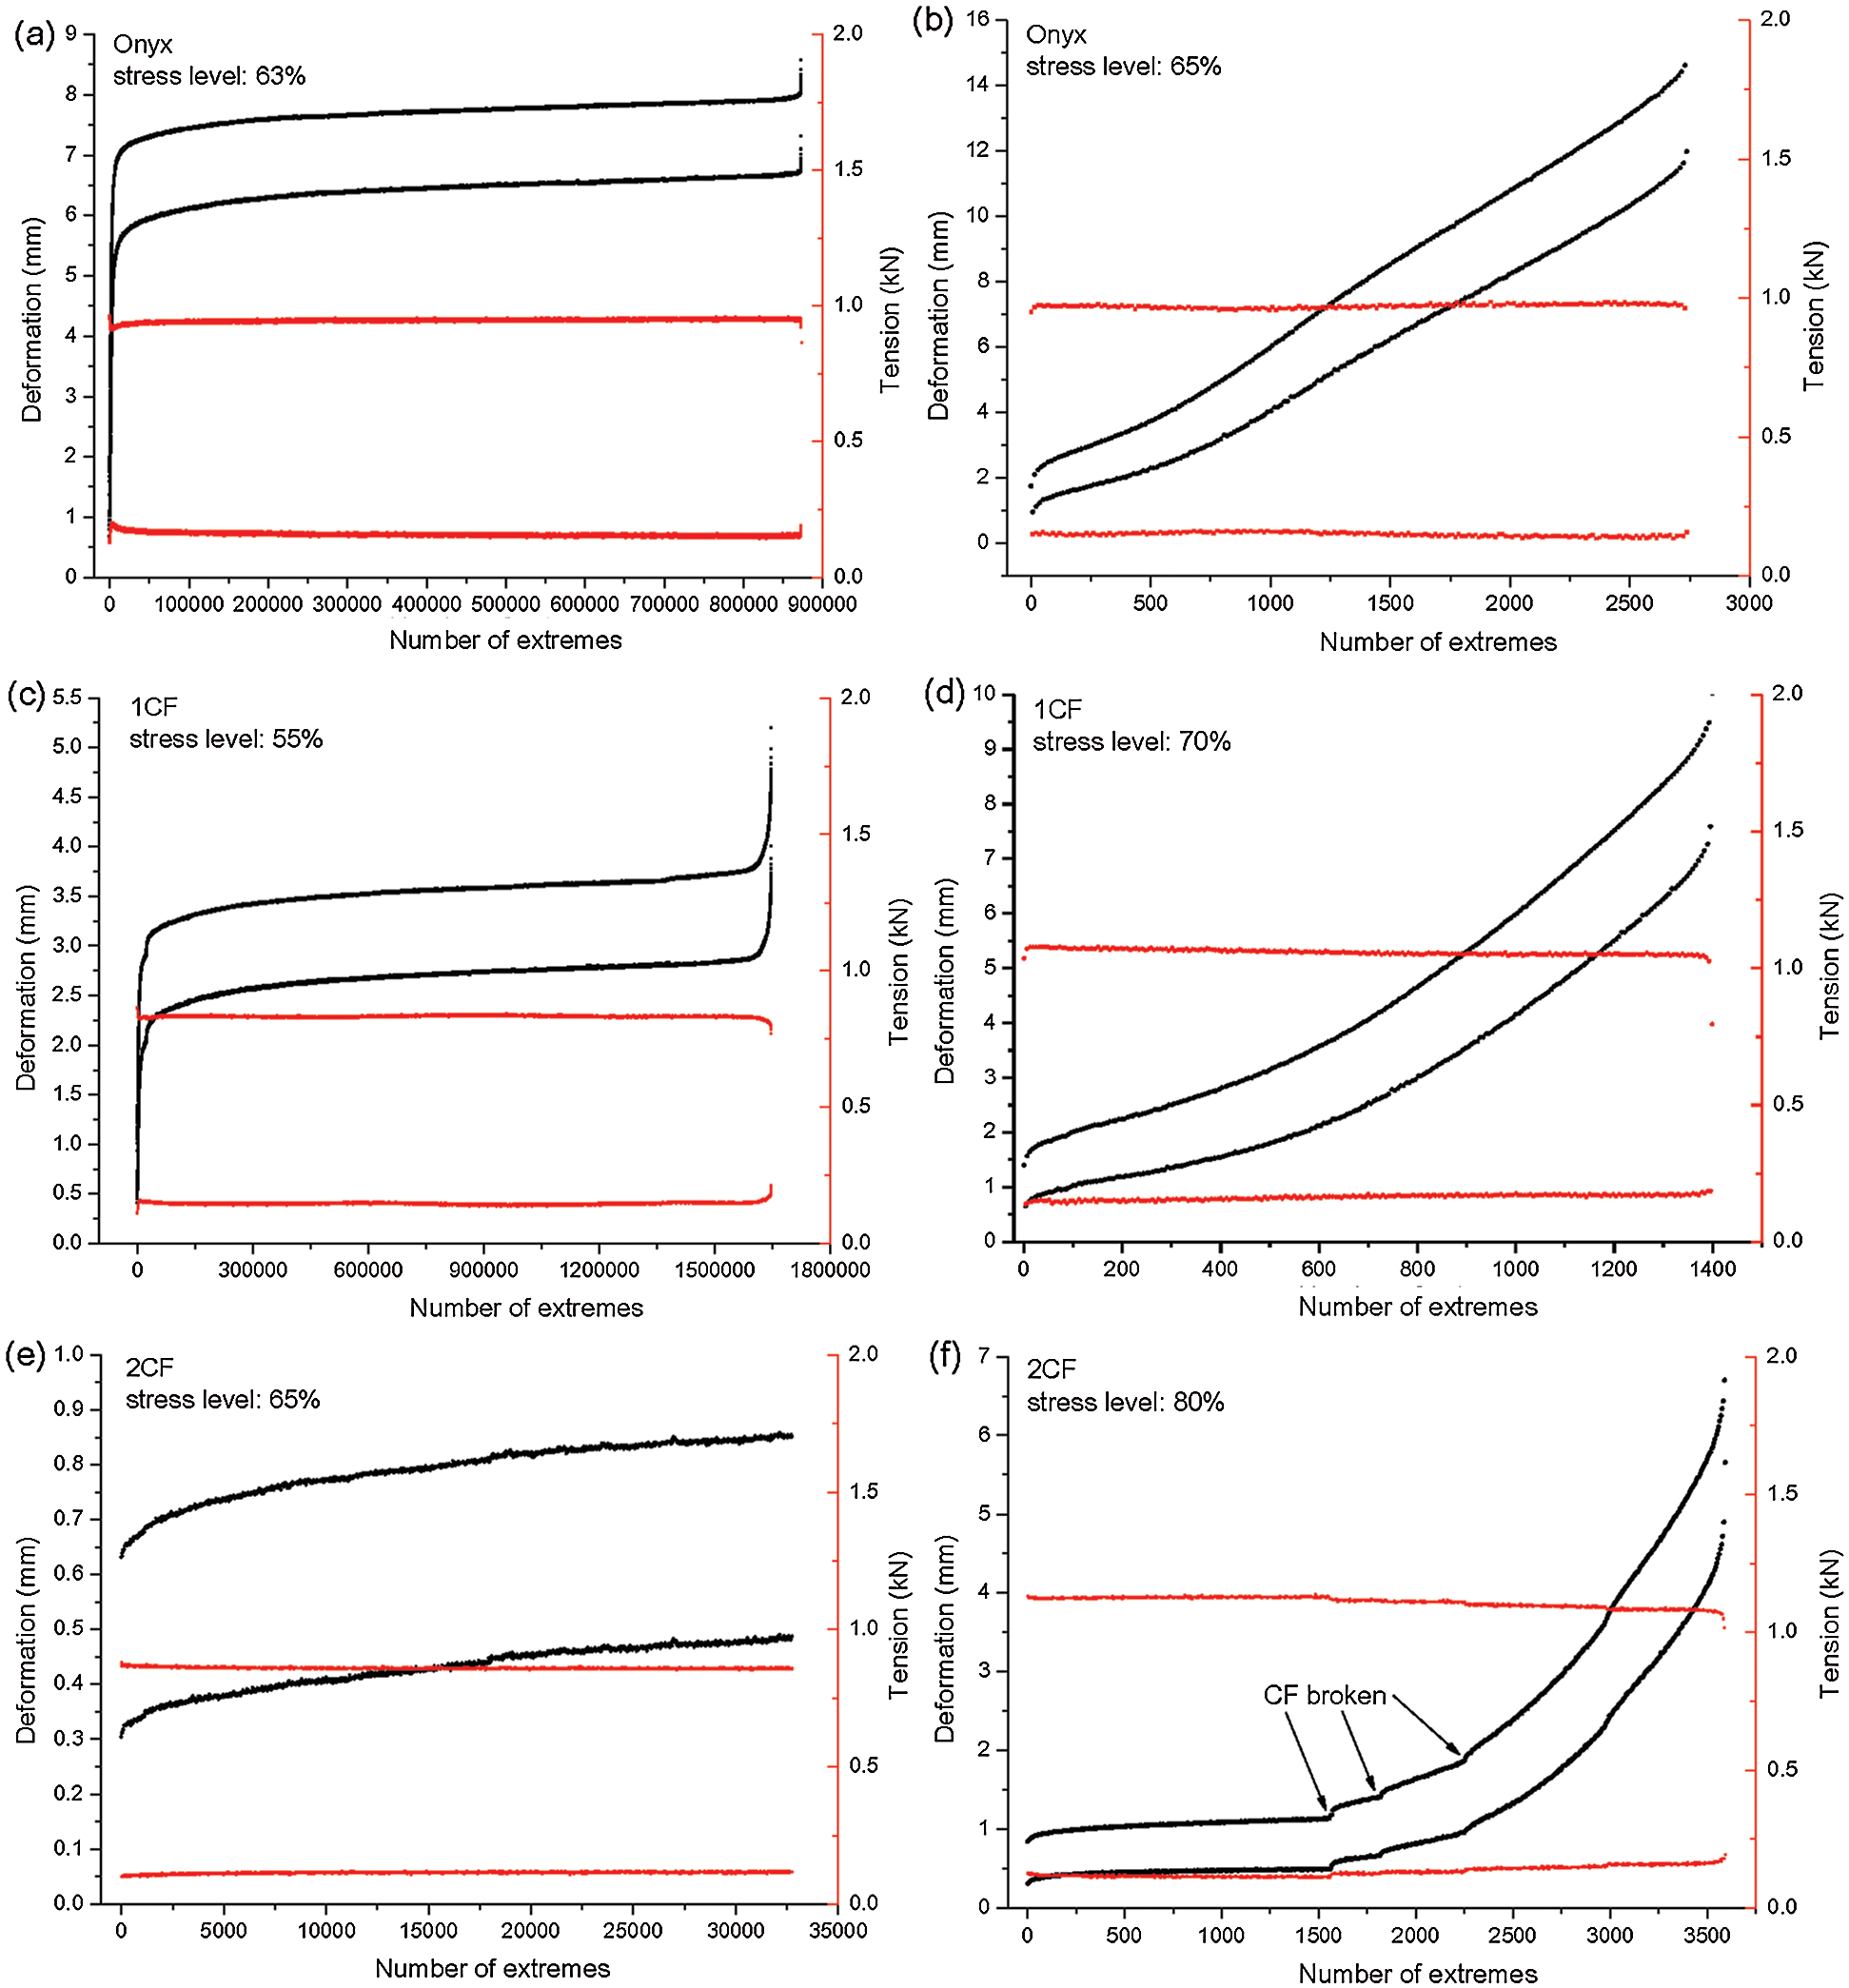
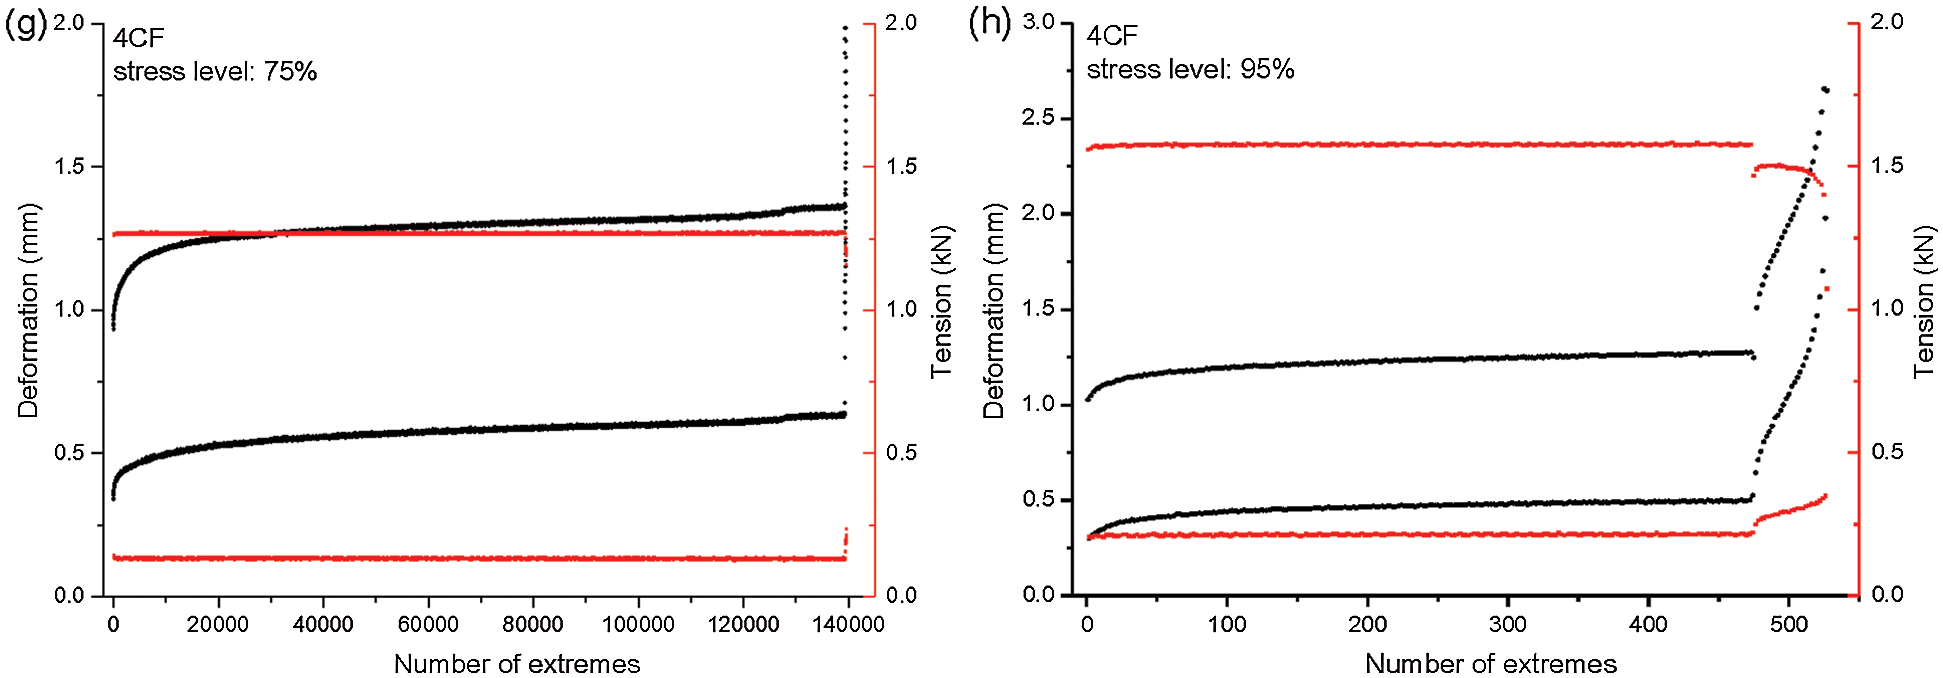
Figure 14: The deformatio ns and tensions under different stress levels for Onyx, 1CF, 2CF, 4CF: (a) 63% stress level for Onyx, (b) 65% stress level for Onyx, (c) 55% stress level for 1CF, (d) 70% stress level for 1CF, (e) 65% stress level for 2CF, (f) 80% stress level for 2CF, (g) 75% stress level for 4CF, (h) 95% stress level for 4CF
The statistic data of the extreme values for the sample deformation and tensile force are listed in Tab. S6 to Tab. S9 provided in the supporting material, supporting the above analysis of Fig. 14. Note that the standard deviation and dispersion coefficient of tensile force were much smaller than those of deformation, meaning that the extreme values of tensile force in the tension-tension fatigue test was far more stable than those of deformation. And the specimen under higher stress level had much larger standard deviation and dispersion coefficient of deformation than those of the specimen under lower stress level, meaning that the fluctuation of deformation increased with the increasing stress level.
The analysis of micro morphology for the 3D printed CFRTPCs specimens was performed to help understand the failure mechanism of tension-tension fatigue and the quality of printed surface. Micro morphology pictures taken by the LEICA digital optical microscope DVM6 are shown in Fig. 15 to analyze the fatigue failure mechanism and the surface quality of the 3D printed sample. The inner design of the printed sample used for the analysis of micro morphology was the 4CF to present more representative characteristics of the 3D printed CFRTPCs. As shown in Fig. 15a, the images taken at magnifications of 150 times showed the fatigue fracture section, including large and small bundles of carbon fibers and some single fibers extracted from matrix. The possible reason could be that the fiber bundle was pre-impregnated incompletely by matrix, leading to bad interfacial adhesion between the matrix and small fiber bundles and/or single fibers. Besides, the partial fracture location of the large fiber bundle could be in the interior of the sample, resulting in the small fiber bundles and single fibers decomposing from the large fiber bundle extracted from the matrix by the tensile load.
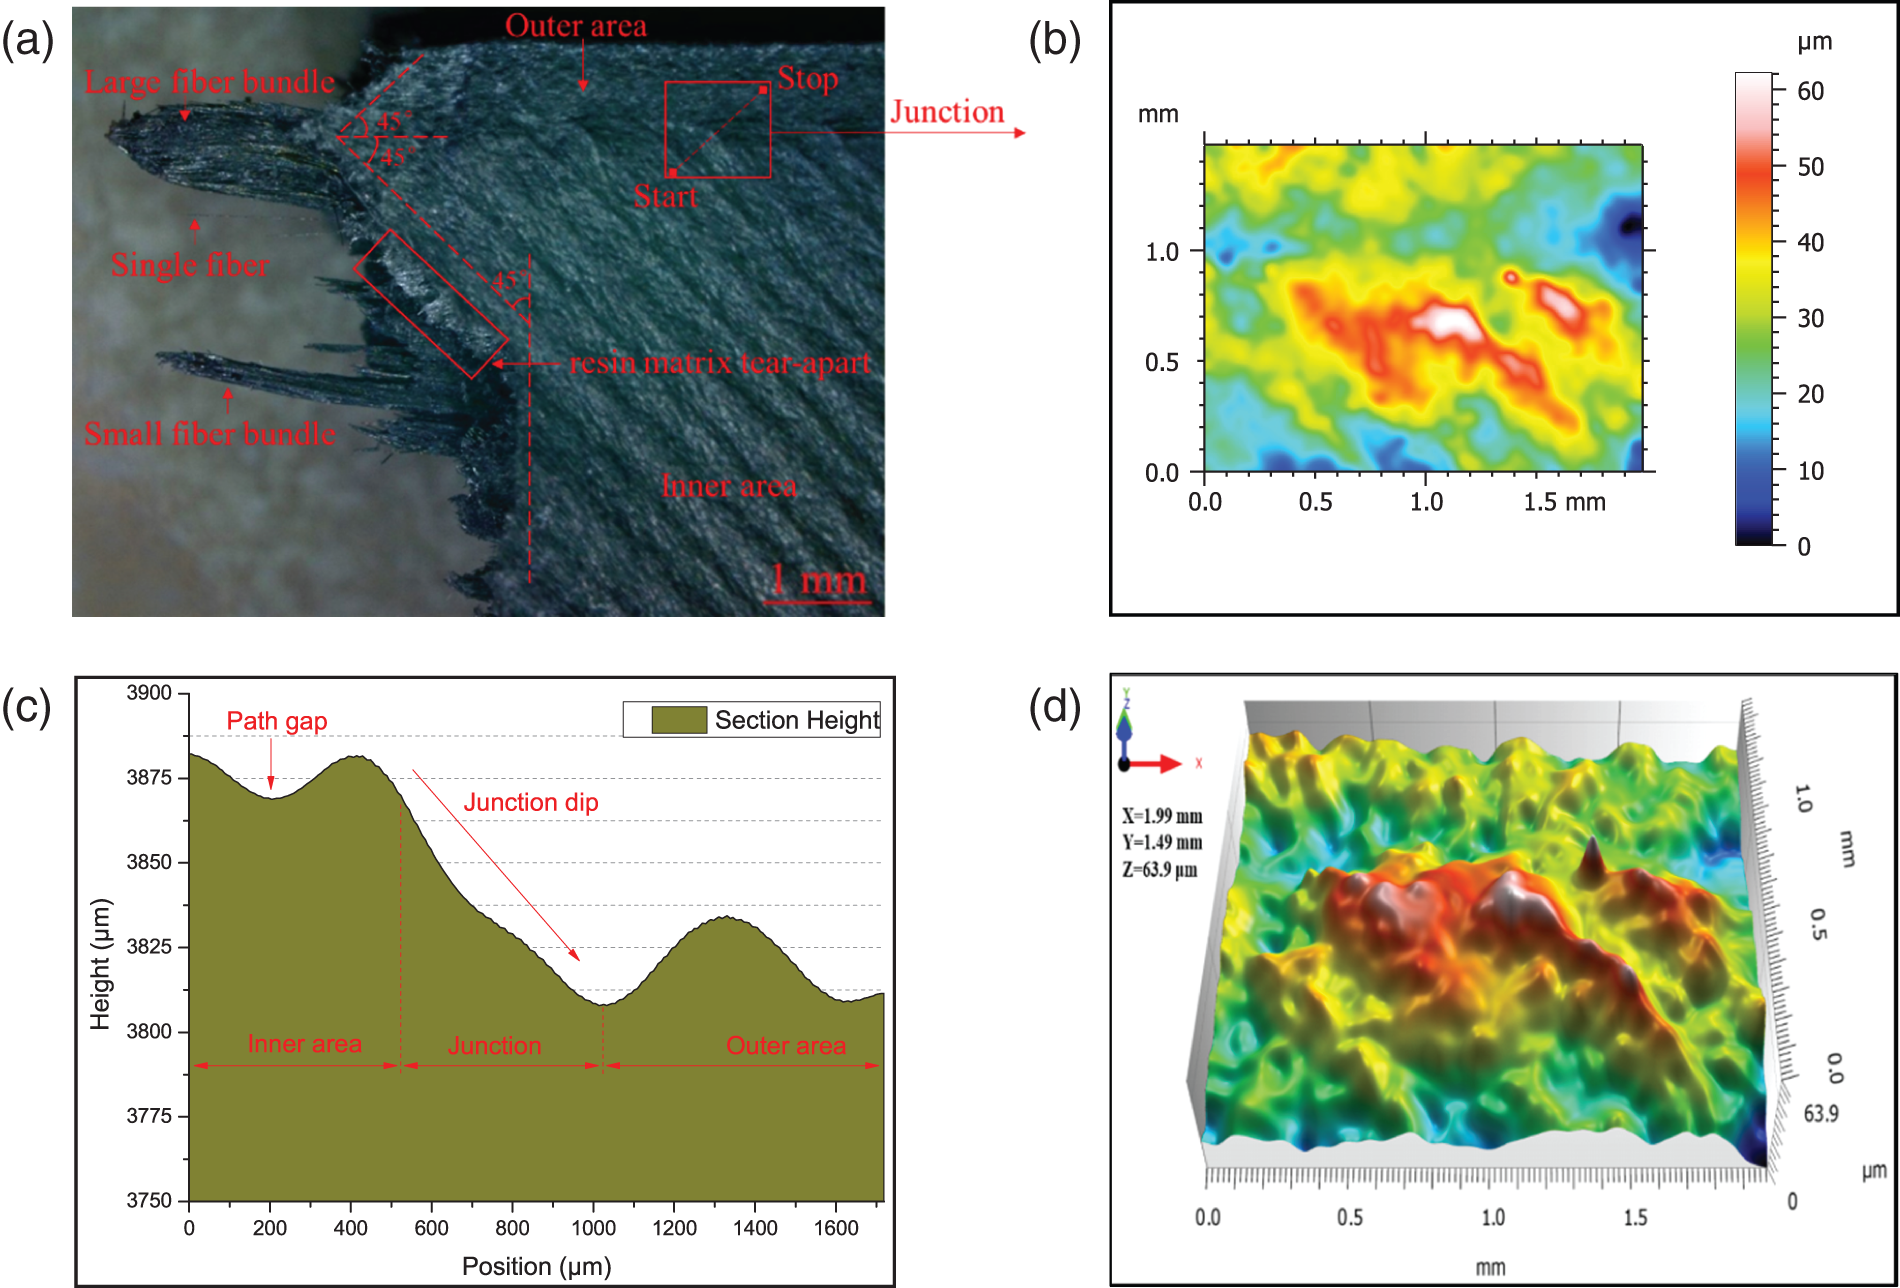
Figure 15: The CFRTPCs specimen with fatigue fracture failure: (a) The fracture section of tested sample at a magnification of 100 times, (b) The height of the cross section marked in (a), (c) The height thermal image of the junction, (d) The 3D micro morphology of the junction
In addition, the angles of fracture section for resin matrix included ±45° and 90°, because the angles of printing paths for two adjacent layers were 45° and −45° respectively, resulting in a certain degree of isotropy for the printed specimens. Moreover, the fracture sections of ±45° were mostly located at the concave defect between printing paths, where the stress was easy to concentrate and the mechanical properties were poor.
As shown in Fig. 15a, the surface of sample was divided into two areas. The outer area was generally flat and filled with concentric offset paths. The inner area was filled with the zigzag paths, between which there were obvious dent defects. The cross-sectional height, height heat map and three-dimensional topography of the junction between outer and inner regions are shown in Figs. 15b–15d. It can be seen that the height of the inner area with zigzag paths was higher than that of the outer area with concentric offset paths. Note that the areas between inner filling paths, between outer and inner areas, had obvious sunken gaps, which could be an important factor accelerating the process of the fatigue fracture failure.
The microstructure of the 3D printed CFRTPCs specimens was examined using a digital camera equipped with an optical microscope to show the deformation where concentrating most of the stress for tension-tension fatigue. Generally, there were multiple areas with tensile stress concentration for fatigue tested specimens, among which the area with large deformation, stress concentration, and the weakest strength would fracture and fail first. Below, Fig. 16 shows a sampling of images with front and side views, and the thermal height image and the 3D micro morphology of the front and side surfaces are provided in the supporting material as Fig. S2. The area shown in Fig. 16 had a certain stress concentration and deformation, which was close to the fatigue fracture position.
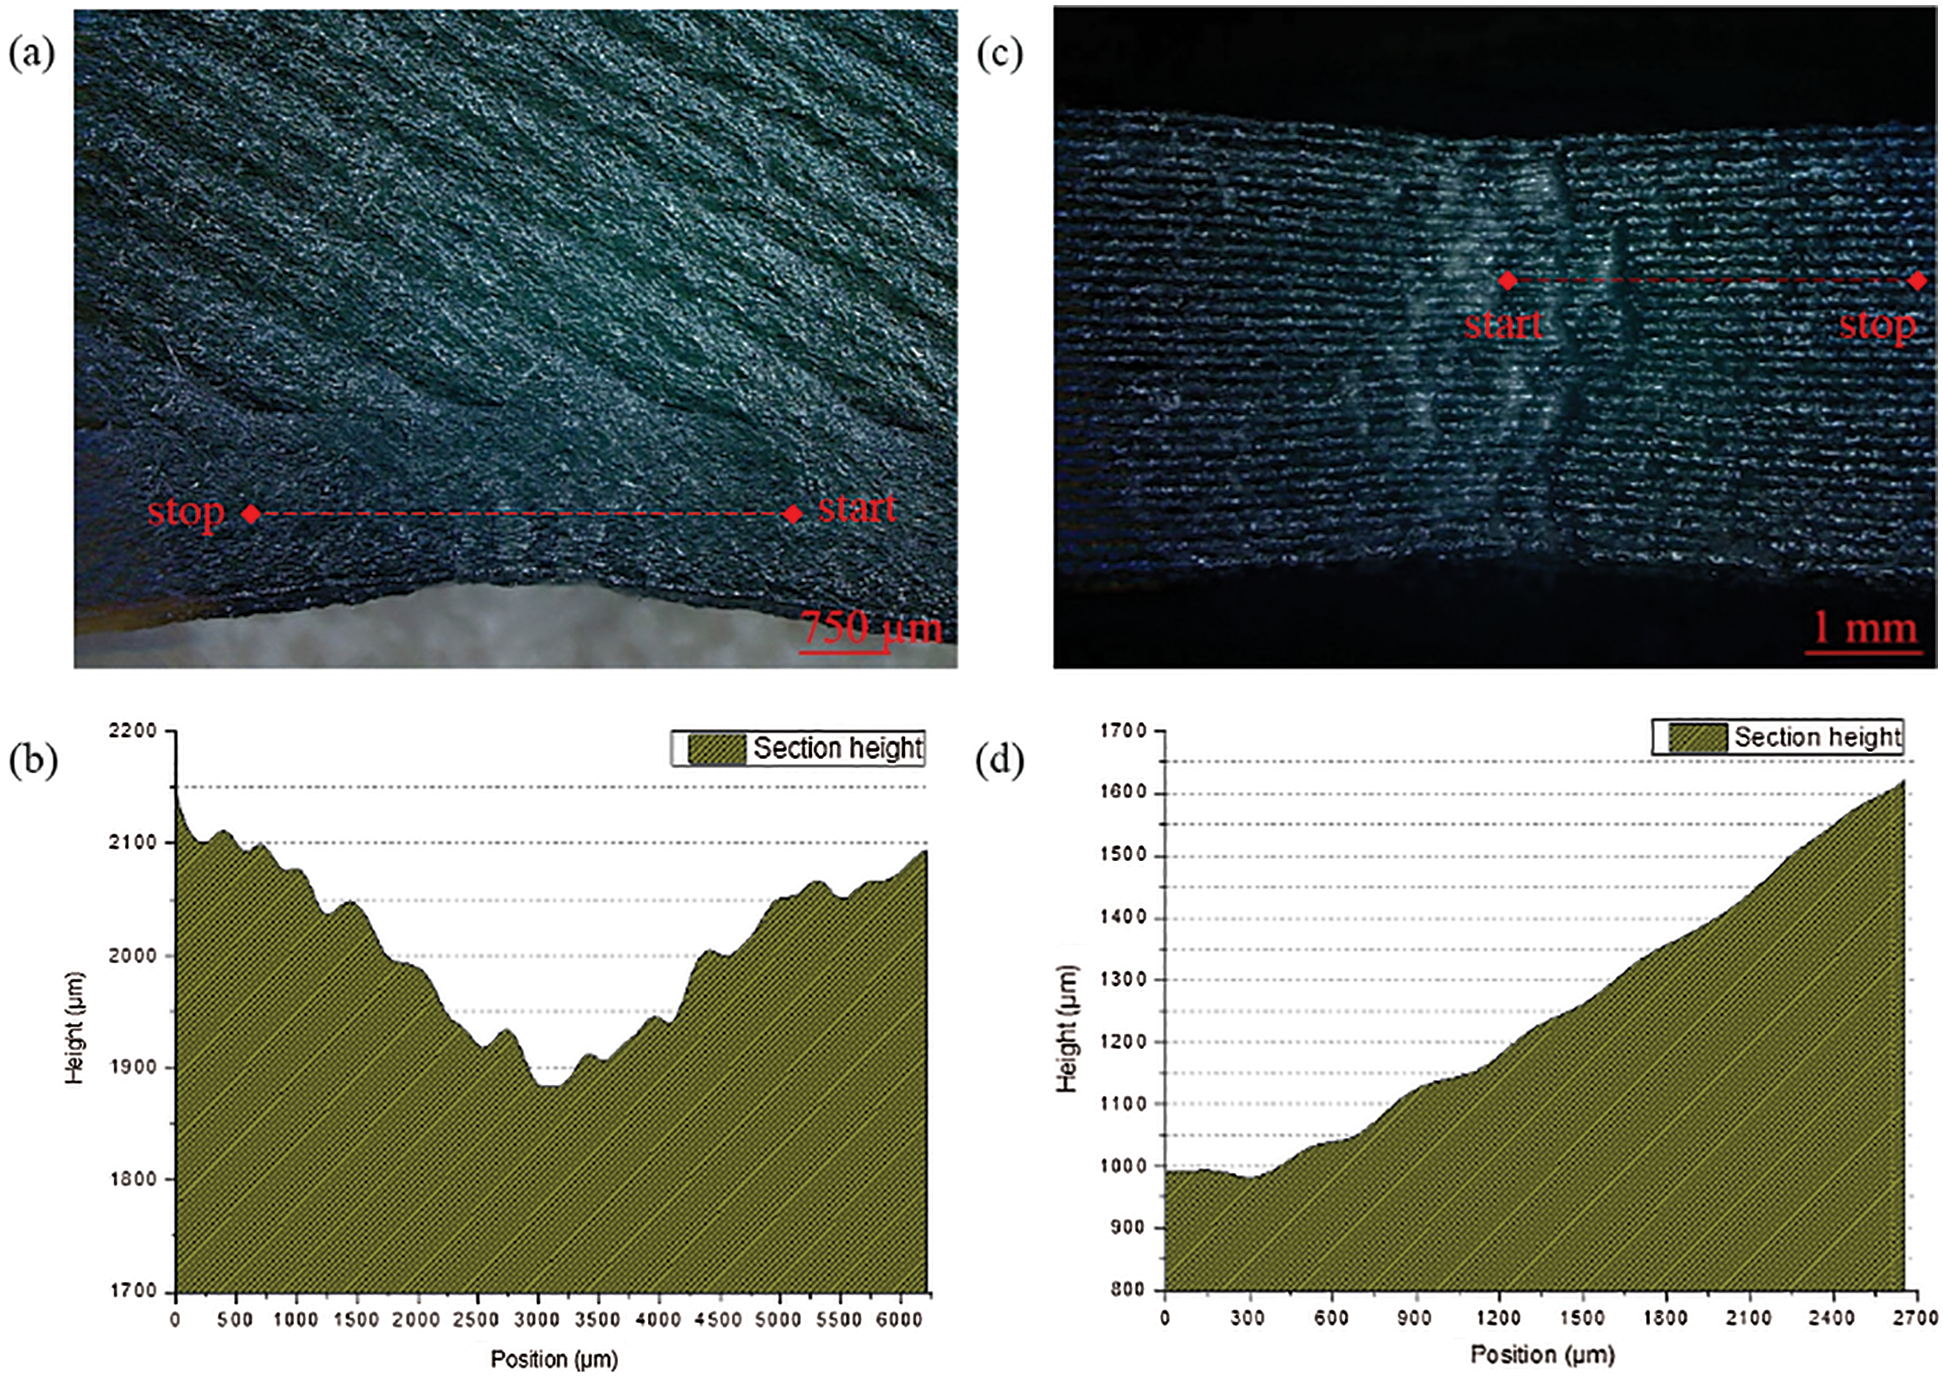
Figure 16: (a) The front surface of sample with deformation at a magnification of 150 times, (b) The height of the cross section marked in (a), (c) The side surface of sample with deformation at a magnification of 100 times, (d) The height of the cross section marked in (c)
Fig. 16a highlighted the front view of the stress-concentrated region where the front surface was sunken inward (along the thickness direction), turning white and shiny. The cross-sectional height is shown in Fig. 16b. The maximum height difference was up to 261.31 μm. Fig. 16c revealed the side view of the stress-concentrated region where the side surface was depressed inward (along the width direction) with white and shiny morphology, and the height of the cross section was shown in Fig. 16d. The height statistics were shown in Tab. S10 provided in the supporting material and the maximum height difference was up to 638.70 μm. From the cross section height, it can be seen that the side deformation was greater than that of the front surface because the maximum difference and standard deviation of the side deformation were larger than those of the front deformation. Note that the location of stress concentration might have a certain relationship with the internal pores where could be easy to concentrate stresses [9].
It should be noted that in Fig. 17, the indentation and interlayer cracking of the printed CFRTPCs specimen bearing the tension-tension fatigue load could be the main factor accelerating the fatigue failure. The indentation area where concentrating much stress might provide the first location of the fatigue fracture. Then the interlayer cracking could result in the rapid decrease of the fatigue resistance. Therefore, improving the interlayer cohesion should be an important method to increase the fatigue resistance of the printed CFRTPCs samples.
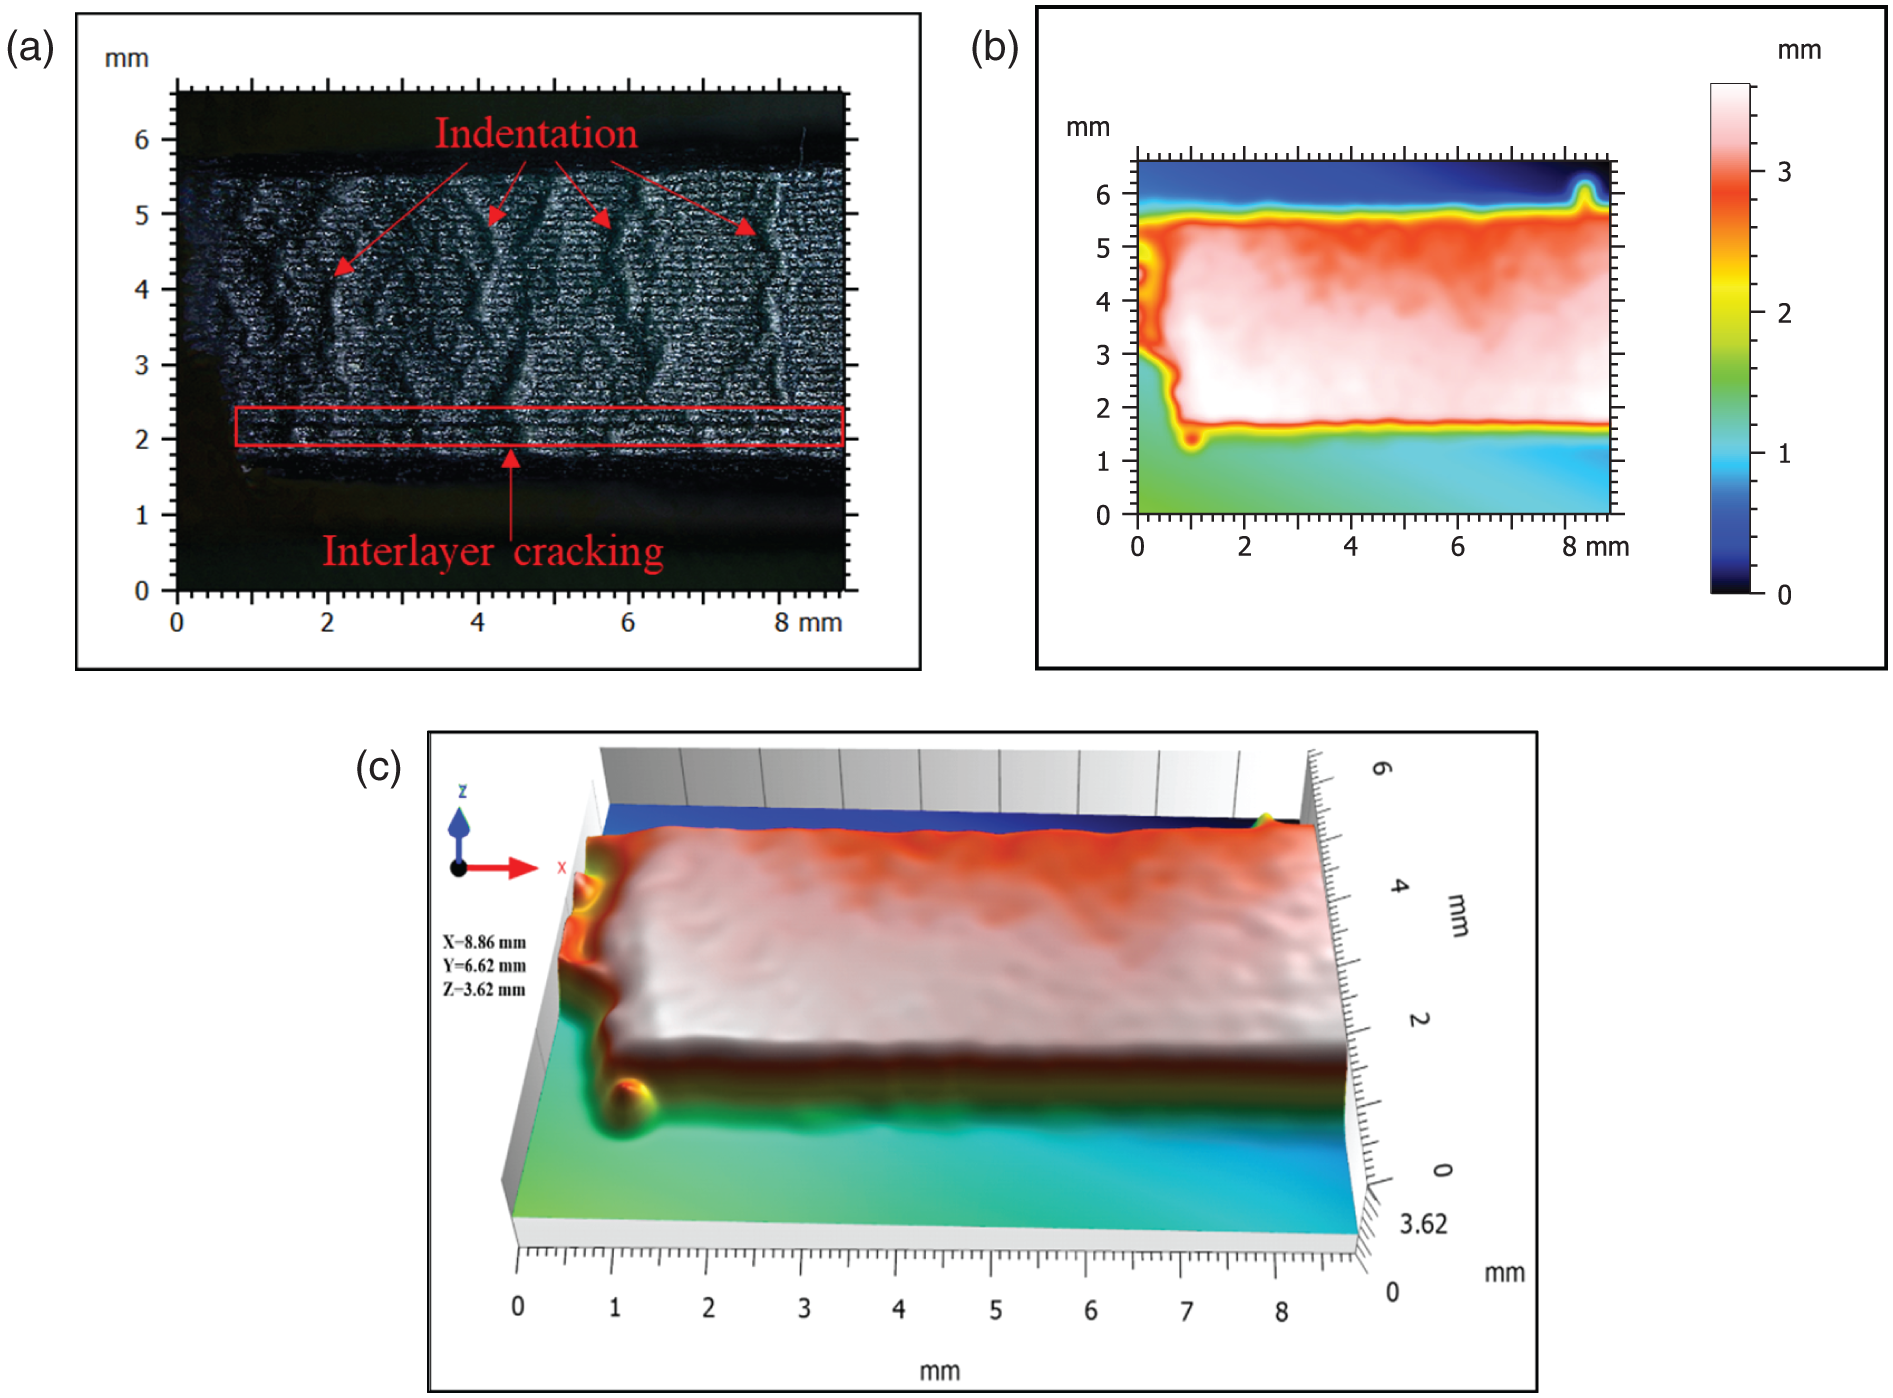
Figure 17: (a) The side surface of sample with indentations and interlayer cracking at a magnification of 100 times. The thermal height image (b) and 3D micro morphology (c) of the side surface
In general, this study focused on the 3D printing process of CFRTPCs specimens, including the printing defects, precision and stability evaluation of the process. Besides, it was also researched by experiments and mathematical models that the content and distribution arrangement of fiber reinforcement had an important impact on the tensile properties and fatigue resistance. Additionally, the analysis of the micro morphology was carried out to support further understanding of the printing process and mechanical performance. The principal conclusions are as follows:
(1) During the 3D printing process, the main defects reducing the surface quality and mechanical properties included redundant, accumulation, scratch and warp defects. And the main reasons of these defects should be the control errors of material fluidity and cutter response, the speed errors of the print head movement and the filament feeding. Besides, a lot of gaps were observed between the neighboring paths and layers, due to the filament property of the 3D printing adjacent paths. Moreover, the dimension of CF reinforcement layer was apparently larger than that of the other matrix layers because of the certain stiffness of the continuous carbon fiber bundle.
(2) As for the precision and stability of 3D printed samples, the printing sizes of width and thickness were both higher than the designed sizes. And the continuous carbon fiber contributed to the dimensional stability and accuracy of width and thickness for 3D printed CFRTPCs. Additionally, the theoretical mass and Eiger mass were obviously higher than the actual measured mass of specimens, and the theoretical mass was slightly higher than Eiger mass. Moreover, the CF reinforcement contributed to more defects reducing the weight accuracy of the printed CFRTPCs.
(3) The tensile test provided stress levels for the tension-tension fatigue test of the 3D printed CFRTPCs. The tensile results demonstrated that associations between the mass percentage of CF reinforcement and the averages of elastic modulus, strain at break and ultimate tensile strength were approximately linear. Generally with the increasing mass percentage of CF reinforcement, the elastic modulus and ultimate tensile strength were linearly increasing while the strain at break was linearly decreasing.
(4) The tension-tension fatigue test results revealed that the number of life cycles increased as the stress level decreased generally. And the fatigue resistance of 4CF was best while that of 2CF was better than that of 1CF under the same stress level. Besides, the curves of stress level and fatigue life for Onyx, 1CF and 2CF were basically linear during two ranges of fatigue life taking 10,000 cycles as boundary. And for 4CF, there was a good linear relationship between the stress level and the logarithm value of the cycle number during the whole life. In addition, with the increase volume of CF reinforcement, continuous carbon fibers bore the most tension-tension load and the fatigue life enhancing effect of CF was greater than the weakening effect of pore defects caused by CF reinforcement. Moreover, the main factors affecting sample deformations should be the reinforcement content and stress level. When the CF bore the main stress, the deformation was small; when the stress level exceeded the CF bearing range, the deformation became larger. Additionally, under a lower stress level, the deformation of sample remained relatively stable in a longer life span. And with the increase content of CF reinforcement, the life span where the deformation remained relatively stable was increasing.
(5) According to the analysis of micro morphology for CFRTPCs specimens bearing the tension-tension fatigue load, the modes of fatigue failure included matrix fracture, large and small bundles of carbon fibers and some single fibers extracted from matrix. Besides, the angles of fracture section for resin matrix included ±45° and 90° because of the vertical printing paths of the adjacent layers, resulting in a certain degree of isotropy for the printed specimens. Additionally, the fracture sections of ±45° were mostly located at the concave defects between printing paths, where the stress was easy to concentrate and the mechanical properties were poor. Moreover, the outer area was basically flat and filled with concentric resin paths while the inner area was filled with zigzag resin paths, between which there were obvious dent defects that could be an important factor accelerating the process of the fatigue fracture failure. In addition, the deformations where concentrating much stress behaved as the sunken surfaces along the thickness and width directions, and the deformation of the side surface was greater than that of the front surface.
Although there are still some outer and inner defects of the printed samples, the surface quality and mechanical properties of the CFRTPCs specimens printed by MarkTwo has been of a certain practical value, and the application of 3D printed CFRTPCs parts has been increasing with the growing research and development for the surface and mechanical performances.
Funding Statement: This research was supported by Jiangsu Provincial Key R&D Special Fund for Industry Prospects and Key Technologies through the Grant No. BE2019008-3.
Conflicts of Interest: The authors declare that they have no conflicts of interest to report regarding the present study.
1. Pandelidi, C., Bateman, S., Piegert, S., Hoehner, R., Kelbassa, I. et al. (2021). The technology of continuous fibre-reinforced polymers: A review on extrusion additive manufacturing methods. The International Journal of Advanced Manufacturing Technology, 113(11–12), 3057–3077. DOI 10.1007/s00170-021-06837-6. [Google Scholar] [CrossRef]
2. Mashayekhi, F., Bardon, J., Berthé, V., Perrin, H., Addiego, F. (2021). Fused filament fabrication of polymers and continuous fiber-reinforced polymer composites: Advances in structure optimization and health monitoring. Polymers, 13(789), 1–28. DOI 10.3390/polym13050789. [Google Scholar] [CrossRef]
3. Dickson, A. N., Barry, J. N., Mcdonnell, K. A., Dowling, D. P. (2017). Fabrication of continuous carbon, glass and kevlar fibre reinforced polymer composites using additive manufacturing. Additive Manufacturing, 16, 146–152. DOI 10.1016/j.addma.2017.06.004. [Google Scholar] [CrossRef]
4. Kabir, S. M. F., Mathur, K., Seyam, A. F. M. (2020). A critical review on 3D printed continuous fiber-reinforced composites: History, mechanism, materials and properties. Composite Structures, 232(1), 111476.1–111476.24. DOI 10.1016/j.compstruct.2019.111476. [Google Scholar] [CrossRef]
5. Wang, X., Jiang, M., Zhou, Z., Gou, J., Hui, D. (2017). 3D printing of polymer matrix composites: A review and prospective. Composites Part B Engineering, 110(2), 442–458. DOI 10.1016/j.compositesb.2016.11.034. [Google Scholar] [CrossRef]
6. Pakdel, E., Kashi, S., Varley, R., Wang, X. (2021). Recent progress in recycling carbon fibre reinforced composites and dry carbon fibre wastes. Resources Conservation and Recycling, 116, 105340. DOI 10.1016/j.resconrec.2020.105340. [Google Scholar] [CrossRef]
7. Wang, Y., Zhou, Y., Lin, L., Corker, J., Fan, M. (2020). Overview of 3D additive manufacturing (am) and corresponding am composites. Composites Part A: Applied Science and Manufacturing, 139, 106114. DOI 10.1016/j.compositesa.2020.106114. [Google Scholar] [CrossRef]
8. Tuan, D. N., Alireza, K., Gabriele, I., Kate, T. Q. N., David, H. (2018). Additive manufacturing (3D printingA review of materials, methods, applications and challenges. Composites Part B: Engineering, 143, 172–196. DOI 10.1016/j.compositesb.2018.02.012. [Google Scholar] [CrossRef]
9. Tey, J. Y., Yeo, W. H., King, Y. J., Ding, W. O. (2020). 3D printing of polylactic acid bioplastic–Carbon fibres and twisted kevlar composites through coextrusion using fused deposition modeling. Journal of Renewable Materials, 8(12), 1671–1680. DOI 10.32604/jrm.2020.011870. [Google Scholar] [CrossRef]
10. Perić, M., Putz, R., Paulik, C. (2020). 3D-Printed PLA filaments reinforced with nanofibrillated cellulose. Journal of Renewable Materials, 8(7), 759–772. DOI 10.32604/jrm.2020.09284. [Google Scholar] [CrossRef]
11. Klift, F. V. D., Koga, Y., Todoroki, A., Ueda, M., Hirano, Y. et al. (2016). 3D printing of continuous carbon fibre reinforced thermo-plastic (cfrtp) tensile test specimens. Open Journal of Composite Materials, 6(1), 18–27. DOI 10.4236/ojcm.2016.61003. [Google Scholar] [CrossRef]
12. Antony, S., Cherouat, A., Montay, G. (2020). Fabrication and characterization of hemp fibre based 3D printed honeycomb sandwich structure by fdm process. Applied Composite Materials, 27(9), 1–19. DOI 10.1007/s10443-020-09837-z. [Google Scholar] [CrossRef]
13. Parandoush, P., Zhou, C., Lin, D. (2018). 3D printing of ultrahigh strength continuous carbon fiber composites. Advanced Engineering Materials, 21(2), 1–8. DOI 10.1002/adem.201800622. [Google Scholar] [CrossRef]
14. Oladapo, B. I., Ismail, S. O., Afolalu, T. D., Olawade, D. B., Zahedi, M. (2020). Review on 3D printing: Fight against covid-19. Materials Chemistry and Physics, 258(1), 123943. DOI 10.1016/j.matchemphys.2020.123943. [Google Scholar] [CrossRef]
15. Yang, C., Tian, X., Liu, T., Cao, Y., Li, D. (2017). 3D printing for continuous fiber reinforced thermoplastic composites: Mechanism and performance. Rapid Prototyping Journal, 23(1), 209–215. DOI 10.1108/RPJ-08-2015-0098. [Google Scholar] [CrossRef]
16. Tian, X., Liu, T., Wang, Q., Dilmurat, A., Li, D. et al. (2017). Recycling and remanufacturing of 3D printed continuous carbon fiber reinforced pla composites. Journal of Cleaner Production, 142(4), 1609–1618. DOI 10.1016/j.jclepro.2016.11.139. [Google Scholar] [CrossRef]
17. Essassi, K., Rebiere, J., Mahi, A. E., Amine, M., Bouguecha, A. et al. (2021). Damping analysis and failure mechanism of 3D printed Bio-based sandwich with auxetic core under bending fatigue loading. Journal of Renewable Materials, 9(3), 569–584. DOI 10.32604/jrm.2021.012253. [Google Scholar] [CrossRef]
18. Ramakrishnan, V., Jayaraman, N. (1993). Mechanistically based fatigue-damage evolution model for brittle matrix fibre-reinforced composites. Journal of Materials Science, 28(20), 5592–5602. DOI 10.1007/BF00367835. [Google Scholar] [CrossRef]
19. Varvani-Farahani, A., Shirazi, A. (2007). A fatigue damage model for (0/90) frp composites based on stiffness degradation of 0 and 90 composite plies. Journal of Reinforced Plastics & Composites, 26(13), 1319–1336. DOI 10.1177/0731684407079771. [Google Scholar] [CrossRef]
20. Ahmadzadeh, G. R., Shirazi, A., Varvani-Farahani, A. (2011). Damage assessment of cfrp [90/±45/0] composite laminates over fatigue cycles. Applied Composite Materials, 18(6), 559–569. DOI 10.1007/s10443-011-9216-9. [Google Scholar] [CrossRef]
21. Pertuz, A. D., Diaz-Cardona, S., Andres, G. E. O. (2020). Static and fatigue behaviour of continuous fibre reinforced thermoplastic composites manufactured by fused deposition modelling technique. International Journal of Fatigue, 130(1), 105275.1–105275.12. DOI 10.1016/j.ijfatigue.2019.105275. [Google Scholar] [CrossRef]
22. Krairi, A., Doghri, I., Robert, G. (2016). Multiscale high cycle fatigue models for neat and short fiber reinforced thermoplastic polymers. International Journal of Fatigue, 92(1), 179–192. DOI 10.1016/j.ijfatigue.2016.06.029. [Google Scholar] [CrossRef]
23. Pinho, S. T., Iannucci, L., Robinson, P. (2006). Physically-based failure modes and criteria for laminated fibre-reinforced composites with emphasis on fibre kinking: Part I: Development. Composites Part A: Applied Science and Manufacturing, 37, 63–73. DOI 10.1016/j.compositesa.2005.04.016. [Google Scholar] [CrossRef]
24. Chen, X., Sun, X., Wang, B., Gu, J., Zou, P. et al. (2020). An improved longitudinal failure criterion for UD composites based on kinking model. Mechanics of Advanced Materials and Structures, 1–11. DOI 10.1080/15376494.2020.1799269. [Google Scholar] [CrossRef]
25. Chen, X., Sun, X., Chen, P., Chai, Y. (2020). A delamination failure criterion considering the effects of through-thickness compression on the interlaminar shear failure of composite laminates. Composite Structures, 241, 112121. DOI 10.1016/j.compstruct.2020.112121. [Google Scholar] [CrossRef]
26. Yao, L., Yi, S., Alderliesten, R. C (2017). Fibre bridging effect on the Paris relation for Mode I fatigue delamination growth in composites with consideration of interface configuration. Composite Structures, 159, 471–478. DOI 10.1016/j.compstruct.2016.09.082. [Google Scholar] [CrossRef]
27. Zhao, L. B., Gong, Y., Zhang, J. Y. (2019). A survey on delamination growth behavior in fiber reinforced composite laminates. Acta Aeronautica et Astronautica Sinica, 40(1), 171–199. DOI 10.7527/S1000-6893.2018.22509. [Google Scholar] [CrossRef]
28. Caminero, M. A., Chacón, J. M., Garcia-Moreno, I., Reverte, J. M. (2018). Interlaminar bonding performance of 3D printed continuous fibre reinforced thermoplastic composites using fused deposition modelling. Polymer Testing, 68, 415–423. DOI 10.1016/j.polymertesting.2018.04.038. [Google Scholar] [CrossRef]
29. Caminero, M. A., García-Moreno, I., Rodríguez, G. P., Chacón, J. M. (2019). Internal damage evaluation of composite structures using phased array ultrasonic technique: Impact damage assessment in CFRP and 3D printed reinforced composites. Composites Part B, 165, 131–142. DOI 10.1016/j.compositesb.2018.11.091. [Google Scholar] [CrossRef]
30. Azarov, A. V., Antonov, F. K., Golubev, M. V., Khaziev, A. R., Ushanov, S. A. (2019). Composite 3D printing for the small size unmanned aerial vehicle structure. Composites, 169(7), 157–163. DOI 10.1016/j.compositesb.2019.03.073. [Google Scholar] [CrossRef]
31. Markforged, I. N. C. (2014). Methods for fiber reinforced additive manufacturing. US, WO2014197732A2. DOI 10.1115/1.4030993. [Google Scholar] [CrossRef]
32. Zheng, L. F., Wang, L. N., Wang, Z. Z., Wang, L. (2018). Effects of γ-ray irradiation on the fatigue strength, thermal conductivities and thermal stabilities of the glass fibres/epoxy resins composites. Acta Metallurgica Sinica (English Letters), 31(1), 105–112. DOI CNKI:SUN:JSXY.0.2018-01-011. [Google Scholar]
33. Kabir, S. M. F., Mathur, K., Seyam, A. F. M. (2020). The road to improved fiber-reinforced 3D printing technology. Technologies, 8(4), 51. DOI 10.3390/technologies8040051. [Google Scholar] [CrossRef]
34. Chacón, J. M., Caminero, M. A., Núñez, P. J., García-Plaza, E., García-Moreno, I. et al. (2019). Additive manufacturing of continuous fibre reinforced thermoplastic composites using fused deposition modelling: Effect of process parameters on mechanical properties. Composites Science and Technology, 181, 107688. DOI 10.1016/j.compscitech.2019.107688. [Google Scholar] [CrossRef]
35. Sezer, H., Eren, O., Hüseyin, R. B., Zdemir, V. (2019). Additive manufacturing of carbon fiber reinforced plastic composites by fused deposition modelling: Effect of fiber content and process parameters on mechanical properties. Journal of the Faculty of Engineering and Architecture of Gazi University, 34(2), 633–674. DOI 10.17341/gazimmfd.416523. [Google Scholar] [CrossRef]
36. Caminero, M. A., Chacón, J. M., García-Moreno, I., Rodríguez, G. P. (2018). Impact damage resistance of 3D printed continuous fibre reinforced thermoplastic composites using fused deposition modelling. Composites Part B–Engineering, 148, 93–103. DOI 10.1016/j.compositesb.2018.04.054. [Google Scholar] [CrossRef]
37. Newcomb, B. A. (2016). Processing, structure, and properties of carbon fibers. Composites Part A: Applied Science and Manufacturing, 91A(Pt.1), 262–282. DOI 10.1016/j.compositesa.2016.10.018. [Google Scholar] [CrossRef]
38. Wu, F., Yao, W. X. (2010). A fatigue damage model of composite materials. International Journal of Fatigue, 32(1), 134–138. DOI 10.1016/j.ijfatigue.2009.02.027. [Google Scholar] [CrossRef]
39. Wicaksono, S., Chai, G. B. (2012). A review of advances in fatigue and life prediction of fiber-reinforced composites. Proceedings of the Institution of Mechanical Engineers. Part L: Journal of Materials: Design and Applications, 227(L3), 179–195. DOI 10.1177/1464420712458201. [Google Scholar] [CrossRef]
40. Highsmith, A. L., Reifsnider, K. L. (1982). Stiffness-reduction mechanisms in composite laminates. Damage in Composite Materials: Basic Mechanisms, Accumulation, Tolerance, and Characterization, 775, 103–117. DOI 10.1520/STP34323S. [Google Scholar] [CrossRef]
41. Shirazi, A., Varvani-Farahani, A. (2009). A stiffness degradation based fatigue damage model for frp composites of (0/θ) laminate systems. Applied Composite Materials, 17(2), 137–150. DOI 10.1007/s10443-009-9099-1. [Google Scholar] [CrossRef]
42. Rozanov, K. N., Koledintseva, M. Y., Drewniak, J. L. (2012). A mixing rule for predicting frequency dependence of material parameters in magnetic composites. Journal of Magnetism & Magnetic Materials, 324(6), 1063–1066. DOI 10.1016/j.jmmm.2011.10.028. [Google Scholar] [CrossRef]
Appendix
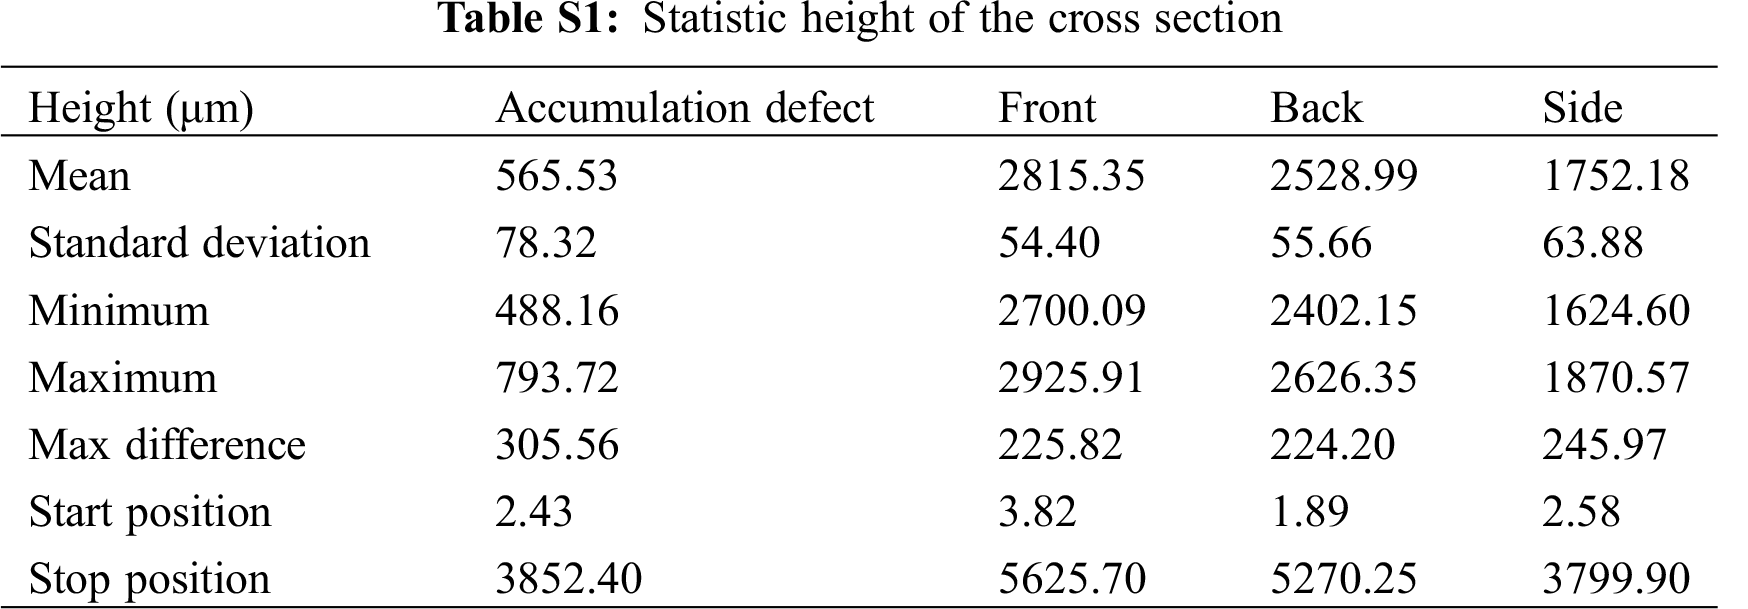
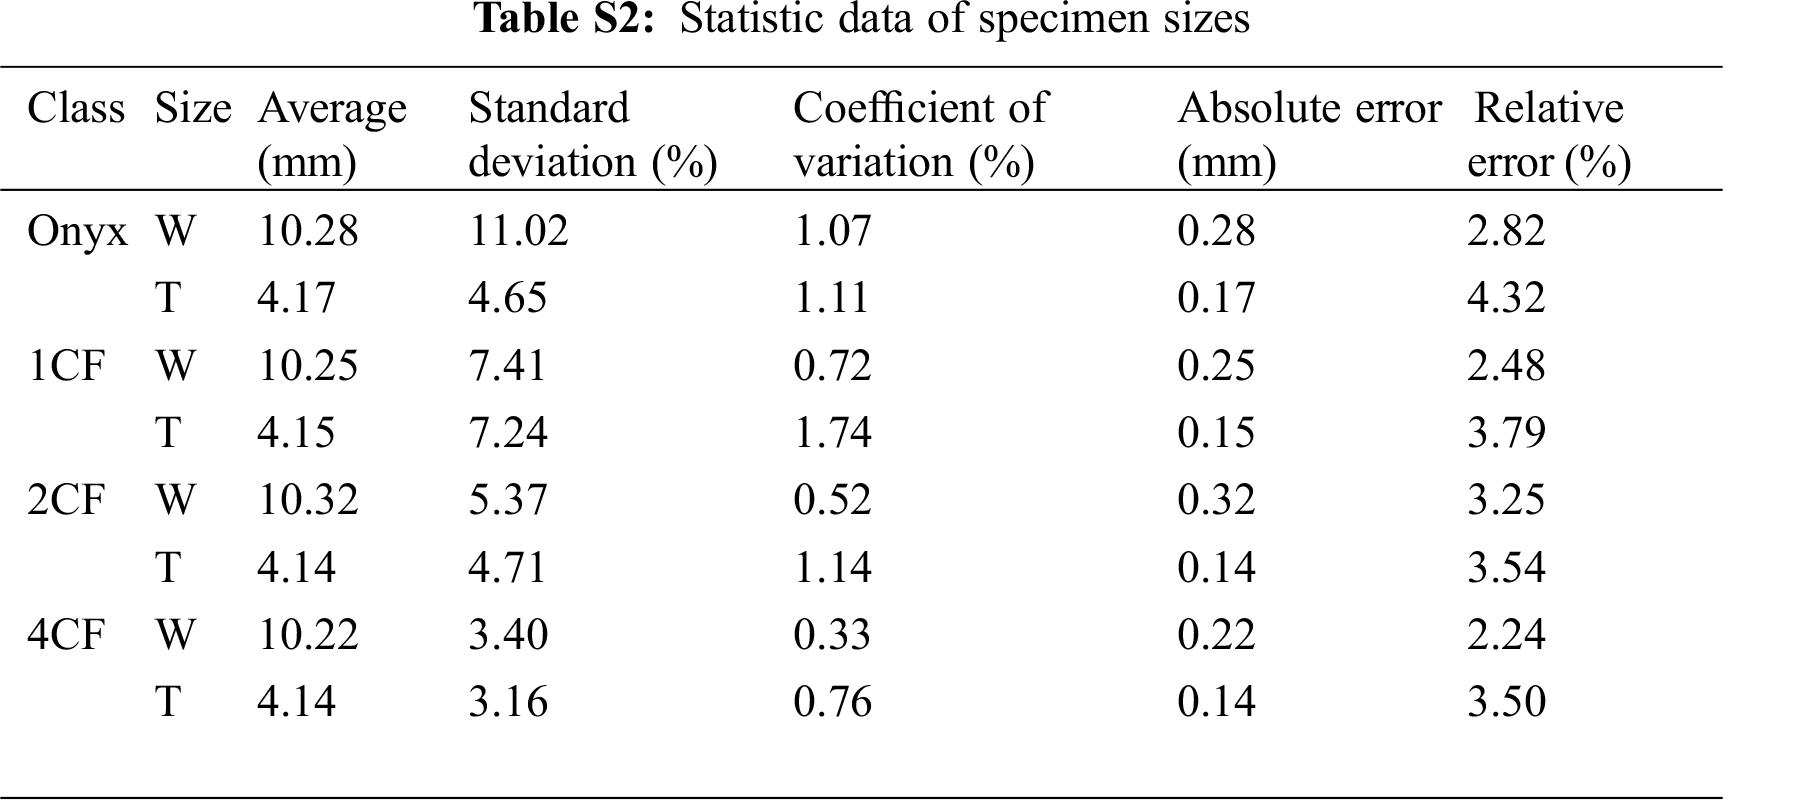
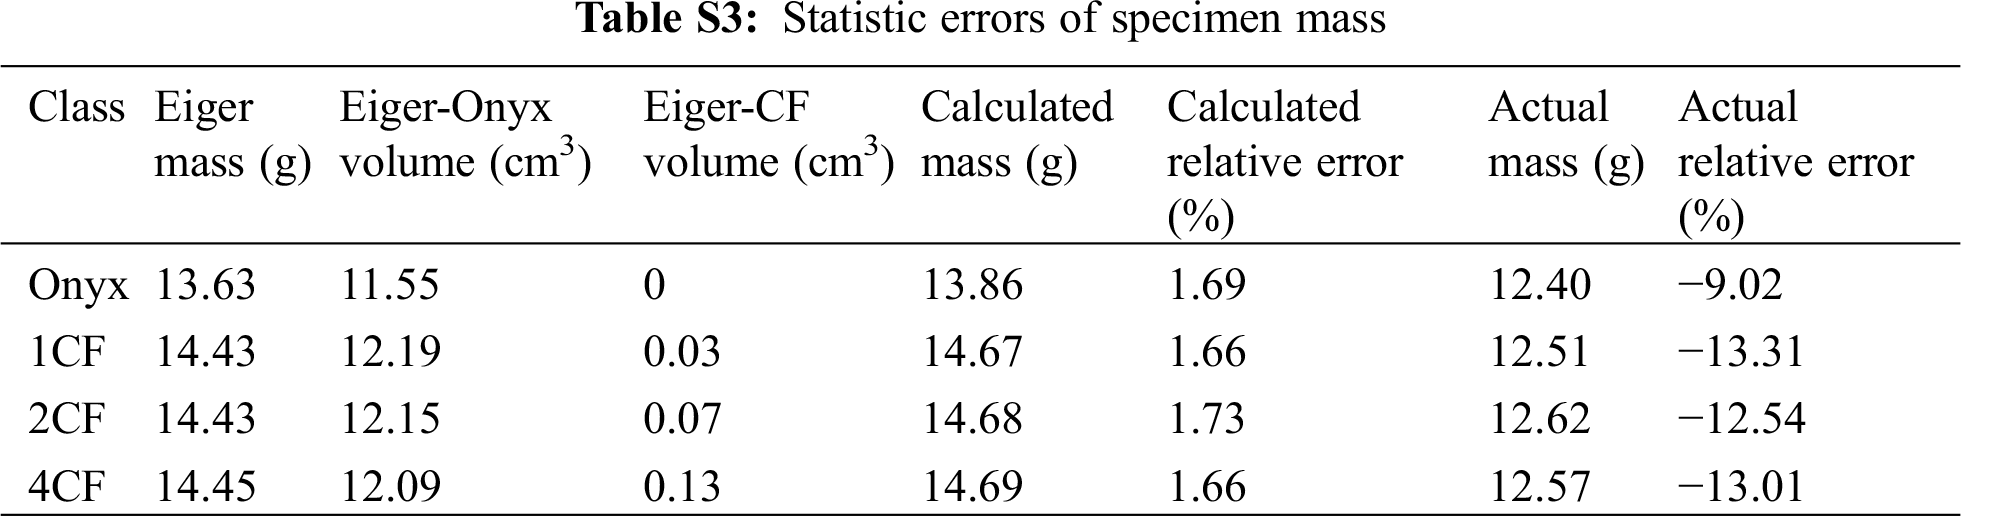
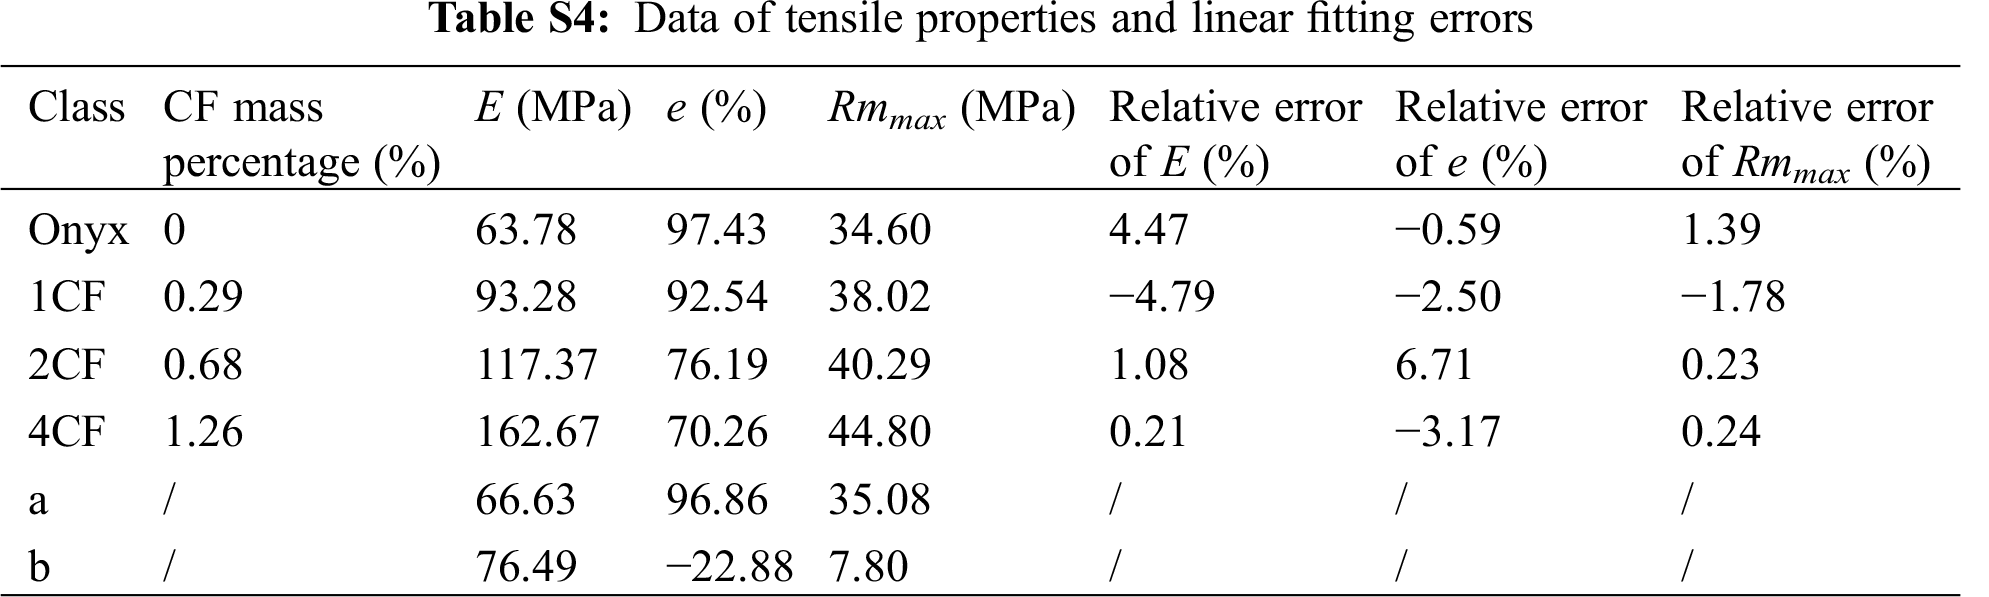
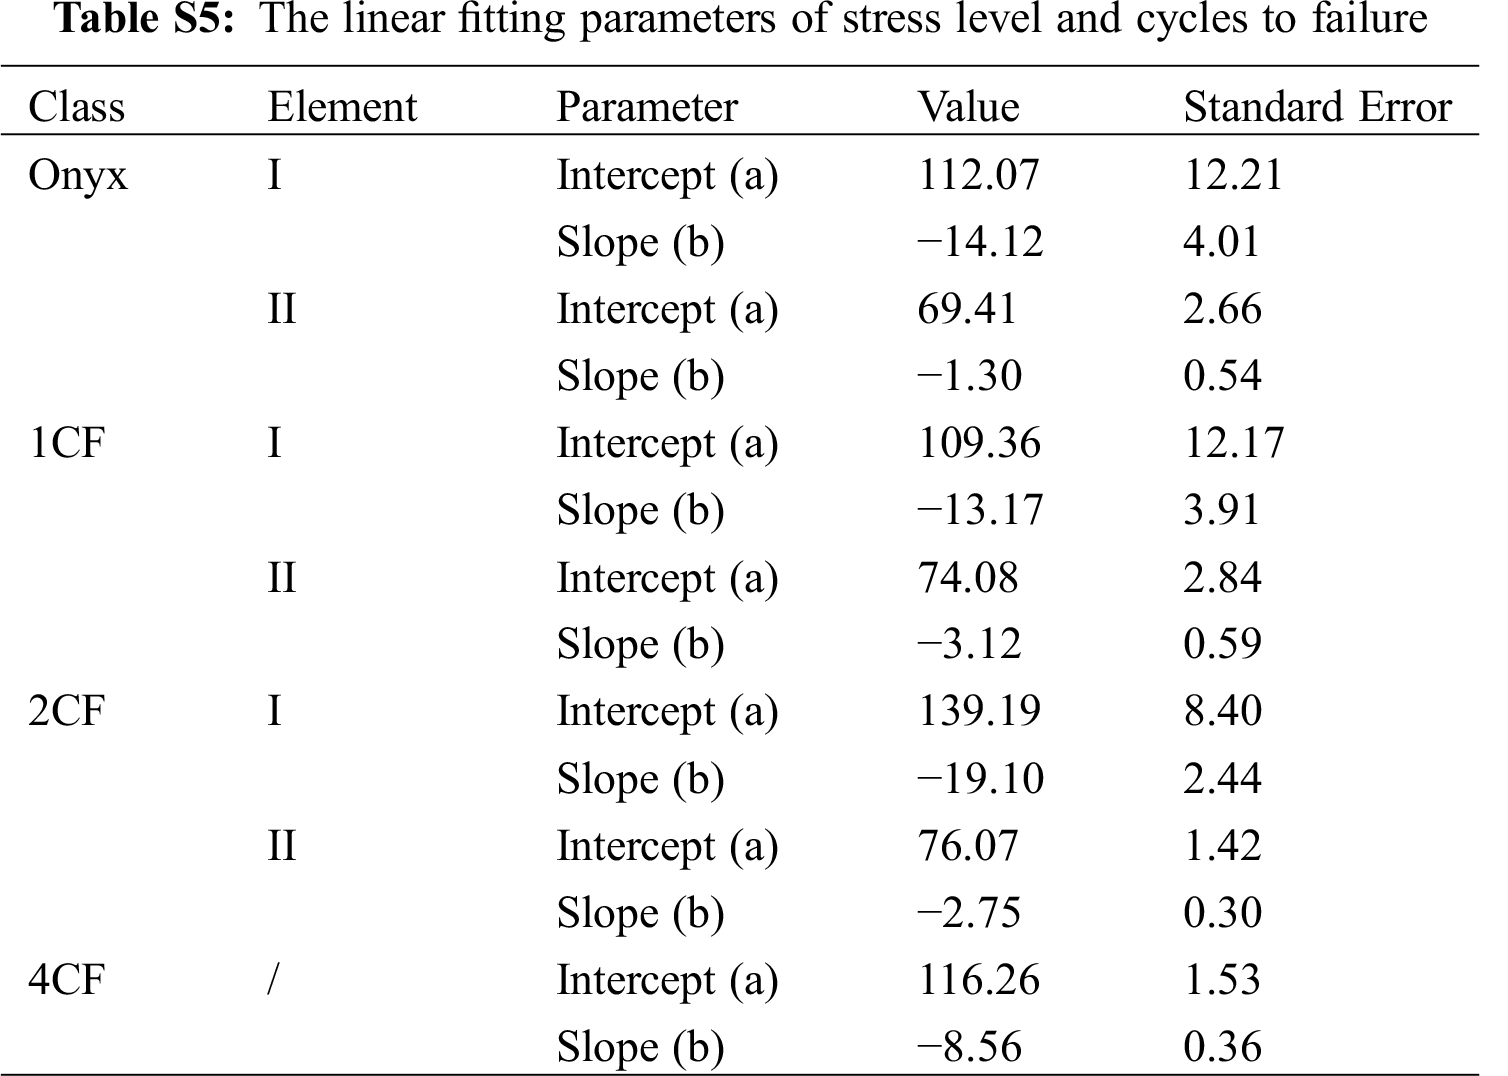
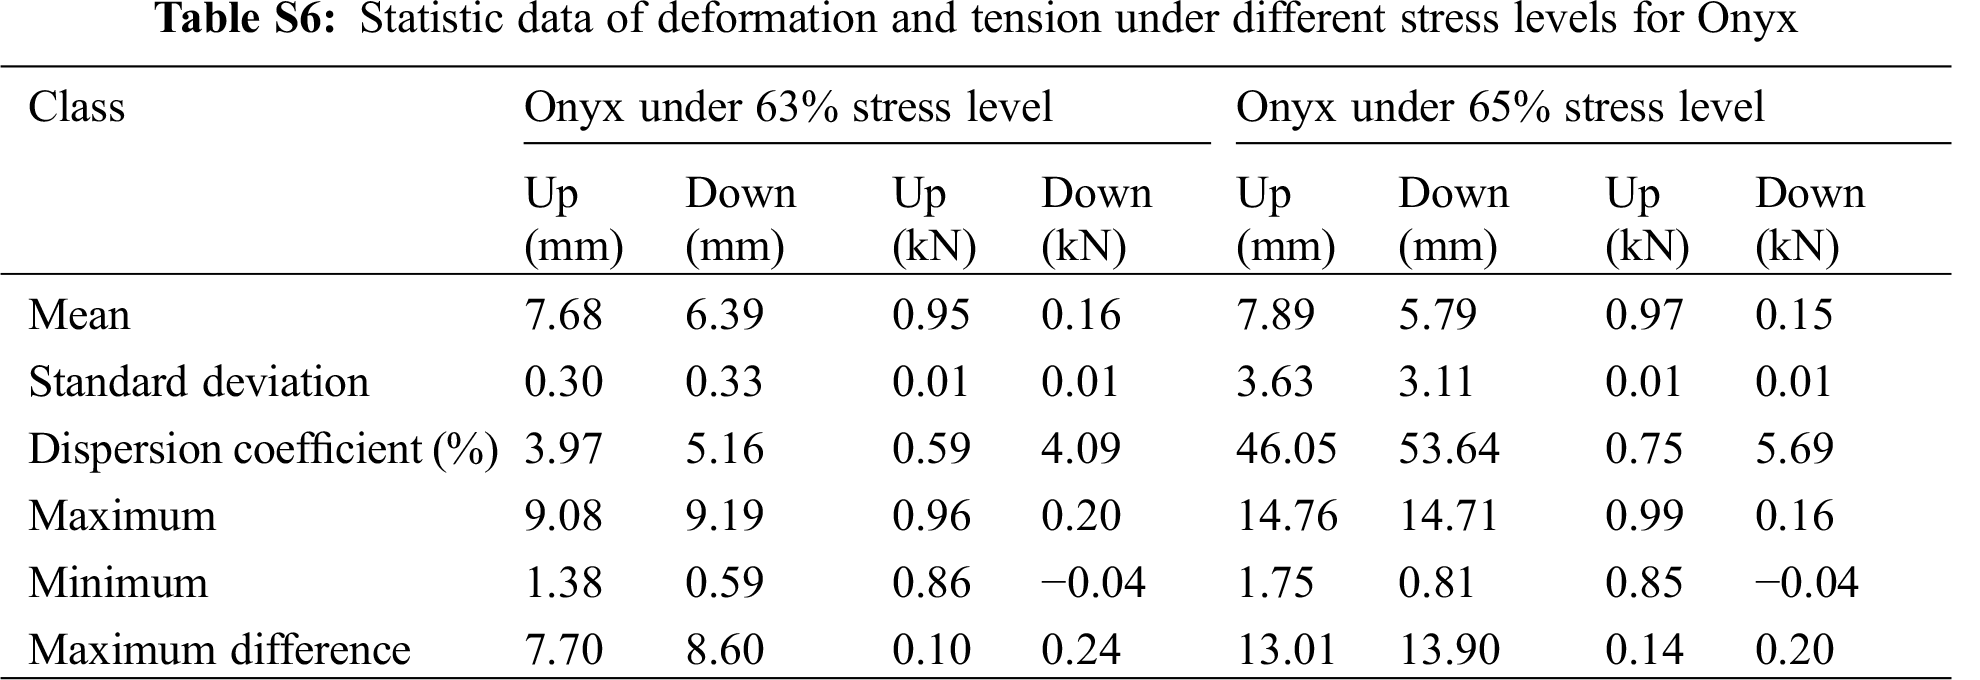
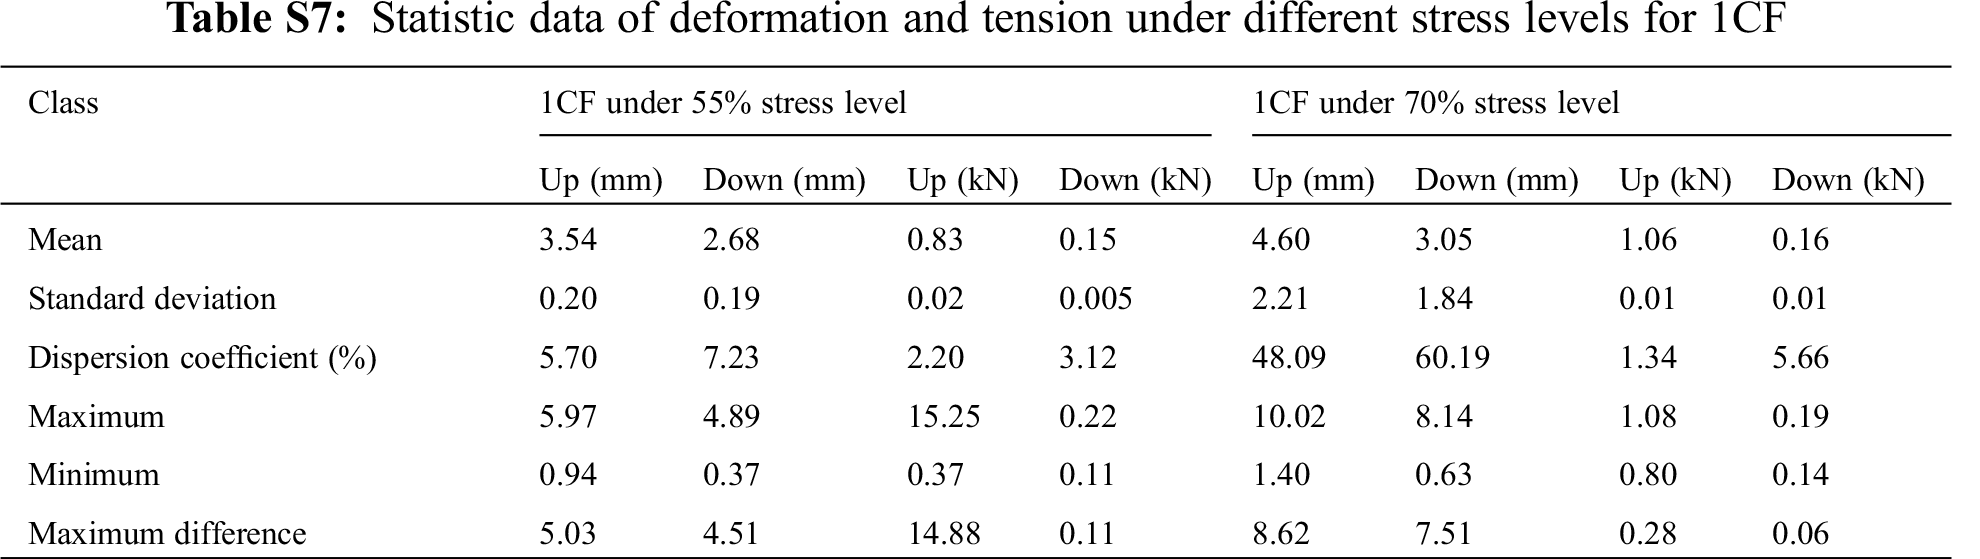
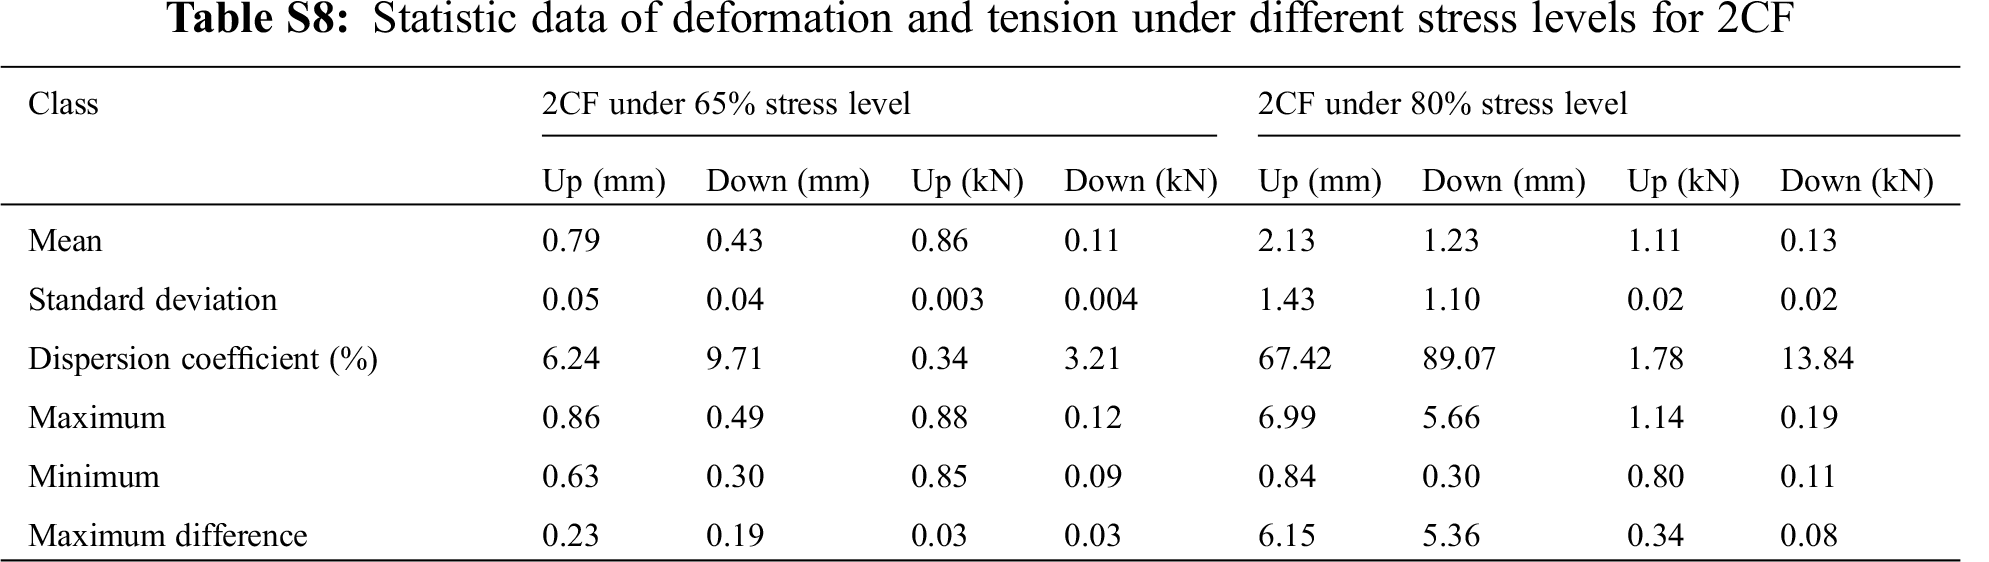
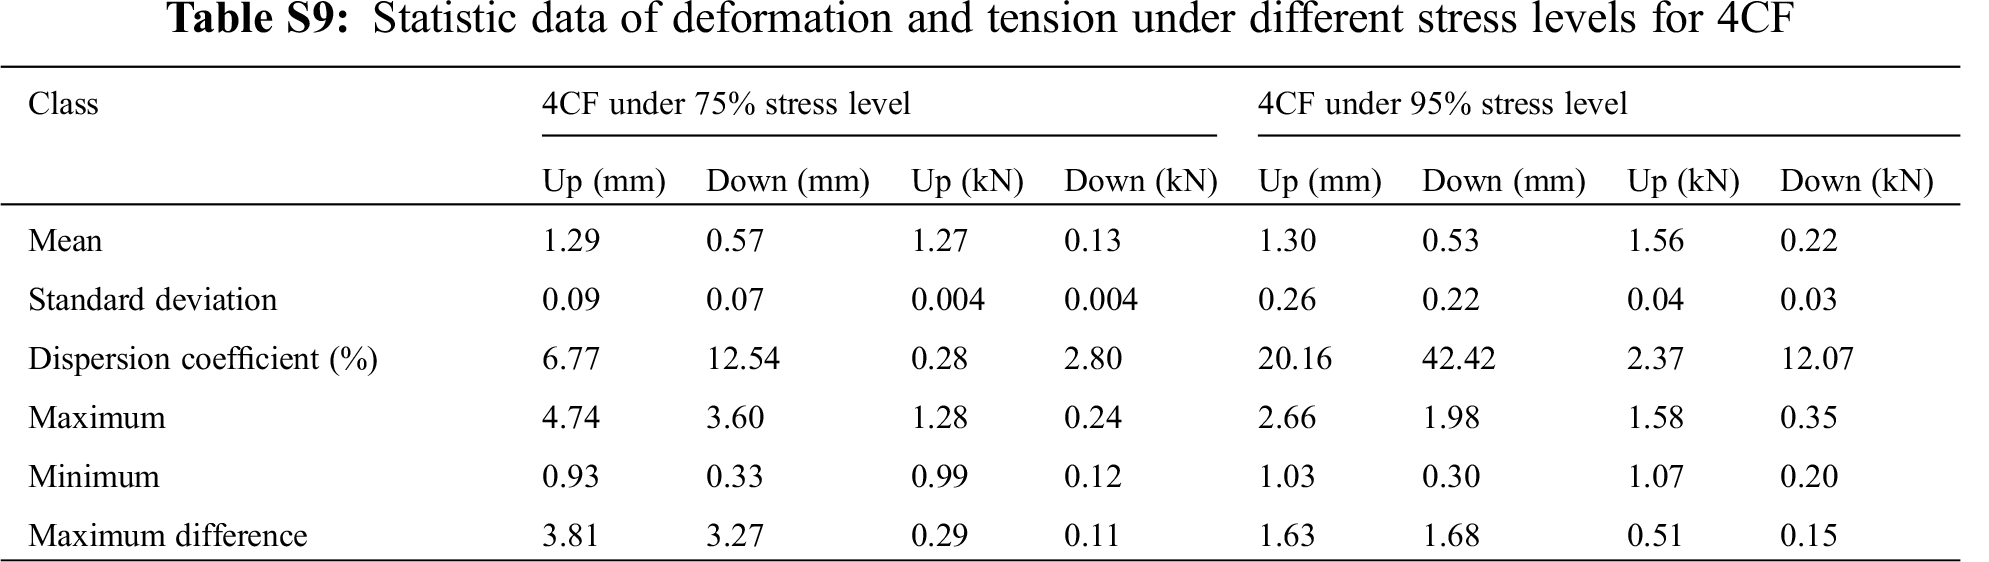
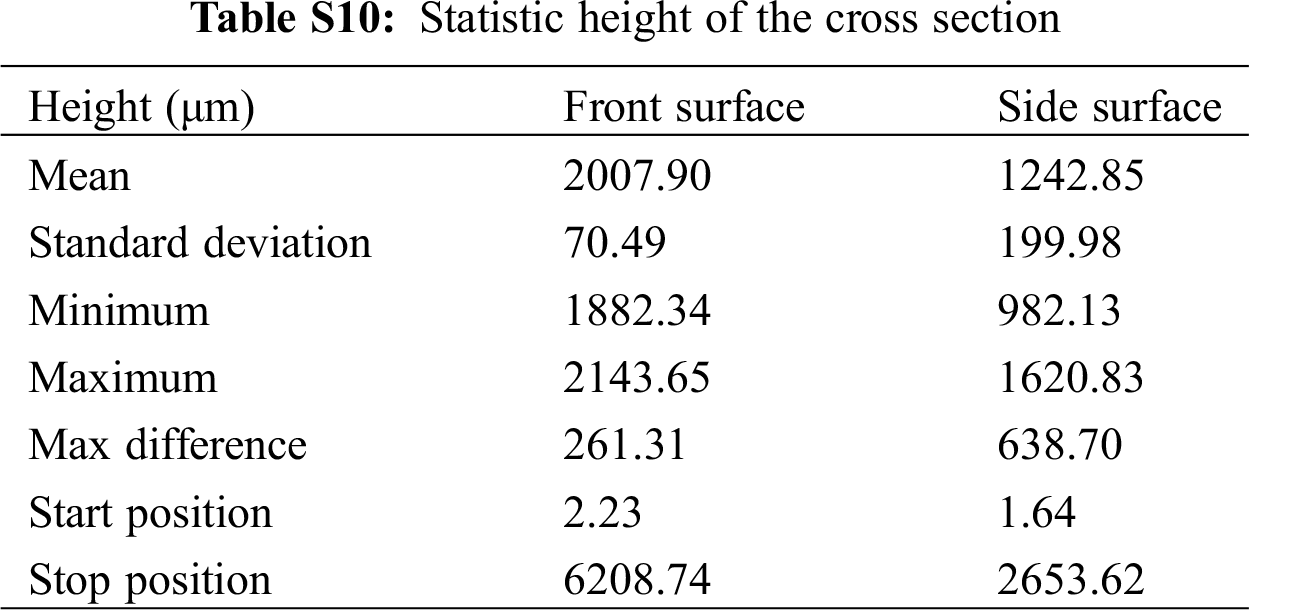
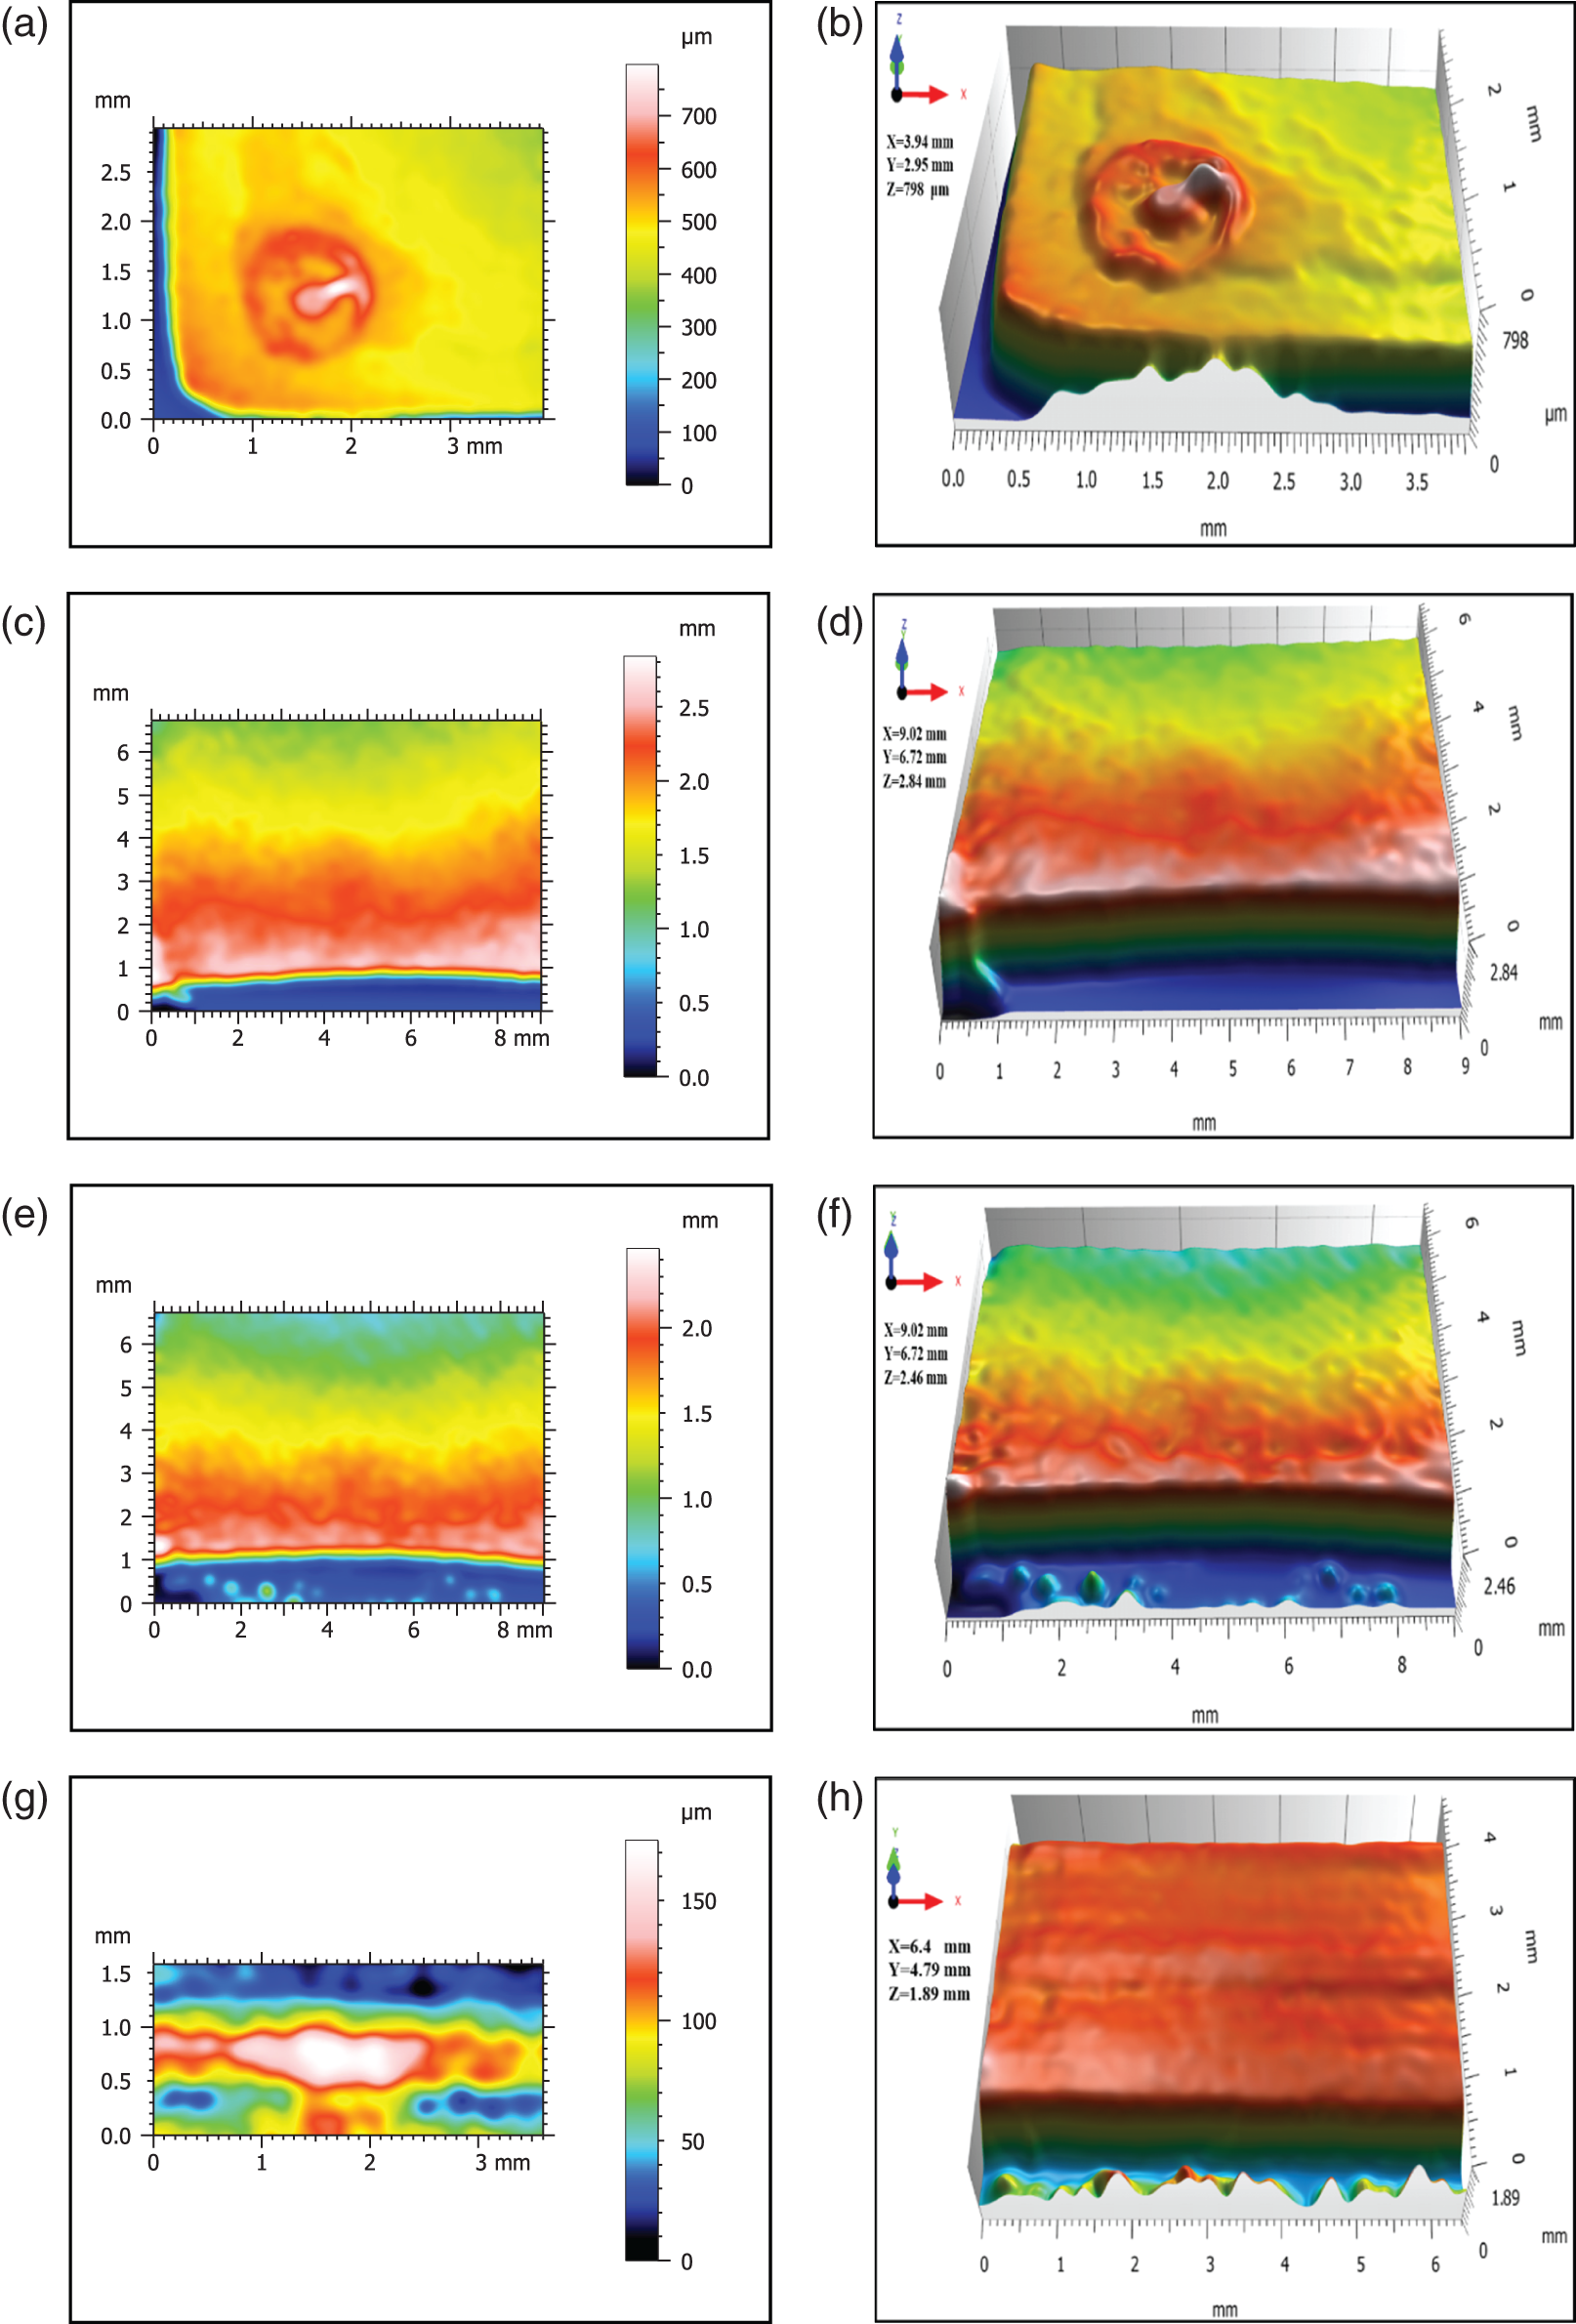
Figure S1: The partial morphology of the printed surfaces by the digital optical microscope LEICA® DVM6: The thermal height image of the accumulation defects (a), front surface (c), back surface (e), side surface (g). The three dimensional morphology of the accumulation defects (b), front surface (d), back surface (f), side surface (h)
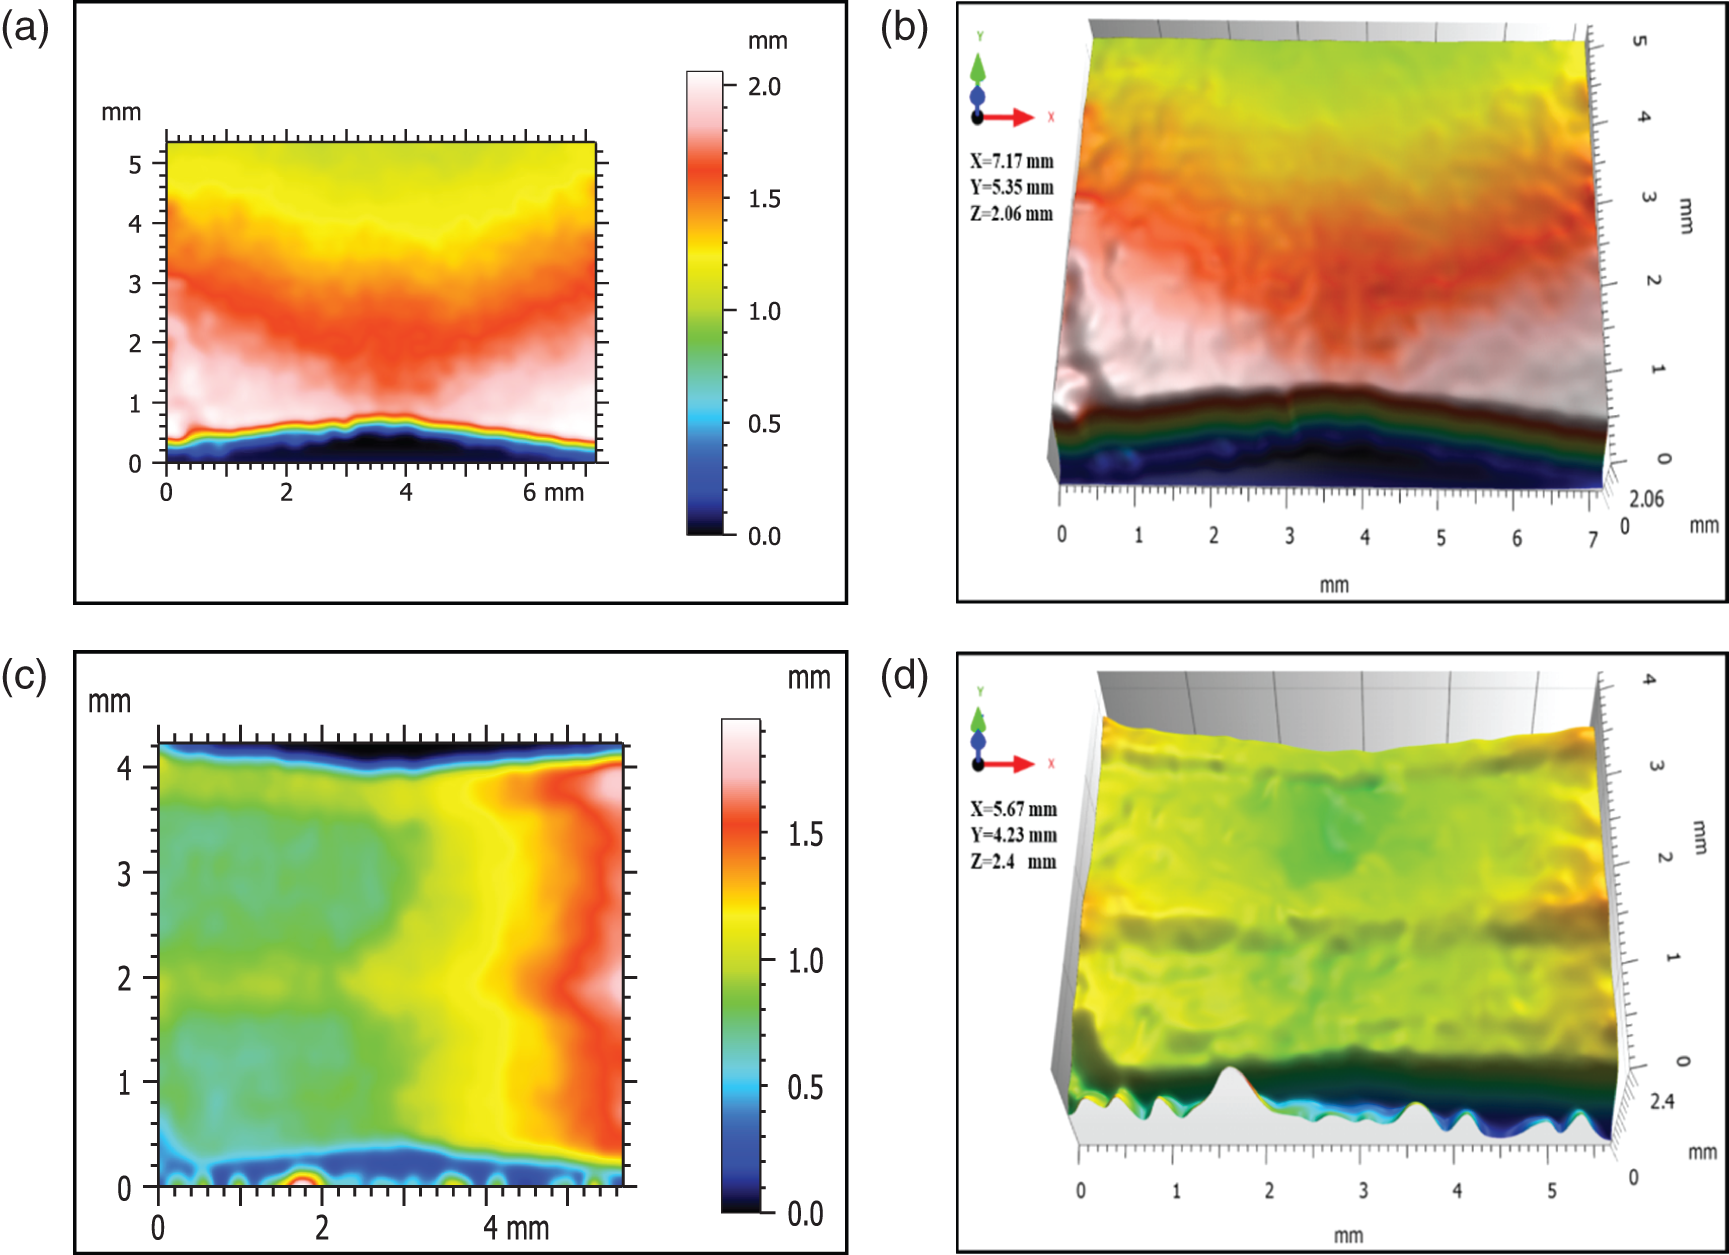
Figure S2: The thermal height image of the front surface (a) and side surface (c). The 3D micro morphology of the front surface (b) and side surface (d)
 | This work is licensed under a Creative Commons Attribution 4.0 International License, which permits unrestricted use, distribution, and reproduction in any medium, provided the original work is properly cited. |