| Journal of Renewable Materials |
DOI: 10.32604/jrm.2022.016793
ARTICLE
High Permeability of Boron along the Transverse Direction of Wood under High-Voltage Electrostatic Field (HVEF) Treatment
1College of Materials Science and Engineering, Nanjing Forestry University, Nanjing, 210037, China
2College of Civil Science and Engineering, Yangzhou University, Yangzhou, 225127, China
3Yangzhou Polytechnic Institute, Yangzhou, 225100, China
*Corresponding Authors: Liming Shen. Email: shenlm@njfu.edu.cn; Zhiqiang Wang. Email: wangzhiqiang@njfu.edu.cn
Received: 26 March 2021; Accepted: 29 April 2021
Abstract: Permeability of wood preservative is one of the most significant factors for protection of wood construction. Anisotropic flow permeability was involved in different directions of wood with higher flow resistance in the transverse and lower longitudinal directions. In this study, boron acid solution was brushed onto the tangential section of air-dried wood cubes and boron penetration along wood transverse direction was investigated under free diffusion, vacuum and HVEF treatments. Multi-scale boron distribution, FTIR measurement, leaching property, mechanical properties and fungistatic characteristic were investigated for free diffusion, vacuum and HVEF treated samples respectively. The results revealed that boron exhibited high permeability along the transverse direction with the penetration depth of ≈35 mm for HVEF treated samples and ≈1 mm for free diffusion and vacuum treated samples. For HVEF treated samples, no significant decrease of hardness, compression modulus of elasticity and strength were found in the treated samples. Better fungistatic characteristic was showcased in HVEF treated samples exposed to white rot fungi. Thus, HVEF treatment has a positive effect on boron permeability and the improvement of penetration depth of preservatives hence playing a significant role in wood protection and prolonging the service life of wood construction.
Keywords: Wood permeability; boron distribution; transverse direction; HVEF treatment; mechanical property; fungistatic property
Wood, as a renewable and eco-friendly material, has been increasingly utilized in constructions and architecture with advantages of simplicity and speed for fabrication [1]. However, wood is easy to be decayed by rot fungi when placed in a moist environment. This will lead to significant decrease in the mechanical properties of wood material and further limit the scope and service life of wood application [2]. Various preservatives have been utilized for protection of wood and their penetration behavior in wood micro-structure plays a significant role in the anti-fungal properties of wood which has been a topic of investigation for a long time [3,4].
Significant flow permeability pathways in wood anatomical structures involves a series of components, including tracheid lumina, pit torus and pit apertures [5]. Anisotropic flow resistances were obtained and analyzed mathematically based on the micro-structure characteristics of wood along different directions [6,7]. Significantly straight penetrating pathways are involved in hollow lumina structure along axial direction while tortuous flow permeability paths were observed in the transverse direction with compound middle lumina, pit torus, pit margo, ray tracheid and parenchyma cells all being taken into consideration [8]. It is essential to clearly understand the flow permeability paths in the transverse directions of wood in order to improve them.
Methods to promote wood permeability have been investigated as a significant issue for a long period of time. Vacuum and pressure method has been generally utilized in industrial wood modification for multi-functional wood. Zhang et al. [9] has obtained electrically conductive Cu/wood composite with robust mechanical properties via vacuum and pressure impregnation. However, the air bubbles generated under the changed pressure could block the penetration pathways during the immersion treatment. Moreover, high-frequency field has been utilized to improve wood penetration significantly with negative effect on the mechanical characteristics of wood. Oloyede et al. [10] observed that the modulus of elasticity for microwave treated wood decreased significantly with varying extents proportional to the different microwave cavities. In addition, the supercritical CO2 treatment has also been applied in modification of wood penetration. It could improve wood permeability while chemical degradation was obtained with supercritical CO2 exhibiting high reactivity towards the carbohydrate fractions of wood [11]. Thus, in order to avoid the decrease in wood permeability, mechanical property and interference with its chemical content during treatment, novel technology needs to be explored for wood permeability improvement.
From previous study, we found that electric field treatment produced an induced electrophoretic force which drives liquid flow on different substrates, which attributed to redistribution charges involved in liquid droplet and polarizability in atoms and molecules [12,13]. Tabassian et al. [14] investigated the shapes of liquid droplets and the degree of water penetration through graphene-coated meshes controlled by electrical stimuli based on the functional control of hydrophobic repellency and liquid permeability. Yun et al. [15] discovered that liquid metal is capable of super-wetting the solid surface and penetrating through macro- and microporous materials with capillary structure by applying a certain voltage to the structure. Furthermore, electric field has also been utilized in the modification of wood material penetration. Lisbeth et al. [16] used an direct-current electric field to transport copper ions into wood structure by electromigration between two electrodes. Christensen et al. [17] has explored the electrokinetic acceleration of boron acid penetration into wood and significantly higher penetration depths were obtained, varying with different wood section surfaces, moisture content of wood and current in the electric field . Based on the same principle, Ribeiro has also studied the electrokinetic movement of ions in the wood matrix by low-level electric field in order to remove Cu, Cr, and As from CCA-treated timber waste [18]. However, the application of low-voltage electric field has been relatively neglected in wood penetration treatment and the moisture content for wood samples should be more than 30% in order to obtain deeper penetration. Besides, the electrodes need to be in direct contact with wood surface after being treated with preservatives hence further limiting the scope of application of electric field treatment in wood modification [17].
In this study, high-voltage electrostatic field (HVEF) with negative voltage of 60 kV was applied in order to accelerate preservative penetration into wood micro-structure. The tangential section was selected as the surface to be brushed with boron acid preservative. The effects of free diffusion and vacuum treatments on wood flow permeability were also investigated and compared with HVEF treatment. The penetration paths of boron ions were characterized by colored reaction. The multi-scale boron distribution, FTIR measurement, mechanical properties, leaching and fungistatic properties were explored to evaluate the influence of HVEF treatment on wood flow permeability and be put into comparison with other treatments.
Plain-sawed pine (Pinus contorta) sapwood lumber bought from Suzhou Jingxiu Construction Technology Co., Ltd., China was selected to be used in this study. It was broad-grained wood and the share of latewood was 25.31%. The samples with dimensions of 35 mm × 35 mm × 35 mm were cut out and ensured that there was no visual defects. The samples were air-dried and balanced at room temperature (23°C, 65%RH) with average moisture content of 11.73% and average density of 0.45 g/cm3. Boric acid solution (11% by w.) was selected as the wood preservative to be brushed onto the wood’s tangential section.
2.2 Free Diffusion, Vacuum and HVEF Treatments
For each experiment, the samples were selected from the same lumber to undergo free diffusion, vacuum and HVEF treatments, respectively. They were brushed with boric acid solution (H3BO3+H2O=[B(OH)4]−+H+) on transverse section with the amount of usage being 105 g/m2, as shown in Fig. 1. For free diffusion treatment (Fig. 1a), one third of samples stayed at room temperature (23°C, 65%RH) for 48 h. For vacuum treatment (Fig. 1b), one third of samples were put in the vacuum device with the pressure of 0.09 MPa for 48 h. The vacuum device was released every half an hour. For HVEF treatment (Fig. 1c), one third of samples were put in between electrostatic field plates. The upper negative electrode plate was connected to the high-voltage generator and the other positive plate was connected to the ground [19]. The samples were put on the positive plate and the distance between electrodes was 38 mm. The upper electrode plate was ensured to be not in contact with the wood samples. The treatment duration was 48 h and the voltage was set as 60 kV. After treatments, all the samples were dried for 24 h at 50°C and then saved at room temperature (23°C, 65%RH) for 48 h. Three repetitive experiments were conducted for each condition, respectively.
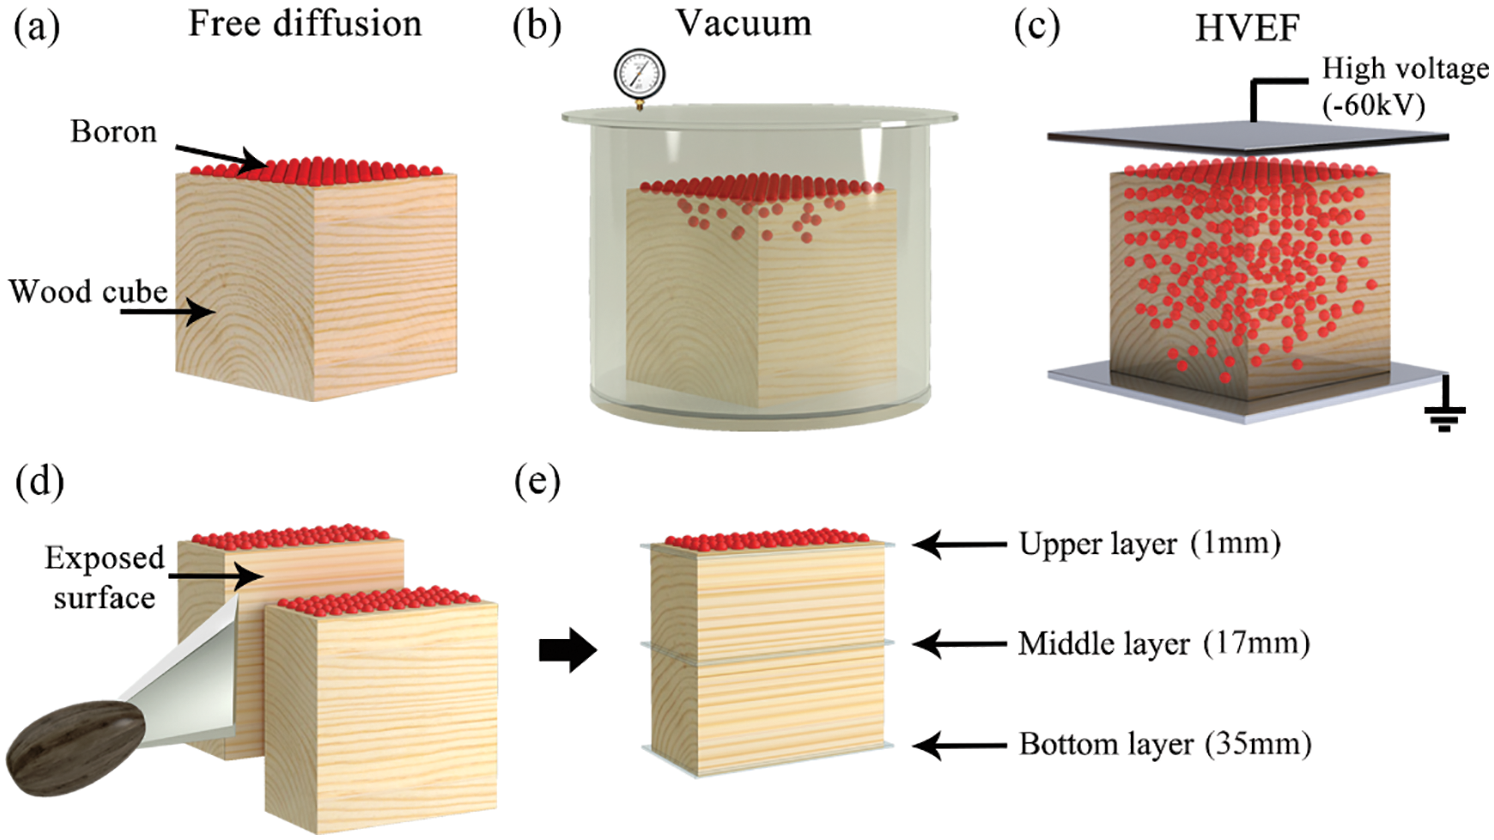
Figure 1: The diagram for wood cubes brushed with boron and then under different treatments including (a) free diffusion, (b) vacuum and (c) HVEF treatments. (d) The cubes cut to two parts by the chisel and (e) samples selected from different layers for various measurements
2.3 Measurement of Penetration Depth
The samples were cut along the fiber direction from cross section as shown in the Fig. 1d. The measurement of penetration depth was analyzed by visual inspection according to the GB/T 23229-2009 standards. 10 mL hydrochloric acid was diluted with absolute ethyl alcohol to 100 mL and then 0.25 g curcumin and 10 g salicylic acid were added in the solution. After stirring and filtering, the curcumin solution was sprayed onto the cut surface. The boron ions reacted with curcumin immediately, where the color would turn to red based on the chromogenic reaction.
2.4 Measurement of Color Difference
The color parameters for the cut and exposed surface was measured using a spectrophotometer (CM-600d, Konica Minolta Co., Ltd., Japan). Measurements were taken at the upper, middle and bottom positions of the treated samples respectively (Fig. 1e). The parameters of ΔE, Δa*, Δb* and ΔL* were obtained and analyzed. ΔL* represented the brightness to darkness, Δa* represented the intensity of greenness to redness (a < 0 for green, a > 0 for red), Δb* referred to the intensity of blueness to yellowness (b < 0 for blue, b > 0 for yellow) and ΔE represented the total color difference.
2.5 Boron Distribution in Micro-Structure of Wood
The microscopy (BX51 M, Olympus Co., Ltd., Japan) was utilized to investigate the boron distribution in wood structure. Measurements were taken at the upper, middle and bottom points of the treated samples. The micro-structure of pit and wood ray regions were selected and comparative analysis was done across different samples.
2.6 Boron Content in Treated Wood Samples
Slices with dimensions of 10 mm (length) × 5 mm (width) × 1 mm (height) were cut along wood longitudinal direction from upper to bottom layer of treated wood as shown in Fig. 1e. The microtome blade was used to prepare the slices. Boron content in the slices was measured by spectrophotometer (UV752, Shanghai Yuke Instrument Co., Ltd., China) according to the GB/T 23229-2009 standard. Every three slices were heated in the 150 mL conical flask with 10 mL distilled water for 10 min and then allowed to cool down to room temperature. After filtration, the liquid filtrate was used for measurement of boron content. The slices were vacuum-dried for 24 h at 50°C and were then saved.
The slices cut from the surface of treated wood samples were used for ATR-FTIR spectra measurement (PerkinElmer Co., Ltd., Germany). The dimensions of slice were 10 mm (length) × 10 mm (width) × 1 mm (height) and the slices were vacuum-dried for 24 h at 50°C. They were saved in the drying chamber. The recording range was from 400 to 4000 cm−1 and the resolution of the device was 2 cm−1.
New wood samples from the same lumber were cut to the dimensions of 20 mm (length) × 20 mm (width) × 20 mm (height). The samples were brushed with boric acid solution with the amount of usage being 105 g/m2 and then treated with HVEF, vacuum and free diffusion for 48 h as mentioned above. After being allowed to oven-dry at 50°C for 24 h, the samples were balanced for 24 h at room temperature and then put into the 500 mL beaker together with 180 mL deionized water. The samples were completely submerged in water and the leachate was collected after 30 min of vacuum treatment, 6, 24 and 48–336 h (water in the beaker was replaced every 48 h) according to the standard of GB/T 29905-2013.
2.9 Mechanical Properties and Fungistatic Measurement
The Janka hardness device (Shanghai Biaozhuo Co., Ltd., China) was utilized to measure the hardness of wood samples according to GB/T 1941-2009. Semi-hemispherical steel indenter was pressed in wood surface at the speed of 3 mm/min until the depth up to 5.64 mm. Then, the value of hardness was recorded and obtained from the device. Three repetitions were conducted for each condition.
For transverse compression modulus of elasticity and compression modulus of rapture measurement (WDW-100, Changchun Kexin Co., Ltd., China), the wood cube was divided into four equal parts along the direction of wood fiber and the dimensions for each part were 30 mm (length) × 15 mm (width) × 15 mm (height). The testing method strictly followed that stated in the standard of GB/T 1939-2009.
Samples were cut from upper layer, middle layer and bottom layer of treated wood cube with diameter of 10 mm and height of 1 mm. The samples were sterilized by UV light for 48 h and then put into the 90 mm petri dishes (PDA, Potato Dextrose Agar) filled with white rot fungi (Postia placenta) for four weeks. The graphs for these samples were obtained before and after exposure to fungi and the values of difference absolute (DA) and edge intensity (EI) for these graphs were calculated by MATLAB using the function of image definition.
3.1 Multi-Scale Boron Distribution for Treated Samples
After chromogenic reaction of boron with curcumin solution had taken place, the boron distribution could be visually recognized from the new exposed surface of the half of the wood cube as shown in Fig. 2. The color parameters were obtained from the upper, middle and bottom parts for different treated wood samples respectively. The differences between color parameters were calculated respectively based on the value of controlled sample without boric acid. For different treated samples, ΔL* and Δa* were negative while ΔE and Δb* were positive; and boron distribution pattern identified from the exposed surfaces exhibited variation among different treated samples.
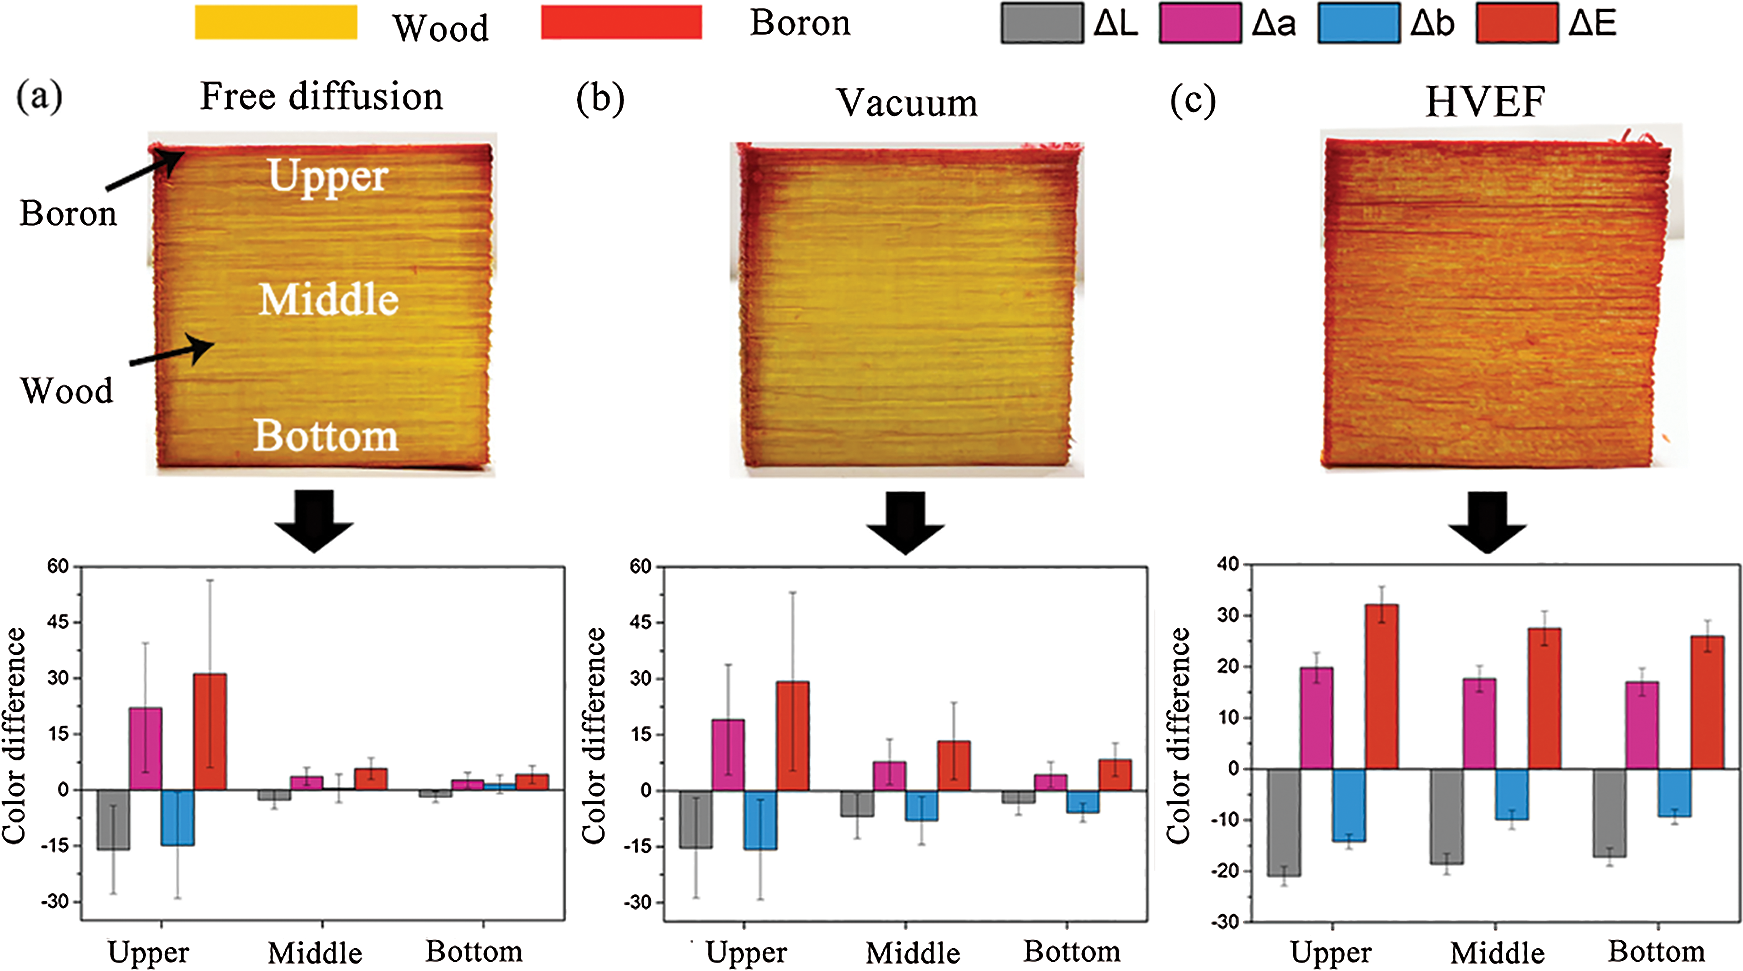
Figure 2: Macro color difference for different treated samples. Images of the split faces of wood samples treated with boric acid solution under (a) free diffusion, (b) vacuum and (c) HVEF treatments. The color difference as determined by image analysis at the upper, middle and bottom positions of different treated samples
For free diffusion and vacuum treated samples (Figs. 2a and 2b), more boron was mainly distributed on the upper parts with the penetration depth of ≈1 mm and very little boron distributed around the middle and bottom positions along transverse direction. The color difference parameters further confirmed this phenomenon. Higher values of color difference parameters were obtained for the upper part of free diffusion and vacuum treated samples as compared to the low values obtained at the middle and bottom parts. Furthermore, the value of standard deviation calculated was significantly high which could be attributed to the nonuniform boron distribution at the upper part of the exposed surface. For HVEF treated samples (Fig. 2c), the boron distribution on exposed surface was more uniform with the penetration depth of ≈35 mm and the values of color difference parameters for the middle and bottom parts were higher than that of free diffusion and vacuum treated samples. This is due to the fact that the boron ions dissociated from the boric acid solution and they migrated towards positive charged electrode in the electric field with increasing velocity as stated in previous investigation especially for the condition of high voltage [17].
In order to further explore the boron distribution for micro-structure of wood under different treatment methods, micro-graphs were obtained through the metallurgical microscope. In the figure, red color represented the boron ions owing to the chromogenic reaction with curcumin and yellow color represented parts of the wood structure that were stained by curcumin. Bordered pits and cross field pits were observed for free diffusion, vacuum and HVEF treated samples. Three capture points were obtained from the upper, middle and bottom parts of each treated sample. From the tangential section, boron ions penetrated into wood structure along radial direction through wood ray tracheids, ray parenchyma cells and a few of bordered pits. Moreover, flow channels along the longitudinal and tangential directions including tracheid, bordered pits and cross field pits also have significant impact on the corresponding wood permeability [20].
For free diffusion and vacuum treated samples (Figs. 3a–3d), the boron ions distributed along the cell wall at the upper position with majority of the boron ions penetrating along void spaces of adjacent tracheid, compound middle lamella and outer layer of wood’s cell wall which is commonly referred to tracheid and ray cell. A few of boron ions surrounded bordered pits and there was no obvious boron content observed that filled the pit cavity and the porus. Moreover, at the middle and bottom positions, there was no sign of obvious boron ions migration into wood structure for the free diffusion and vacuum treated samples with the color of these regions being yellow (curcumin reacted with chemical groups in wood) (Figs. 3b–3f). For HVEF treatment, higher volume of boron ions penetrated into wood tracheid along transverse direction with void spaces of adjacent tracheid, compound middle lamella and the whole cell wall of tracheid being displayed in red. More bordered pits were spread and filled with boron ions with the margo and porus being displayed in red as well (Fig. 3g). This is due to the fact that HVEF treatment accelerated the oriented ions migration along the transverse direction of wood under the electric field force as stated and mentioned above. In addition, significantly increased quantity of boron ions were observed at the middle and bottom positions of exposed surface of treated wood samples as compared to the free diffusion and vacuum treated samples (Figs. 3h–3i). However, there was lower content of boron ions at middle and bottom positions of HVEF treated samples compared with that at the upper position. The void spaces of adjacent tracheid, compound middle lamella and cell wall of tracheid were not fully filled with boron ions as shown in Figs. 3h–3i. This was attributed to the blocking effects along the transverse penetration direction in wood caused by factors such as pits structure, wall thickness of tracheid, ray tracheid and ray parenchyma cell as stated in previous study as well [21].
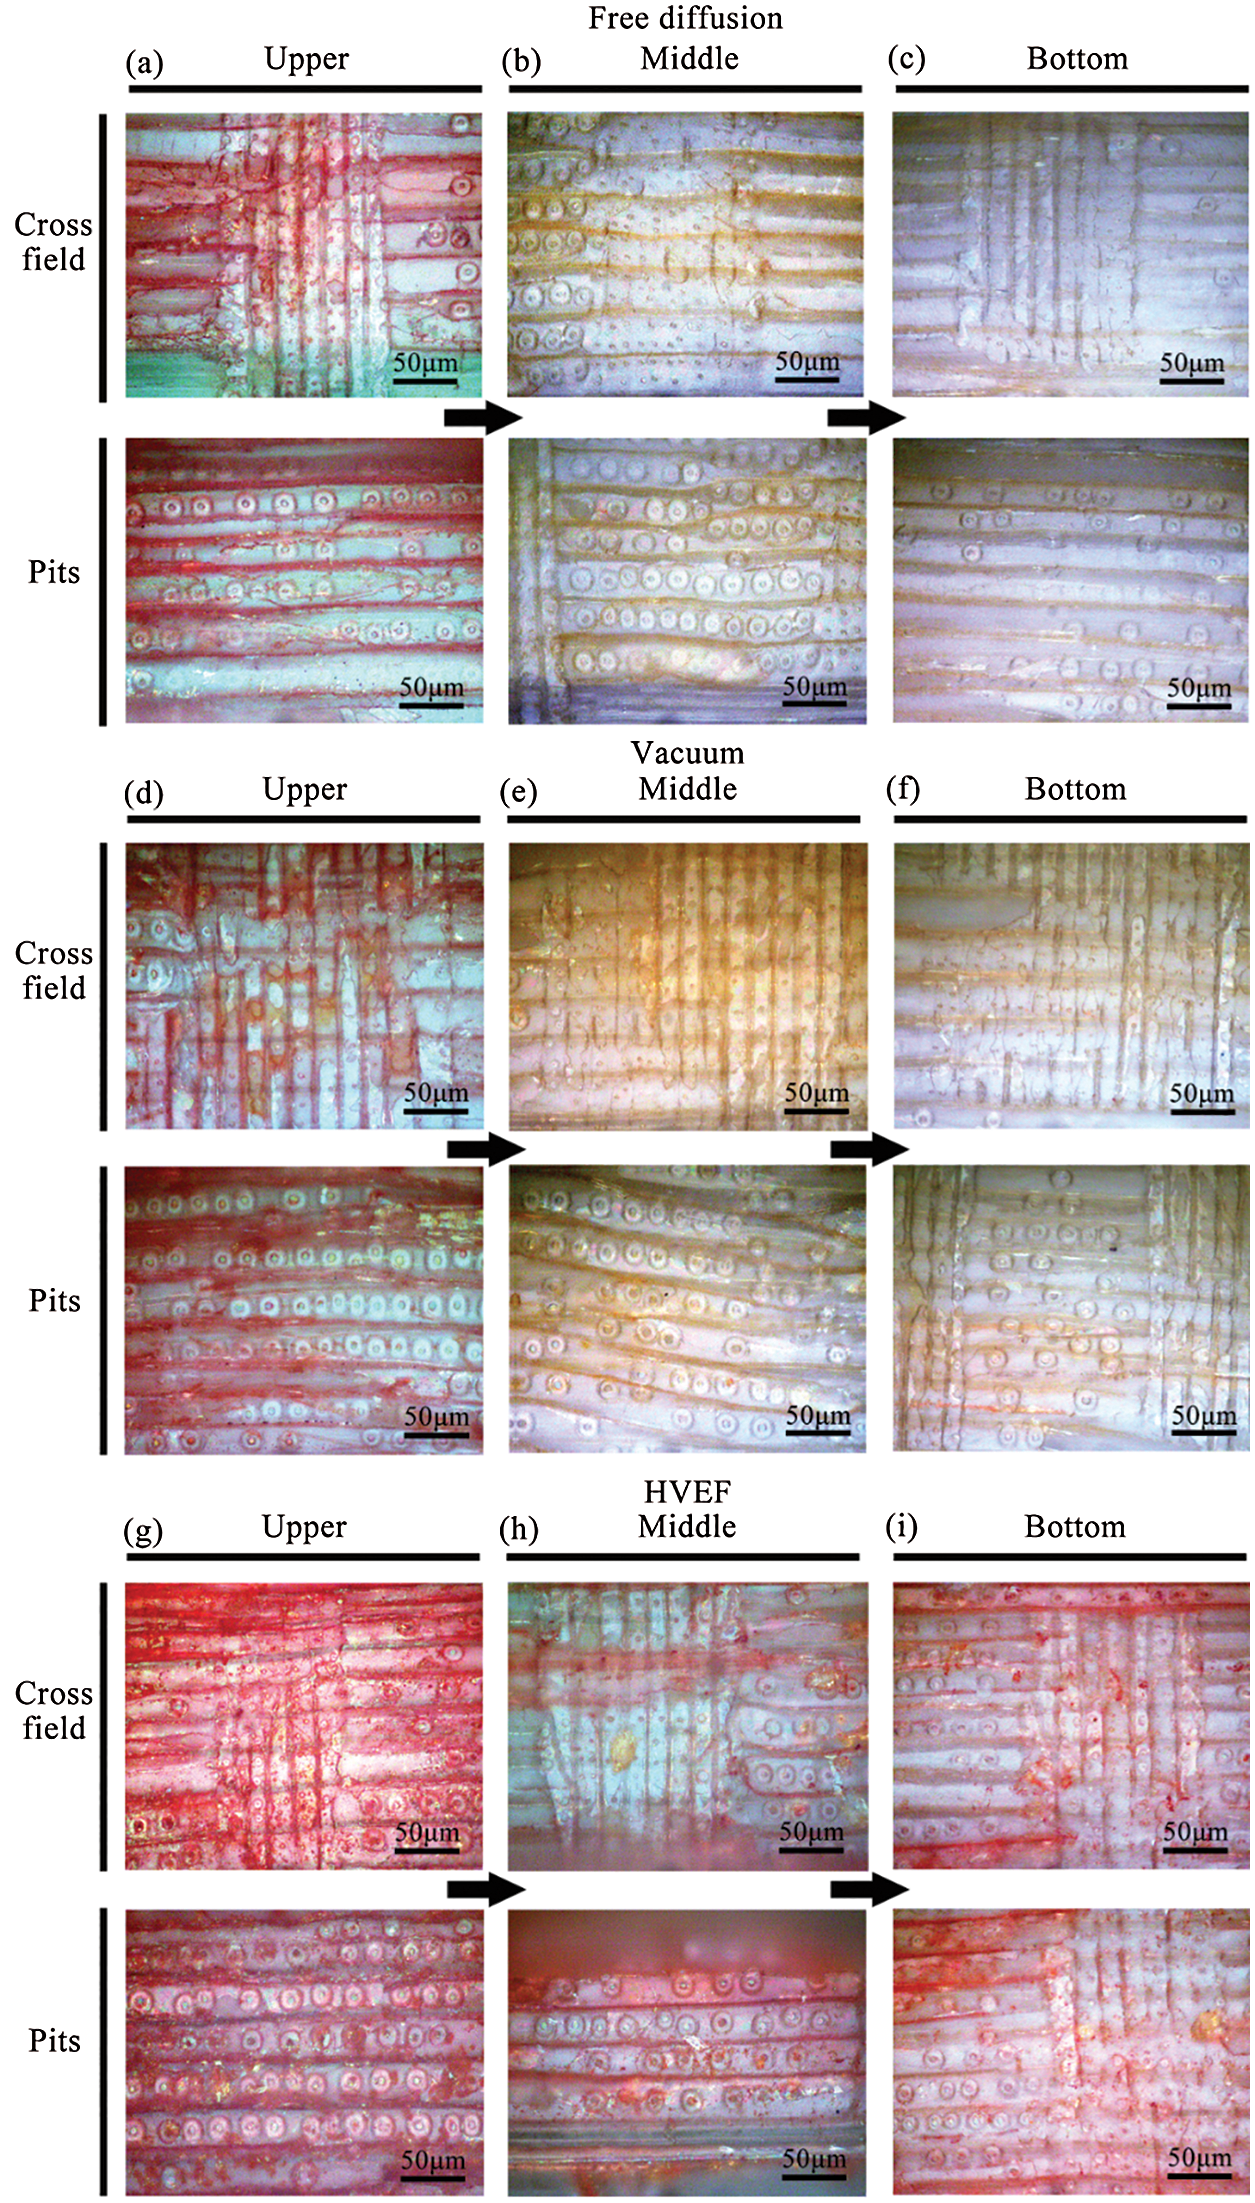
Figure 3: Micro color difference of cross field and pits regions for different treated samples. The micrographs selected from (a) upper, (b) middle and (c) bottom positions on the exposed surface for free diffusion treated samples; from (d) upper, (e) middle and (f) bottom positions for vacuum treated samples; from (g) upper, (h) middle and (i) bottom positions for HVEF treated samples
3.2 Boron Content and Its Reaction with Wood
In addition, treated samples were cut into slices and boron ions content for these slices was investigated in order to further identify the boron distribution for different treated samples. From Fig. 4a, it could be seen that the highest boron content was obtained for upper slices (1–3 mm) for different treated samples and then gradually decreased for other slices ranging from 4 mm to 33 mm. The values of boron content were matched with the color of liquid in the comparison tubes as shown in Fig. 4b with the deepest color for upper slices and gradually faded ones for other slices.
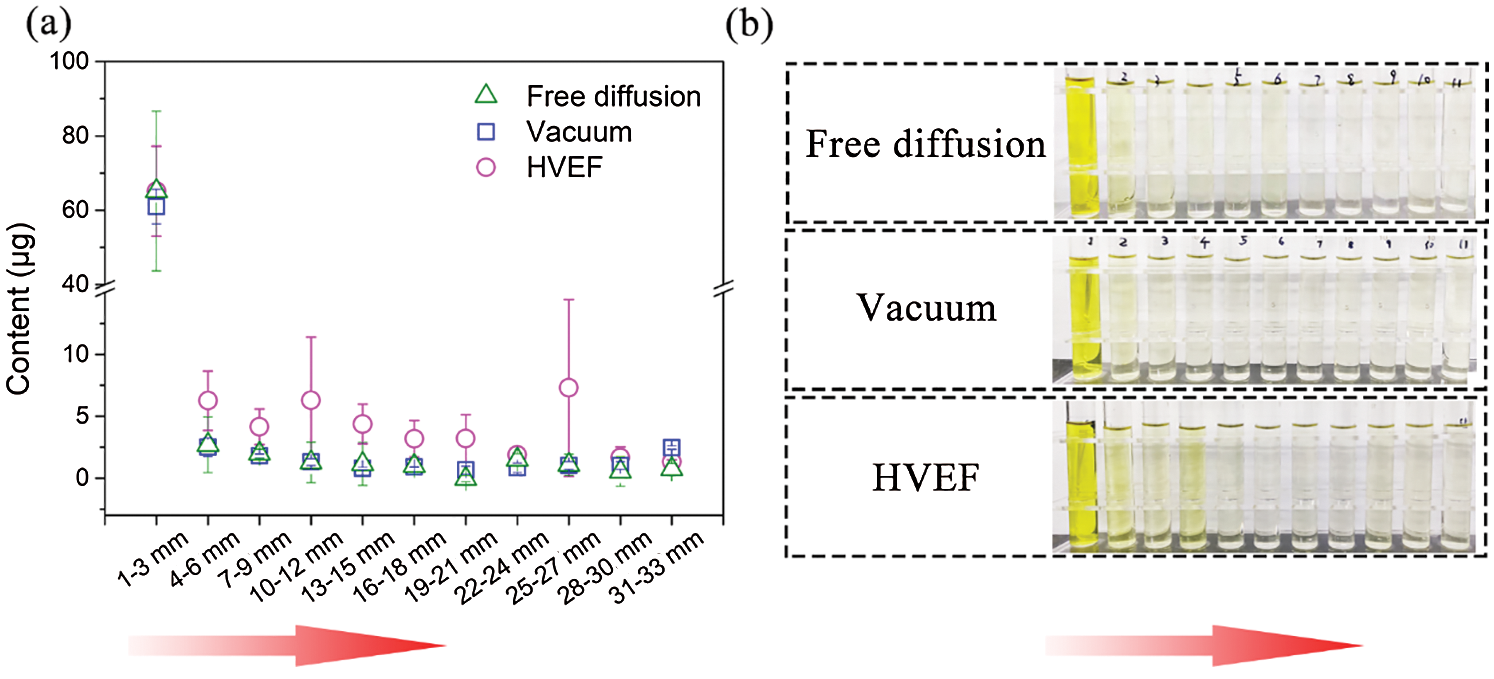
Figure 4: (a) The boron contents of the slices along the transverse direction for different treated samples. (b) Liquid in the comparison tubes used for detecting boron content from the slices along the transverse direction of different treated samples
For free diffusion and vacuum treatments, higher standard deviation of boron content was obtained along the 1–3 mm range for free diffusion samples as compared to other treatments and this indicated that the upper position exhibited a higher extent of non-uniformity. Moreover, no obvious boron content was found along the direction of depth of wood samples except for some found at the upper layers. For HVEF treated samples, significant higher boron content was observed along the direction height of the wood samples as compared to samples treated with other treatment methods. Furthermore, high value of standard deviation of boron contents were observed for the slices at the 4–27 mm range and this result indicated that the boron ions were still not distributed evenly along the height of the wood samples. This result was of great significance owning to the fact that boron ions penetrated into wood via various pathways including void spaces of adjacent tracheid, compound middle lamella, the cell wall of tracheid and bordered pits and the position of wood pits, wood ray cells. The number of pits along transverse direction of wood structure were uncertain as stated in the previous study. Besides, the normal pits and aspirated pits involved in tracheid play a significant role in wood flow penetration as well [22]. These micro-structure characteristics led to indirect penetration paths for boron ions along transverse direction and nonuniform flow resistance for ions permeating into these anatomical structures [23]. These results were further confirmed to be true as they were consistent with the parameters of color difference investigation and the distribution pattern of boron ions in micro-structure of wood for various treated samples.
Except for the boron distribution in wood microstructure, the reaction of boron ions with chemical groups of wood fiber was also investigated using FTIR measurement for treated samples under free diffusion, vacuum and HVEF treatment methods, respectively (Fig. 5). From the figure, O–H and C–H stretching vibration bands at 3344 cm−1 and 2896 cm−1 could be observed which could be attributed to cellulose and hemicellulose, respectively [24]. For the upper surface layer, these peaks were significantly decreased after being treated with boron solution as compared to those in the controlled samples. This result was due to the fact that the boron which covered the wood surface reacted with chemical groups in the wood [25]. The same phenomenon was observed for lignin chemical bands as shown by the stretching vibration bands of C=O at 1733 cm−1 and 1646 cm−1 attributed to xylan acetyl group and conjugated carbonyl groups in lignin. The peak of C=C at 1512 cm−1 was attributed to vibration in the carbon skeleton of the benzene ring in lignin. The bands of C–H, C=C at 1452 cm−1 and C–C at 1422 cm−1 were attributed to the skeletal vibration of benzene ring in lignin and the peak of C–O at 1317 cm−1 attributing to the syringyl derivative of lignin. Decreased peaks were obtained as well including the bending vibration band of C–H at 1370 cm−1 and stretching vibration band at 1263 cm−1 attributed to cellulose and hemicellulose, and the bending vibration band of C–H at 896 cm−1 attributed to the cellulose. Futhermore, no significant variation for these peaks was observed for the middle and bottom layers selected from the free diffusion or vacuum treated samples (Figs. 5a and 5b) while decreased peaks were obtained as well for the other two layers for HVEF treated samples (Fig. 5c). These results were further verified that the boron ions permeated in the wood structure under the accelerated migration effect of HVEF treatment and these results were consistent with the boron distribution as investigated in microscopy measurement.
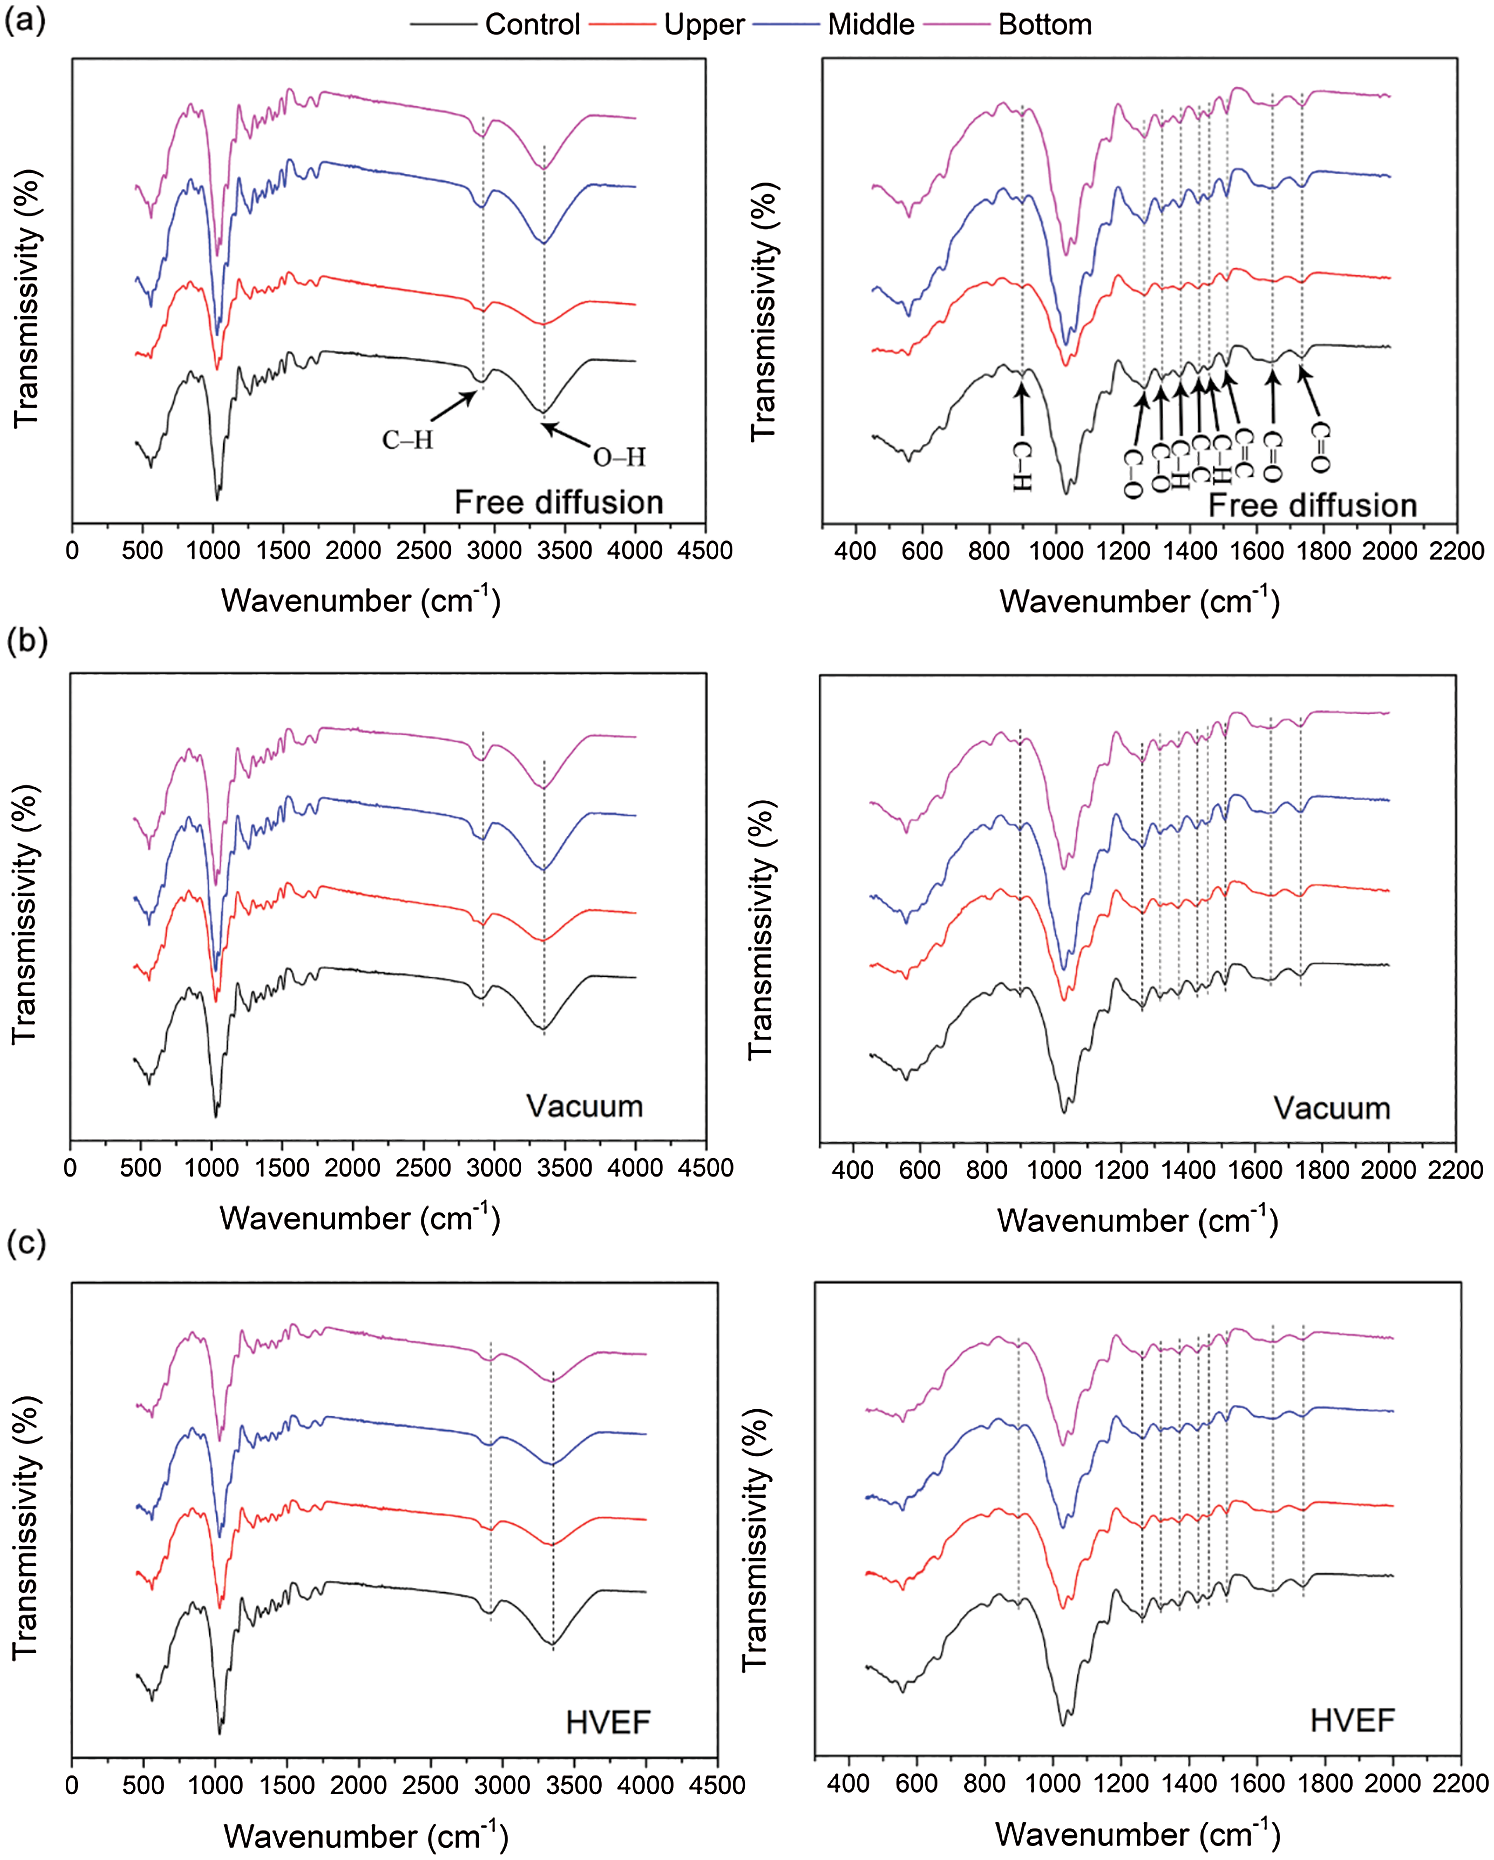
Figure 5: FTIR measurement for different treated samples selected from upper, middle and bottom layers and compared with the control. The scanning ranges of 450∼4000 cm−1 and 450∼2000 cm−1 for (a) free diffusion, (b) vacuum and (c) HVEF treated samples
The leaching property of boron treated samples were conducted in this study as shown in Fig. 6. According to the standard, the boron treated samples were immersed in distilled water and leachate was collected at different time intervals including 30 min, 6 h, 24 h, 48 h–336 h. The boron content in leachate was measured for these samples as shown in the figure. During the 30 min vacuum immersion, most of the boron leached from treated samples while higher boron content was obtained for vacuum and HVEF treated samples. After 6 h, the boron content in leachate was significantly lower for various treated samples. No significant variations of boron content in leachate were found for free diffusion, vacuum and HVEF treated samples. This result indicated that the boron accelerated migration into wood microstructure under HVEF treatment has an inapparent effect on the leaching behaviour of wood treated samples. Thus, it is of great significance to decrease the leaching properties for HVEF treated samples in future research.
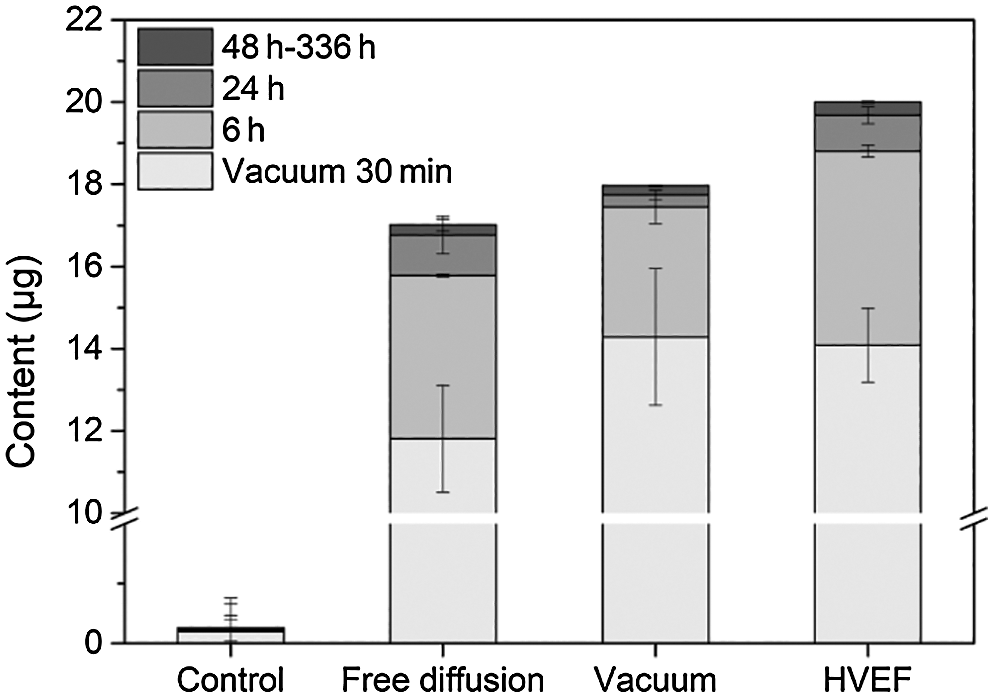
Figure 6: Boron content in leachate measured for free diffusion, vacuum and HVEF treated samples and compared with the control. The leachate collected after samples immersion in distilled water of 30 min (vacuum), 6, 24 and 48–336 h
3.3 Mechanical Properties and Fungistatic Measurement
As stated in previous study, methods of wood modification would have varying negative effects on their mechanical properties. Therefore, in this study, the mechanical properties were investigated for boron treated samples under free diffusion, vacuum and HVEF treatments and compared with the controlled samples (without boron treatment). As shown in Fig. 7a, the hardness was measured for different samples and no obvious variations at the level of p < 0.05 were obtained for boron treated samples as compared with the controlled samples. In addition, the compression modulus of elasticity and compression strength were obtained for boron treated samples and compared with those of the controlled samples (Figs. 7b and 7c). Variations were observed for boron treated samples under different treatments as compared to the controlled samples, but these variations were not significant compared to the controlled samples with the value of p < 0.05. The variations of compressive modulus of elasticity and strength for vacuum treated samples were attributed to the cell lumen deformation during air extraction which was similar to the result observed in previous study [26]. No reduction in compressive modulus of elasticity and strength was observed for HVEF treated samples regardless of whether the samples were taken from upper or bottom positions.
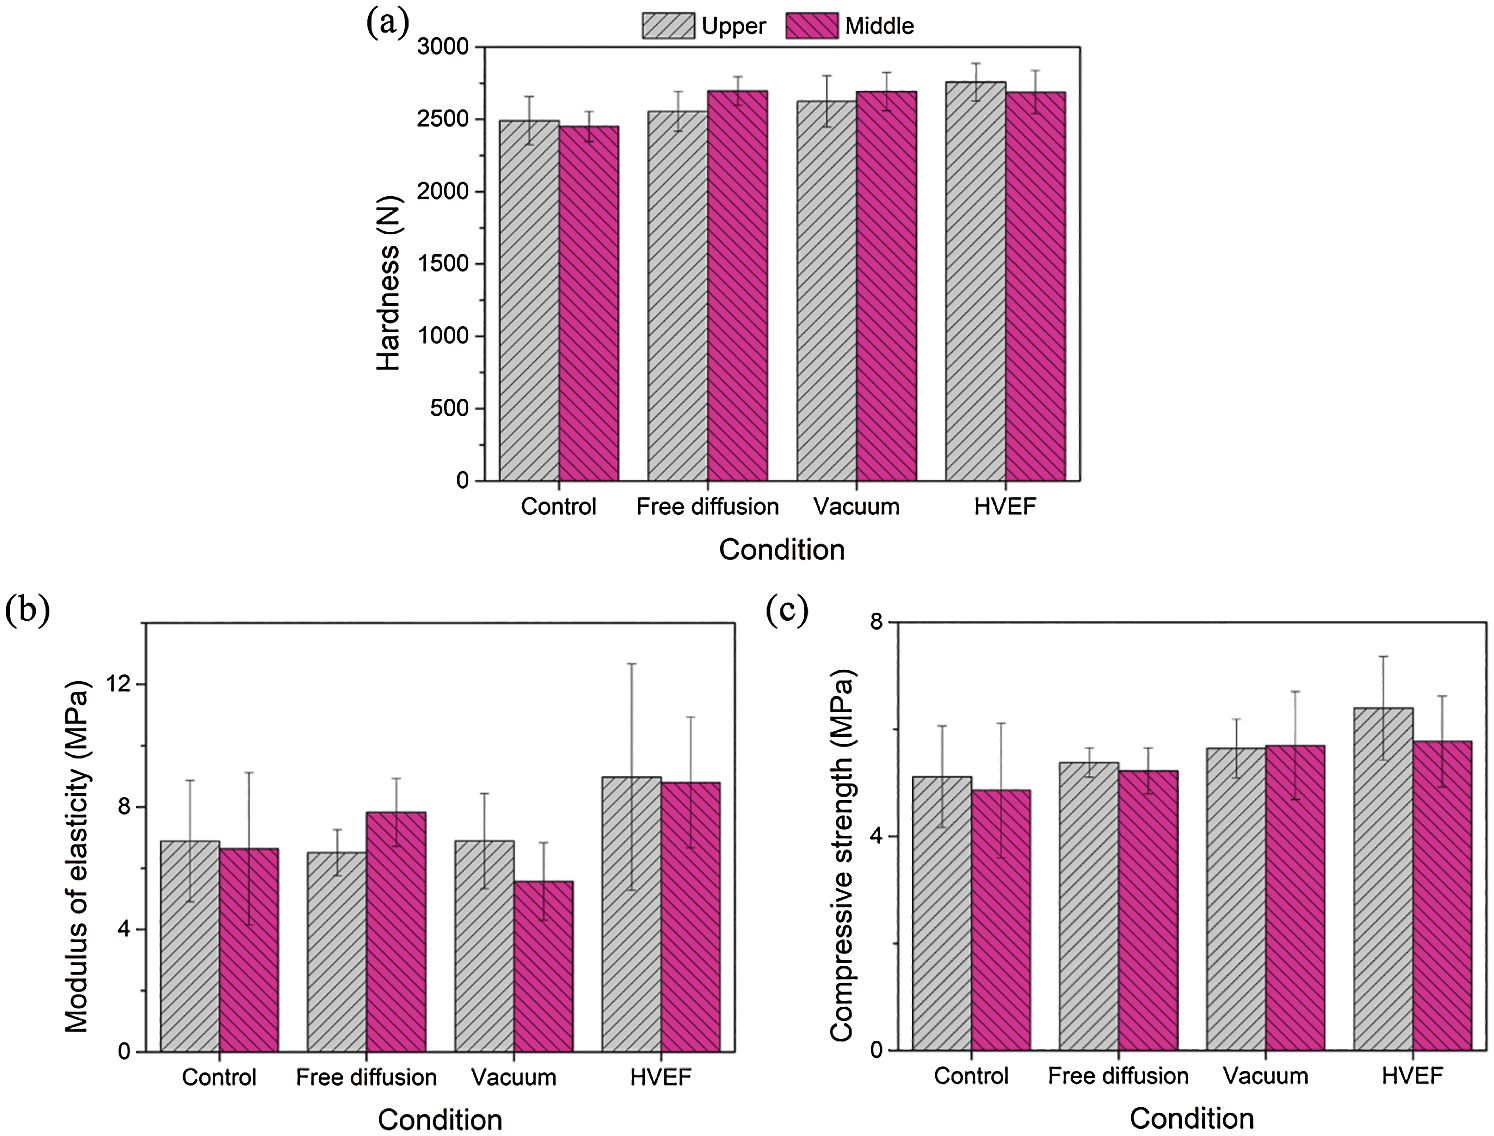
Figure 7: Hardness, compressive modulus of elasticity and strength for different treated samples and compared with the control. (a) Hardness measurement, (b) compressive modulus of elasticity and (c) compressive strength measurements
In addition, wood fungistatic test was conducted and the duration of exposure for wood samples to fungi was four weeks (Fig. 8). The samples were selected from upper layer (①), middle layer (②) and bottom layer (③) of the treated wood samples for each condition, respectively. The graphs for various treated samples were obtained before and after fungistatic measurement. For free diffusion and vacuum treatments, a high amount of fungi was observed which covered the surface of samples selected from upper, middle and bottom layers. These are owning to the fact that boron treated surface was attached to the culture medium and few boron ions penetrated along transverse direction under free diffusion and vacuum treatments with the labeled surfaces exhibiting low boron content. For HVEF treated samples, no significant quantity of fungi was obtained from the samples according to the graphs and this result was attributed to migration and further penetration of boron into the wood structure as shown above in Fig. 3. The DA and EI were calculated to evaluate the image definition and to quantitatively analyze the fungistatic properties. The different treated samples as well as the controlled groups were all divided into four areas. After exposure to fungi, highly decreased values of DA and EI were obtained for free diffusion and vacuum treated samples. This result was due to the high coverage of fungi on the samples resulting in the label being not clear enough to recognize. Higher values of DA and EI were obtained for different layers of the HVEF treated samples after fungi exposure experiment as compared to other treated samples. This result was attributed to the fact that boron penetrated further into the wood structure under HVEF treatment. Thus, higher extent of fungistatic property were obtained for HVEF treated samples than that obtained from other samples. This result also indicated that increased permeability played a significant role in highlighting the fungistatic property of wood samples.
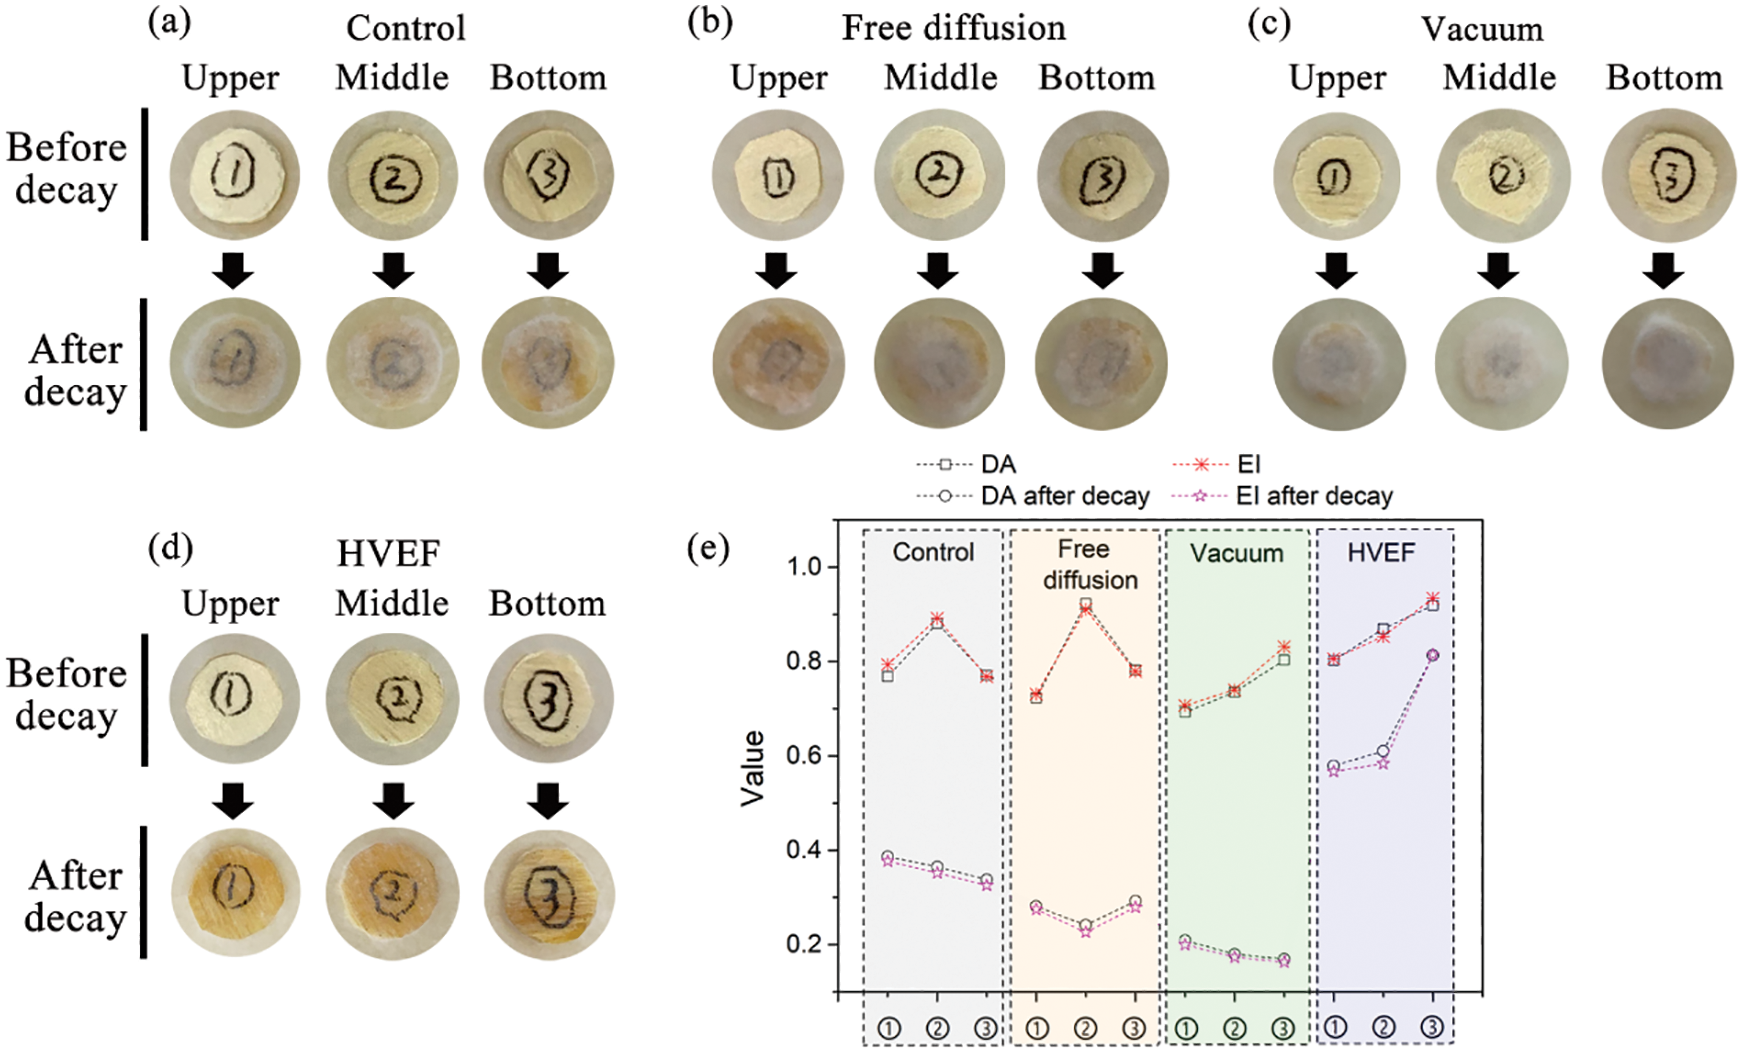
Figure 8: The fungistatic measurement for different treated samples selected from upper, middle and bottom layers labeled as ①, ② and ③ respectively and compared with the control. The graphs for (a) control, (b) free diffusion, (c) vacuum and (d) HVEF treated samples collected before and after exposing to wood white rot fungi for four weeks. (e) Difference absolute (DA) and edge intensity (EI) parameters calculated for different treated samples and compared with the control
From macro-scale, higher permeability of boron along transverse direction was obtained for HVEF treated wood samples with the penetration depth of ≈35 mm and no reduction of compressive modulus of elasticity and strength were found for HVEF treated samples. From micro-scale, higher volume of boron ions penetrated into wood tracheid along transverse direction which filled the void spaces of adjacent tracheid, compound middle lamella, the whole cell wall of tracheid as well as the margo and porus of bordered pits for HVEF treated samples as compared to that in free diffusion and vacuum treated samples. The results of boron content and FTIR measurements along the transverse section were further verified as it was consistent with the multi-scale boron distribution of varied treated samples. Furthermore, higher extent of fungistatic property was obtained for HVEF treated samples than the other treated samples. Thus, it could be concluded that HVEF treatment has a positive effect on boron permeability and the improvement of penetration depth of preservative plays a significant role in wood protection and prolonging the service life of wood construction.
However, the value of standard deviation for boron content along transverse direction was high for HVEF treated samples which indicated that great efforts should be invested in order to further investigate the penetration path and to obtain well-distributed ions along transverse direction. In addition, no significant variation was observed in the leaching property of free diffusion, vacuum and HVEF treated samples. It is also a significant subject for utilization of modified wood in construction to decrease the amount of element leaching from wood samples treated with preservatives.
Funding Statement: The authors would like to express their sincere appreciation for the funding from the National Natural Science Foundation of China (Grant Nos. 32071700 and 31901252) and the National Key R&D Program of China (Grant No. 2018YFD1101002). This study was also supported by the Natural Science Foundation of Jiangsu Province, China (Grant No. BK20180276) and the Natural Science Foundation of the Jiangsu Higher Education Institutions of China (Grant Nos. 18KJB220012 and 20KJB560010).
Conflicts of Interest: The authors declare that they have no conflicts of interest to report regarding the present study.
1. Yusoh, A. S., Tahir, P., Uyup, M. K., Lee, S. H., Husain, H. et al. (2020). Effect of wood species, clamping pressure and glue spread rate on the bonding properties of cross-laminated timber (CLT) manufactured from tropical hardwoods. Construction and Building Materials, 273, 121721. DOI 10.1016/j.conbuildmat.2020.121721. [Google Scholar] [CrossRef]
2. Curling, S., Clausen, C., Winandy, J. (2002). Relationships between mechanical properties, weight loss and chemical composition of wood during incipient brown rot decay. Forest Products Journal, 52, 34–40. [Google Scholar]
3. Henriques, D., Nunes, L., Brito, J. (2010). Development of a penetration test for timber impregnation products for use in old buildings. Construction and Building Materials, 24, 1095–1100. DOI 10.1016/j.conbuildmat.2009.12.034. [Google Scholar] [CrossRef]
4. Shukla, S. R., Zhang, J., Kamdem, D. (2019). Pressure treatment of rubberwood (Heavea brasiliensis) with waterborne micronized copper azole: Effects on retention, copper leaching, decay resistance and mechanical properties. Construction and Building Materials, 216, 576–587. DOI 10.1016/j.conbuildmat.2019.05.013. [Google Scholar] [CrossRef]
5. Lehringer, C., Richter, K., Schwarze, F., Militz, H. (2009). A review on promising approaches for liquid permeability improvement in softwoods. Wood and Fiber Science, 41, 373–385. [Google Scholar]
6. Bailey, P., Preston, R. D. (1969). Some aspects of softwood permeability. I. Structural studies with Douglas fir sapwood and heartwood. Holzforschung, 23(4), 113–120. DOI 10.1515/hfsg.1969.23.4.113. [Google Scholar] [CrossRef]
7. Bailey, P., Preston, R. D. (1970). Some aspects of softwood permeability II. Flow of polar and non-polar liquids through sapwood and heartwood of Douglas fir. Holzforschung, 24(2), 37–45. DOI 10.1515/hfsg.1970.24.2.37. [Google Scholar] [CrossRef]
8. Ahmed, S., Chun, S., Miller, R., Chong, S., Kim, A. J. (2010). Liquid penetration in different cells of two hardwood species. Journal of Wood Science, 57, 179–188. DOI 10.1007/s10086-010-1168-4. [Google Scholar] [CrossRef]
9. Zhang, X., Ning, G., Chen, P., Chen, Z., Wang, Y. et al. (2020). Realizing mechanically robust and electrically conductive wood via vacuum pressure impregnation. ACS Applied Bio Materials, 3(9), 6071–6078. DOI 10.1021/acsabm.0c00667. [Google Scholar] [CrossRef]
10. Oloyede, A., Groombridge, P. (2000). The influence of microwave heating on the mechanical properties of wood. Journal of Materials Processing Technology, 100, 67–73. DOI 10.1016/S0924-0136(99)00454-9. [Google Scholar] [CrossRef]
11. Medina-Gonzalez, Y., Camy, S., Condoret, J. (2012). Cellulosic materials as biopolymers and supercritical CO2 as a green process: Chemistry and applications. International Journal of Sustainable Engineering, 5, 47–65. DOI 10.1080/19397038.2011.613488. [Google Scholar] [CrossRef]
12. Perez-Martinez, C., Perkin, S. (2019). Surface forces generated by the action of electric fields across liquid films. Soft Matter, 15 (21), 4255–4265. DOI 10.1039/C9SM00143C. [Google Scholar] [CrossRef]
13. Tryggvason, G. (2019). Effect of electrostatic forces on the distribution of drops in turbulent channel flows. Physics of Fluids, 31, 104–105. DOI 10.1063/1.5119925. [Google Scholar] [CrossRef]
14. Tabassian, R., Oh, J., Kim, S., Kim, D., Ryu, S. et al. (2016). Graphene-coated meshes for electroactive flow control devices utilizing two antagonistic functions of repellency and permeability. Nature Communications, 7, 13345. DOI 10.1038/ncomms13345. [Google Scholar] [CrossRef]
15. Yun, F., Yu, Z., He, Y., Jiang, L., Wang, Z. et al. (2020). Voltage-induced penetration effect in liquid metals at room temperature. National Science Review, 7, 366–372. DOI 10.1093/nsr/nwz168. [Google Scholar] [CrossRef]
16. Ottosen, L., Block, T. S., Nymark, M., Christensen, I. V. (2010). Electrochemical in situ impregnation of wood using a copper nail as source for copper. Wood Science and Technology, 45, 289–302. DOI 10.1007/s00226-010-0325-7. [Google Scholar] [CrossRef]
17. Christensen, I. V. (2007). Electrokinetic accelerated ingress of boron after surface treatment of wood. Proceedings for the 38th Annual Meeting Jackson Lake LodgeWyoming, USA. [Google Scholar]
18. Ribeiro, A., Mateus, E., Ottosen, L., Bech-Nielsen, G. (2000). Electrodialytic removal of Cu, Cr, and as from chromated copper arsenate-treated timber waste. Environmental Science & Technology, 34, 784–788. DOI 10.1021/es990442e. [Google Scholar] [CrossRef]
19. He, Q., Zhan, T., Zhang, H., Ju, Z., Hong, L. et al. (2020). Facile preparation of high anti-fungal performance wood by high voltage electrostatic field (HVEF). Journal of Cleaner Production, 260, 120947. DOI 10.1016/j.jclepro.2020.120947. [Google Scholar] [CrossRef]
20. Wardrop, A., Davies, G. W. (1961). Morphological factors relating to the penetration of liquids into wood. Holzforschung, 15, 129–141. DOI 10.1515/hfsg.1961.15.5.129. [Google Scholar] [CrossRef]
21. Olsson, T., Megnis, M., Varna, J., Lindberg, H. (2004). Study of the transverse liquid flow paths in pine and spruce using scanning electron microscopy. Journal of Wood Science, 47, 282–288. DOI 10.1007/BF00766714. [Google Scholar] [CrossRef]
22. Usta, I., Hale, M. (2006). Comparison of the bordered pits of two species of spruce (Pinaceae) in a green and kiln-dried condition and their effects on fluid flow in the stem wood in relation to wood preservation. Forestry, 79, 467–475. DOI 10.1093/forestry/cpl011. [Google Scholar] [CrossRef]
23. Burridge, H., Wu, G., Reynolds, T., Shah, D. U., Johnston, R. et al. (2019). The transport of liquids in softwood: Timber as a model porous medium. Scientific Reports, 9, 20282. DOI 10.1038/s41598-019-55811-6. [Google Scholar] [CrossRef]
24. González-Peña, M. M., Hale, M. (2010). Rapid assessment of physical properties and chemical composition of thermally modified wood by mid-infrared spectroscopy. Wood Science and Technology, 45, 83–102. DOI 10.1007/s00226-010-0307-9. [Google Scholar] [CrossRef]
25. Shin, W., Calder, S., Ugurlu, O., Girshick, S. (2011). Production and characterization of boron nanoparticles synthesized with a thermal plasma system. Journal of Nanoparticle Research, 13, 7187–7191. DOI 10.1007/s11051-011-0633-3. [Google Scholar] [CrossRef]
26. Blanchet, P., Kaboorani, A. K., Bustos, C. (2016). Understanding effects of drying methods on wood mechanical properties at ultra and cellular levels. Wood and Fiber Science, 48, 117–128. [Google Scholar]
 | This work is licensed under a Creative Commons Attribution 4.0 International License, which permits unrestricted use, distribution, and reproduction in any medium, provided the original work is properly cited. |