| Journal of Renewable Materials |
DOI: 10.32604/jrm.2021.017377
ARTICLE
Green Method, Optical and Structural Characterization of ZnO Nanoparticles Synthesized Using Leaves Extract of M. oleifera
1Facultad de Química e Ingeniería Química, Universidad Nacional Mayor de San Marcos, Lima, 15081, Perú
2Centro de Investigaciones Tecnológicas, Biomédicas y Medioambientales, Universidad Nacional Mayor de San Marcos, Lima, 15081, Perú
*Corresponding Author: José Vulfrano González-Fernández. Email: fanogf@gmail.com
Received: 08 May 2021; Accepted: 21 June 2021
Abstract: ZnO nanoparticles (ZnO-NP) present innovative optical, electrical, and magnetic properties that depend on specific characteristics, e.g., size, distribution, and morphology. Thus, these properties are essential to address various applications in areas such as electronics, medicine, energy, and others. In addition, the performance of this ZnO-NP depends of their preparation which can be done by chemical, physical, and biological methods. Meanwhile, nowadays, the main interest in developing ZnO-NP synthesis through biological methods bases on the decrease of use of toxic chemicals or energy applied to the procedures, making the process more cost-effective and environmentally friendly. However, the large-scale production of nanoparticles by green synthesis remains a big challenge due to the complexity of the biological extracts used in chemical reactions. That being the case, the preparation of ZnO-NP using Moringa oleifera extract as an alternative biological agent for capping and reduction in synthesis was evaluated in this work. Then, the results based on the analysis of the optical and structural characterization of the ZnO-NP obtained by employing UV-Vis, DLS, zeta potential, XRD, ATR-FTIR, and FE-SEM indicate mostly the presence of spherical nanosized material with a mean hydrodynamic diameter of 47.2 nm measured by DLS and a mean size diameter of 25 nm observed with FE-SEM technique. Furthermore, in FE-SEM images a homogeneous dispersion and distribution is observed in the absence of agglutination, agglomeration, or generation of significant lumps of the ZnO-NP. The XRD analysis showed that heat annealing induced the crystallite size favoring their monocrystallinity. Those obtained data confirm the synthesis of ZnO-NP and the absence of impurities associated with organic compounds in the annealed samples. Finally, those results and low-cost production present to the synthesized ZnO-NP by this biological method as a useful material in several applications.
Keywords: ZnO nanoparticles; green chemistry; Moringa oleifera extract; optical characterization; structural characterization
In recent years, the ZnO compound has been widely studied and it is usually described as a strategic, functional, versatile, and promising inorganic material with a broad range of applications [1,2]. ZnO is an n-type semiconductor member of the II–VI family characterized by a direct bandgap in the near UV spectrum at room temperature (~3.3 eV). ZnO crystallizes in the wurtzite, zinc blende, and rock-salt structures depending on the synthesis method, precursors, and experimental conditions [3,4]. This material also exhibits a high exciton binding energy of 60 meV compared with the thermal energy (26 meV) at room temperature. Also, it has intrinsic and unique properties such as stability at high temperatures, piezoelectricity, conductivity, a broad range of radiation absorption, chemical compatibility, durability, among others [5,6].
In general, nanoparticles exhibit new or improved properties that are supported by specific characteristics such as size, distribution, and morphology [7]. Furthermore, unlike their bulk counterparts, nanoparticles have a reduced size associated with high surface/volume ratio values that increase as the size of the nanoparticles decreases, making the particles highly reactive with prominent physical properties [8]. By combining ZnO material with the low dimensional scale, new properties of ZnO nanoparticles (ZnO-NP) are achieved. Several applications have been discovered or innovated over decades in different areas as renewable energy [9], biomedicine [10], sensing [11], construction and food industry [12,13], electronics [14], pharmaceutical [15], environmental sustainability [16], materials [17], agriculture [18], among many others.
Nanoparticles can be obtained using different techniques based on chemical (coprecipitation, sol-gel, chemical reduction, electrochemical, microemulsion, pyrolysis, photochemical, sonochemical, solvothermal, among others) [19–21], physical (milling, arc discharge, electron beam lithography, spray pyrolysis, ion implantation, laser ablation, inert gas condensation, mechanical grinding, vapor-phase plasma, ultrasonic irradiation, among others) [22–24] or biological (using extracts of plants, algae, microorganisms, enzymes, biomolecules or agro-industrial wastes, among others) [7,25,26] methods.
For chemical synthesis, a common method to obtain ZnO-NP is coprecipitation. By this method, it is possible to obtain a wide range of nanoparticle diameters and morphologies. Coprecipitation is considered an easy, cost-effective, and convenient technique because it does not require complex process parameters, any expensive and sophisticated equipment, or any large space area for the set-up [27]. Semiconductor nanoparticles, based on ZnO material, obtained by this method are usually applied in technology due to their high crystallinity and optical properties. In contrast, some chemical materials related to this technique are usually non-eco-friendly compounds, also the cost of these high-quality nanoparticles could be unnecessary for ‘simple’ applications, for example, in agriculture. In this case, the effective surface area of nanosized material is the desired property; the nanoparticle crystallinity has not a big influence when it is used as nanofertilizer, for instance [28].
In the case of physical methods, the mechanochemical synthesis or milling is frequently used to produce nanomaterials. In this method, mechanical energy is used to grind down powders by colliding balls with the powder due to the rapid rotation of the mill. High-energy ball milling is used over bulk powders to obtain smaller and more uniform sizes, even at the nanoscale [29]. During this procedure, the mechanochemical process occurs during repeated collisions, whereby mechanical energy is used to activate chemical reactions, which means it is a solvent-free synthesis method. ZnO-NP are also obtained by this method obtaining a wide range of nanoparticle diameters and good crystallinity but limited morphologies [30]. Despite the fact that it is a solvent-free synthesis, the mechanical process and sometimes the temperature annealing demand a high energy consumption making it not eco-friendly enough.
On the other hand, biological synthesis is considered an eco-friendly process to obtain ZnO-NP, which has arisen as a green alternative for the synthesis of nanomaterials. While chemical and physical methods may lead to high energy consumption a high temperature or pressure is required in the process [31,32].
The main interest in developing ZnO-NP synthesis through biological methods has its basis on the low (or null) use of toxic chemicals and/or energy applied to the procedures, which makes the process more cost-effective and environmentally friendly. Plants (leaves, flowers, seeds, peels, or roots) are the most important and strategic resource for the ZnO-NP biosynthesis because other bioresources as fungi or microbes require sterilization processes or controlled conditions for their cultivation. The importance of this method, by using plant-based extracts to produce metal and oxide nanoparticles has been widely reported [33–35].
For biological synthesis, the natural extracted aqueous solution contains essential phytochemical compounds for the formation of the particles at nanoscale acting as capping and reducing agents transforming metal ion to metal oxides. Depending on the part of the plant, different functional groups as flavonoids, vitamins, polysaccharides, amino acids, alkaloids, among others, appear in the aqueous extract that, being used as the reaction solvent, significantly alters the chemical dynamics of the synthesis and, consequently, the type of nanoparticles as a product. By using extract leaves, in the particular case of the Moringa oleifera, ZnO-NP with spherical symmetry is obtained by this method. This plant has, mainly, flavonoids (quercetin, kaempferol, myricetin), vitamins (L-ascorbic acid, retinol, niacin), glucosides (flavanol glucoside, benzoic acid glucosides, benzaldehyde 4-O-β-glucoside), phenolic acid (ellagic acid, gallic acid, chlorogenic acid, caffeic acid) [36–39], being flavonoids and phenolic acids the most important compounds of Moringa oleifera in the role of the reduction process to synthesize ZnO-NP. Since organic compounds are used in the process, the temperature treatments of leaves, drying and extracting processes, result as an important factor to control.
The large-scale production of nanoparticles by green synthesis remains a big challenge due to the complexity of the biological extracts used in chemical reactions. The mechanisms of formation during the nanoparticle synthesis is still be an important topic to be elucidated when they are produced at industrial quantities [40,41].
In this work, the methodology for obtaining ZnO-NP using Moringa oleifera extract as an alternative agent for capping and reduction in synthesis is presented. Additionally, the analysis of the optical and structural characterization of the ZnO-NP obtained employing the ultraviolet–visible absorption spectroscopy (UV-Vis), dynamic light scattering (DLS), zeta potential, X-ray diffraction spectroscopy (XRD), Fourier transform infrared spectroscopy (ATR-FTIR), and field emission scanning electron microscopy (FE-SEM) are presented.
2.1 Preparation of the Extracts
The leaves of Moringa oleifera were produced by local farmers in the central and north coast from Peru and they were acquired in a small traditional market in Lima. Dry leaves of the Moringa oleifera plant were washed several times with tap water, rinsed with distilled water, and dried at 40°C in an air-fluxed oven to remove moisture.
The extract used for the reduction of zinc ions (Zn2+) to ZnO-NP was prepared by placing 13 g of fine cut leaves in 500 mL glass beaker along with 400 mL of ultrapure water (18.2 MΩ·cm) at 50°C by 2 h under magnetic stirring (500 rpm), and a light-yellow aqueous solution was obtained. The extract was let to cool at room temperature and to be vacuum-assisted filtered by using a medium flow Whatman filter paper No. 1 (11 µm pore diameter) to avoid organic solid remains. The extract was stored in a refrigerator to be used for further experiments.
2.2 Green Synthesis of ZnO Nanoparticles
For the ZnO-NP synthesis (summarized in Fig. 1), 100 mL of Moringa oleifera leaves extract was taken in a 250 mL glass beaker and heated to 70°C using a magnetic stirrer-heater at 500 rpm. When extract temperature reached 70°C, 3.3 g of Zn(NO3)2 · 6H2O (zinc nitrate hexahydrate, purum p.a., purchased from Sigma Aldrich) was added as the precursor. The pH of the mixture was monitored at the beginning of the reaction with a Hanna Instruments model Edge HI2020 pH-meter, 4.5 was obtained. This mixture was heated and stirred for 2 h. A yellow precipitation appeared at the bottom of the beaker, which was collected and heated at 70°C in an oven until completely dry. A light brown colored paste was obtained, and this was collected, grinded, and crushed with a mortar and pestle. Then, this powder was placed in an air muffle furnace at 600°C for 2 h of annealing to obtain white powder ZnO-NP. The sample was also mashed in a mortar-pestle and sieved to get a finer nature for characterization by using different techniques.
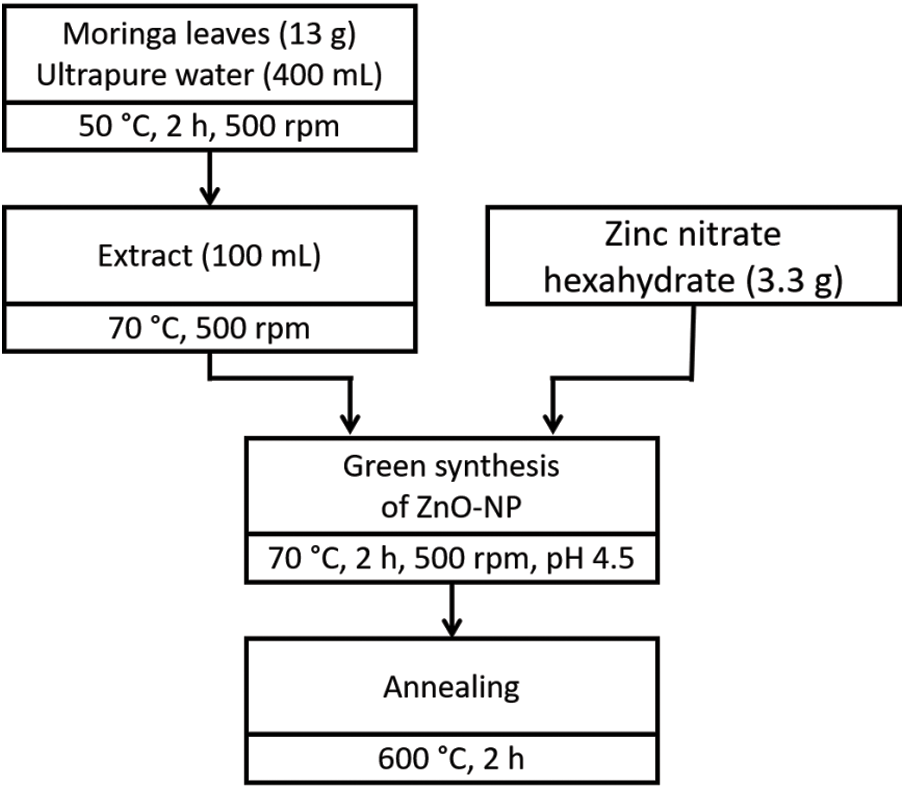
Figure 1: Summarized flowchart of green synthesis ZnO nanoparticles
2.3 Characterization of ZnO Nanoparticles
2.3.1 Ultraviolet–Visible Absorption Spectroscopy (UV-Vis)
The green synthesized ZnO-NP were confirmed and optically characterized by using a UV-Visible spectrophotometer (Libra S22, Biochrom, Ltd., Cambridge, England). Synthesized nanopowders were dispersed in 5 ml of ultrapure water (18.2 MΩ·cm) and they were sonicated for 10 min at room temperature to guarantee a powder dispersion in the solution. The absorption spectra were recorded in the wavelength range of 200–800 nm (Step 1 nm). The UV–Vis characterization gives us the insight on the actual formation of nanoparticles by a surface plasmon resonance effect.
The bandgap energy of semiconductors (including nanosized materials as films or structured particles) can be estimated by different methods and approximations. In this work we are using the Tauc relation [42] to study the optical bandgap of ZnO-NP:
where
2.3.2 Dynamic Light Scattering (DLS) and Zeta Potential
The average size and dispersion of ZnO-NP were evaluated through dynamic light scattering (also called photon correlation spectroscopy or PCS) measured with a NICOMP Nano Z3000 System, which provides extreme versatility and high sensitivity. DLS is a widely used technique for the determination of particle size in an aqueous medium. The light scattered by nanoparticles in suspension will fluctuate with time and can be related to the particle diameter [43]. Measurement was done using a solid-state He–Ne laser at a wavelength of 632.8 nm with a 4.0 mW at 23°C.
Average diameters were obtained with the software provided by NICOMP (ZPW 388-V2.18). The light scattering from the Brownian-motion of the ZnO nanoparticles causes photon count fluctuations on the detector. Then, a correlation function is created to determine the translation diffusion coefficient D. The Stokes-Einstein equation is used to calculate the spherical particles of radius R:
where
Furthermore, in the same instrument, the zeta potential method was used to measure the electrostatic potential of the ZnO-NP surrounded by an aqueous medium, usually ultrapure water. Nanoparticles with a zeta potential between −10 and +10 mV are considered neutral. On the other hand, nanoparticles out of the range −30 to 30 mV are considered strongly anionic and cationic, respectively [44].
2.3.3 X-Ray Diffraction Spectroscopy (XRD)
The synthesized ZnO-NP were structurally characterized by using a Rigaku MiniFlex/600 X-ray diffraction instrument, Japan. XRD operates at 30 kV with a current of 15 mA using Cu-Kα radiation (1.540598 Å wavelength) over a wide range of Bragg’s angles (5 to 80, 2θ degree). The average crystallite size (
where
The interplanar or reticular distance (
where
Average lattice parameters (a, c), of the ZnO-NP hexagonal crystal system, were calculated by using the equation:
where
2.3.4 Attenuated Total Reflection-Fourier Transform Infrared Spectroscopy (ATR-FTIR)
The FTIR measurement was carried out to identify the presence of characteristic bands of the ZnO products, and residues remaining before and after the thermal treatment. It was performed by using a Shimadzu IRTracer-100 spectrometer, Japan. Functional groups presence in the mid-infrared region (within the range of 400 to 4000 cm−1) were revealed in both samples, unannealed and annealed ZnO-NP. The samples were used in solid form. The Pike MIRacle single reflection horizontal ATR accessory equipped with a ZnSe ATR crystal was used for the analysis. ATR mode was used for recording the data.
2.3.5 Field Emission Scanning Electron Microscopy (FE-SEM)
Scanning electron microscopy analysis was used to determine the size and surface morphology of the synthesized ZnO-NP. FE-SEM characterization was carried out by using a FE-SEM, Hitachi Regulus 8230, Hitachi High-Tech Co., Japan. The instrument was operating at an accelerating voltage of 3.0 kV and the obtained images were taken at a constant magnification of 40.0 kX. The sample studied did not require any preparation for measurement, as is often experimentally necessary.
The UV–Vis spectrum (shown in Fig. 2) revealed a characteristic absorption peak of ZnO-NP at the wavelength of 361.5 nm. It indicates that ZnO-NP displays, at room temperature, an excitation absorption due to their large excitation binding energy. Furthermore, the absorption peak position confirms the blue-shift spectra with concerning the bulk at 377 nm [45]. Quantum confinement of electrons in the semiconductor, due to the nanoscale, confirms the bandgap increase caused by ZnO-NP formation biosynthesized via leaf extract of Moringa oleifera.
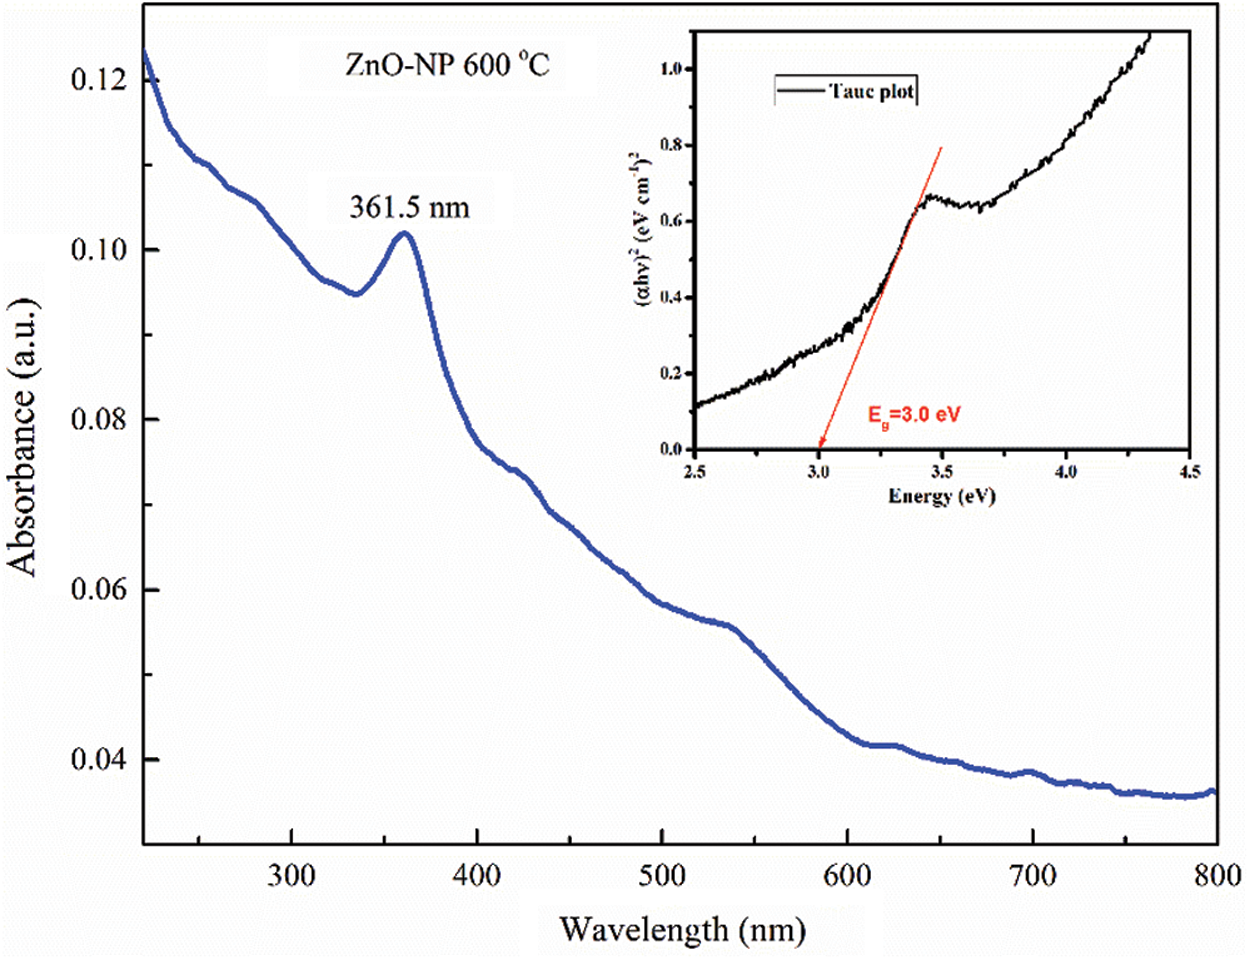
Figure 2: UV-Visible absorption spectroscopy of green synthesis ZnO-NP annealed at temperature of 600°C
To determine the optical bandgap of ZnO-NP, the optical absorption edge energy must be considered since it represents the minimum energy required to excite an electron from the highest occupied molecular orbital in the valence band to the lowest unoccupied molecular orbital in the conduction band [46]. It could be obtained by implementing the Tauc plot method based on Eqs. (1) and (2). In this case, the standard thickness of the cuvette used in UV-Vis instrument of 1 cm as
This Tauc relation was plotted in Fig. 2 (inset). By simple observation, the intersection of the slope with the abscissa axis determines the bandgap of the material. In our case, an optical bandgap energy of 3.0 eV for ZnO-NP was found. It could be noted that this energy is lower than optical bandgap energy of ZnO bulk material (~3.3 eV). It could be associated with crystal defects, stress, or a nonstoichiometric phase in the nanoparticles caused by oxygen vacancies, for instance [47,48].
In Tauc plot method, shown in Fig. 2 (inset), the Urbach tail region could be observed. This line shape region is very sensible to structural and chemical defects contributing in the determination of band-to-band transition by rising the tail. It usually causes large errors when bandgap energy is analyzed by Tauc method. Despite this, important information could be obtained about the synthesized ZnO-NP sample, for example a high possibility of not getting a perfect crystal (or crystallite) via green synthesis by using Moringa oleifera leaves extract. This could be relevant when nanoparticles are used in technology, but not in agriculture as fertilizers, for instance.
3.2 DLS and Zeta Potential Analysis
The size distribution image obtained by DLS of green synthesized ZnO-NP is shown in Fig. 3. DLS analysis shows that the calculated average particle size distribution of these nanoparticles is 47.2 nm and the corresponding standard deviation is 3.2 nm. Furthermore, particle size distribution by number indicates that 99.1% of the ZnO-NP corresponds to the previously described nanoparticles. Several applications of nanoparticles need to guarantee a tight distribution of small nanoparticles because larger particles tend to agglomerate to a greater degree resulting in sedimentation. However, this phenomenon cannot be avoided, and the agglomerates are usually termed as secondary particles. Usually, particle diameter measured by DLS is larger than the ones obtained by other methods. ZnO-NP dispersed in ultrapure water do not keep their primary particle size because the attractive force between particles [43]. Also, the DLS technique obtains a hydrodynamic diameter based on the diffusion of the particles.
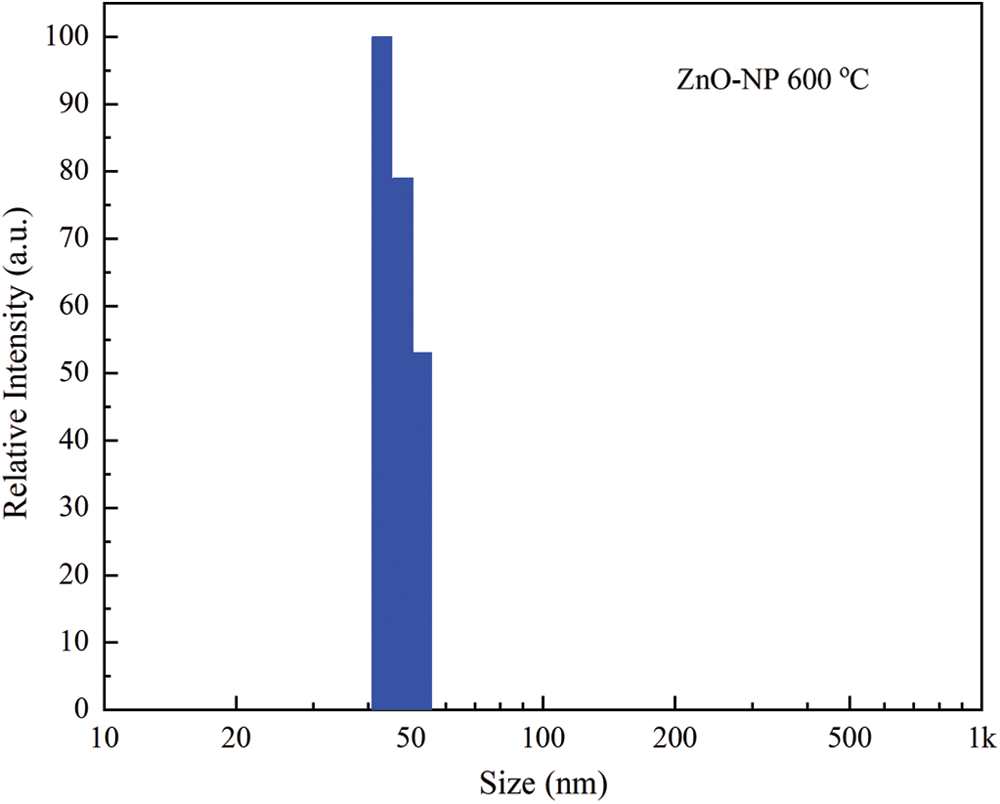
Figure 3: Dynamic light scattering particle size distribution by number-weighted of green synthesis ZnO-NP annealed at 600°C
As mentioned previously, the magnitude of the zeta potential indicates potential stability of ZnO-NP in an aqueous medium. For the sample annealed at temperature of 600°C, the zeta potential value was −29.73 mV (see Fig. 4), which indicates that the particles have a high stability, in this case ZnO-NP in ultrapure water.
In a lot of cases, the ZnO-NP have been used in an aqueous medium, resulting the zeta potential characterization of a primary indicator of surface charge. For example, in nanotoxicology ZnO-NP have been commonly utilized as a biological agent to control complex processes [49]. The initial nanoparticle size is important besides their final condition. This size nanoparticle stability is usually controlled by changing pH conditions to avoid agglomeration induced by solvation forces, van der Waals forces, electrostatic attractions, or/and hydrophobic interactions [50]. Zeta potential measurements bigger than +/−30 mV reveal suitable material avoiding pH control in solutions, for instance. ZnO-NP biosynthesized presented in this work exposes an appropriate nature to be applied in similar cases as the above mentioned.
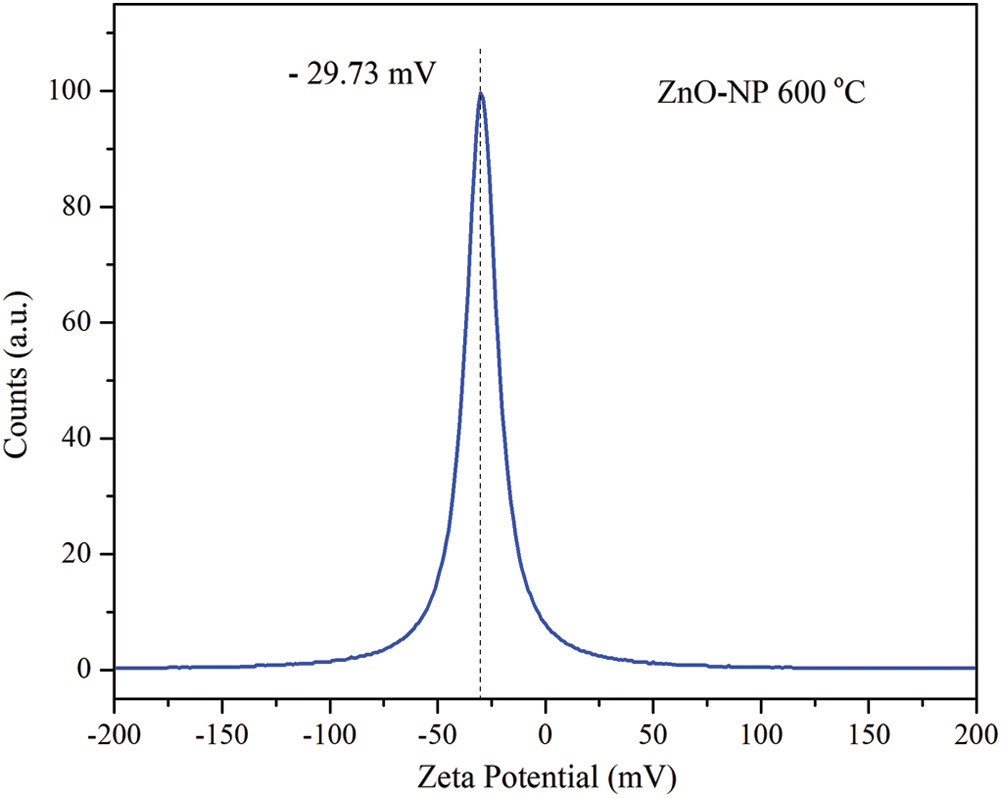
Figure 4: Zeta potential distribution of ZnO-NP annealed at 600°C
The XRD patterns show the noticeable peaks of ZnO-NP indexed to (100), (002), (101), (102), (110), (103), (200), (112), and (201) planes of reflection of ZnO in agreement with Joint Committee on Powder Diffraction Standards (JCPDS) card number 01-079-0206 shown in Fig. 5a. All recorded peak intensity profiles, zoomed in the range of 25 to 70 degrees (2θ), were characteristics of the hexagonal ZnO-NP wurtzite structure. Additionally, from the XRD pattern, no other diffraction peaks were observed, meaning there are not significant impurities in the ZnO crystallite.
Annealed sample of ZnO-NP at the temperature of 600°C reveals well-defined, strong, and narrow diffraction peaks indicating a crystallite nature (see Fig. 5c). Furthermore, no additional peaks can be detected within the resolution limit of the instrument, in this way, the trend of a single-phase formation could be confirmed. However, the unannealed sample presents a convolution of the last three broadened peaks associated with (200), (112), and (201) planes of reflections (see Fig. 5b). A correlation between diffraction and lattice imperfectness is associated to size broadening independent of the diffraction order, anisotropies, and/or crystallite smallness [51].
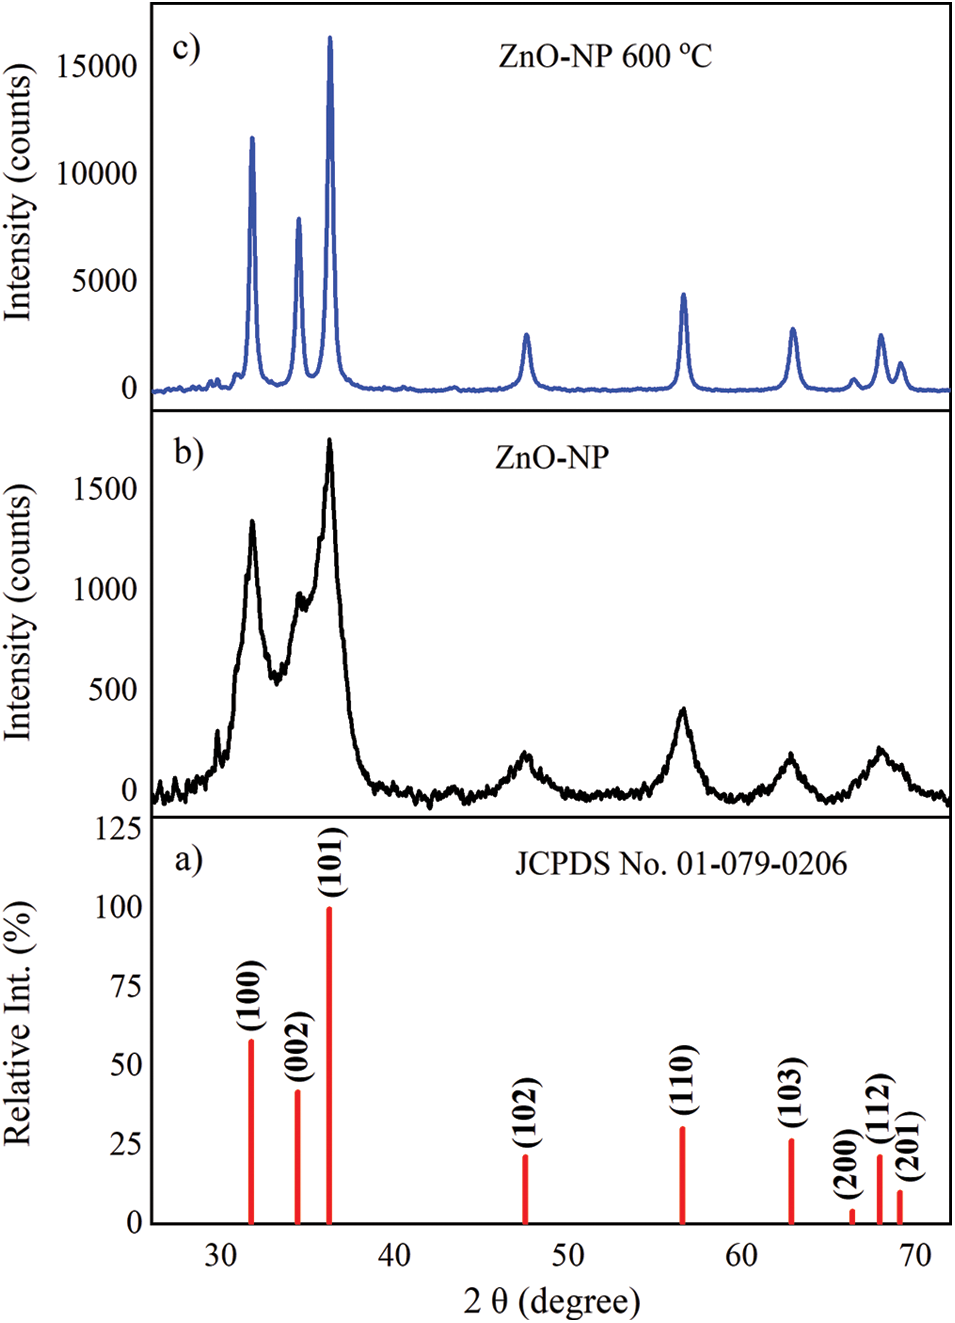
Figure 5: X-ray diffraction (a) relative intensity of ZnO reference card, and patterns of ZnO-NP (b) unannealed and (c) annealed at temperature of 600°C
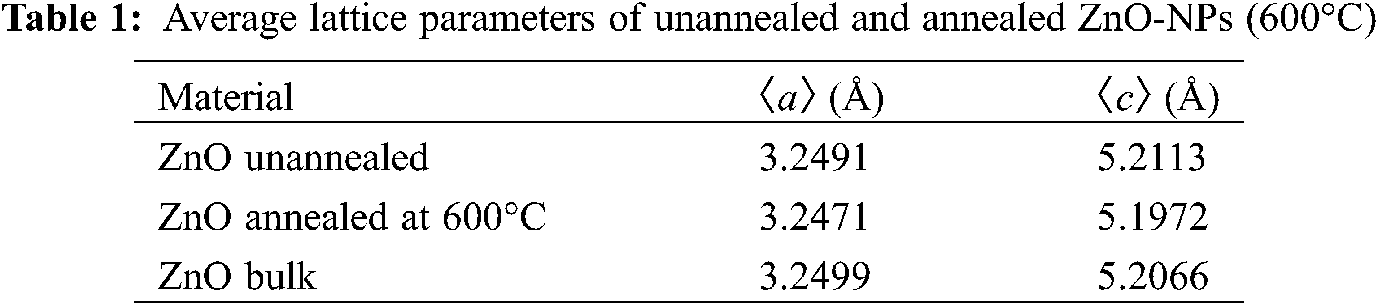
By using the relation described in Eq. (6), the lattice parameters (a, c), of the ZnO hexagonal structure are summarized in Tab. 1 as average values obtained from unannealed and annealed samples. These values have a good agreement with ZnO bulk parameters from the literature [52]. An insignificant variation of the lattice parameters ratio (c/a) between unannealed (1.6039) and annealed (1.6006) concerning the bulk (1.6021) parameters are observed, as expected.
XRD technique was used not only for the identification of crystal structure but also for different lattice parameters. Interplanar distances for each Miller indices were calculated by using Brag’s law, Eq. (5), associated with the Brag diffraction angle observed in Fig. 5. Summarized parameters as Miller index (hkl), Brag diffraction angle (θ), interplanar distance (d), and FWHM (φ), are shown in Tab. 2. Experimental position peaks have a good and clear correspondence to the ZnO-NP reported in the literature. A minimal difference of the interplanar distance is observed between samples annealed (d600C), unannealed (dUA), and bulk (dbulk) [52]. Furthermore, obtained values are in agreement with lattice parameters ratio (c/a) above mentioned.
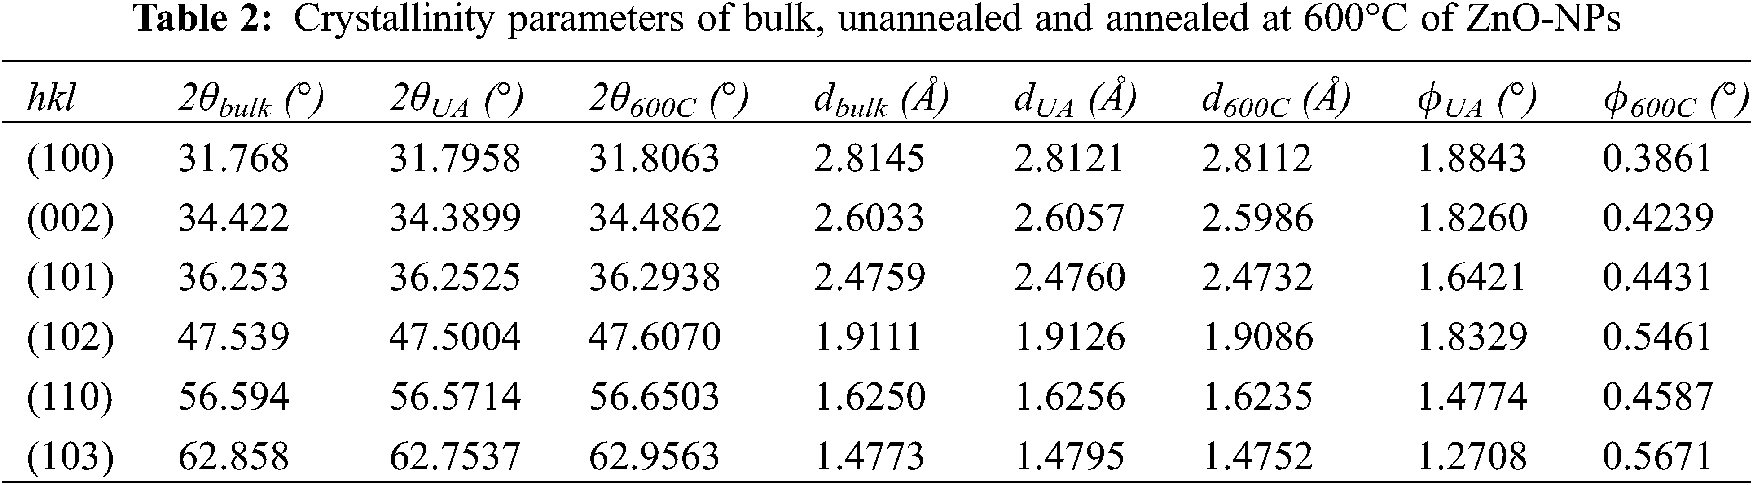
FWHM is also reported in Tab. 2. It is known that the size of the particle increases while decreasing the values of FWHM. By using Debby Scherrer’s formula, shown in Eq. (4), the crystallite average size of prepared ZnO-NP was calculated 5.26 and 18.82 nm for unannealed and annealed samples, respectively. For annealed at the temperature of 600°C, crystallite size obtained from XRD is smaller or equals to that of DLS and/or microscopy techniques (i.e., FE-SEM), as reported behavior in literature [43]. This fact can be easily revealed in this work by comparing XRD analysis, DLS analysis, and FE-SEM images.
On the other hand, analyzing the crystallographic results of the two types of samples, unannealed and annealed, there are slight reductions in parameters a, c, d and consequently in the c/a ratio after heat treatment, see Tabs. 1 and 2. These reductions suggest that the crystalline lattice suffered a slight contraction caused by the heat treatment applied on ZnO-NP.
ATR-FTIR spectra of ZnO-NP unannealed and annealed at 600°C in the spectral range of 400 to 4000 cm−1 are showed in Fig. 6. In both spectra, well-defined characteristic bands are evidenced at ~1120 and ~416 cm−1 related to the deformation of the Zn-O bond that indicates the presence of ZnO-NP as a product of the synthesis carried out. Additionally, wide bands of different intensity related to the deformation of the OH bond are observed in ~3405 cm−1 in the case of the product before heat treatment and ~3506 cm−1 in the case of the synthesis product after heat treatment, this last deformation is much more subtle due to the removal of the organic fraction during the heat treatment. On the other hand, a transition is observed in the bands referring to the C=C and C–C bonds before and after the heat treatment, a transition that is due to the removal of the organic fraction, thus in the case of the sample without treatment, a series of bands between ~1417–1604 cm−1 and an asymmetric band at ~1417 cm−1 are visualized in the case of the spectrum of the post-treatment sample.
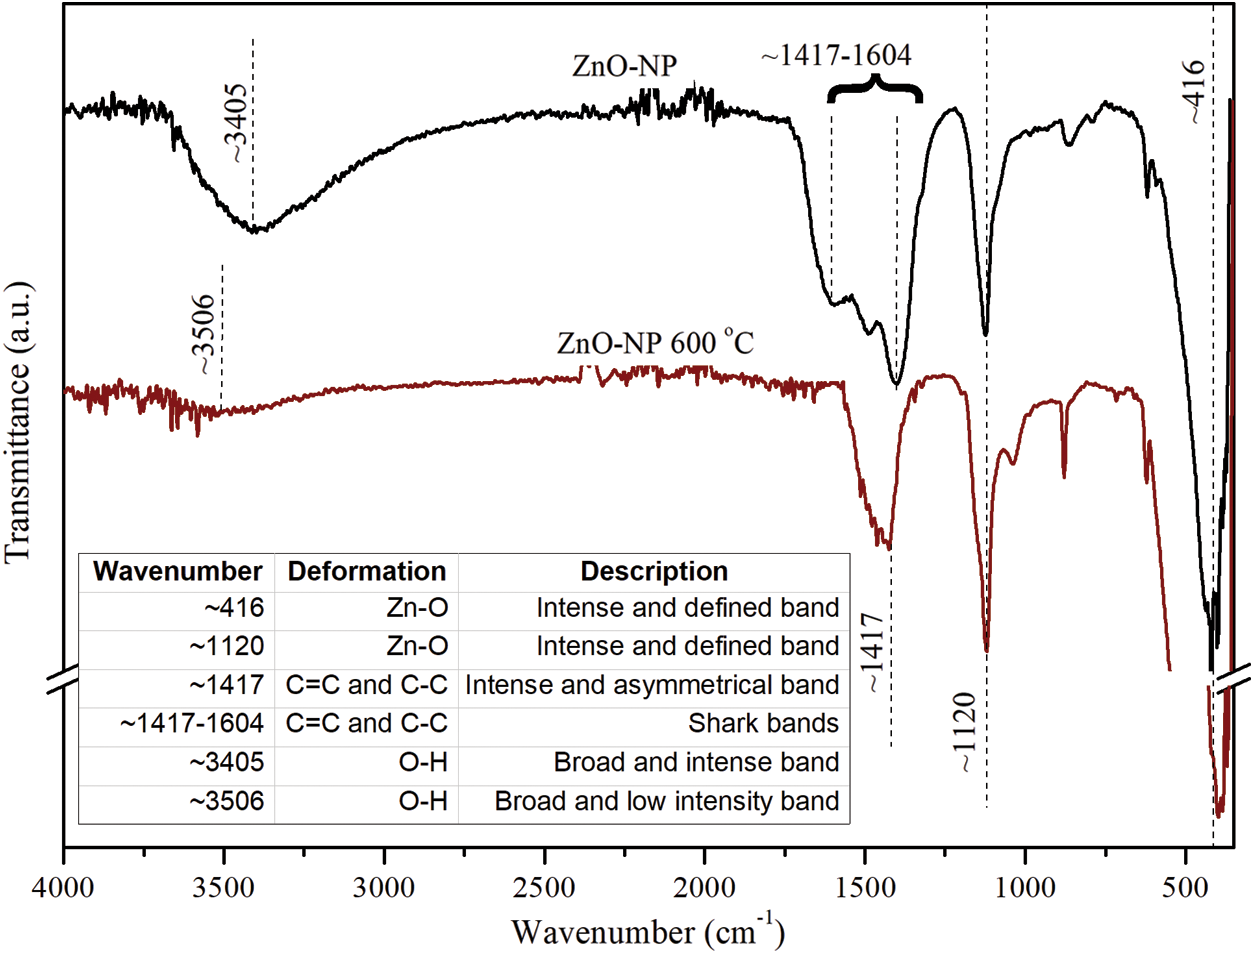
Figure 6: ATR-FTIR spectra of unannealed and annealed ZnO-NPs
A general arrangement of the annealed ZnO-NP sample obtained by FE-SEM is presented in Fig. 7a. In this overall micrograph, it is possible to observe a homogeneous dispersion and distribution in the absence of agglutination, agglomeration, or generation of significant lumps in the analyzed particles, enjoying simple contact with other surrounding nanoparticles. Likewise, there are also homogeneously distributed spaces or voids throughout the micrograph that suggests the stability concerning the dispersibility of this material in the dry state, this quality is essential to maintain its properties such as reactivity, electrostatic charge, qualities surface, among others, that must be considered for various applications. Different works associated with the development of nanoparticles of different kinds show in their morphological analyzes this type of agglomeration in different degrees at similar scales [53–55].
Although the sample is agglomerated due to the arrangement for taking the micrograph (see Fig. 7b), it is possible to distinguish particles with predominantly spheroidal morphologies, diameter of 25 nm, and a granulometric distribution without great variations with sizes less than 47.2 nm as previously referred in DLS. In this context, and considering that the FE-SEM technique allows direct measurement of nanoparticles with reduced errors, it can be inferred that the FE-SEM, XRD, DLS, and, to a lesser extent, UV-Vis techniques have coherence in all their results.
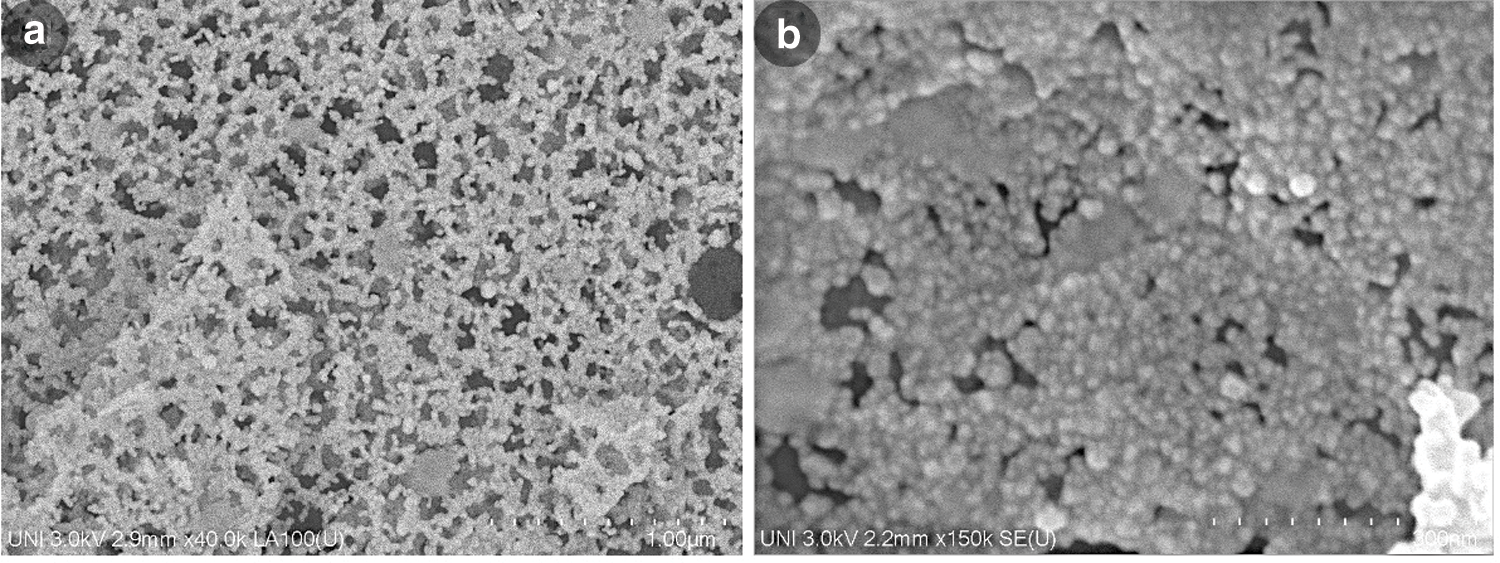
Figure 7: FE-SEM image of ZnO-NP annealed at 600°C in the range of (a) 1 µm and (b) 300 nm
In this study, ZnO nanoparticles were successfully synthesized by using an eco-friendly green synthesis instead of conventional physical or chemical methods. Moringa oleifera leaves extract was utilized as a reductant and as a capping agent during synthesis. Morphological and structural properties of ZnO-NP were analyzed by UV-Vis, DLS, zeta potential, XRD, ATR-FTIR, and FE-SEM techniques. The data not only confirms the synthesis of ZnO-NP but also the absence of impurities associated with organic compounds in the annealed sample observed by ATR-FTIR and XRD spectroscopy. UV-Vis showed a peak absorbance at 361.5 nm, indicating the presence of nanosized material in the aqueous medium, while DLS exposed a mean hydrodynamic diameter of 47.2 nm of the ZnO-NP. We found a zeta potential value of −29.73 mV, which means that NP have a high stability in a water solution. By FE-SEM technique, a mean size diameter of 25 nm was obtained by direct measurement. XRD analysis yielded a similar diameter result (18.82 nm) for annealed ZnO-NP. It was determined that the heat annealing induced the crystallite size favoring monocrystallinity analyzed by XRD. Also, it was observed that the crystalline lattice suffered a slight contraction caused by the heat treatment applied on ZnO-NP. By doing a Tauc plot method, a bandgap energy of 3.0 eV (~300 meV less than bulk) was obtained. In our case, this green synthesized material has a big influence on the Urbach region in the analysis, it means that the crystallite has defects, stress, or a nonstoichiometric phase in the nanoparticles probably caused by oxygen vacancies. In FE-SEM images a homogeneous dispersion and distribution in the absence of agglutination, agglomeration, or generation of significant lumps of the ZnO-NP is observed. The experimental results let us conclude that the FE-SEM, XRD, DLS, and UV-Vis techniques have a dimensional coherence of synthesized ZnO-NP. Finally, owing to their optical and structural properties, and low-cost production, the synthesized ZnO-NP are proposed as useful materials in several applications as a follow-up of this study.
Acknowledgement: The authors are grateful to Dr. J. Quispe and Dr. H. Loro for their valuable support, to the Centro de Investigaciones Tecnológicas, Biomédicas y Medioambientales (CITBM) and finally to the Facultad de Ciencias of Universidad Nacional de Ingeniería.
Funding Statement: Authors are grateful to Concytec-Peru and The World Bank for the financial support of this project under the call “Mejoramiento y Ampliación de los Servicios del Sistema Nacional de Ciencia Tecnología e Innovación Tecnológica” 8682-PE, through Fondecyt Grant 017-2019 FONDECYT BM INC.INV.
Conflicts of Interest: The authors declare that they have no conflicts of interest to report regarding the present study.
1. Wu, J., Xue, D. (2011). Progress of science and technology of ZnO as advanced material. Science of Advanced Materials, 3(2), 127–149. DOI 10.1166/sam.2011.1144. [Google Scholar] [CrossRef]
2. Vyas, S. (2020). A short review on properties and applications of zinc oxide based thin films and devices: ZnO as a promising material for applications in electronics, optoelectronics, biomedical and sensors. Johnson Matthey Technology Review, 64(2), 202–218. DOI 10.1595/205651320X15694993568524. [Google Scholar] [CrossRef]
3. Yao, T. (2001). Zinc oxide. Encyclopedia of materials: Science and technology. Netherlands: Elsevier. [Google Scholar]
4. Singh, S. C. (2013). Zinc oxide nanostructures: Synthesis, characterizations and device applications. Journal of Nanoengineering and Nanomanufacturing, 3(4), 283–310. DOI 10.1166/jnan.2013.1147. [Google Scholar] [CrossRef]
5. Vittal, R., Ho, K. C. (2017). Zinc oxide based dye-sensitized solar cells: A review. Renewable and Sustainable Energy Reviews, 70(52), 920–935. DOI 10.1016/j.rser.2016.11.273. [Google Scholar] [CrossRef]
6. Sirelkhatim, A., Mahmud, S., Seeni, A., Kaus, N. H. M., Ann, L. C. et al. (2015). Review on zinc oxide nanoparticles: Antibacterial activity and toxicity mechanism. Nano-Micro Letters, 7(3), 219–242. DOI 10.1007/s40820-015-0040-x. [Google Scholar] [CrossRef]
7. Mirzaei, H., Darroudi, M. (2017). Zinc oxide nanoparticles: Biological synthesis and biomedical applications. Ceramics International, 43(1), 907–914. DOI 10.1016/j.ceramint.2016.10.051. [Google Scholar] [CrossRef]
8. Hahn, Y. B. (2011). Zinc oxide nanostructures and their applications. Korean Journal of Chemical Engineering, 28(9), 1797–1813. DOI 10.1007/s11814-011-0213-3. [Google Scholar] [CrossRef]
9. Ong, C. B., Ng, L. Y., Mohammad, A. W. (2018). A review of ZnO nanoparticles as solar photocatalysts: Synthesis, mechanisms and applications. Renewable and Sustainable Energy Reviews, 81(Suppl. 2), 536–551. DOI 10.1016/j.rser.2017.08.020. [Google Scholar] [CrossRef]
10. Racca, L., Canta, M., Dumontel, B., Ancona, A., Limongi, T. et al. (2018). Zinc oxide nanostructures in biomedicine. Smart nanoparticles for biomedicine. Netherlands: Elsevier. [Google Scholar]
11. Kang, Y., Yu, F., Zhang, L., Wang, W., Chen, L. et al. (2021). Review of ZnO-based nanomaterials in gas sensors. Solid State Ionics, 360(7), 115544. DOI 10.1016/j.ssi.2020.115544. [Google Scholar] [CrossRef]
12. Xu, X., Guo, H., Wang, X., Zhang, M., Wang, Z. et al. (2019). Physical properties and anti-aging characteristics of asphalt modified with nano-zinc oxide powder. Construction and Building Materials, 224, 732–742. DOI 10.1016/j.conbuildmat.2019.07.097. [Google Scholar] [CrossRef]
13. Luzi, F., Fortunati, E., Jiménez, A., Puglia, D., Chiralt, A. et al. (2017). PLA nanocomposites reinforced with cellulose nanocrystals from Posidonia oceanica and ZnO nanoparticles for packaging application. Journal of Renewable Materials, 5(2), 103–115. DOI 10.7569/JRM.2016.634135. [Google Scholar] [CrossRef]
14. Borysiewicz, M. A. (2019). ZnO as a functional material, a review. Crystals, 9(10), 505. DOI 10.3390/cryst9100505. [Google Scholar] [CrossRef]
15. Agarwal, H., Shanmugam, V. K. (2020). A review on anti-inflammatory activity of green synthesized zinc oxide nanoparticle: Mechanism-based approach. Bioorganic Chemistry, 94, 103423. DOI 10.1016/j.bioorg.2019.103423. [Google Scholar] [CrossRef]
16. Zhu, X., Pathakoti, K., Hwang, H. M. (2019). Green synthesis of titanium dioxide and zinc oxide nanoparticles and their usage for antimicrobial applications and environmental remediation. Green synthesis, characterization and applications of nanoparticles. Netherlands: Elsevier. [Google Scholar]
17. Theerthagiri, J., Salla, S., Senthil, R. A., Nithyadharseni, P., Madankumar, A. et al. (2019). A review on ZnO nanostructured materials: Energy, environmental and biological applications. Nanotechnology, 30(39), 392001. DOI 10.1088/1361-6528/ab268a. [Google Scholar] [CrossRef]
18. Sabir, S., Arshad, M., Chaudhari, S. K. (2014). Zinc oxide nanoparticles for revolutionizing agriculture: Synthesis and applications. The Scientific World Journal, 2014(3), 1–8. DOI 10.1155/2014/925494. [Google Scholar] [CrossRef]
19. Zarazua-Aguilar, Y., Paredes-Carrera, S. P., Sánchez-Ochoa, J. C., Avendano-Gómez, J. R., Flores-Valle, S. O. (2017). Influence of microwave/ultrasound irradiation on the sol-gel synthesis of titanium dioxide nanoparticles for application in photocatalysis. Revista Mexicana De Ingeniería Química, 16(3), 899–909. http://rmiq.org/ojs311/index.php/rmiq/article/view/977. [Google Scholar]
20. Daruich de Souza, C., Ribeiro Nogueira, B., Rostelato, M. E. C. M. (2019). Review of the methodologies used in the synthesis gold nanoparticles by chemical reduction. Journal of Alloys and Compounds, 798(47), 714–740. DOI 10.1016/j.jallcom.2019.05.153. [Google Scholar] [CrossRef]
21. Joshi, R. (2018). Facile photochemical synthesis of ZnO nanoparticles in aqueous solution without capping agents. Materialia, 2(2), 104–110. DOI 10.1016/j.mtla.2018.07.001. [Google Scholar] [CrossRef]
22. El Filali, B., Torchynska, T. V., Díaz Cano, A. I., Morales Rodríguez, M. (2015). Structural and Raman scattering studies of ZnO Cu nanocrystals grown by spray pyrolysis. Revista Mexicana De Ingeniería Química, 14(3), 781–788. http://www.rmiq.org/ojs311/index.php/rmiq/article/view/1433. [Google Scholar]
23. Amendola, V., Meneghetti, M. (2009). Laser ablation synthesis in solution and size manipulation of noble metal nanoparticles. Physical Chemistry Chemical Physics, 11(20), 3805–3821. DOI 10.1039/b900654k. [Google Scholar] [CrossRef]
24. Othman, A. A., Osman, M. A., Abd-Elrahim, A. G. (2018). The effect of milling time on structural, optical and photoluminescence properties of ZnO nanocrystals. Optik, 156(20), 161–168. DOI 10.1016/j.ijleo.2017.11.037. [Google Scholar] [CrossRef]
25. Córdova-Cisneros, K. C., Sáenz-Galindo, A., Ascacio-Valdés, J. A., Narro-Céspedes, R. I., Castañeda-Facio, A. (2021). Green synthesis of silver nanoparticles using the aqueous extract of larrea tridentate and eucalyptus. Revista Mexicana De Ingeniería Química, 20(1), 13–24. DOI 10.24275/rmiq/Mat1117. [Google Scholar] [CrossRef]
26. Mohamed, A. A., Abu-Elghait, M., Ahmed, N. E., Salem, S. S. (2020). Eco-friendly mycogenic synthesis of ZnO and CuO nanoparticles for in vitro antibacterial, antibiofilm, and antifungal applications. Biological Trace Element Research, 199,1–12. DOI 10.1007/s12011-020-02369-4. [Google Scholar] [CrossRef]
27. Katiyar, A., Kumar, N., Shukla, R. K., Srivastava, A. (2020). Influence of alkali hydroxides on synthesis, physico-chemical and photoluminescence properties of zinc oxide nanoparticles. Materials Today: Proceedings, 29(3), 885–889. DOI 10.1016/j.matpr.2020.05.112. [Google Scholar] [CrossRef]
28. DeRosa, M., Monreal, C., Schnitzer, M., Walsh, R., Sultan, Y. (2010). Nanotechnology in fertilizers. Nature Nanotech, 5(2), 91–91. DOI 10.1038/nnano.2010.2. [Google Scholar] [CrossRef]
29. Xu, C., de, S., Balu, A. M., Ojeda, M., Luque, R. (2015). Mechanochemical synthesis of advanced nanomaterials for catalytic applications. Chemical Communications, 51(31), 6698–6713. DOI 10.1039/C4CC09876E. [Google Scholar] [CrossRef]
30. Otis, G., Ejgenberg, M., Mastai, Y. (2021). Solvent-free mechanochemical synthesis of ZnO nanoparticles by high-energy ball milling of ε-Zn (OH)2 crystals. Nanomaterials, 11(1), 238. DOI 10.3390/nano11010238. [Google Scholar] [CrossRef]
31. Iravani, S., Korbekandi, H., Mirmohammadi, S. V., Zolfaghari, B. (2014). Synthesis of silver nanoparticles: Chemical, physical and biological methods. Research in Pharmaceutical Sciences, 9(6), 385–406. https://www.ncbi.nlm.nih.gov/pmc/articles/PMC4326978/. [Google Scholar]
32. Naveed Ul Haq, A., Nadhman, A., Ullah, I., Mustafa, G., Yasinzai, M. et al. (2017). Synthesis approaches of zinc oxide nanoparticles: The dilemma of ecotoxicity. Journal of Nanomaterials, 2017(12), 1–14. DOI 10.1155/2017/8510342. [Google Scholar] [CrossRef]
33. Kumar, B., Smita, K., Cumbal, L., Debut, A. (2014). Green approach for fabrication and applications of zinc oxide nanoparticles. Bioinorganic Chemistry and Applications, 2014(3), 1–7. DOI 10.1155/2014/523869. [Google Scholar] [CrossRef]
34. Rana, A., Yadav, K., Jagadevan, S. (2020). A comprehensive review on green synthesis of nature-inspired metal nanoparticles: Mechanism, application and toxicity. Journal of Cleaner Production, 272(5), 122880. DOI 10.1016/j.jclepro.2020.122880. [Google Scholar] [CrossRef]
35. El Shafey, A. M. (2020). Green synthesis of metal and metal oxide nanoparticles from plant leaf extracts and their applications: A review. Green Processing and Synthesis, 9(1), 304–339. DOI 10.1515/gps-2020-0031. [Google Scholar] [CrossRef]
36. Manguro, L. O. A., Lemmen, P. (2007). Phenolics of Moringa oleifera leaves. Natural Product Research, 21(1), 56–68. DOI 10.1080/14786410601035811. [Google Scholar] [CrossRef]
37. Ngom, I., Ndiayea, N. M., Bakayoko, A. F. M., Ngom, B. D., Maaza, M. (2020). On the use of Moringa oleifera leaves extract for the biosynthesis of NiO and ZnO nanoparticles. MRS Advances, 5(21), 1145–1155. DOI 10.1557/adv.2020.212. [Google Scholar] [CrossRef]
38. Iravani, S. (2011). Green synthesis of metal nanoparticles using plants. Green Chemistry, 13(10), 2638–2650. DOI 10.1039/c1gc15386b. [Google Scholar] [CrossRef]
39. Aboulthana, W. M., Youssef, A. M., Seif, M. M., Osman, N. M., Sahu, R. K. et al. (2021). Comparative study between Croton tiglium seeds and Moringa oleifera leaves extracts, after incorporating silver nanoparticles, on murine brains. Egyptian Journal of Chemistry, 64(4), 1709–1731. DOI 10.21608/EJCHEM.2021.53777.3113. [Google Scholar] [CrossRef]
40. Bandeira, M., Giovanela, M., Roesch-Ely, M., Devine, D. M., da Silva Crespo, J. (2020). Green synthesis of zinc oxide nanoparticles: A review of the synthesis methodology and mechanism of formation. Sustainable Chemistry and Pharmacy, 15, 100223. DOI 10.1016/j.scp.2020.100223. [Google Scholar] [CrossRef]
41. Makarov, V. V., Love, A. J., Sinitsyna, O. V., Makarova, S. S., Yaminsky, I. V. et al. (2014). Green nanotechnologies: Synthesis of metal nanoparticles using plants. Acta Naturae, 6(1), 20–44. DOI 10.32607/20758251-2014-6-1-35-44. [Google Scholar] [CrossRef]
42. Tauc, J., Grigorovici, R., Vancu, A. (1966). Optical properties and electronic structure of amorphous germanium. Physica Status Solidi (B), 15(2), 627–637. DOI 10.1002/(ISSN)1521-3951. [Google Scholar] [CrossRef]
43. Akbari, B., Pirhadi Tavandashti, M., Zandrahimi, M. (2011). Particle size characterization of nanoparticles-a practical approach. Iranian Journal of Materials Science and Engineering, 8(2), 48–56. http://ijmse.iust.ac.ir/article-1-341-en.html. [Google Scholar]
44. Clogston, J. D., Patri, A. K. (2011). Zeta potential measurement. Characterization of nanoparticles intended for drug delivery. USA: Humana Press. [Google Scholar]
45. Srikant, V., Clarke, D. R. (1998). On the optical band gap of zinc oxide. Journal of Applied Physics, 83(10), 5447–5451. DOI 10.1063/1.367375. [Google Scholar] [CrossRef]
46. Sharma, N., Prabakar, K., Ilango, S., Dash, S., Tyagi, A. K. (2017). Optical band-gap and associated Urbach energy tails in defected AlN thin films grown by ion beam sputter deposition: Effect of assisted ion energy. Advanced Materials & Processes, 2(5), 342–346. DOI 10.5185/amp.2017/511. [Google Scholar] [CrossRef]
47. Bindu, P., Thomas, S. (2017). Optical properties of ZnO nanoparticles synthesised from a polysaccharide and ZnCl2. Acta Physica Polonica A, 131(6), 1474–1478. DOI 10.12693/APhysPolA.131.1474. [Google Scholar] [CrossRef]
48. Caglar, M., Ilican, S., Caglar, Y. (2009). Influence of dopant concentration on the optical properties of ZnO: In films by sol-gel method. Thin Solid Films, 517(17), 5023–5028. DOI 10.1016/j.tsf.2009.03.037. [Google Scholar] [CrossRef]
49. Berg, J. M., Romoser, A., Banerjee, N., Zebda, R., Sayes, C. M. (2009). The relationship between pH and zeta potential of ∼30 nm metal oxide nanoparticle suspensions relevant toin vitrotoxicological evaluations. Nanotoxicology, 3(4), 276–283. DOI 10.3109/17435390903276941. [Google Scholar] [CrossRef]
50. Min, Y., Akbulut, M., Kristiansen, K., Golan, Y., Israelachvili, J. (2008). The role of interparticle and external forces in nanoparticle assembly. Nature Materials, 7, 527–538. DOI 10.1038/nmat2206. [Google Scholar] [CrossRef]
51. Ungár, T. (2004). Microstructural parameters from X-ray diffraction peak broadening. Scripta Materialia, 51(8), 777–781. DOI 10.1016/j.scriptamat.2004.05.007. [Google Scholar] [CrossRef]
52. Albertsson, J., Abrahams, S. C., Kvick, A. (1989). Atomic displacement, anharmonic thermal vibration, expansivity and pyroelectric coefficient thermal dependences in ZnO. Acta Crystallographica Section B, 45(1), 34–40. DOI 10.1107/S0108768188010109. [Google Scholar] [CrossRef]
53. Al-Bedairy, M. A., Habeeb Alshamsi, H. A. (2018). Environmentally friendly preparation of zinc oxide, study catalytic performance of photodegradation by sunlight for rhodamine B dye. Eurasian Journal of Analytical Chemistry, 13(6), 1–9. DOI 10.29333/ejac/101785. [Google Scholar] [CrossRef]
54. Khezli, S., Abedini, A. (2017). Effect of amino acids as a capping agent on the size and morphology of pure AgO nanoparticles and its photocatalyst application. Journal of Materials Science: Materials in Electronics, 28(14), 10535–10540. DOI 10.1007/s10854-017-6827-4. [Google Scholar] [CrossRef]
55. Abed, H. H., Alwasiti, E. A., Tawfeeq, A. T. (2020). Titanium nanoparticles conjugated with streptokinase as a modified thrombolytic agent. International Journal of Current Pharmaceutical Research, 12(1), 18–25. DOI 10.22159/ijcpr.2020v12i1.36824. [Google Scholar] [CrossRef]
 | This work is licensed under a Creative Commons Attribution 4.0 International License, which permits unrestricted use, distribution, and reproduction in any medium, provided the original work is properly cited. |