| Journal of Renewable Materials |
DOI: 10.32604/jrm.2022.018149
ARTICLE
Experimental Investigation of the Creep Behaviour of Glulam Compression-Bending Members
College of Civil Engineering, Nanjing Tech University, Nanjing, 211816, China
*Corresponding Author: Weidong Lu. Email: wdlu@njtech.edu.cn
Received: 02 July 2021; Accepted: 15 October 2021
Abstract: Creep test results of glulam members under compression and bending were studied in this paper. The creep tests were conducted to investigate the influence of the stress level and relative eccentricity on the creep deformation of glulam members. The test results showed that the creep deformation trends of glulam members under long-term compression and bending loading were similar; the creep deformation increased with increases in both the stress level and relative eccentricity. However, the relative creep deformation decreased with the increase in both the stress level and relative eccentricity under long-term loading, and a five-parameter creep model was proposed to analyse the creep mechanism of glulam members under compression and bending. The good fitness of the test results indicated that the five-parameter model was able to accurately simulate the creep deformation of glulam compression-bending members. Moreover, a numerical model was developed using the creep equation, which was related to the parameter
Keywords: Glulam compression-bending members; creep; stress level; relative eccentricity
Under the global trend of the increasing importance of environmental protection and sustainable development, timber, due to its low-carbon, renewable and favourable mechanical properties, has been considered the first choice of construction material for green buildings. The strain of timber increases with time under the continuous action of its self-weight or an external load, owing to its anisotropic viscoelastic characteristic. This phenomenon is known as creep. The deformation effect caused by creep will affect the overall deformation of a structure and result in the loss of structural strength [1]. Therefore, studies on the creep behaviour of timber structures are of great significance to facilitate the development of timber structures.
In recent years, researchers have studied the creep properties of timber and timber components. Zhou et al. [2,3] tested the tensile and compressive creep properties of laminated veneer lumber (LVL), established the creep constitutive relation of LVL, and used this model to analyse the buckling of LVL reticulated shells. The results showed that when the stress ratio was below 35%, no buckling occurred during the design period. In addition, the larger the stress ratio was, the shorter the buckling time. Bende et al. [4] investigated the creep of timber truss connectors under long-term loading. Lopes [5] considered the effects of different chemical modification methods on the creep properties of pine. Lu et al. [6,7] tested the creep properties of fibre-reinforced polymer (FRP)-reinforced glulam beams, established a creep constitutive model, and predicted creep during a loading period of 50 years. Then, the creep properties of FRP-reinforced glulam arches were studied, and the results showed that FRP-reinforced technology could effectively reduce the creep effect of glulam arches. McConnell et al. [8] studied the creep properties of planted-bar glulam beams and found that the use of epoxy adhesive could effectively reduce the creep velocity of glulam beams. Zhang [9] investigated the creep properties of timber beams strengthened with bonded steel plates and found that bonded steel plates could reduce the creep of timber beams.
Some researchers have noted the effects of temperature and humidity on the creep properties of timber. Moutee et al. [10] investigated the influence of load level and equilibrium moisture content on the creep properties of white spruce cantilever beams under the condition of temperature and humidity control. Massimo et al. [11] conducted 5-month creep tests on timber-concrete composite beams exposed to a natural environment. The results showed that thermal stress and deflection were generated in the composite beam due to the change in temperature and the different thermal expansion coefficients of the two materials. The calculation method was proposed to predict the 15-year creep effect of truss connectors. Yeoh [12] tested the bending creep of timber-concrete composite beams in different environments. The results showed that the mid-span creep of composite beams increased with increasing temperature, whereas it decreased with increasing humidity. Kaboorani et al. [13] used a dynamic thermomechanical analyser (DMA) to measure the radial and tangential creep compliance of maple timber under different conditions, and the results showed that the creep compliance increased with increasing equilibrium moisture content. Angellier et al. [14] investigated the hygrothermal effect on the crack change during the creep process of timber. Moosavi et al. [15] analysed the influence of altitude on the flexural creep properties of Carpinus. The results showed that altitude had a significant effect on the creep parameters under the condition of 65% relative humidity (RH). Ali et al. [16] considered the effects of temperature, humidity and stress on the tensile creep of timber, and the results showed that the temperature and humidity had great effects on creep. Andi et al. [17] studied the bending creep of the surface and inner layers of Japanese fir at different temperatures. The results showed that the creep deformation increased with increasing temperature. At the same temperature, the creep of the inner layer was greater than that of the outer layer.
Large-span timber lattice shell structures have been widely used in large-span timber structure construction engineering in recent years. Some large-span lattice shell buildings have been successfully constructed, such as the Savill Garden gridshell. In a large-span timber lattice shell structure, the members are subjected to both compression and bending. Therefore, it is urgent to carry out research on the compression-bending creep deformation of timber. Research on timber creep in China and abroad has focused on the bending, tensile compression creep and mechanical adsorption deformation of timber, as well as the influence of temperature and humidity. Research on the compression-bending creep deformation of glulam has not yet been carried out. Therefore, glulam compression-bending members were used in this study to investigate the influence of the stress level, relative eccentricity and other factors on mid-span creep deformation. Twelve long-term creep specimens were designed and tested. Eccentric loading creep tests were carried out according to the relevant codes. A five-parameter model based on experimental data fitting was established to describe the creep characteristics of timber. It was verified that this five-parameter model can simulate the creep deformation of flexural members and predict the creep deformation of flexural members over 50 years.
The glulam considered in this study was made of Douglas fir. The physical properties of the Douglas fir were measured according to the timber property test standard [18–23]: the moisture content was 11.08%, the density was 490 kg/m3, the tensile strength parallel to the grain was 98.71 MPa, the compressive strength parallel to the grain was 39.43 MPa, the shear strength in the radial direction was 9.04 MPa, the shear strength in the tangential direction was 8.16 MPa, the bending strength was 33.70 MPa, and the elastic modulus in the longitudinal direction was 11495 MPa.
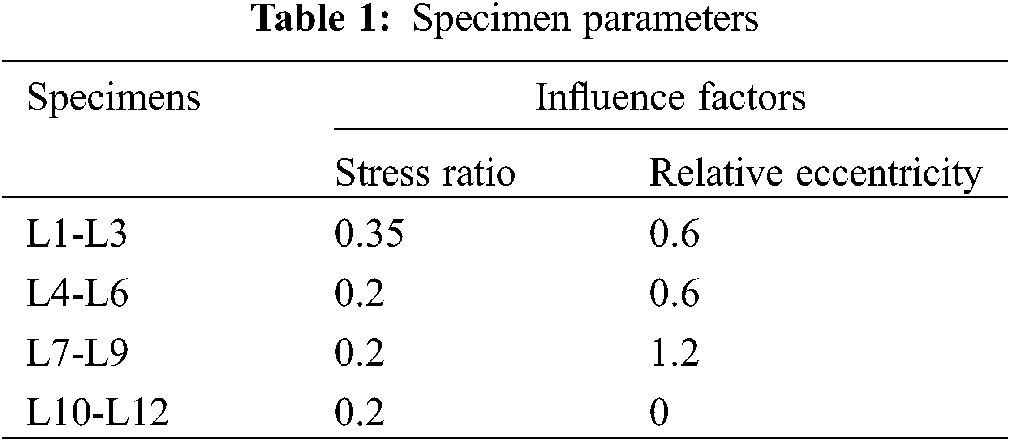
The glulam creep tests were carried out at the Timber Structure Laboratory of Nanjing Tech University. The dimensions of the specimens were determined by ASTMD143-94 (2000) [24] and GB/T 50329-2012 [25]. The dimensions of all the specimens are shown in Fig. 1. The specimens had the same lengths (1000 mm), widths (100 mm) and thicknesses (60 mm). Each glulam member consisted of 30 mm Douglas fir layers. The adhesive used in the glulam was resorcinol glue. Considering the influence of different relative eccentricities, corbels were added at both ends of the specimen to ensure the accuracy of the results. The effects of different stress ratios and different relative eccentricity rates on the creep behaviour of glulam members were tested in the test. The detailed parameters of each group are presented in Table 1. Each group comprised three specimens.

Figure 1: Specimen dimensions: (a) L1-L6; (b) L7-L9; (c) L10-L12 (unit: mm)
A customized device was used for this work, and the load was applied by a jack. The diagram of the test device is shown in Fig. 2.

Figure 2: Creep test setup (unit: mm)
To avoid the lateral deviation of the specimens and satisfy the actual stress state of the specimens, the two ends of each specimen were fixed with bolted steel-timber-steel connections. In the test, pressure was applied to both ends of the specimens through the test device, so that the specimen could be effectively connect to the test device during the test. Additional dial gauges were placed in the middle and at both ends of the specimen to measure the lateral displacement in the initial stage of the test so that the specimen position could be adjusted to ensure that no lateral deviation occurred. The details are shown in Fig. 4.
Referring to the calculation method of the bearing capacity of compression-bending members in GB/T 50708-2012 [26] and the results of the short-term test, the ultimate bearing capacity of the benchmark specimen was determined to be 141.5 kN. To ensure the accuracy of the long-term test, the glulam used in the long-term test was the same as that used in the short-term test. To avoid the failure of the specimens caused by excessive loading, loading stress levels of 0.2 and 0.35 were adopted, and the corresponding pressures were 28.3 kN and 49.5 kN.
The loading environment had a constant temperature of (20 ± 2)°C and RH of (65 ± 3)%, as shown in Fig. 3. The change in the mid-span displacement of each glulam specimen was recorded by manual reading, and the measurement interval was increased throughout the test. Dial indicators were arranged along the span and support of each specimen to measure the lateral deflection of the glulam member. The arrangement of the dial indicators is shown in Fig. 4.

Figure 3: Loading environment: (a) temperature and (b) RH

Figure 4: Arrangement of dial indicators
Creep phenomenon is shown in Fig. 5. During the long-term loading of the three groups, no obvious cracks were observed on the surfaces of the specimens during over 250 days.

Figure 5: The surfaces of the specimens
3.2 Creep Test Results and Analysis
To ensure the reliability of the test results, the average value of test specimens for each group is adopted. Meanwhile, relative creep deformation is used to analyse creep data to clarify the relation between creep deformation and different stress ratios. Relative creep deformation is the ratio between creep deformation and initial deformation, and its equation is as follows:
where
3.2.1 Effect of the Stress Ratio
The creep deformation curves and the relative creep deformation curves of the glulam members under different stress levels are shown in Fig. 6.

Figure 6: Creep deformation under different stress levels: (a) creep deformation in mid-span and (b) relative creep deformation
The creep deformation of these specimens follows a certain pattern. In the first 30 days of loading, the mid-span deflection increased rapidly, and the components were in the initial creep stage at this time. Then, the increase in deflection deformation gradually decreased and entered the steady-state creep stage.
The final deformation of the specimens increased with increasing stress level. When the stress ratio increased from 0.2 to 0.35, the mid-span final deformation of the specimens increased from 0.8595 mm to 1.5445 mm, an increase of approximately 0.685 mm.
When the stress ratio increased from 0.2 to 0.35, the instantaneous deformation of the specimens increased by approximately 121.95%, and the creep deformation of the specimens increased by approximately 27.55%, far less than the increase in the instantaneous deformation. Thus, it can be inferred that the difference in the final deformation between the stress ratios of 0.2 and 0.35 was mainly caused by instantaneous deformation rather than creep deformation.
The relative creep deformation of the specimens decreased with increasing stress level. When the stress ratio increased from 0.2 to 0.35, the relative creep deformation decreased from 81% to 46%, a decrease of 35%. This phenomenon occurred because the transverse deformation of the specimens caused by the bending moment was restricted due to the pressure applied by the device. When the specimen was subjected to a long-term bending moment, one side of the specimen was in tension, and the other side was in compression, which led to transverse creep deformation. However, when the specimen was subjected to long-term vertical compression and bending, the creep deformation of the tensile side of the specimen was restricted by the long-term compression. Therefore, the creep deformation of a specimen under compression and bending was less than that of an identical specimen under pure bending. The relative creep deformation of a specimen under compression and bending decreased with increasing stress ratio.
3.2.2 Effect of the Relative Eccentricity
The creep curves and relative creep deformation curves of the glulam members under different relative eccentricity rates are shown in Fig. 7.

Figure 7: Creep deformation under different relative eccentricities: (a) mid-span creep deformation and (b) relative creep deformation
The creep deformation of these specimens with different relative eccentricities exhibits a certain pattern.
The final deformation of the specimens increased with increasing relative eccentricity. When the relative eccentricity increased from 0.6 to 1.2, the final deformation of the specimens increased from 0.8595 mm to 1.5995 mm, an increase of 0.74 mm.
When the relative eccentricity increased from 0.6 to 1.2, the instantaneous deformation of the specimens increased from 0.4748 mm to 1.099 mm, an increase of approximately 131.47%, and the creep deformation of the compression-bending component increased from 0.3847 mm to 0.5005 mm, an increase of approximately 30.10%, which is far less than that of the instantaneous deformation. Thus, it can be inferred that the difference in the final deformation between the cases of 0.6 and 1.2 relative eccentricity was mainly caused by instantaneous deformation rather than creep deformation.
The relative creep deformation of the specimens decreased with increasing relative eccentricity. When the relative eccentricity increased from 0.6 to 1.2, the relative creep deformation decreased from 81% to 45%, a decrease of approximately 36%. The reasons for this phenomenon were that the transverse deformation caused by the bending moment was restricted by the pressure and that the connection between the specimens and test device was semi-rigid. When the specimen was subjected to a long-term bending moment, the rotation angle generated at the two ends of the specimen increased, and the connections at the two ends of the component produced a counterforce to suppress this tendency. This caused the specimen to be compressed on only one side, causing the specimen to eventually shift towards the side that is not compressed, and resulting in a reduction in the specimen’s mid-span creep. Therefore, with increasing relative eccentricity, the long-term bending moment of the component and the counterforce of the connection increased. This resulted in a reduction in the specimen’s mid-span creep and a decrease in the relative creep deformation.
Existing studies have found that the Maxwell, Kelvin-Voigt and standard linear solid models each have limitations in terms of reproducing the theoretical model [27]. Therefore, the creep model adopted in this test is composed of a spring element, a Kelvin model and a viscous element in series, namely, a Burger model composed of a Kelvin model and a Maxwell model in series.
The Burgers model is a four-element model obtained by connecting a Maxwell model and a Kelvin-Voigt model. As shown in Fig. 8, the Burgers model has the advantages of both the Maxwell model and the Kelvin-Voigt model and can suitably describe the creep properties of viscoelastic materials.

Figure 8: The creep curve of the Burgers model
The strain in the Burgers model is composed of elastic strain, viscous strain and viscoelastic strain. To define the constant stress
where
The creep rate is as follows:
By calculating the limit value of the above equation, it was found that the strain rate tends to a certain value with increasing time, that is, the rate of change in the viscous part is constant. This means that creep will continue to develop over time and even cause damage in the timber, which is not applicable to predict long-term creep and will result in overestimation. Therefore, because the Burger model should satisfy the creep regularity of timber, a power function was introduced, which can provide a better numerical simulation description of creep regularity. The Burger model was changed into a five-parameter model [28], and the parameters were preliminarily constrained. The formula is as follows:
The above equation can be simplified as follows:
4.2 Parameter Fitting of the Creep Model of the Glulam Compression-Bending Component
The test data were fitted by MATLAB software, and the fitting results are shown in Fig. 9. The parameters and correlation coefficients of the five-parameter model are listed in Table 2. Fig. 8 and Table 2 show that the curve fitting accuracy of the creep test data was excellent when R2 exceeded 0.98. Therefore, it was concluded that the five-parameter model is suitable for simulating the creep deformation of glulam members under compression and bending.


Figure 9: Creep curve fitting: (a) L1-L3; (b) L4-L6; (c) L7-L9
The finite element software Abaqus was used to numerically simulate the long-term mechanical behaviour of the flexural members. In the creep analysis method of Abaqus, the strain hardening model can accurately simulate the creep of timber under constant temperature and humidity conditions. Its expression is as follows:
where
In the normal stress state, timber creep had a linear relationship with the stress change but was independent of the current strain. Therefore, formula (5) can be simplified as follows:
Since the deformation of the component in the creep test was very small and the stress change can be ignored, formula (6) can be approximated as follows:
where
The above formula was quite different from the creep model used in this paper, but it was similar to the power law model. The expression of the power law model is as follows:
When strain hardening was adopted in the finite element, the model parameters
where
Therefore, the power law model was adopted to fit the test data and obtain the parameters
Wood is an anisotropic material, and its mechanical properties are different in different grain directions. To effectively simulate the mechanical properties of compression-bending members, the anisotropy of timber was simplified to be orthotropic. The simulation of the elastic behaviour of wood timber was achieved by defining the engineering constants in Abaqus. In this simulation, the elastic modulus of glulam parallel to the grain adopted the measured value of 11,495 MPa, and the other elastic moduli in various directions were determined by the elastic modulus ratios, as recommended by the “Wood Handbook” (2010) [29]. The approximate values are as follows:
The material properties of timber are listed in Table 3.

The power law model was used to fit the test data and obtain the required parameters, and the corresponding parameters are presented in Table 4.

5.3 Establishment of a Finite Element Model
The finite element (FE) model of the specimen was established, and a 3D stress element (C3D8I) was adopted. The reference point was coupled with the compression surface at the end of the glulam member. The concentrated force was applied at the reference point. In addition, the two ends were simply supported. The FE model is shown in Fig. 10.

Figure 10: Finite element model of the compression-bending component: (a) relative eccentricity 0.6 and (b) relative eccentricity 1.2
5.4 Finite Element Parameters Analysis
By conducting the FE analysis of the glulam member under eccentric loading, the basic parameters

As seen from the above table, when the relative eccentricity was 2 times larger than the base value, the corresponding value of
where
Finite element simulations were carried out. The modified basic parameters are summarized in Table 6.

A comparison of the mid-span creep deformation between the FE analysis and test results is shown in Fig. 11.

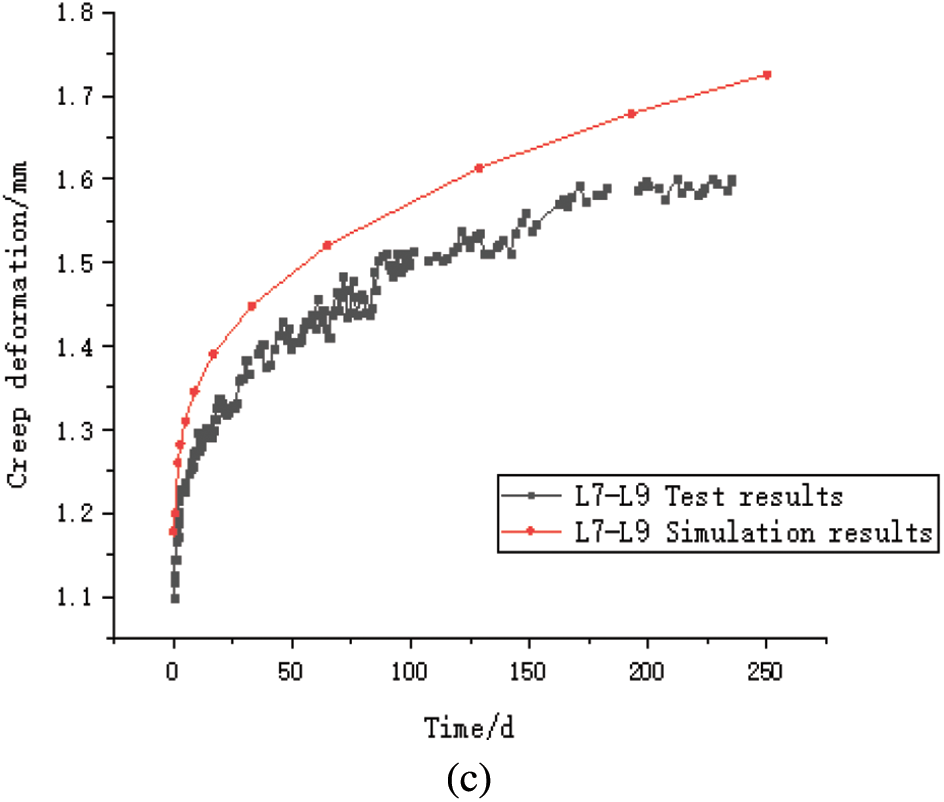
Figure 11: Mid-span deflection creep curves: (a) L1-L3; (b) L4-L6; (c) L7-L9
A comparison of the relative creep deformation results between the simulation and test is shown in Fig. 12.

Figure 12: Mid-span relative creep curves: (a) L1-L3; (b) L4-L6; (c) L7-L9
Figs. 10 and 11 show that the trends of simulation and test curves were similar, and the simulation results were in good agreement with the test results, showing the capability of this model to predict the creep behaviour of glulam members under compression and bending. The changes in
As specified in Eurocode 5 [30], the relative creep coefficient
where
According to Eq. (12), the relative creep coefficients of compression-bending members with different stress ratios and relative eccentricity rates were obtained by FE simulations. The changes in values


Thus, the mid-span creep of the compression-bending members with different stress ratios and relative eccentricities are shown in Figs. 13 and 14, respectively.

Figure 13: Relative creep deformation of compression-bending members with different stress ratios

Figure 14: Relative creep deformation of compression-bending members with different eccentricity ratios
Figs. 13 and 14 show that when the stress ratio was 0.2, the relative creep deformation of the member increased with increasing time. For glulam members with different relative eccentricities, the relative creep deformation decreased with increasing stress ratio. When the relative eccentricity was 0.6, the relative creep deformation of the member increased with increasing time. The relative creep deformation decreased with increasing relative eccentricity under different stress ratios. The simulation results agreed well with the experimental results.
The fitting results of the relative creep deformation of the tested members with different stress ratios and relative eccentricities are shown in Figs. 15 and 16.

Figure 15: The mid-span relative creep deformation coefficient of 50-year compression-bending members with different stress ratios

Figure 16: The mid-span relative creep deformation coefficient of 50-year compression-bending members with different relative eccentricity ratios
Figs. 15 and 16 show that the relative creep coefficient was inversely proportional to the stress ratio.
The relative creep coefficient was also inversely proportional to the relative eccentricity.
where
Considering the effect of both the relative eccentricity and stress ratio, a parametric equation was obtained. The equation can be expressed as follows:
where
In this study, creep tests of glulam members under compression and bending were carried out to study the effects of the stress level and relative eccentricity on the mid-span creep deformation of these members. Based on the creep mechanism, the feasibility of the established five-parameter model for timber creep data fitting was verified. Finally, a numerical model was established based on the creep equation to simulate the test data, and the parameters
1. The creep deformation trends of glulam compression-bending components were similar and included an obvious initial creep phase and steady-state creep phase. The creep deformation of the tested glulam compression-bending members increased with increasing stress level and relative eccentricity. Therefore, it was necessary to control the stress level and relative eccentricity so that the excessive bending stress of glulam members could be avoided.
2. The relative creep deformation of the glulam compression-bending members decreased with increasing stress level and relative eccentricity. Because the initial creep deformation stage of the compression-bending members with a high stress level and large relative eccentricity was relatively short, the deformation of such a member quickly entered the steady-state creep stage, resulting in a relatively small final creep deformation.
3. The five-parameter model was suitable for simulating the creep performance of glulam compression-bending members due to its consideration of the observed creep mechanism. The accurate fitting results showed its potential to simulate the creep deformation of compression-bending members at the mid-span.
4. The creep equation in Abaqus software was used to simulate the long-term deflection of each specimen based on the proposed creep parameters. The simulation results of the creep deformation and relative creep deformation were in good agreement with the corresponding test results, showing that the proposed method was able to simulate the creep of glulam members.
5. The creep parameters
Acknowledgement: All authors contributed equally to this work.
Funding Statement: The research described here was supported by the National Key Research and Development Program of China (Grant No. 2017YFC0703506).
Conflicts of Interest: The authors declare that they have no conflicts of interest to report regarding the present study.
1. Yue, K., Zhang, W., Xia, Y., Lu, X. N. (2008). A review on creep of wood material. Forestry and Grassland Machinery, 19(3), 48–51. DOI 10.13594/j.cnki.mcjgjx.2008.03.011. [Google Scholar] [CrossRef]
2. Zhou, H., Zhu, E., Wang, S. (2008). Creep of LVL and its effect on the structures. Proceedings from the World Conference of Timber Engineering, pp. 944–953. Engineered Wood Products Association, Miyazaki, Japan. [Google Scholar]
3. Zhou, H. Z., Fan, F., Zhu, E. C. (2010). Buckling of reticulated laminated veneer lumber shells in consideration of the creep. Engineering Structures, 32(9), 2912–2918. DOI 10.1016/j.engstruct.2010.05.010. [Google Scholar] [CrossRef]
4. Bender, D. A., Woeste, F. E. (2011). Creep deflection in design of metal plate-connected wood trusses. Practice Periodical on Structural Design and Construction, 16(1), 10–14. DOI 10.1061/(ASCE)SC.1943-5576.0000079. [Google Scholar] [CrossRef]
5. Lopes, D. B., Mai, C., Militz, H. (2013). Bending creep of Maritime pine wood (Pinus pinaster Ait.) chemically modified. Folia Forestalia Polonica. Series A. Forestry, 55(3), 120–131. DOI 10.2478/ffp-2013-00013. [Google Scholar] [CrossRef]
6. Lu, W. D., Song, E. W., Yue, K., Liu, W. Q. (2013). Experimental study on creep behavior of FRP-reinforced glulam beam. Journal of Building Materials, 16(2), 294–297. DOI 10.3969/j.issn.1007-9629.2013.02.020. [Google Scholar] [CrossRef]
7. He, M., Lu, W., Yue, K., Song, E. W. (2013). Creep performances of FRP reinforced glulam arch. Journal of Nanjing University of Technology (Natural Science Edition), 35(2), 107–110. DOI 10.3969/j.issn.1671-7627.2013.02.022. [Google Scholar] [CrossRef]
8. McConnell, E., McPolin, D., Taylor, S. (2014). Post-tensioning of glulam timber with steel tendons. Construction and Building Materials, 73, 426–433. DOI 10.1016/j.conbuildmat.2014.09.079. [Google Scholar] [CrossRef]
9. Zhang, F. W., Chen, X., Xu, Q. F., Wang, Z. L., Chen, L. Z. et al. (2017). Experimental study on mechanical behavior of timber beam strengthened with steel plate during 1200-day sustained loading. Journal of Building Structures, 38(6), 78–85. DOI 10.14006/j.jzjgxb.2017.06.009. [Google Scholar] [CrossRef]
10. Moutee, M., Fortin, Y., Laghdir, A., Fafard, M. (2010). Cantilever experimental setup for rheological parameter identification in relation to wood drying. Wood Science and Technology, 44(1), 31–49. DOI 10.1007/s00226-009-0274-1. [Google Scholar] [CrossRef]
11. To, L., Fragiacomo, M., Balogh, J., Gutkowski, R. M. (2011). Long-term load test of a wood-concrete composite beam. Proceedings of the Institution of Civil Engineers-Structures and Buildings, 164(2), 155–163. DOI 10.1680/stbu.9.00103. [Google Scholar] [CrossRef]
12. Yeoh, D., Boon, K. H., Loon, L. Y. (2013). Timber-concrete composite floor beams under 4 years long-term load. Zootaxa, 3177, 24–32. [Google Scholar]
13. Kaboorani, A., Blanchet, P., Laghdir, A. (2013). A rapid method to assess viscoelastic and mechanosorptive creep in wood. Wood and Fiber Science, 45(4), 370–382. [Google Scholar]
14. Angellier, N., Dubois, F., Pitti, R. M., Diakhaté, M., Loko, R. S. A. (2017). Influence of hygrothermal effects in the fracture process in wood under creep loading. Engineering Fracture Mechanics, 177, 153–166. DOI 10.1016/j.engfracmech.2017.04.009. [Google Scholar] [CrossRef]
15. Moosavi, V., Khademi Eslam, H., Bazyar, B., Najafi, A., Talaeepoor, M. (2017). Bending creep behavior of hornbeam wood. Drvna industrija: Znanstveni časopis za pitanja drvne tehnologije, 67(4), 341–350. DOI 10.5552/drind.2016.1609. [Google Scholar] [CrossRef]
16. Chiniforush, A. A., Akbarnezhad, A., Thakore, P., Ataei, A. (2018). Long-term tensile behaviour of engineered wood in parallel to grain direction. Seoul, Korea: World Conf. Timber Eng. [Google Scholar]
17. Hermawan, A., Fujimoto, N. (2019). Viscoelastic creep behavior of surface-and inner-layers of sugi boxed-heart timber under various temperatures. Journal of Wood Science, 65(1), 350. DOI 10.1186/s10086-019-1836-y. [Google Scholar] [CrossRef]
18. GB/T 1933-2009 (2009). Method for determination of the density of wood. Beijing, China: Standards Press of China. [Google Scholar]
19. GB/T 1931-2009 (2009). Method for determination of the moisture content of wood. Beijing, China: Standards Press of China. [Google Scholar]
20. GB/T 1935-2009 (2009). Method of testing in compressive strength parallel to grain of wood. Beijing, China: Standards Press of China. [Google Scholar]
21. GB/T 1938-2009 (2009). Method of testing in tensile strength parallel to grain of wood. Beijing, China: Standards Press of China. [Google Scholar]
22. GB/T 1936.1-2009 (2009). Method of testing in bending strength of wood. Beijing, China: Standards Press of China. [Google Scholar]
23. GB/T 15777-2017 (2009). Method for determination of the modulus of elasticity in compression parallel to grain of wood. Beijing, China: Standards Press of China. [Google Scholar]
24. ASTM, A. (2009). D143-09: Standard test methods for small clear specimens of timber. West Conshohocken, PA, USA: ASTM International. [Google Scholar]
25. GB/T 50329-2012 (2012). Standard for test methods of timber structures. Beijing, China: Standards Press of China. [Google Scholar]
26. GB/T 50708-2012 (2012). Technical code of glued laminated timber structures. Beijing, China: Standards Press of China. [Google Scholar]
27. Wang, F. H. (2005). The rheology of wood materials. China: Northeast University Press. [Google Scholar]
28. Dinwoodie, J. M. W., Higgins, J. A., Robson, D. J., Paxton, B. H. (1990). Creep in chipboard. Part 7: Testing the efficacy of models on 7–10 years data and evaluating optimum period of prediction. Wood Science and Technology, 24(2), 181–189. DOI 10.1007/BF00229053. [Google Scholar] [CrossRef]
29. Forest Products Laboratory (US) (1987). Wood handbook: Wood as an engineering material (No. 72). Washington DC, USA: Superintendent of Documents, The Laboratory. [Google Scholar]
30. Eurocode, C. E. N. (2004). 5: Design of timber structures. Part 1-1: General, Common rules and rules for buildings. Brussels: CEN. [Google Scholar]
 | This work is licensed under a Creative Commons Attribution 4.0 International License, which permits unrestricted use, distribution, and reproduction in any medium, provided the original work is properly cited. |