| Journal of Renewable Materials |
DOI: 10.32604/jrm.2022.018475
ARTICLE
Study on Triaxial Mechanical Properties and Micro Mechanism of Fly Ash Reinforced Cement Calcareous Sand
1School of Civil Engineering, Shaoxing University, Shaoxing, 312000, China
2College of Civil Engineering and Architecture, Hainan University, Haikou, 570228, China
3School of Qilu Transportation, Shandong University, Jinan, 250002, China
*Corresponding Authors: Na Li. Email: lina@usx.edu.cn; Jun Hu. Email: hj7140477@hainanu.edu.cn
Received: 27 July 2021; Accepted: 01 September 2021
Abstract: In order to study the mechanical properties and micro-mechanism of industrial waste fly ash-reinforced cement calcareous sand (FCS), the triaxial unconsolidated undrained (UU) test and scanning electron microscope tests (SEM) were carried out on it. The results of UU test show that the peak stress and energy dissipation of the FCS sample first increase and then decrease with the increase in fly ash content. Fly ash enhances the cement calcareous sand by increasing both the cohesion and internal friction angle, and adding 10% content of fly ash gives the largest values. The SEM test results shows that the hydration products of cement and fly ash filled the pores and cracks on the surface of the calcareous sand, which increased the compactness and structure of the FCS samples. The porosity of cement calcareous sand can be reduced from 27.6% to 12.8% by adding 10% fly ash. A brittleness evaluation index based on energy dissipation is proposed to quantitatively characterize the brittleness of FCS samples. The results show that when the content of fly ash is 5%, the brittleness of FCS samples is the lowest. This study shows that the mechanical properties of cement calcareous sand can be effectively enhanced by adding the appropriate amount of fly ash.
Keywords: Calcareous sand; cement; fly ash; triaxial UU test; SEM test
Calcareous sand is a type of marine biological detrital sediment having a calcium carbonate content of more than 50%, and the main mineral components are aragonite, calcite, and dolomite [1]. The main sources of calcareous sand are the in-situ deposition or near-source transport and deposition of the skeletal remains of coral reefs, coralline algae, and other marine organisms [2]. Calcareous sand retains the micropores in the biological skeleton, which makes it porous [3], easy to break [4], and highly permeable [5]. Calcareous sand is widely distributed across the coastal area and islands. With the development of the coastal areas, it is inevitable to carry out extensive construction activities on calcareous sand foundation [6]. Due to the poor physical and mechanical properties of calcareous sand, the bearing capacity of these foundations is very low [7]. Therefore, research on the reinforcement of calcareous sand foundations has important practical engineering significance.
Presently, Portland cement is the most widely used cementing and curing material in engineering. There are many studies on the use of Portland cement in the reinforcement of foundation materials [8–11]. Because Portland cement has a good solidification effect on ordinary foundation soil, researchers have also carried out many related studies on cement reinforced calcareous sand. Wang et al. [12] compared the cementing effects of building gypsum, calcite powder, and Portland cement on the mechanical properties of calcareous sand through triaxial tests. The results showed that the use of Portland cement with calcareous sand could achieve better results. Yang et al. [13] examined cement calcareous sand reinforced with various cement proportions using SEM and established the mathematical relationship between the microstructure-related indexes and unconfined compressive strength of the cement calcareous sand. Gu et al. [14] analyzed the microstructure changes in cement calcareous sand during cement hydration through nuclear magnetic resonance tests, and quantitatively explained the influence of cement content and curing time on its strength through the change in porosity of the cement calcareous sand. Xu et al. [15] studied the effect of gradation on the mechanical properties of cement calcareous sand through a static compression test and impact test. The study showed that the wider the grading range of calcareous sand, the stronger the compressive strength and resistance of cement calcareous sand. Wang et al. [16] studied the mechanical properties of cement and nano clay composite-modified calcareous sand through unconfined compression tests, and the results showed that adding nano clay can improve the compressive strength and deformation modulus of the cement calcareous sand. The above studies show that Portland cement can play a better role in cementing calcareous sand and can effectively enhance the mechanical properties of calcareous sand. Industrial waste fly ash has been widely used as an admixture in cement-based materials such as concrete and cement-soil [17–21]. In addition to acting as a filler in cement-soil, it also participates in chemical reactions to generate products like that of cement hydration [22], which can effectively improve the strength of cement-soil. There have been many relevant studies on cement calcareous sand, cement can provide interparticle cementation for calcareous sand by forming hydration products and improve the strength of calcareous sand [23]. However, cement needs to consume a lot of energy and produce a lot of greenhouse gases in the production process [24], which makes cement an environmentally unfriendly industrial product. In the existing research, fly ash is mainly used to modify cement soil [25–27], fly ash can enhance the mechanical properties of cement soil, but there are few application studies in cement calcareous sand. Therefore, consider using industrial waste fly ash to replace and supplement cement, in order to enhance the mechanical properties of cement calcareous sand and reduce carbon emissions and resource consumption at the same time.
For the brittleness of geotechnical materials, many evaluation methods have been proposed from multiple aspects, such as brittleness indexes based on stress-strain curves [28], penetration tests [29], strength characteristics [30], etc., but these brittleness indexes all have corresponding defects [31]. When geotechnical materials are subjected to external loads, the energy absorbed by the materials can be divided into the absorption energy of elastic-plastic deformation before failure and dissipated energy after failure [32]. Based on the energy theory, Chen et al. [33] proposed a brittleness index that considered both the pre-peak brittleness index and the post-peak brittleness index, because it distinguished different stress-strain curve shapes from the perspective of the energy theory, thus avoiding the traditional brittleness evaluation index that fails to reflect the post-peak stress drop speed. Based on the above study, an evaluation method for the brittleness of samples from the perspective of energy dissipation was proposed in this study.
In this study, triaxial unconsolidated undrained tests and SEM microscopic tests were carried out on cement calcareous sand mixed with industrial waste fly ash to explore the feasibility of using industrial waste to modify cement calcareous sand, which provides a reference for the application of fly ash in practical calcareous sand foundation reinforcement projects.
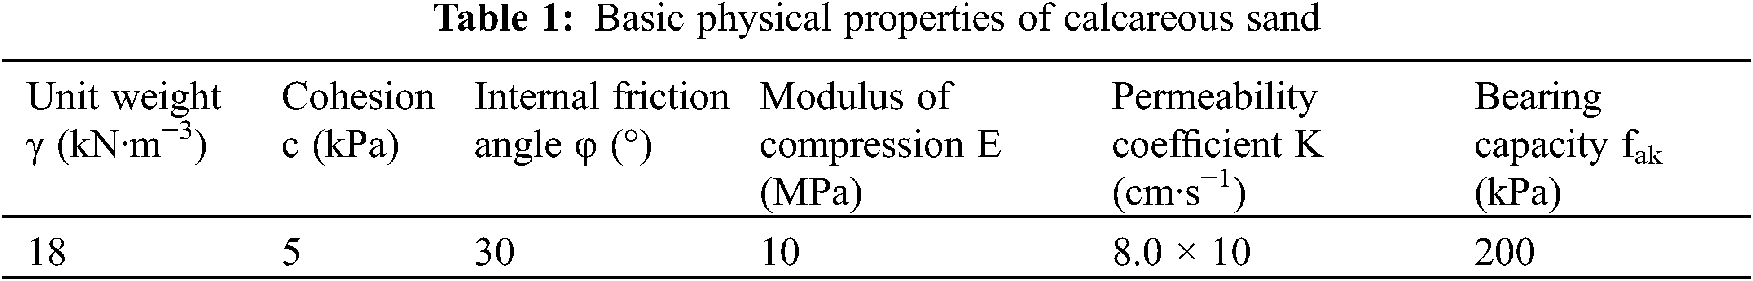
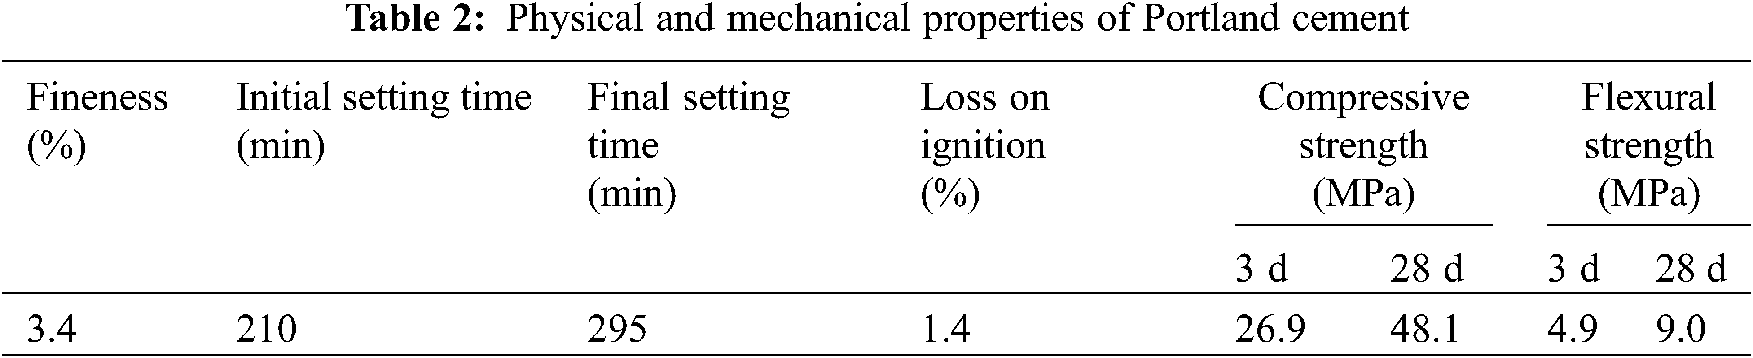
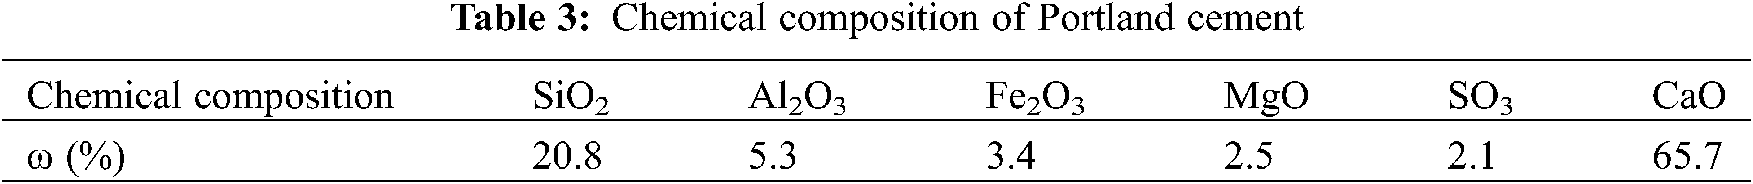
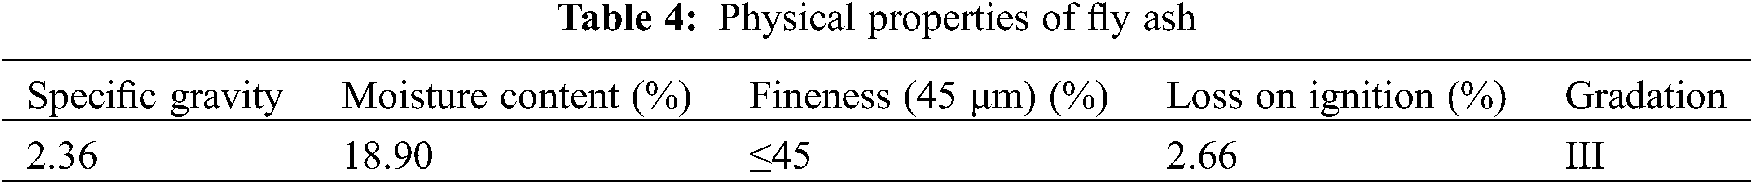
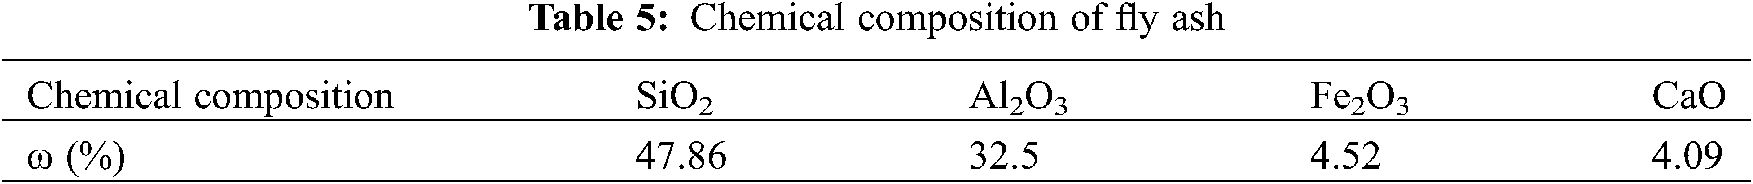
The calcareous sand used in this test was collected from Yongxing Island, Sansha City, Hainan Province, China. The overall particle size was less than 2 mm, and its physical properties were obtained according to the standard for geotechnical test methods (GB/T 50123-2019) [34], as shown in Table 1. The chemical composition of calcareous sand is mainly calcium carbonate. PC32.5 Portland cement produced by Anhui Conch Cement Co., Ltd., China was used, and its physical and mechanical properties were obtained according to the standard for general Portland cement (GB 175-2020) [35], as shown in Table 2. The chemical composition of cement is shown in Table 3. Fly ash is a by-product of coal-fired power generation of Zheneng Shaoxing Binhai Thermal Power Co., Ltd., China, and its basic physical properties were obtained according to the Standard for the fly ash used for cement and concrete (GB/T 1596-2017) [36], as shown in Table 4. The chemical composition of fly ash is shown in Table 5.
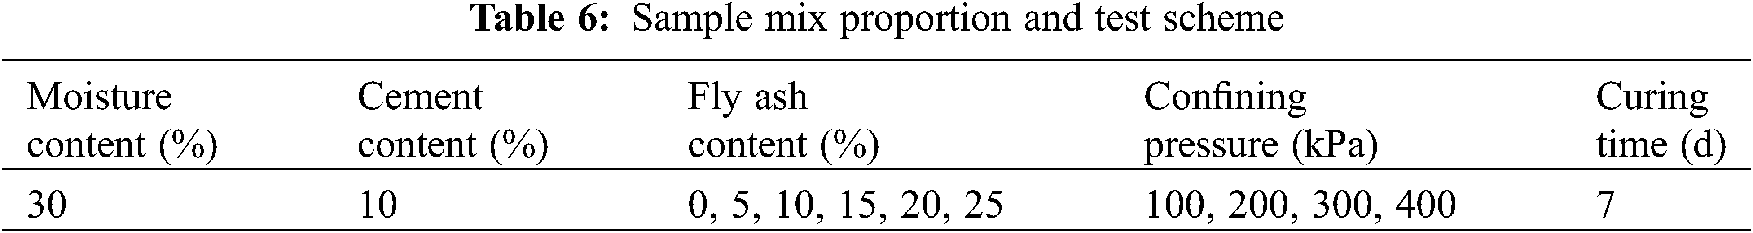
According to the actual engineering background and the existing research on fly ash modified cement-based materials [37], it is determined that the amount of fly ash used in this study is 0%, 5%, 10%, 15%, 20% and 25%, and the curing age is 7 days. To explore the strengthening effect of different amounts of fly ash on cement calcareous sand at early age. The test material was divided into 6 groups with 4 samples in each group. The moisture content, cement content, fly ash content, confining pressure, and curing time of the test samples are shown in Table 6. The content of cement and fly ash in the Table 6 is the percentage of the quality of dry sand, and the moisture content is the percentage of the total mass of dry sand, cement and fly ash.
According to the Standard for Geotechnical Test Methods (GB/T 50123-2019) [34] and the designed test scheme, the sample preparation process for the unconsolidated and undrained triaxial test in this study can be divided into the following steps:
1. Put the calcareous sand in 105 ± 1°C oven for 24 hours for drying. The dried calcareous sand is filtered through a 2 mm sieve, and the calcareous sand with particle size less than 2 mm is taken as the raw material for making the sample.
2. Appropriate quantities of calcareous sand, cement and fly ash are weighted and use a mixer to stir for 10 min at the speed of 285 ± 10 r/min. Then weigh appropriate quantities of water, add it into the mixture after mixing, and continue to stir for 10 min at the same speed.
3. Samples are made by four-layer compaction. Take 42.5 g of the mixture mixed evenly and pour it into a three petal mold with a height of 80 mm and a diameter of 39.1 mm. Control the compaction height of each layer to be 20 mm. After one layer of compaction is completed, roughen the surface. Repeat the above compaction and roughening operation for four times, and then flatten the top surface of the sample to complete the sample production.
4. After the sample is made, the three petal mold with the sample is placed in the standard curing box for curing. After curing for 3 days, take out the sample from the mold, wrap it with plastic film, and continue to placed it in the standard curing box to complete the subsequent curing.
According to the Standard for Geotechnical Test Methods (GB/T 50123-2019) [34], the maximum axial strain ε was set at 10%. Fig. 1 shows the relationship between the deviatoric stress q and axial strain ε of the FCS samples. According to the Standard for Geotechnical Test Methods, when there is a peak value in the stress-strain curve, the deviatoric stress corresponding to the peak value is taken as the peak stress, when the stress-strain curve is hardening type (no peak value), the deviatoric stress corresponding to the axial strain value of 10% is taken as the peak strength. The stress-strain curves of FCS specimens in Fig. 1 are softening curves, so the peak strength of each sample is obtained by taking the peak point of the stress-strain curve as the peak strength, as shown in Fig. 2. It can be seen from Fig. 2 that under the same confining pressure, with the increase in fly ash content, the peak stress of the FCS sample first increases and then decreases. When the fly ash content is 10%, the peak stress is the largest, and the reinforcement effect of fly ash is the best. This is similar to the results of Shao et al.’s study [38], which uses cement and fly ash to strengthen soft soil, and the best content of fly ash is 12%. It may be that the difference in the basic physical properties of soft soil and calcareous sand leads to the difference in the optimum content of fly ash modified cement soil. When the confining pressures are 100, 200, 300, and 400 kPa, respectively, compared with FCS samples with a fly ash content of 0%, the peak stress of FCS samples with a fly ash content of 10% increases by 95.4%, 111.9%, 105.2 %, and 124.2%, respectively. Under the same content of fly ash, the peak stress of FCS samples increases with the increase of confining pressure.
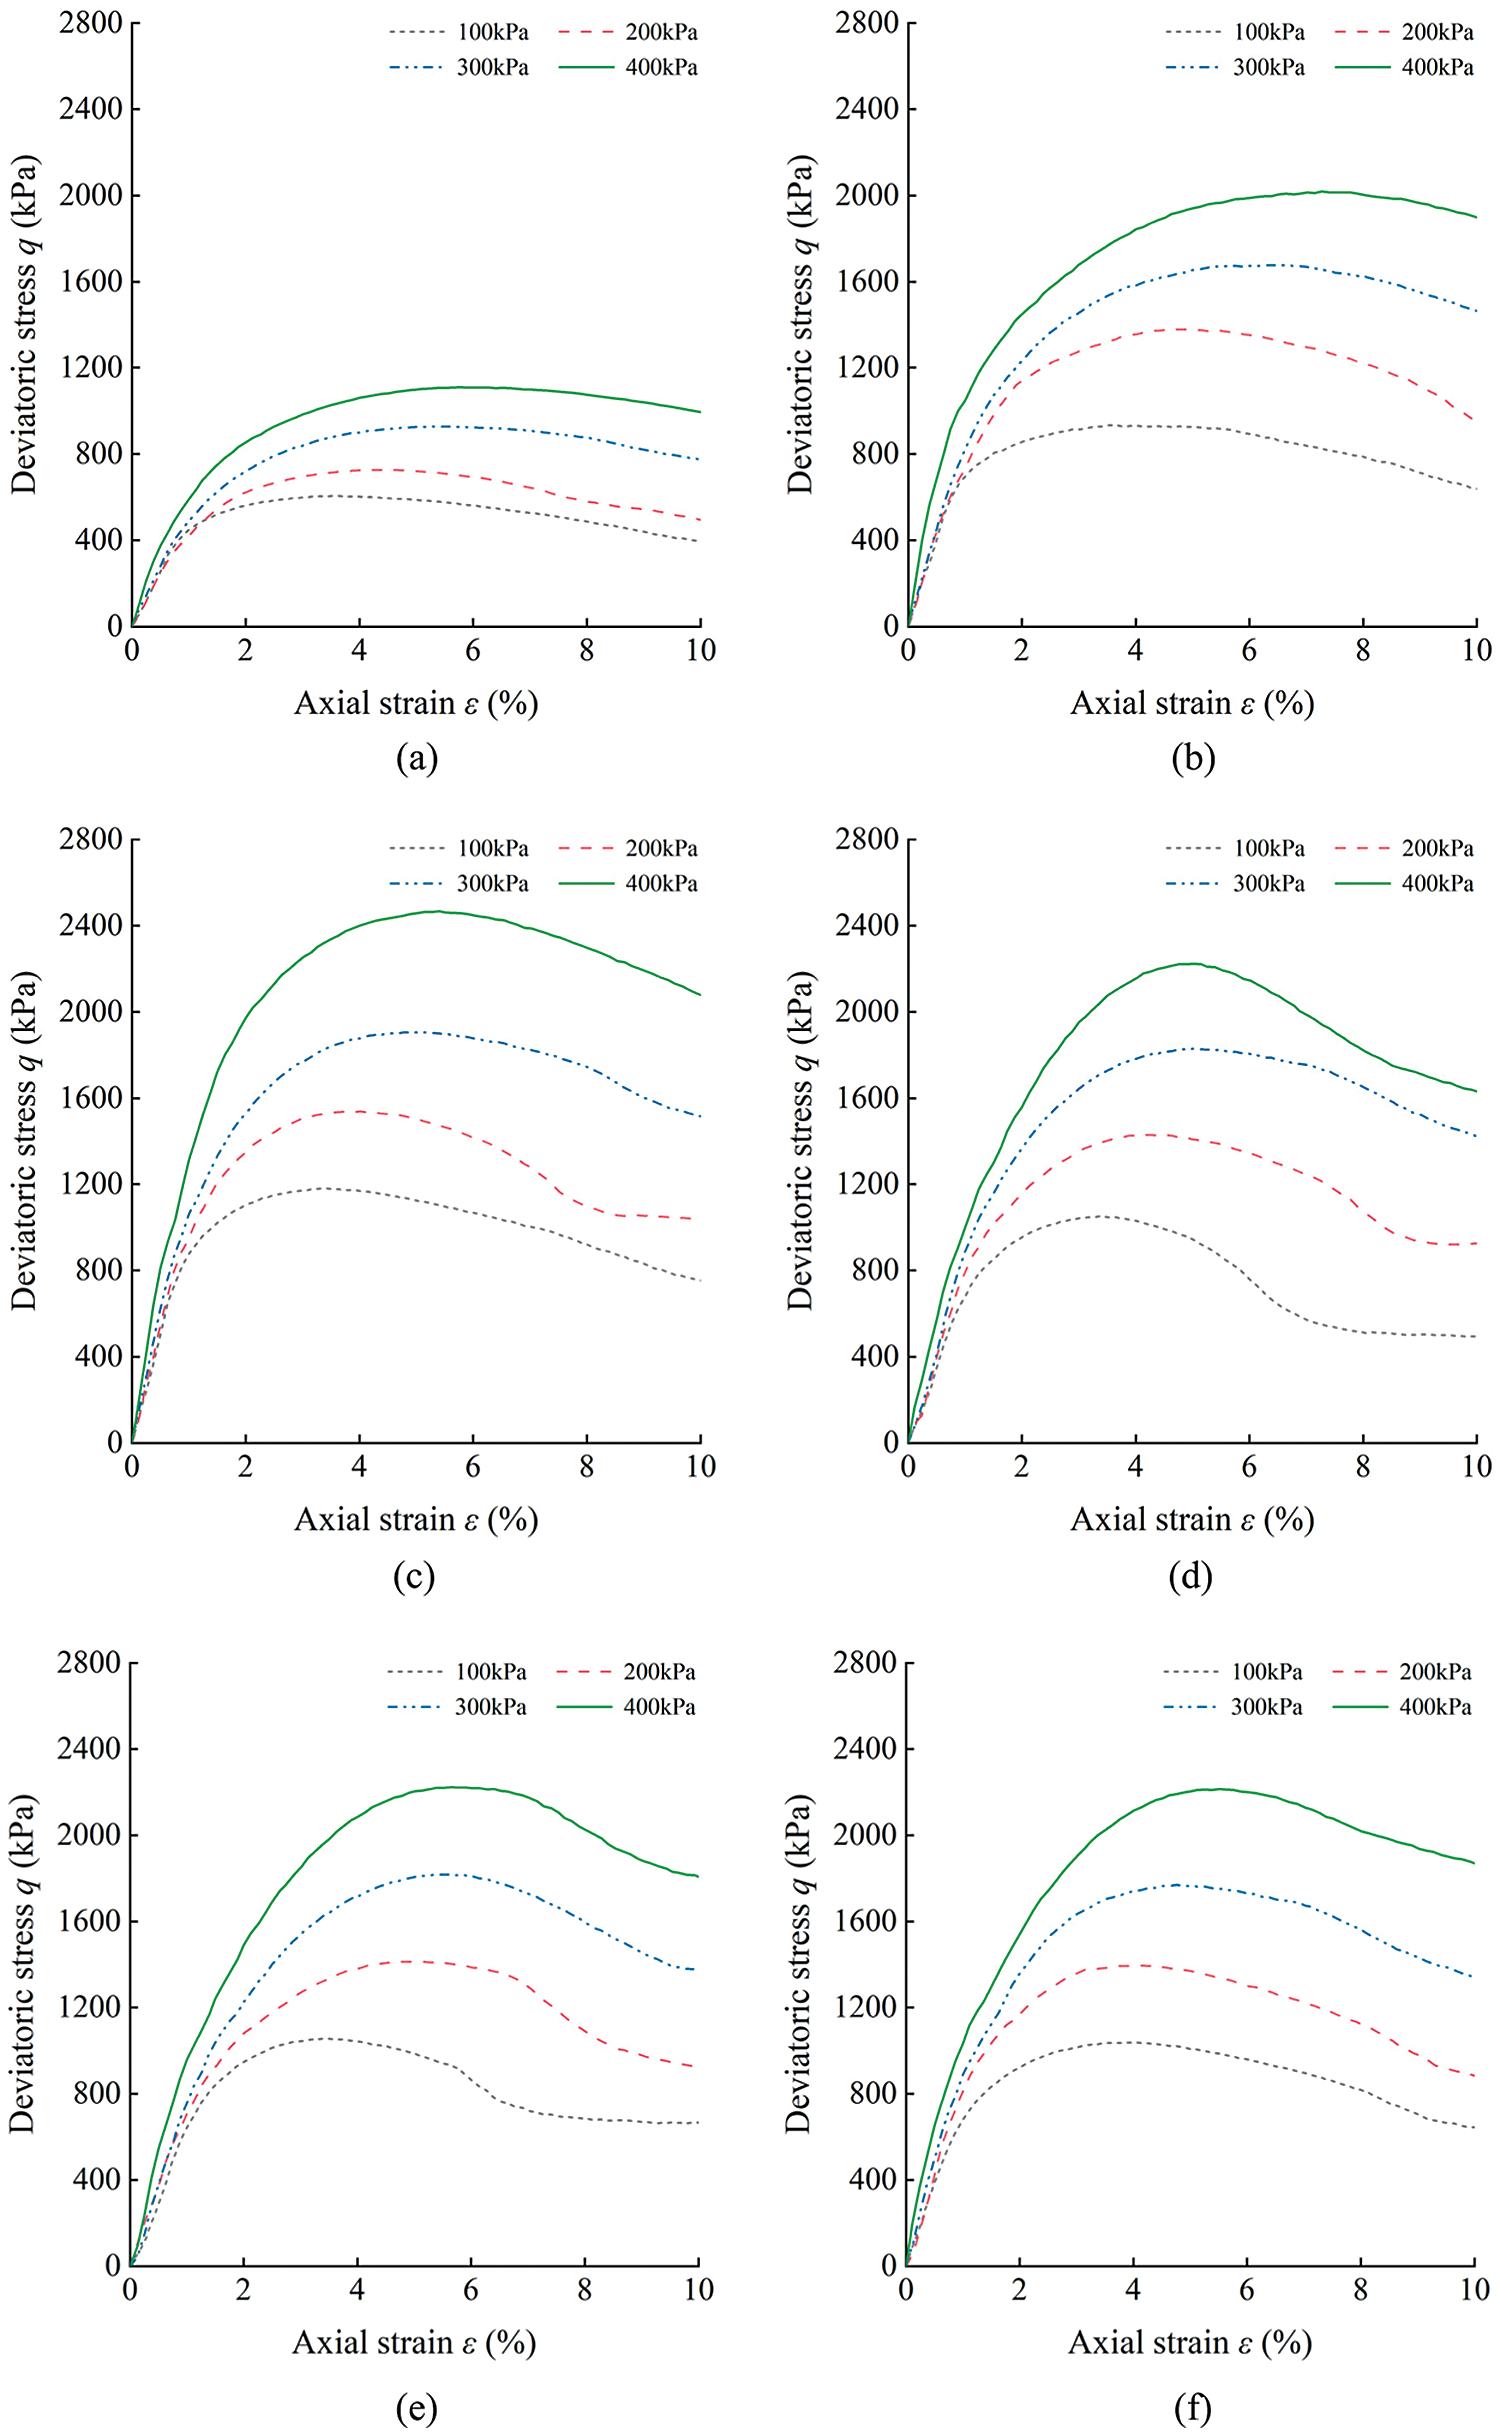
Figure 1: Deviatoric stress-strain curves of FCS samples with different fly ash contents. (a) fly ash content of 0% (b) fly ash content of 5% (c) fly ash content of 10% (d) fly ash content of 15% (e) fly ash content of 20% (f) fly ash content of 25%
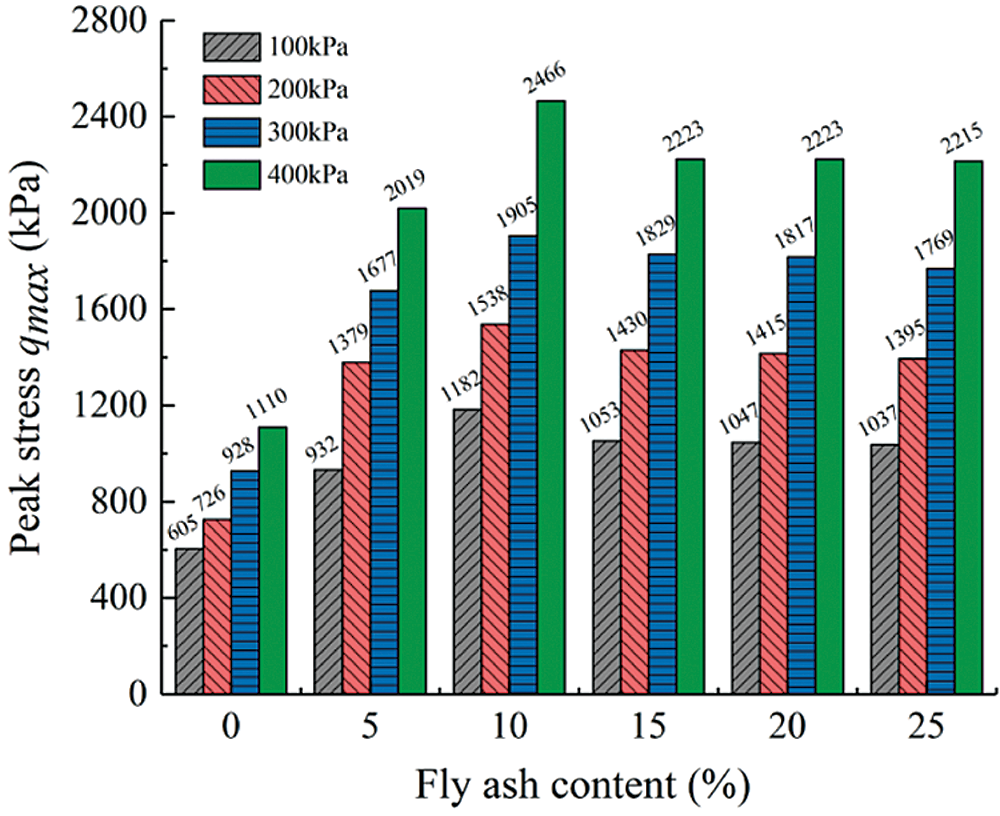
Figure 2: Peak stress of FCS samples with different fly ash contents
Through the above analysis, it is known that there is a relationship between the peak stress qmax of FCS sample and the content of fly ash FC and confining pressure σ3. Through the correlation analysis of the three, the mathematical relationship among the three is obtained as follows:
From Eq. (1), we can get the variation law of the peak strength of FCS sample with fly ash content and confining pressure. The correlation coefficient between the theoretical value and the measured value is R2 = 0.93, and the fitting effect is ideal. Fig. 3 shows the fitting surface of the peak strength varying with the fly ash content and confining pressure and the actual peak strength measured under different test conditions. It can be seen from the figure that the measured values are distributed above and below the fitting surface, and the fitting effect is ideal.
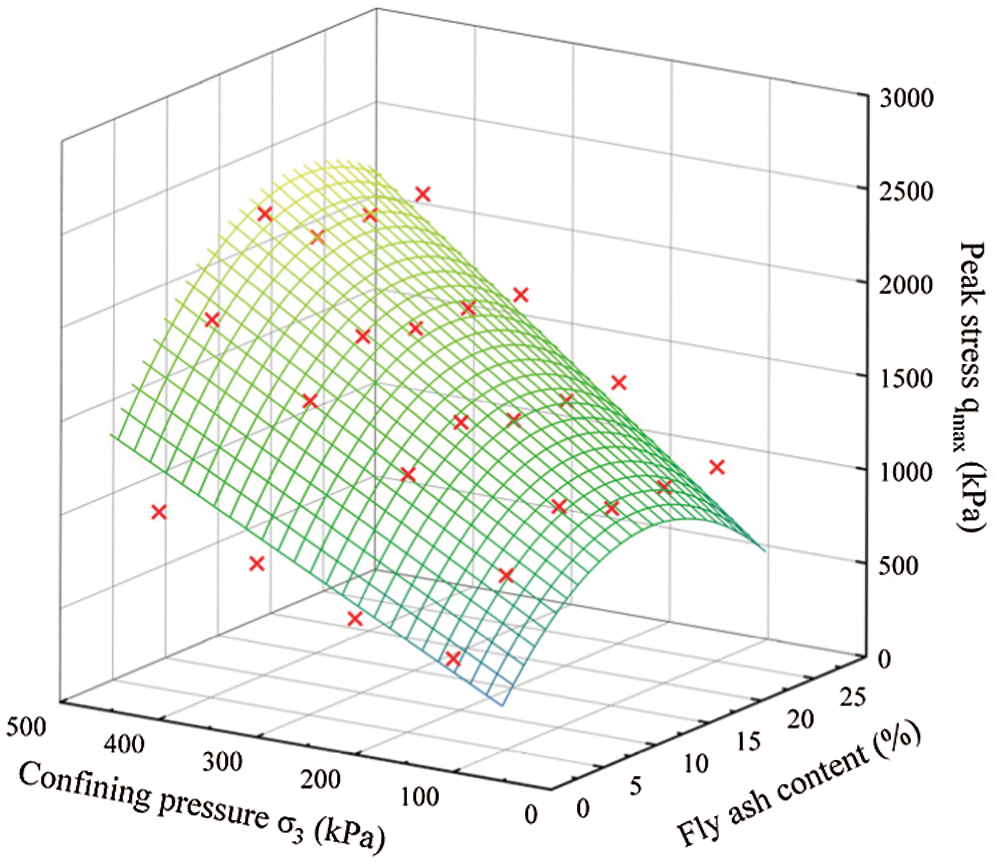
Figure 3: Variation of FCS peak stress with fly ash content and confining pressure
According to the deviatoric stress-strain curve, the Mohr failure stress circle of each group of samples was plotted, and the common tangent of the Mohr circle under each confining pressure was taken as the shear strength envelope of the sample, as shown in Fig. 4. The shear strength envelope obtained in this study has a certain inclination angle, which is different from the horizontal shear strength envelope obtained by the traditional UU test. This is mainly because the cement hydration products fill and seal the pores in the cement-soil. There are closed pores inside the cement-soil, which affect the saturation of cement-soil. Cement-soil is in a state of low saturation in the test [39]. However, in the UU test of low-saturated soil, the change in confining pressure cannot be offset by the equal pore-water pressure [40], and the peak stress of the soil will increase with the increase in the confining pressure.
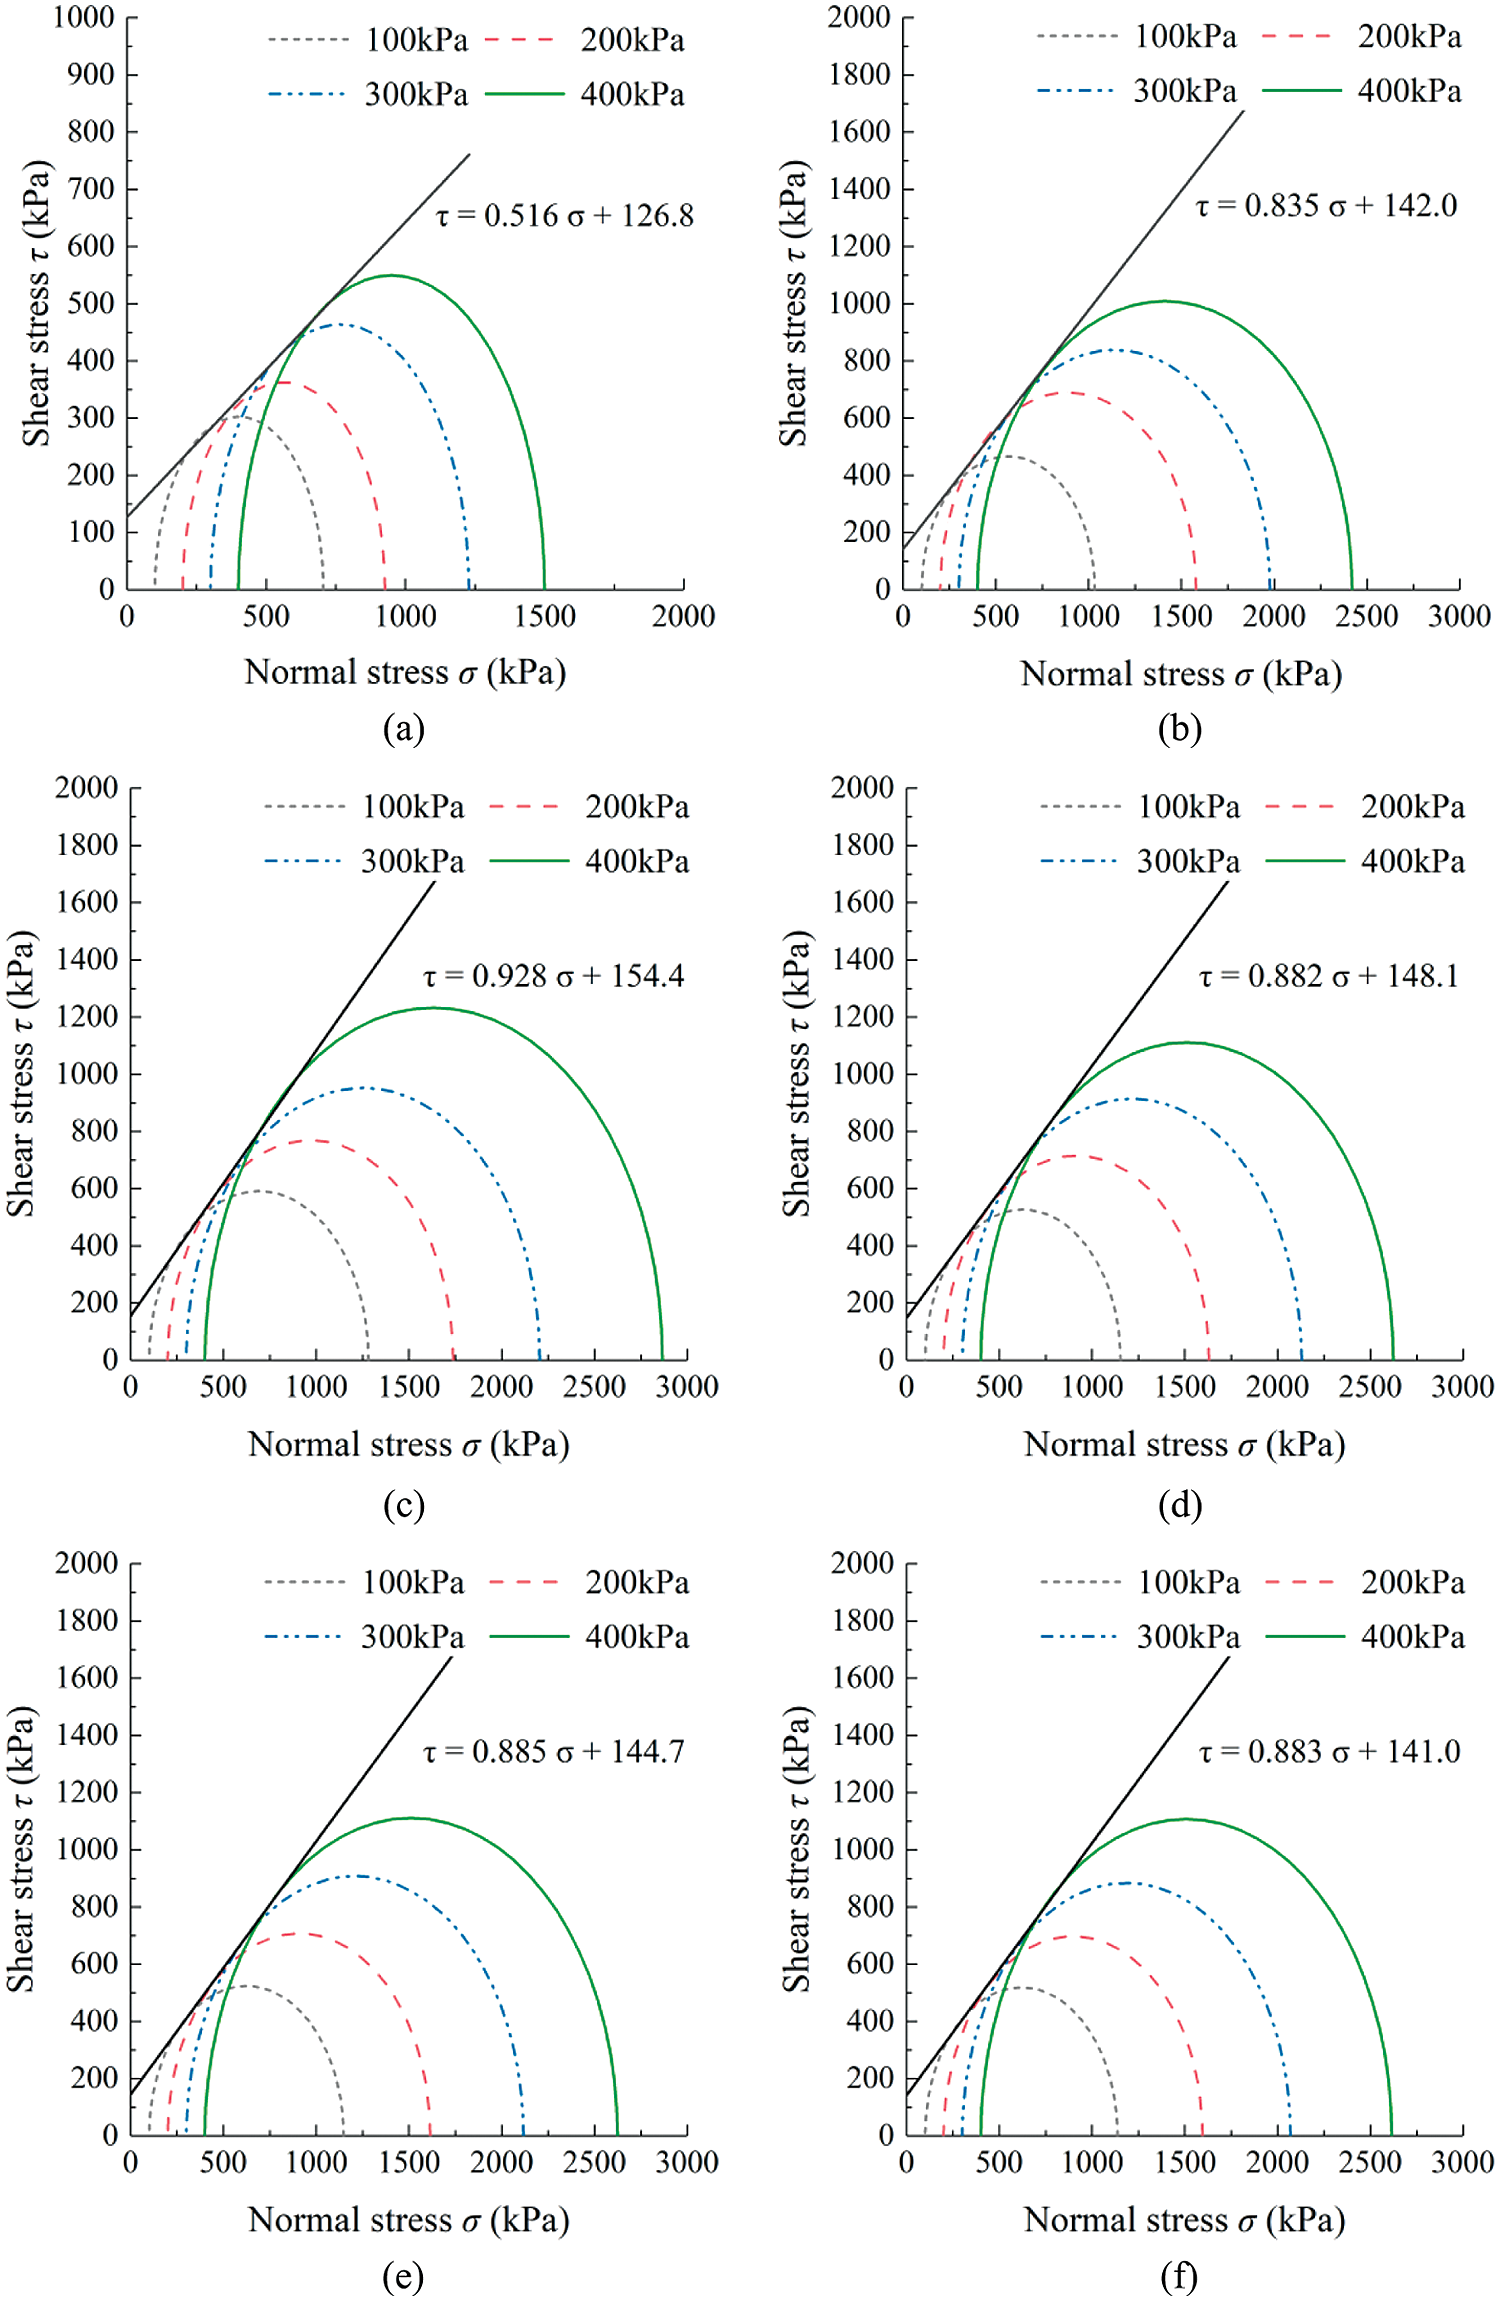
Figure 4: Mohr failure stress envelope of FCS samples with different fly ash content. (a) fly ash content of 0% (b) fly ash content of 5% (c) fly ash content of 10% (d) fly ash content of 15% (e) fly ash content of 20% (f) fly ash content of 25%
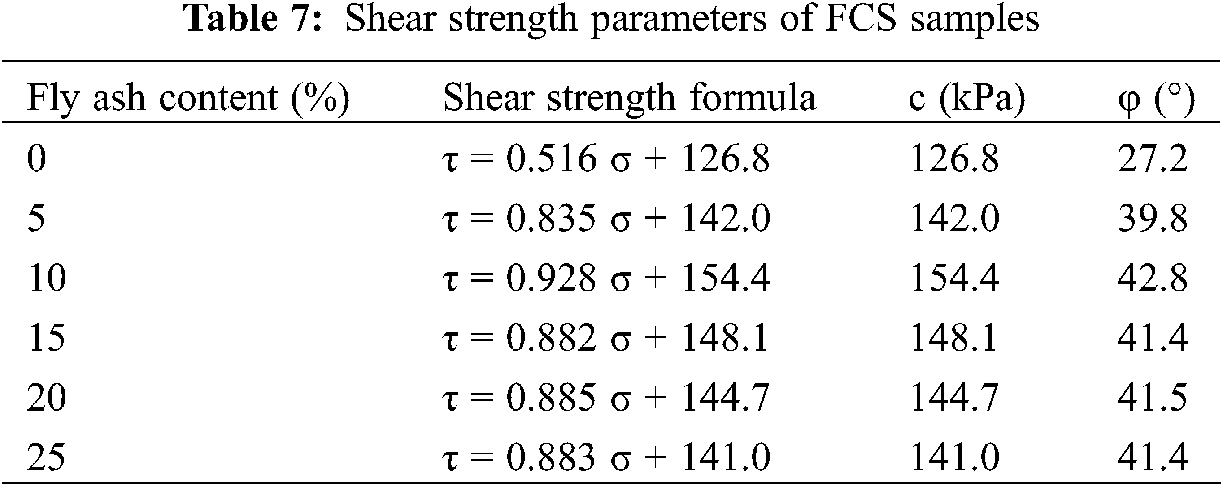
The shear strength parameters c and φ, and the shear strength formula of the sample are obtained from the shear strength envelope, as shown in Table 7. It can be seen from the data in Table 7 that the cohesion and internal friction angle of the FCS sample with a fly ash content of 0% are 126.8 kPa and 27.2°, respectively. The cohesion and internal friction angle of the FCS sample with a fly ash content of 10% are 154.4 kPa and 42.8°, respectively. The fly ash content increases from 0% to 10%, and the cohesion and internal friction angle of the FCS sample increases by 21.8% and 57.4%, respectively, indicating that fly ash can enhance the shear strength of FCS by simultaneously increasing its cohesion and internal friction angle. A further increase in fly ash content will result in a decrease in the cohesion and internal friction angle. When the fly ash content is 10%, the cohesion and internal friction angle reach the maximum. At a short curing age, fly ash acts mainly as a micro-aggregate and directly fills the pores on the surface of calcareous sand. It can also cooperate with cement hydration products, to improve the cement and fill the pores on the surface of the calcareous sand and between the particles. When the fly ash content is too high, the fly ash particles will wrap the cement particles, which will affect the hydration of cement [37]. Therefore, there is an optimal content of fly ash to reinforce cement calcareous sand. The optimal fly ash content obtained in this study is 10%. In the study of Redi [41], the best soft soil reinforcement effect was obtained by using 3.5% cement and 8% fly ash, which further proves that the optimum content of fly ash needs to be reduced when the cement content is low, otherwise excess fly ash will adversely affect the hydration reaction of cement, which is the same as the conclusion obtained in this study. The pozzolanic reaction of fly ash can effectively improve the properties of cement-based materials, but it can only occur gradually over a long period of alkali excitation [42]. Therefore, the follow-up research on the enhancement of cement calcareous sand with alkali-activated fly ash remains to be developed.
3.3 Deviatoric Stress-Strain Curve
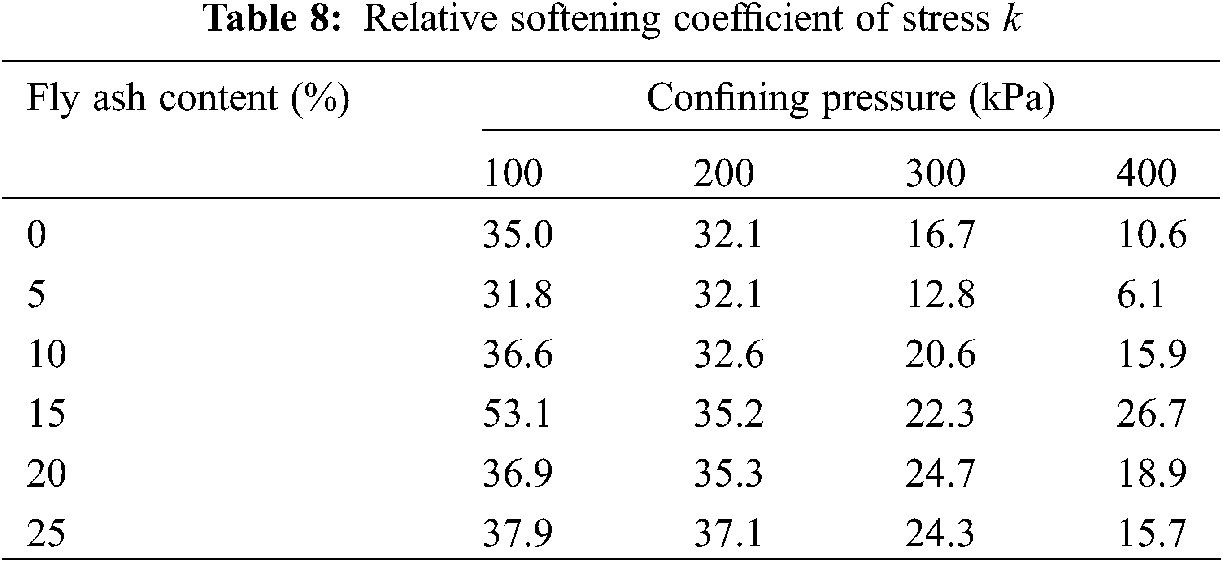
According to the deviatoric stress-strain curves of each group of samples in Fig. 1, it can be found that the q-ε curves of the FCS samples are all softening curves. To further analyze the softening characteristics of the q-ε curve quantitatively, the “relative softening coefficient of stress” k [43] is introduced as follows:
where, qp is the peak stress, namely, the peak point of the q-ε curve; qr is the residual stress, namely, the stress value corresponding to the axial strain ε at 10%. The smaller the k is, the closer the values of qp and qr of the q-ε curve are, and the less obvious the softening characteristics of the curve is. The bigger k is , the softening characteristics of the curve is more obvious. When k = 0, the softening characteristic of the curve disappears, and it presents a hardening curve.
The k values of each group of samples are shown in Table 8. It can be seen from the data in Table 8 that the softening characteristics of the q-ε curve of the FCS samples become less obvious as the confining pressure increases. Under the same confining pressure, when the fly ash content is 5%, the k value is the smallest, and the softening characteristics of the q-ε curve of the FCS sample with this fly ash content are the least obvious. When the content of fly ash is more than 5%, the curve softening characteristic of FCS sample increases gradually, which indicates that excessive fly ash will increase the softening characteristic of q-ε curve. However, under 400 kPa confining pressure, the softening characteristics of the q-ε curve gradually decrease when the content of fly ash is more than 15%. This may be because the weakening effect of confining pressure on the softening characteristics is greater than the increasing effect of fly ash content on the softening characteristics.
3.4 Brittleness Index and Energy Dissipation
Energy dissipation refers to the energy consumed by FCS when it is deformed and destroyed by external loads. The amount of energy dissipation can be obtained by calculating the area under the deviatoric stress-strain curve by using the integration tool in origin 2021 [44].
In this study, the axial strain of all the samples was 10%, and the energy dissipation with different fly ash contents and under different confining pressures was calculated by integration, as shown in Fig. 5. It can be seen from Fig. 5 that the energy dissipation of FCS samples with different fly ash content increases with the increase in confining pressure. When the fly ash content is 10%, as the confining pressure increases from 100 to 400 kPa, the energy dissipation increases by 114.8%. The energy dissipation first increases and then decreases with the increase in fly ash content and reaches the maximum value when the fly ash content is 10%, which is the same as the change rule of the peak stress with fly ash content. When the confining pressures are 100, 200, 300 and 400 kPa, compared with the FCS sample with fly ash content of 0%, the energy dissipation of the FCS sample with a fly ash content of 10% increases by 92.8% and 107.7%, 105.2% and 120.3%, respectively. With the increase of confining pressure, the FCS sample can absorb more energy. With the increase of the content of fly ash, the energy absorbed by the failure of FCS samples reached the maximum when the content of fly ash was 10%, and then gradually decreased and tended to be stable.
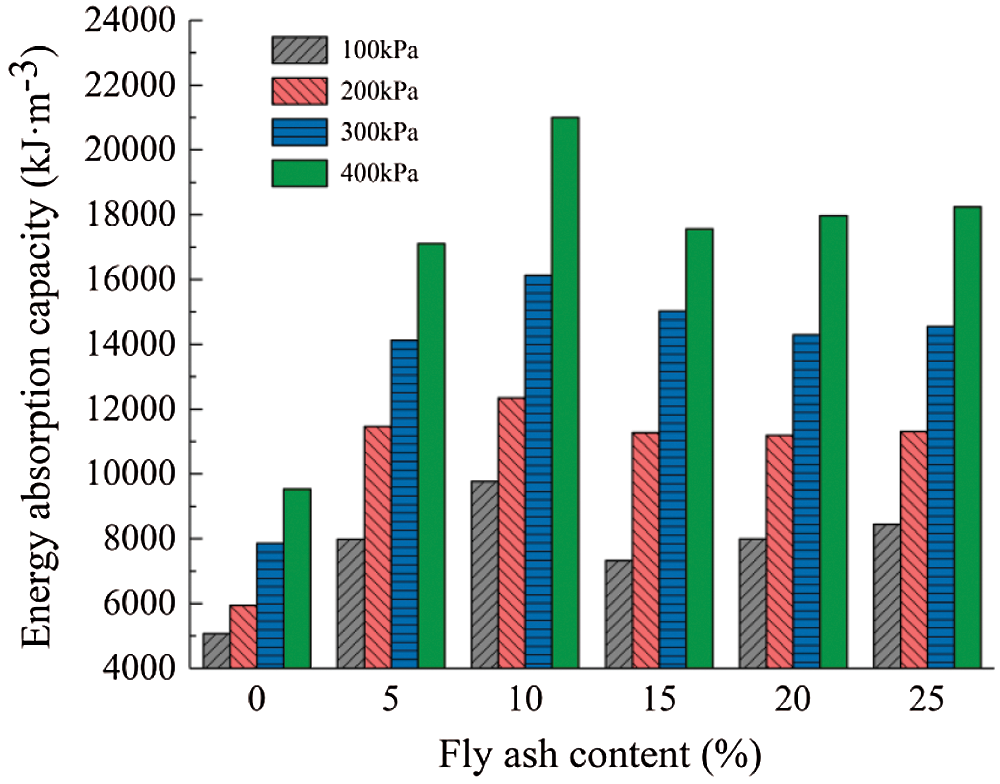
Figure 5: Energy dissipation of FCS samples with different fly ash content under different confining pressures
In this study, it is proposed to evaluate the brittleness of geotechnical materials using the total energy dissipation before and after the peak of the deviatoric stress-strain curve:
where, εp is the axial strain under the peak stress; εmax is the maximum axial strain assumed to be 10% in this study; and q is the deviatoric stress. The larger the K value, the greater the proportion of the energy absorbed by the sample before failure during loading and the smaller the brittleness of the sample, and vice versa.
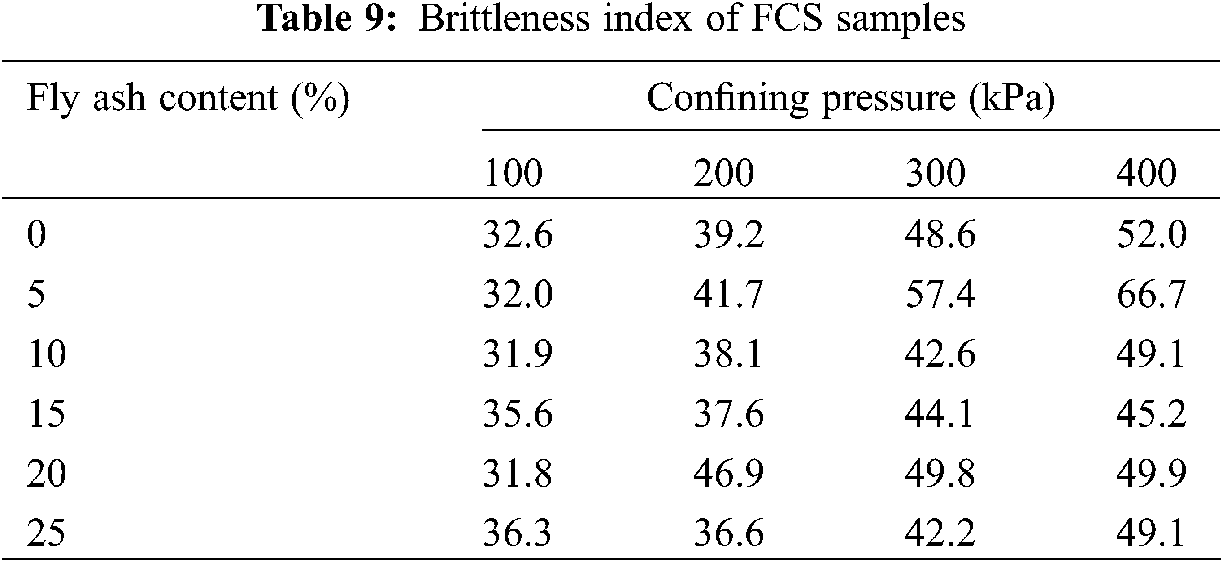
According to Eq. (3), the k values of FCS samples with different fly ash content and under different confining pressure are calculated, as shown in Table 9. It can be seen from the data in Table 9 that under the same confining pressure, the FCS sample with a fly ash content of 5% exhibits relatively low brittleness. When the confining pressure is 300 and 400 kPa, the brittleness of FCS samples with the fly ash content of 5% is obviously weaker than other FCS samples with different fly ash content, indicating that when the fly ash content is 5%, the cement calcareous sand has better ductility and can resist external loads under greater strain. The brittleness of FCS samples with different fly ash content decreases with the increase in confining pressure. When the fly ash content is 5% and the confining pressure increases from 100 to 400 kPa, the brittleness of the FCS sample decreases by 108.4%.
From the results obtained by the brittleness evaluation methods, it can be found that the brittleness of the FCS samples is related not only to the peak stress, but also to the pre-peak resistance to deformation of the samples and the degree of softening of the post-peak deviatoric stress-strain curve.
The changes in the peak stress and shear strength parameters of the FCS samples can be explained by SEM image analysis. Select calcareous sand, cement calcareous sand and FCS samples with 10% fly ash content as typical samples, we can study the microscopic mechanism of cement modified calcareous sand and the microscopic mechanism of calcareous sand modified by fly ash and cement. SEM images of calcareous sand particles, cement calcareous sand, and FCS samples with a fly ash content of 10% are shown in Fig. 6. It can be seen from Fig. 6a that a large number of pores occur naturally on the surface of calcareous sand particles, and there are also some smaller particles of calcareous sand in the surface pores, which agrees with Zhang et al.’s [45] conclusion that in calcareous sand, there exist small particles that fill the pores in the large particles. Fig. 6b shows an SEM image of the cement calcareous sand. The presence of calcium silicate hydrate generated by cement hydration reaction in the pores is evident, and the calcium silicate hydrate cements the small-sized calcareous sand particles that originally exist in the pores to better fill the pores on the surface of calcareous sand. Fig. 6c is the SEM image with a 500-times magnified FCS sample with a fly ash content of 10%. The cracks on the surface of calcareous sand are filled by cemented fly ash particles, and the fly ash still maintains its original spherical shape without pozzolanic reaction. Fig. 6d and Fig. 7 are the SEM image with a 2000-times magnification of the FCS sample with a fly ash content of 10%. Fig. 8 is the result of EDS scanning at the place indicated by the arrow in Fig. 7. The EDS scanning result shows that the needle-like crystals in the pores on the surface of the calcareous sand are calcium silicate hydrate. There are many hydrated calcium silicate and small-size calcareous sand particles cemented by hydrated calcium silicate on the surface of calcareous sand where the pores are originally formed. During the reinforcement process, fly ash is mainly used as a micro-aggregate to fill the pores and cracks on the surface of calcareous sand, increase the compactness, and improve the shear strength of the sample.
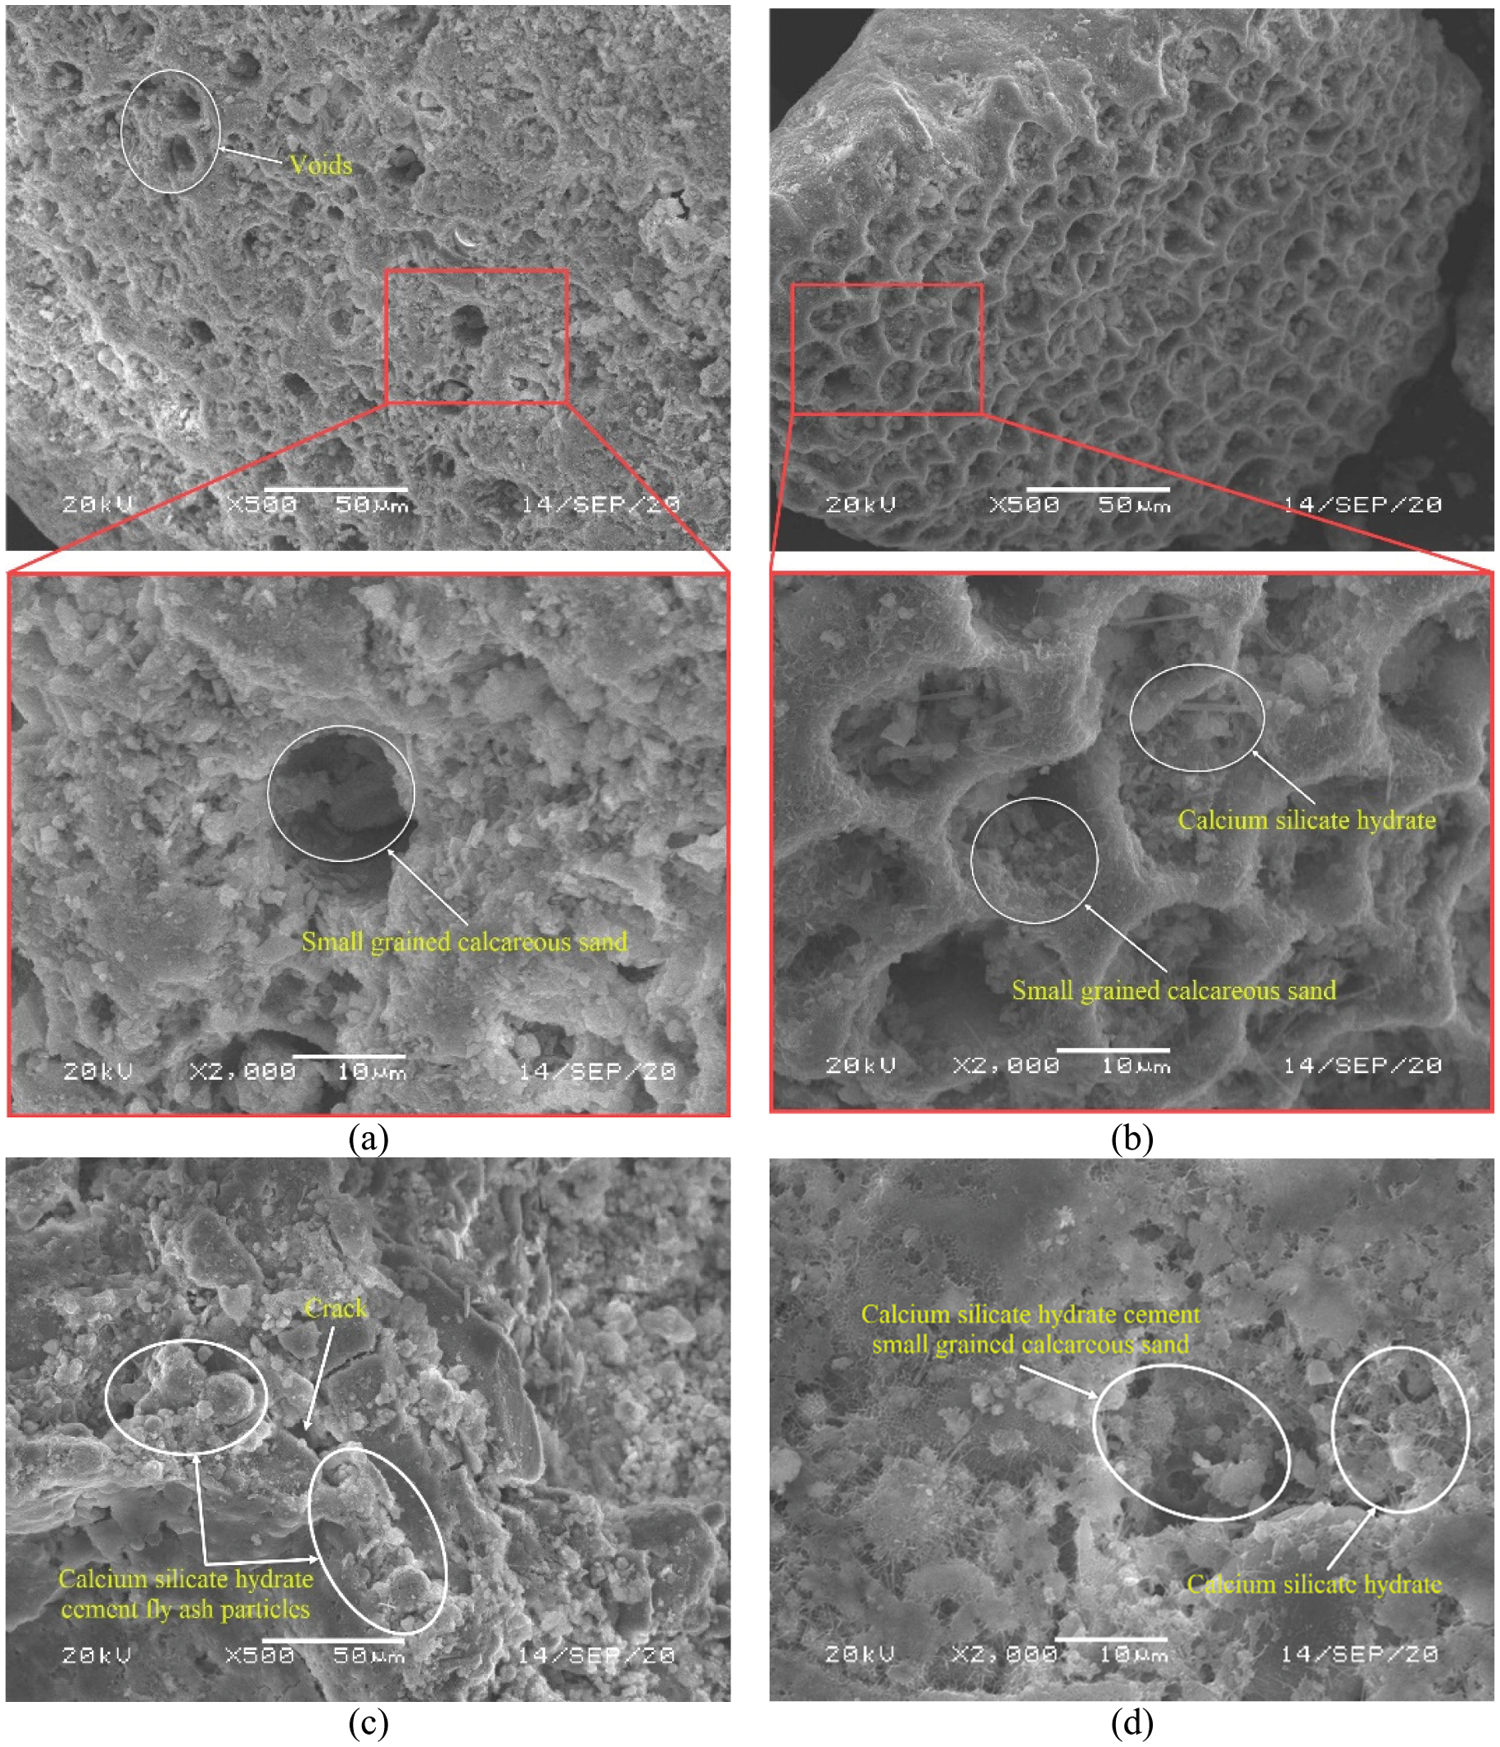
Figure 6: SEM images of calcareous sand, cement calcareous sand and FCS samples. (a) Calcareous sand particle (b) cement calcareous sand (c) 500 times magnification of FCS sample with fly ash content of 10% (d) 2000 times magnification of FCS sample with fly ash content of 10%
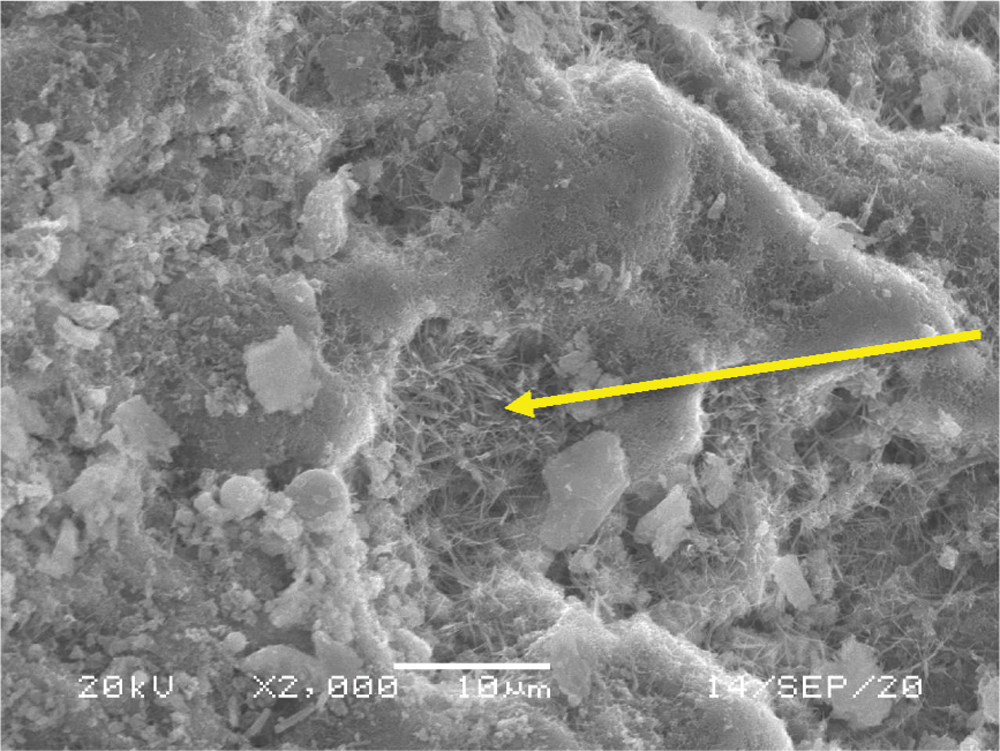
Figure 7: 2000 times magnification of FCS sample with fly ash content of 10%
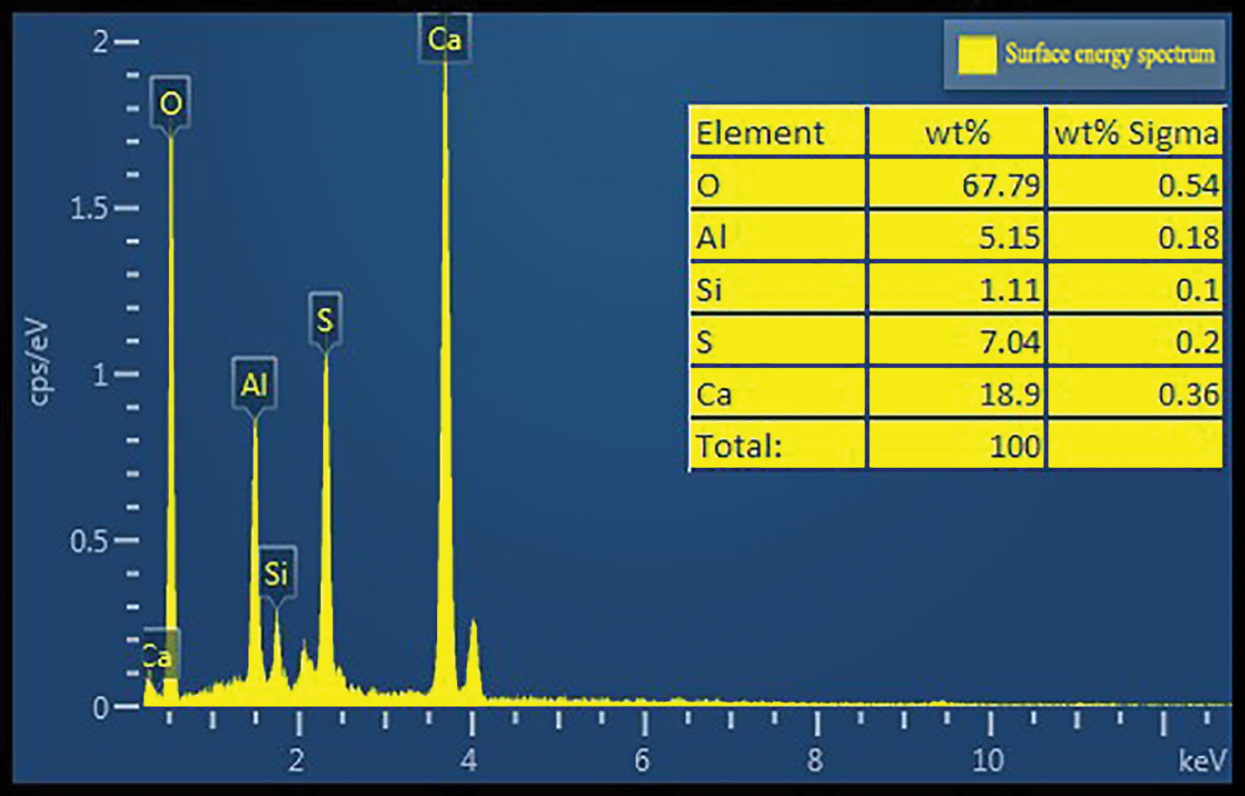
Figure 8: EDS scanning results of FCS sample with fly ash content of 10%
The SEM images of calcareous sand, cement calcareous sand and FCS sample with fly ash content of 10% at 500 and 2000 times were subjected to black-and-white binarization, as shown in Figs. 9–11. Fig. 9a is the SEM image of calcareous sand at 500 times magnification and the image after black-and-white binarization. Figs. 9b and 9c are the SEM images of calcareous sand at 2000 times magnification and the images after black-and-white binarization. Fig. 10a is the SEM image and processed image of cement calcareous sand at 500 times magnification. Figs. 10b and 10c are the SEM images and processed images of cement calcareous sand at 2000 times magnification. Figs. 11a is the SEM image and processed image of FCS sample with fly ash content of 10% at 500 times magnification. Figs. 11b and 11c are the SEM images and processed images of FCS sample with fly ash content of 10% at 2000 times magnification. Calculate the black area and white area in the black-and-white binarized image respectively, and the area of white part is the area occupied by pores. The porosity is obtained by dividing the white area by black area. It should be noted that in Fig. 10a, the area of the three invalid areas marked yellow in the SEM image needs to be deducted during the calculation. The SEM images with different magnification and different positions are used to calculate the porosity, which can make the calculation results more representative. The porosity calculation results of the three groups of samples are shown in Table 10.
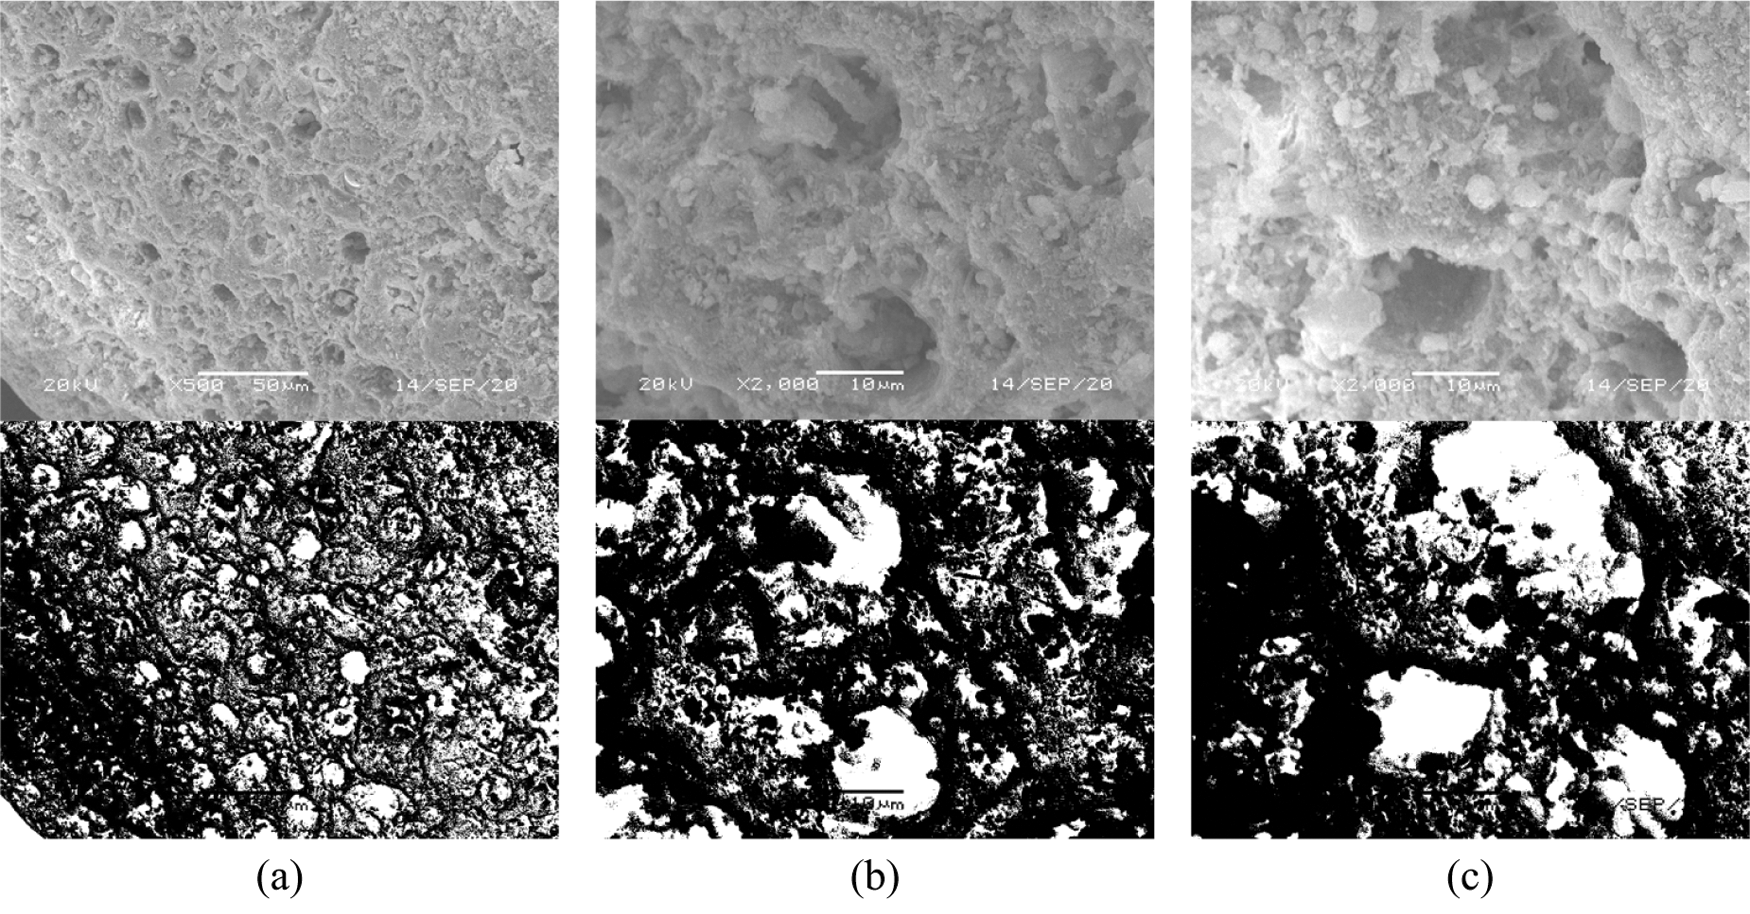
Figure 9: SEM image and black-and-white binarization image of calcareous sand. (a) Zoom in 500 times (b) Zoom in 2000 times (c) Zoom in 2000 times
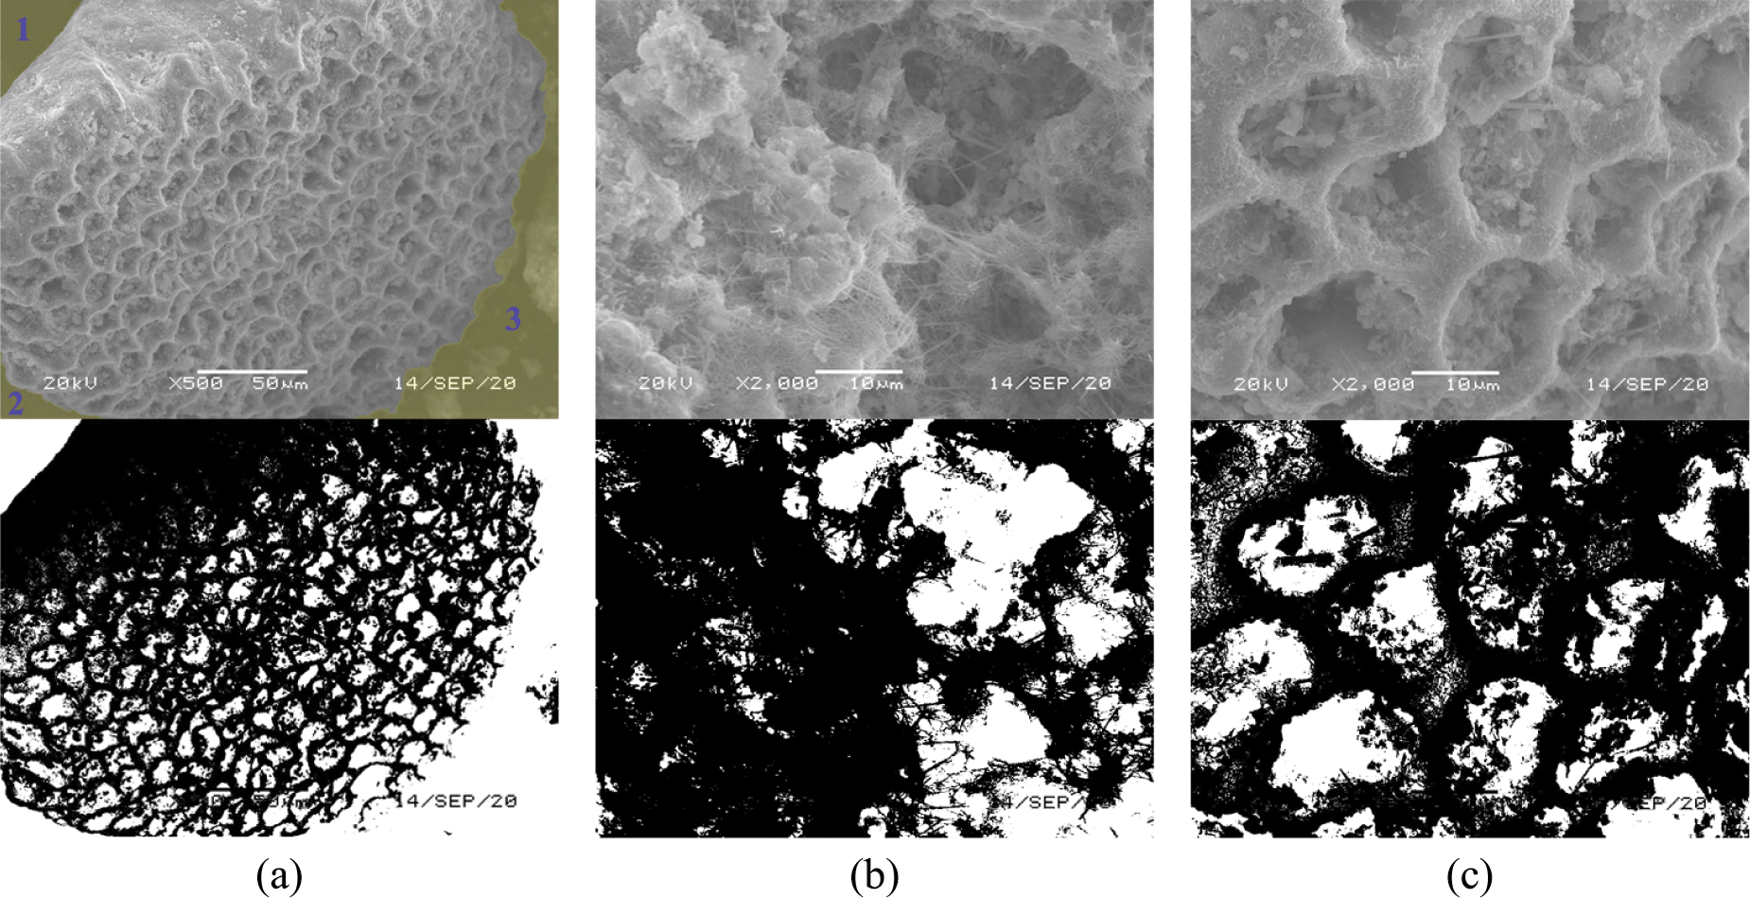
Figure 10: SEM image and black-and-white binarization image of cement calcareous sand. (a) Zoom in 500 times (b) Zoom in 2000 times (c) Zoom in 2000 times
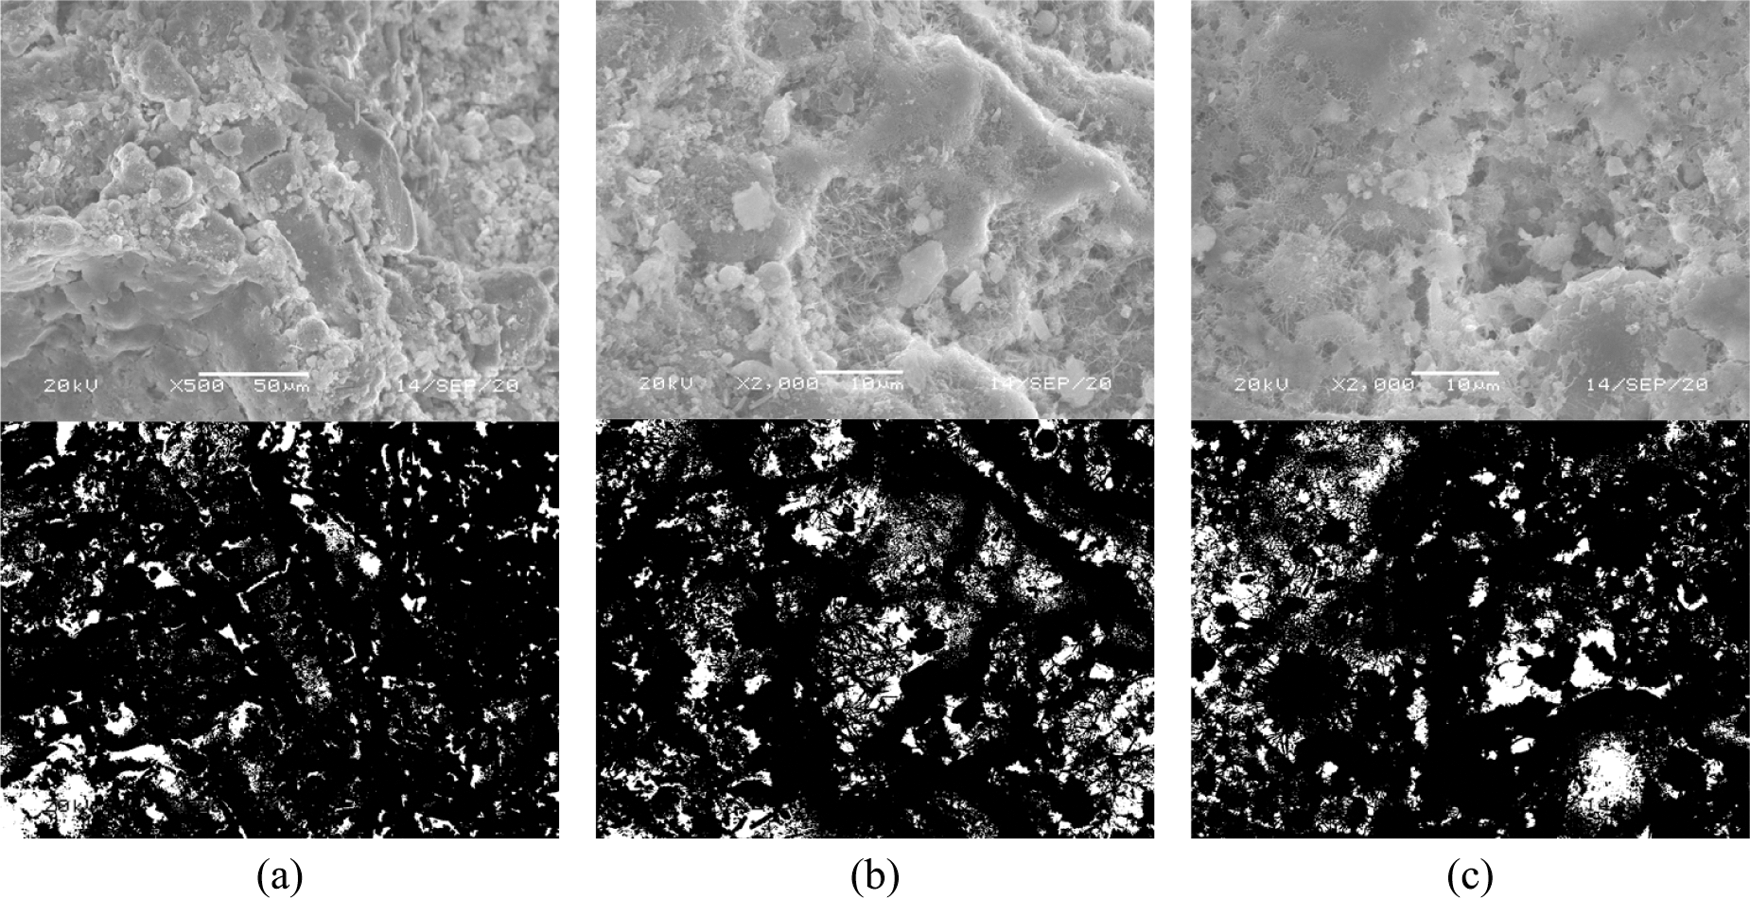
Figure 11: SEM image and black-and-white binarization image of FCS sample with fly ash content of 10%. (a) Zoom in 500 times (b) Zoom in 2000 times (c) Zoom in 2000 times
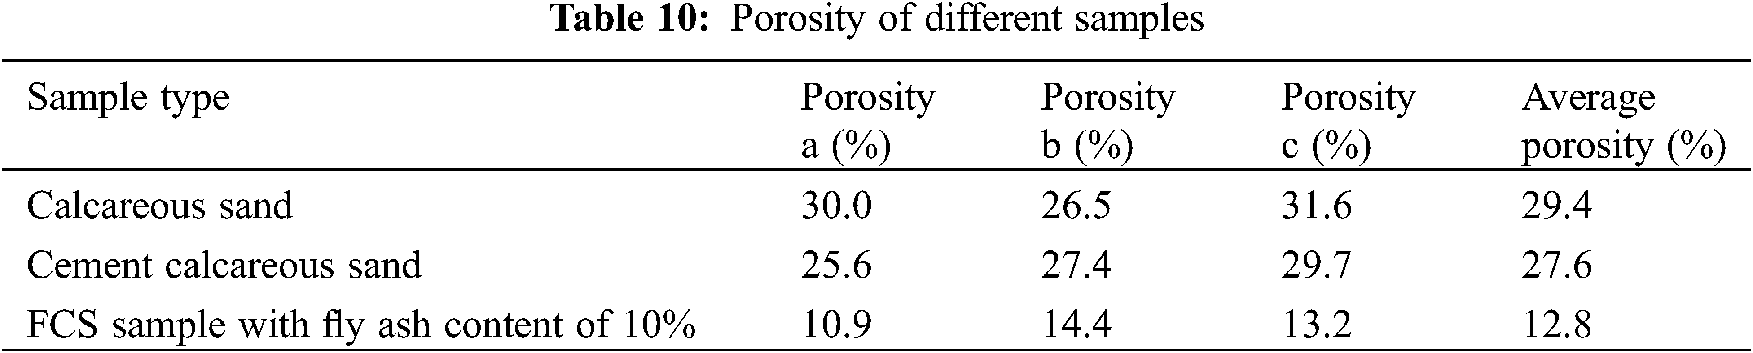
According to the porosity of each sample in Table 10, the addition of cement can reduce the porosity of calcareous sand from 29.4% to 27.6%. From the SEM images and EDS scanning results, cement reduces the porosity of calcareous sand by generating hydration products. The addition of fly ash can reduce the porosity of cement calcareous sand from 27.6% to 12.8% through microaggregate effect, which is consistent with the results of observation and analysis of SEM images. The addition of fly ash improves the compactness of cement calcareous sand, which also explains the result that fly ash enhances the internal friction angle and cohesion of cement calcareous sand in triaxial test.
In this study, through conventional triaxial unconsolidated undrained tests and SEM analysis, the strengthening effect of fly ash on cement calcareous sand was studied. By comparing the deviatoric stress-strain curve, peak stress, shear strength parameter, energy dissipation, and brittleness index of FCS samples with different fly ash contents, the reinforcement effect of fly ash on cement calcareous sand was evaluated quantitatively. Finally, the microscopic mechanism of fly ash-reinforced cement calcareous sand was analyzed by SEM. The following conclusions were drawn:
1. The deviatoric stress-axial strain curves of FCS samples are all softening curves.
2. Under any confining pressure, the peak strength, shear strength parameters and energy dissipation of FCS samples increase at first and then decrease with the increase of fly ash content, and reach the maximum when the fly ash content is 10%.
3. Based on energy dissipation, a brittleness evaluation index is proposed. Through the quantitative characterization of the brittleness index, the lowest brittleness of FCS samples is observed when the fly ash content is 5%. The brittleness of FCS samples with different fly ash contents decreases with the increase in confining pressure.
4. SEM results show that there are many pores on the surface of calcareous sand, and both cement hydration products and fly ash can fill the pores and cracks and improve the strength of the FCS samples.
Author Contributions: Investigation, B. L.; writing - Original draft preparation, N. L.; formal analysis, C. F.; conceptualization, J. H.; data curation, R. Y.; visualization, L. S.; writing–Review and editing, K. Y.; resources, F. Z.
Funding Statement: This research was funded by the National Natural Science Foundation of China (41772311, 51968019).
Conflicts of Interest: The authors declare that they have no conflicts of interest to report regarding the present study.
1. Yu, H., Sun, Z., Tang, C. (2006). Physical and mechanical properties of coral sand in the Nansha Islands. Marine Science Bulletin, 8(2), 31–39. [Google Scholar]
2. Chen, Q. S., Peng, W., Peng, W., Tao, G. L., Nimbalkar, S. (2021). Strength and deformation characteristics of calcareous sands improved by PFA. KSCE Journal of Civil Engineering, 25(1), 60–69. DOI 10.1007/s12205-020-0458-7. [Google Scholar] [CrossRef]
3. Wang, X. Z., Jiao, Y. Y., Wang, R., Hu, M. J., Meng, Q. S. et al. (2011). Engineering characteristics of the calcareous sand in Nansha Islands, South China Sea. Engineering Geology, 120(1–4), 40–47. DOI 10.1016/j.enggeo.2011.03.011. [Google Scholar] [CrossRef]
4. Ata, A., Salem, T. N., Hassan, R. (2018). Geotechnical characterization of the calcareous sand in northern coast of Egypt. Ain Shams Engineering Journal, 9(4), 3381–3390. DOI 10.1016/j.asej.2018.03.008. [Google Scholar] [CrossRef]
5. Fan, Z. H., Hu, C., Zhu, Q. L., Jia, Y. G., Zuo, D. J. et al. (2021). Three-dimensional pore characteristics and permeability properties of calcareous sand with different particle sizes. Bulletin of Engineering Geology and the Environment, 80(3), 2659–2670. DOI 10.1007/s10064-020-02078-1. [Google Scholar] [CrossRef]
6. Meng, Q. S., Yu, K. F., Wang, R., Qin, Y., Wei, H. Z. et al. (2014). Characteristics of Rocky basin structure of Yongshu reef in the Southern South China sea. Marine Georesources & Geotechnology, 32(4), 307–315. DOI 10.1080/1064119X.2013.764553. [Google Scholar] [CrossRef]
7. Wang, X. Z., Wang, R., Meng, Q. S., Liu, X. P. (2009). Study of plate load test of calcareous sand. Rock and Soil Mechanics, 30(1), 147–151. [Google Scholar]
8. Liu, Y., Lee, F. H., Quek, S. T., Chen, E. J., Yi, J. T. (2015). Effect of spatial variation of strength and modulus on the lateral compression response of cement-admixed clay slab. Géotechnique, 65(10), 851–865. DOI 10.1680/jgeot.14.P.254. [Google Scholar] [CrossRef]
9. Li, N., Zhu, Y. L., Zhang, F., Lim, S. M., Wu, W. Y. et al. (2021). Unconfined compressive properties of fiber-stabilized coastal cement clay subjected to freeze-thaw cycles. Journal of Marine Science, 9(2), 143. [Google Scholar]
10. Liu, Y., He, L. Q., Jiang, Y. J., Sun, M. M., Chen, E. J. et al. (2019). Effect of in situ water content variation on the spatial variation of strength of deep cement-mixed clay. Géotechnique, 69(5), 391–405. DOI 10.1680/jgeot.17.P.149. [Google Scholar] [CrossRef]
11. Wang, W., Li, Y., Yao, K., Li, N., Zhou, A. Z. et al. (2019). Strength properties of nano-MgO and cement stabilized coastal silty clay subjected to sulfuric acid attack. Marine Georesources & Geotechnology, 38(10), 1177–1186. DOI 10.1080/1064119X.2019.1656313. [Google Scholar] [CrossRef]
12. Wang, L., Lu, X. B., Wang, S. Y., Zhao, J., Wang, A. L. (2009). Experimental investigation on cementation of calcareous sand and its basic mechanical characteristics. Journal of Experimental Mechanics, 24(2), 133–143. [Google Scholar]
13. Yang, S., Liu, W. B. (2019). Research on unconstrained compressive strength and microstructure of calcareous sand with curing agent. Journal of Marine Science and Engineering, 7(9), 294. DOI 10.3390/jmse7090294. [Google Scholar] [CrossRef]
14. Gu, J. X., Zeng, C., Lyu, H. B., Yang, J. Y. (2020). Effects of cement content and curing period on strength enhancement of cemented calcareous sand. Marine Georesources & Geotechnology, 39(9), 1–13. DOI 10.1080/1064119X.2020.1804018. [Google Scholar] [CrossRef]
15. Xu, D. S., Huang, M., Huang, F. G., Chen, C. (2020). Study on the failure behavior of cemented coral sand with different gradation. Rock and Soil Mechanics, 41(5), 1531–1539. [Google Scholar]
16. Wang, W., Li, J., Hu, J. (2020). Unconfined mechanical properties of nanoclay cement compound modified calcareous sand of the South China sea. Advances in Civil Engineering, 2020, 6623710. [Google Scholar]
17. Furlan, A. P., Razakamanantsoa, A., Ranaivomanana, H., Levacher, D., Katsumi, T. (2018). Shear strength performance of marine sediments stabilized using cement, lime and fly ash. Construction and Building Materials, 184(4), 454–463. DOI 10.1016/j.conbuildmat.2018.06.231. [Google Scholar] [CrossRef]
18. Ahmad, M. R., Chen, B., Yu, J. (2019). A comprehensive study of basalt fiber reinforced magnesium phosphate cement incorporating ultrafine fly ash. Composites part B: Engineering, 168, 204–217. DOI 10.1016/j.compositesb.2018.12.065. [Google Scholar] [CrossRef]
19. Liang, S. H., Chen, J. T., Guo, M. X., Feng, D. L., Liu, L. et al. (2020). Utilization of pretreated municipal solid waste incineration fly ash for cement-stabilized soil. Waste Management, 105(5), 425–432. DOI 10.1016/j.wasman.2020.02.017. [Google Scholar] [CrossRef]
20. Furlan, A. P., Razakamanantsoa, A., Ranaivomanana, H., Amiri, O., Levacher, D. et al. (2021). Effect of fly ash on microstructural and resistance characteristics of dredged sediment stabilized with lime and cement. Construction and Building Materials, 272(7), 121637. DOI 10.1016/j.conbuildmat.2020.121637. [Google Scholar] [CrossRef]
21. Rivera, J., Coelho, J., Silva, R., Miranda, T., Castro, F. et al. (2021). Compressed earth blocks stabilized with glass waste and fly ash activated with a recycled alkaline cleaning solution. Journal of Cleaner Production, 284, 124783. DOI 10.1016/j.jclepro.2020.124783. [Google Scholar] [CrossRef]
22. Pang, W. T. (2013). Blenging fly ash compound cement soil mechanical properties and durability research (Ph.D. Thesis). Hohhot: Inner Mongolia Agricultural University. [Google Scholar]
23. Wang, W., Li, J., Hu, J. (2020). Unconfined mechanical properties of nanoclay cement compound modified calcareous sand of the South China Sea. Advances in Civil Engineering, 2020, 6623710. [Google Scholar]
24. Wang, D. X., Wang, H. W., Wang, X. Q. (2017). Compressibility and strength behavior of marine soils solidified with MgO-A green and low carbon binder. Marine Georesources & Geotechnology, 35(6), 878–886. DOI 10.1080/1064119X.2016.1258095. [Google Scholar] [CrossRef]
25. Yang, J., Li, X. L., Wang, H., Geng, K. Q. (2021). A study of the structural evolution and strength damage mechanisms of pishasandstone cement soil modified with fly ash. Journal of Renewable Materials, 9(12), 2241–2260. DOI 10.32604/jrm.2021.015565. [Google Scholar] [CrossRef]
26. Mohanty, S., Roy, N., Singh, S. P., Sihag, P. (2019). Estimating the strength of stabilized dispersive soil with cement clinker and fly ash. Geotechnical and Geological Engineering, 37(4), 2915–2926. DOI 10.1007/s10706-019-00808-1. [Google Scholar] [CrossRef]
27. Liang, S. H., Chen, J. T., Guo, M., Feng, D., Liu, L. et al. (2020). Utilization of pretreated municipal solid waste incineration fly ash for cement-stabilized soil. Waste Management, 105, 425–432. DOI 10.1016/j.wasman.2020.02.017. [Google Scholar] [CrossRef]
28. Li, Q. H., Chen, M., Jin, Y., Wang, F. P., Hou, B. et al. (2012). Indoor evaluation method for shale brittleness and improvement. Chinese Journal of Rock Mechanics and Engineering, 31(8), 1680–1685. [Google Scholar]
29. Yagiz, S. (2009). Assessment of brittleness using rock strength and density with punch penetration test. Tunnelling and Underground Space Technology, 24(1), 66–74. DOI 10.1016/j.tust.2008.04.002. [Google Scholar] [CrossRef]
30. Kahraman, S., Altindag, R. (2004). A brittleness index to estimate fracture toughness. International Journal of Rock Mechanics and Mining Science, 41(2), 343–348. DOI 10.1016/j.ijrmms.2003.07.010. [Google Scholar] [CrossRef]
31. Zhou, H., Meng, F. Z., Zhang, C. Q., Xu, R. C., Lu, J. J. (2014). Quantitative evaluation of rock brittleness based on stress-strain curve. Chinese Journal of Rock Mechanics and Engineering, 33(6), 1114–1122. [Google Scholar]
32. Liu, X. M., Xiong, L., Liu, J. H., Zhao, M. H. (2011). Slacking mechanism of red sandstone based on energy dissipation principle. Journal of Central South University (Science and Technology), 42(10), 3143–3149. [Google Scholar]
33. Chen, G. Q., Zhao, C., Wei, T., Wang, J. T. (2018). Evaluation method of brittle characteristics of rock based on full stress-strain curve and crack initiation stress. Chinese Journal of Rock Mechanics and Engineering, 37(1), 51–59. [Google Scholar]
34. Ministry of Water Resources of People’s Republic of China, Standard for Geotechnical Testing Method. GB/T50123-2019. [Google Scholar]
35. Ministry of Industry and Information Technology of the People’s Republic of China, Common Portland Cement. GB 175-2020. [Google Scholar]
36. China Building Materials Federation, Fly Ash Used for Cement and Concrete. GB/T 1596-2017. [Google Scholar]
37. Li, N., Zhu, Q. Y., Wang, W., Song, F., An, D. L. et al. (2019). Compression characteristics and microscopic mechanism of coastal soil modified with cement and fly ash. Materials, 12(19), 3182. DOI 10.3390/ma12193182. [Google Scholar] [CrossRef]
38. Shao, L., Liu, S. Y., Du, G. Y., Gu, M. F. (2008). Experimental study on improvement of organic soil with cement and fly-ash. Journal Engineering Geology, 65(3), 121–127. [Google Scholar]
39. Song, X. J. (2010). Study on determination of permeability coefficient of cement soil based on conventional triaxial apparatus. Jianghuai Water Resources Science Technology, 30(6), 19–21, 25. [Google Scholar]
40. Miu, L. C. (2012). Mechanical properties of soft soil and engineering practice. China: Science Press. [Google Scholar]
41. Redi, M., Klodian, S., Oltion, F., Marco, M., Lolanda, G. et al. (2021). Effect of cement and fly-ash on the geotechnical properties of expansive clay soils. Italian Journal of Geosciences, 140(1), 108–120. DOI 10.3301/IJG.2020.21. [Google Scholar] [CrossRef]
42. Zhang, W. F., Huang, R. Q., Pei, X. J., Deng, H. (2007). Research on hydrating process and solidification of fly ash in soil-cement and approach to activation. Journal of Changchun Institute Technology (Nature Science Edition), 26(1), 42–45. [Google Scholar]
43. Wang, W., Chi, X. C., Zhang, F., Sun, B. X. (2013). Effect of freeze-thaw circles on softening behaviors of triaxial stress-strain curve of costal soft soils. Chinese Journal of Geotechnical Engineering, 35(S2), 140–144. [Google Scholar]
44. Hamidi, A., Hooresfand, M. (2013). Effect of fiber reinforcement on triaxial shear behavior of cement treated sand. Geotextiles and Geomembranes, 36(36), 1–9. DOI 10.1016/j.geotexmem.2012.10.005. [Google Scholar] [CrossRef]
45. Zhang, J. M. (2004). Study on the fundamental mechanical characteristics of calcareous sand and the influence of particle breakage (Ph.D. Thesis). Wuhan: Thesis, Chinese Academy of Science. [Google Scholar]
 | This work is licensed under a Creative Commons Attribution 4.0 International License, which permits unrestricted use, distribution, and reproduction in any medium, provided the original work is properly cited. |