| Journal of Renewable Materials |
DOI: 10.32604/jrm.2022.018587
ARTICLE
The Interaction Effects of the Parameters on Optimization Design in Paper Production Waste Usage on Alkali-Activated Slag with Taguchi Method
1National Cheng Kung University, Tainan, 70100, Taiwan
2Lotos, Tainan, 70255, Taiwan
*Corresponding Author: Teng Yi. Email: n78083503@gs.ncku.edu.tw
Received: 04 August 2021; Accepted: 01 October 2021
Abstract: The paper investigates the second-order interactions of parameters in an alkali-activated mixture of paper production waste (PPW) and blast furnace slag (BFS) in Taguchi method. The PPW including lime mud (LM) and paper sludge (PS). This paper provides the experimental models to assess the compressive and flexural strength of them at 7-day and 28-day. The results have shown that the second-order interactions between PPW and alkali-activated activator exists in each experimental model, and the significant interactions affect the selection of optimal compositions. Compared with the interactions between the PPW themselves, the interactions between PPW and alkali-activated parameters are the main significant factors affecting its physical properties. In each experimental model, the maximum compressive strength was 47.41 MPa in 7-day and 65.64 MPa in 28-day. Compared with the confirmatory experiments, the deviation of prediction calculated by experimental models was 3.08% and 0.56%, respectively. The maximum flexural strength was 5.74 MPa in 7-day and 5.96 MPa in 28-day; compared with the confirmatory experiments, the deviation of prediction calculated by experimental models was 5.40% and 0.17%. Considering the influence of circular materials, 30% of PPW should be a suitable ratio to replace BFS as the raw material of alkali-activated slag (AAS).
Keywords: Paper production waste; alkali-activated slag; taguchi method; interactions of parameters; experimental model
As the globalization accelerates, sources exhaustion, environmental pollution, and climate warming have become challenges to all countries and industries, which has to be faced and tackled together. As far as the paper industry is concerned, the volume of worldwide paper production in 2018 was nearly 420 million tons [1], while 0.3–0.5 tons of waste was generated from producing 1 ton of paper [2]. The paper production waste (PPW) includes solid waste represented by lime mud (LM) and paper sludge (PS) [3,4]. LM is generated in the recovery circuit of chemicals, and PS is generated in the paper-making wastewater treatment process [5–8]. Normally, PPW is always buried or incinerated [4,9] and this causes water, soil and air pollution [10–12]. Therefore, finding a recycling method has become an urgent problem in the paper industry [13,14]. Considering that PPW’s potential could be used as building materials [15], replacing traditional building materials with PPW could be a reasonable way for the reuse of waste [16,17]. Meanwhile, by translating PPW into building materials, the energy consumption of cement industry and carbon emission can be effectively reduced [18,19].
In current studies, utilizing PPW as a substitute for Portland cement is one of the ways to translate translating wastes into building materials. Yan et al. [20] used PPW as a cement additive which reaches 2.5% content to cement mortar. Martínez-Lage et al. [21] and Malaiskiene et al. [22] used PPW to substitute the cement in the mortar partially and they suggested that the ratio of waste should not exceed 15%−20%. Ferreiro et al. [23] and Torres et al. [19] used 10% and 15% PS respectively to replace of Portland cement clinker. Buruberri et al. [6] calcinated LM to replace 16% of the raw material for Portland cement. Singh et al. [18] calcinated a mixture of LM, clay and blast furnace slag to replace part of raw material for low clinker cement. The maximum level of LM addition without affecting the properties was 20% in the cementitious binder. Considering manufacturing at ambient conditions, its potential ability makes PPW an appropriate source material for the alkali-activated cementitious binder. Antunes Boca Santa et al. [24] reported that a geopolymer made by bottom coal ash and calcined paper sludge with the ratio of 2:1 had a denser matrix with fewer cracks and imperfections. Novais et al. [25] evaluated that 25% of green dregs waste used in geopolymer would improve 71% tensile and 34% compressive strength than the reference mortar. Mamat et al. [26] replaced 5% of fly ash with paper sludge ash and found that the mechanical strength of mortar was enhanced. Saeli et al. [27] used 10% of LM, leading to 30% development of mechanical resistance in the geopolymeric mortars. Adesanya et al. [28] synthetized an alkali-activated mortar with 18% of PS substituted for BFS, and the maximum compressive strength was 42 MPa.
Although recently there are some studies on utilizing PPW as a raw material of cement or alkali-activated cementitious binder, there are still many problems to be resolved. One of the problems is the applicability of the research. Considering the diversity of waste sources on qualities and compositions, the universality of the single study result is undermined. Meanwhile, most studies focus on a single kind of PPW, but there are few reports on the systematic integration of different PPW and translating them into building materials, which means that the previous studies cannot systematically assess the possibility of translating wastes into building material in the paper industry. Therefore, it is necessary to find a way for the rapid screening of specific batches of PPW.
Taguchi method is a fractional factorial design method that can investigate a large number of parameters with a small number of experiments [29,30]. Compared with “Full-Factorial Experiments”, the advantage of the Taguchi method is the efficiency. Compared with “One-Factor-at-a-Time”, the advantage of the Taguchi method is the robustness of the output. Thus, Taguchi method has the effectiveness of cost and accuracy on the waste investigation. Recent researches have revealed the importance of Taguchi methods used in the optimization of concrete and mortar design [31,32]. Nowadays, although Taguchi method has been used on the feasibility of utilizing BFS [33,34], fly ash [35–37], and recycled aggregate [38] in building materials, the interactions of parameters are rarely evaluated in existing studies. According to the Taguchi method, the weak correlation of parameters is a prerequisite for using Taguchi method, and the significant interactions of design parameters undoubtedly affect the selection of optimal composition [39,40].
This study uses Taguchi methods and analysis of variance (ANOVA) to analyze the effect of the significant interaction of parameters in an alkali-activated mixture of PPW and BFS. The experimental models are established by significant factors to investigate different mechanical properties (compressive and flexural strengths of 7-day and 28-day). The optimal composition of each experimental model is given and verification experiments have been conducted. It is hoped that researchers using the Taguchi method to conduct similar research may ensure the accuracy of the optimization design through the proposed analysis of the interaction effects.
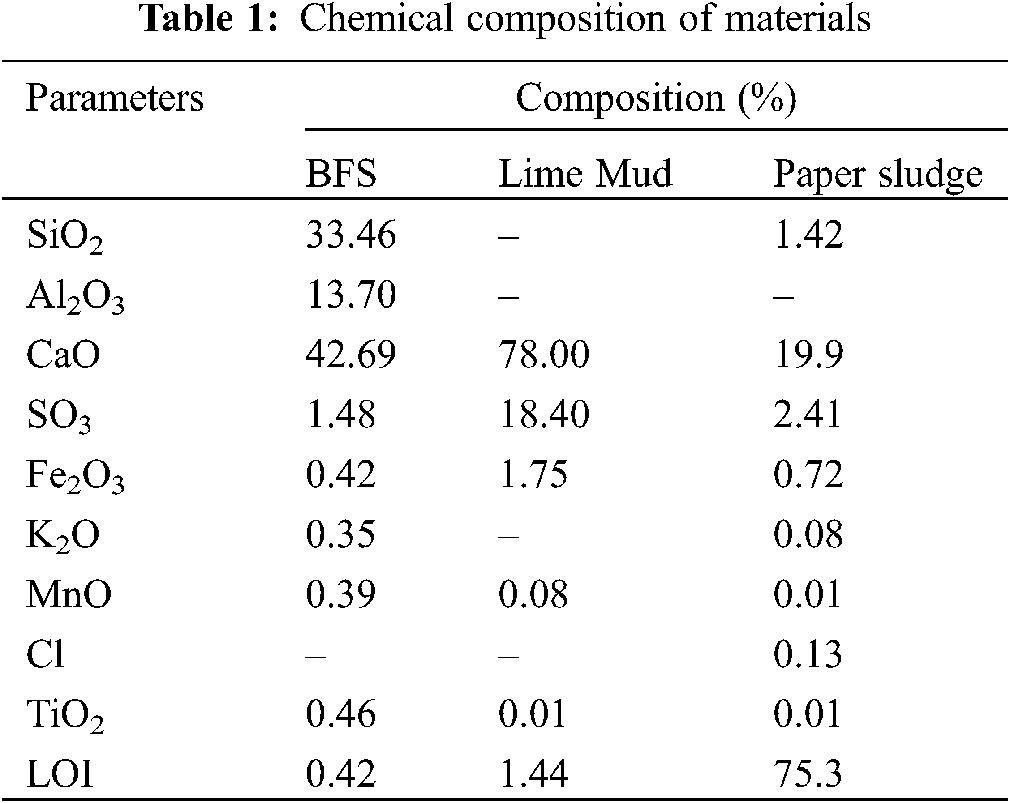
The materials used in this study were blast furnace slag (BFS), lime mud (LM) and primary sludge (PS). According to Taiwan Standard CNS12549 [41], the level of BFS powder was 80, and its specific gravity was 2.81 g/cm3. This were supplied by CHC Resources Corporation (Taiwan) [42]. The lime mud (LM) and primary sludge (PS) obtained from Chung Hwa Pulp Corporation (Taiwan) [43] were dried in an oven at 110°C for 24 h and sieved with a mesh size of 0.27 mm. The specific gravity of LM was 1.97 g/cm3, and the hydrogen ion concentration (pH value) was 11.36. The specific gravity of PS was 1.85 g/cm3, and the hydrogen ion concentration (pH value) was 9.03. The mineral compositions of three materials were analyzed by X-ray diffraction (XRD), as shown in Fig. 1. A broad hump was in the XRD spectrum of BFS over a range of 2θ angles, which meant it was composed of the amorphous phase. The LM exhibited a single diffraction peak of calcite, whereas the XRD patterns of PS were composed of calcite, aragonite, and silica. In terms of the composition of raw materials, PS has higher pozzolanic reactivity than LM, but the inertness of LM is more beneficial to the volume stability of the mortar. The chemical compositions of BFS, LM, and PS were shown in Table 1.
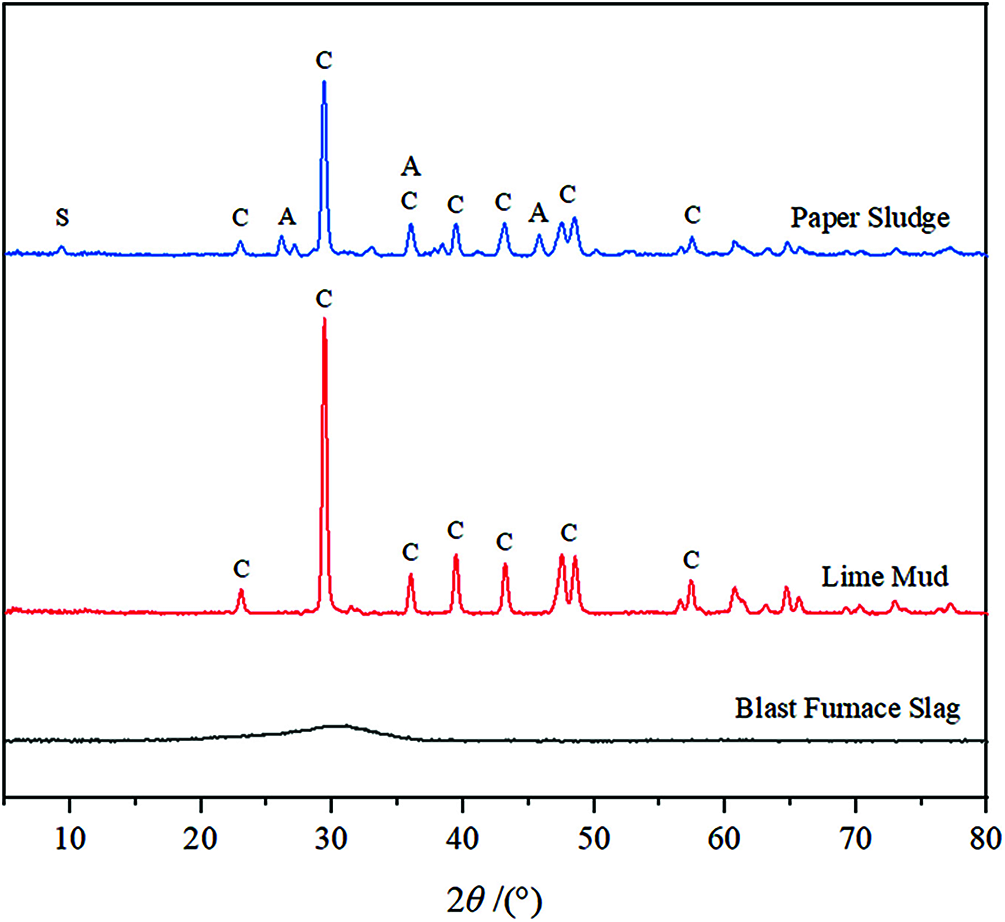
Figure 1: XRD analysis of materials C: Calcite; A: Aragonite; S: Silica
To simplify the manufacture and for convenient storage of raw materials, solid powder was used to prepare the activator solution. The sodium hydroxide pellet composition was 99.45% NaOH and 0.27% Na2CO3. The composition of sodium silicate powder was 46.07% SiO2, and 51.35% Na2O. Its silicate modulus (SiO2/Na2O) was 0.93. To vary the silicate modulus activator, the NaOH pellets content would be raised to change the Na2O ratio. The alkali equivalent of activator could be calculated by the weight ratio of Na2O to binder.
According to ASTM-C141 [44], quartz sands were dried in an oven at 105°C for 24 h and sieved with a mesh size of 2.36 mm, which were used as fine aggregates of mortar. The ratio of sands and binder equal to 2.75, and the water/binder (W/B) ratios are fixed at 0.55.
2.2 Experimental Design and Methods
2.2.1 The Principle and Experimental Model of Taguchi Method
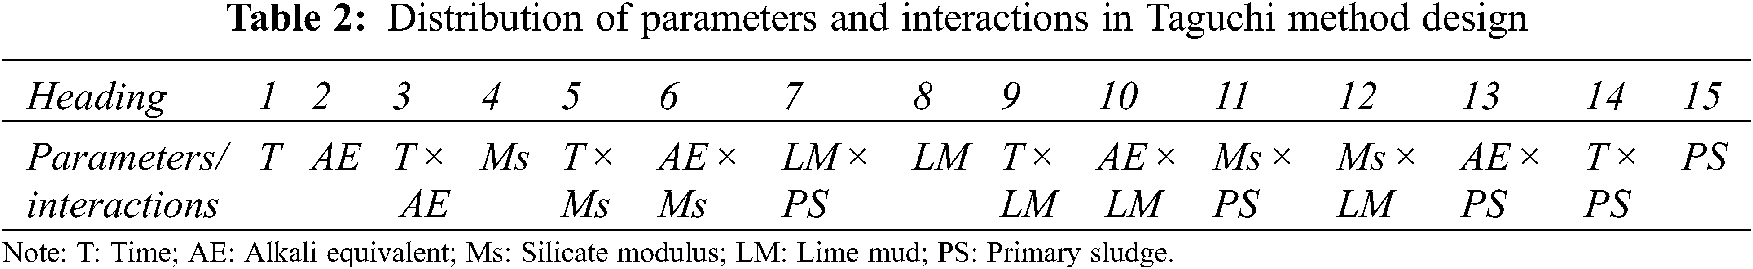
The study chose the L16(215) table, which was two-level orthogonal array [45], and designed the heading of the table based on linear graphs to assess the effects of parameters and interactions. The distribution of parameters and interactions were given in Table 2. In the heading of the table, the preparation time of mortar (T), alkali equivalent (AE), silicate modulus (Ms), lime mud (LM) and primary sludge (PS) were the five parameters of this experiment. The interactions of parameters were expressed as A × B, which means the two-way interactions between A and B. In this experiment, the two-way interactions of parameters could be regarded as the independent factors because of the orthogonal array design [45]. The parameters and their interactions composed the factors of this study.
Given the huge number of factors, the generalized linear model, which was built with experimental values directly, might not accurately evaluate the effects every factor. It is because the higher-order items possibly existed in the experimental model [46]. Therefore, linear regression models with logarithmic transformations (η = log(y)), which were the variables separable model (the addition mode) in the Taguchi method, were built to change the index of higher-order items into coefficient [45]. For any factor A, its effect was expressed as the change of mechanical properties while level A changed from −1 to +1 [39,45]. The calculation formula on the effect of A in this study was:
The parameter
The two-way interaction of parameters means that the effect of one of the parameters differs depending on the other level of parameter. Similar calculation applies to the effect of parameters; the level +1 of interactions can be defined as two parameters having the same level (the product of parameter level is +1), and the level −1 of interactions are the parameters that have the different level (the product of parameter level is −1). The calculation formula on the two-way interaction of A × B was [45]:
The parameter
The A, B, and A × B, C × D, etc., in Eq. (3) represent the significant factors (including parameters and interactions) filtered by data analysis; i, j, k, m, n = −1 or +1, which is the level selected by each factor of the mixture;
Whether parameter or factor, the interaction of D is not the significant factor, so D is not in the calculation formula. The y can be translated by η from
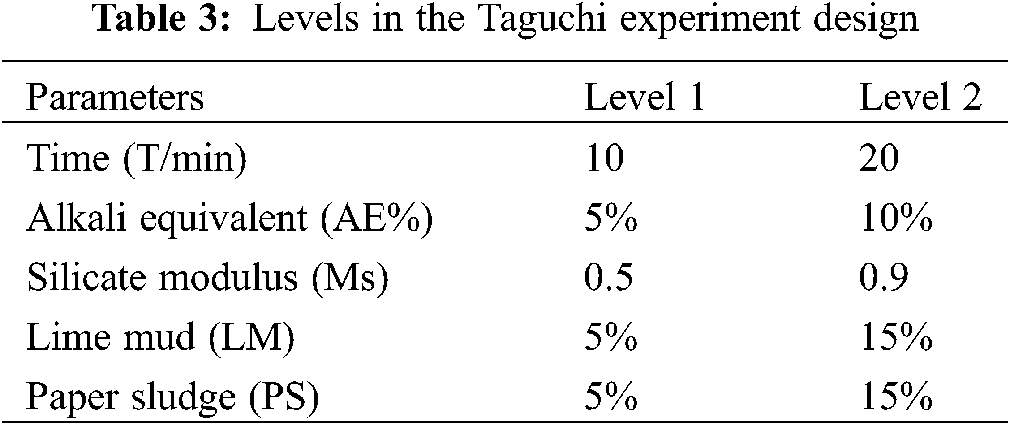
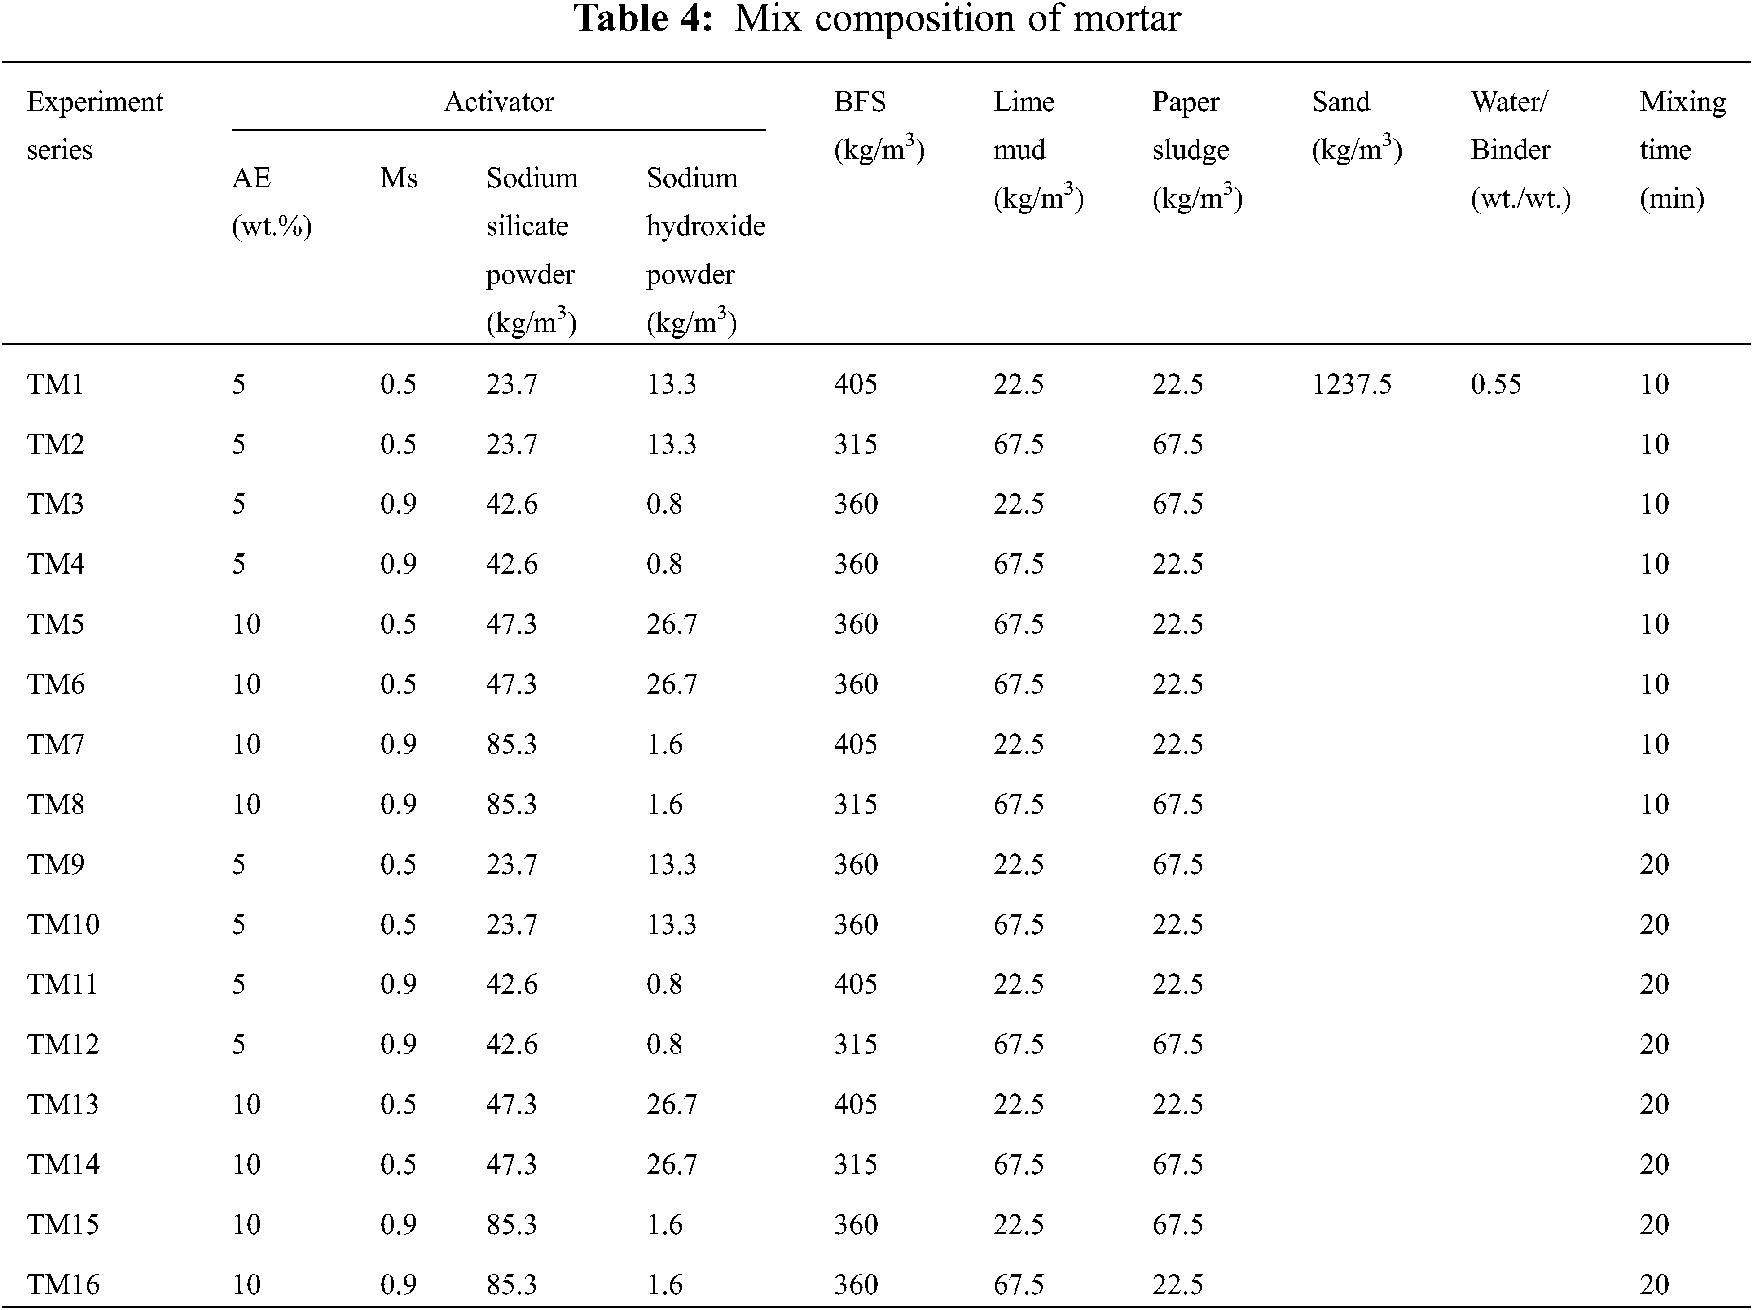
According to the results of previous experiments [48], when the AE is in a range of 2% to 8% (step was 1.5%), the maximum of compressive strength on AAS slurry was at the 5% AE. Therefore, the level of activator solution of parameters could be set as AE = 5% and 10%; Ms = 0.5 and 0.9, and those levels form four kinds of activator by pairwise composition. Simultaneously, the results of previous experiments showed that the AAS slurry substituted for PPW by 20% had the optimal mechanical property. Because of this, the study chose 5% and 15% as the level of LM and PS, the ratio of PPW in the slurry. Therefore, 5% and 15% are used as the parameter ratio of LM and PS, so that the PPW has three kinds of ratios-10%, 20% and 30% in the experiment. The frequency of 20% of the total waste ratio is 50%, and the frequency of 10% or 30% of the total waste ratio is 25%. The level of parameters and the composition of mortar are shown in Tables 3 and 4.
2.3 Mortar Preparation and Test
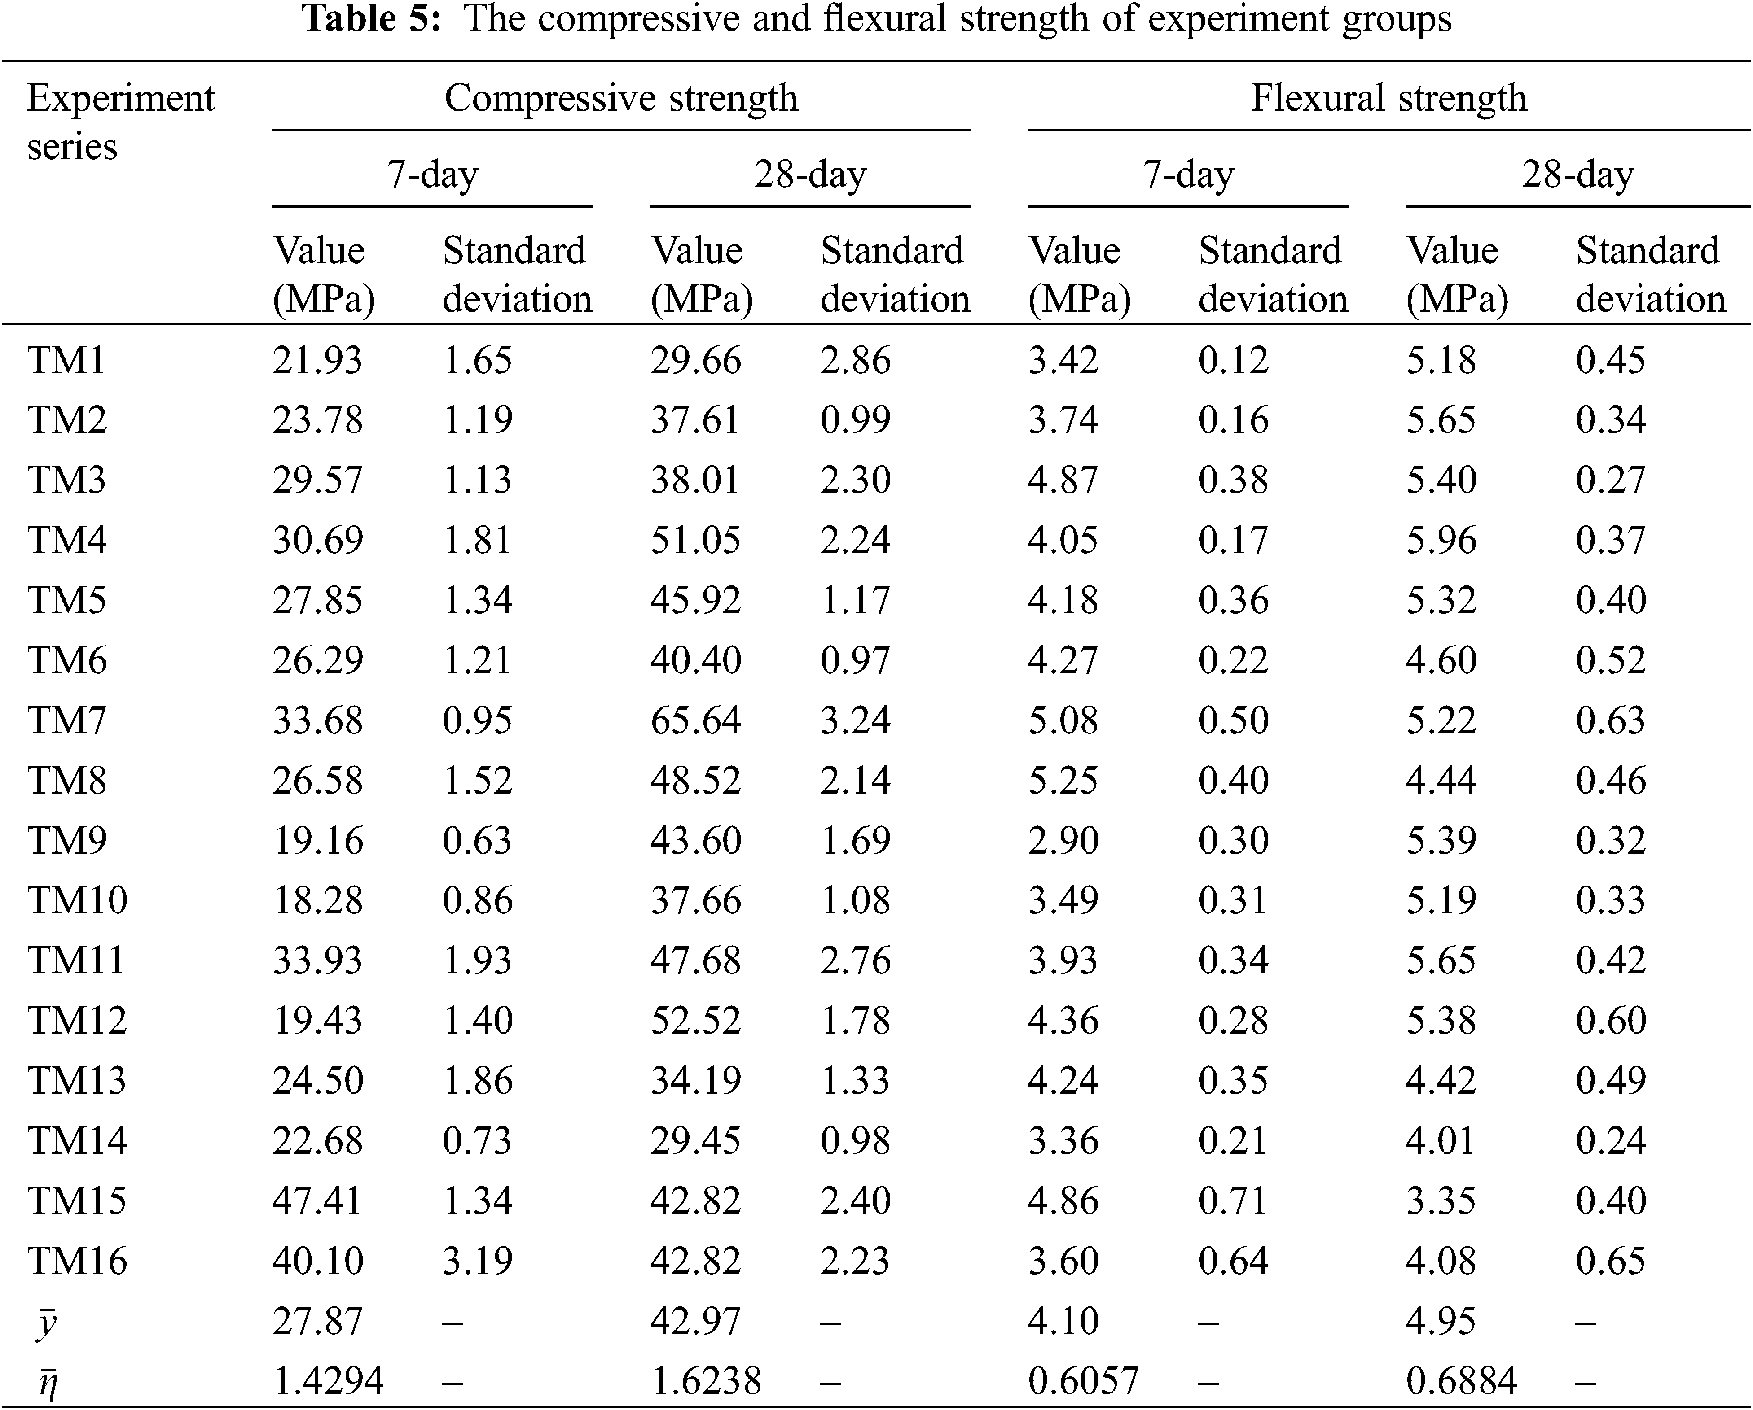
The repeated orthogonal experimental design was adopted in this experiment. Compressive and flexural strength of mortar were examined at 7- and 28-day. In advance, sodium hydroxide pellet and sodium silicate powder were dissolved in water as the activator and cooled down to room temperature. The solid materials were mixed for 2 mins and added in activator solution to prepare mortar according to ASTM C305 [49]. The specimens were cast in two layers of mortar into the molds (50 mm × 50 mm × 50 mm and 40 mm × 40 mm × 160 mm) and vibrated to eliminate the bubbles. Then the specimens were covered with plastic films to prevent moisture loss. In this investigation, specimens were demolded after 24 h of casting and stored in the control box at 23 ± 1°C and 95% relative humidity. According to ASTM C109 [50] and ASTM C348 [51], compressive and flexural strength were tested with the universal testing machine. Considering the size of samples required by experimental design, 6 specimens were prepared for each composition test of the compressive and flexural strength at 7-and 28-day, respectively. The average strength is listed in Table 5.
3.1 Taguchi Method Experimental Mode
In this experiment, a multivariate analysis of variance (ANOVA) was used to test the significance of each factor. For the experimental models with excess significant factors (>7), ‘one-half criterion’ [39,45] was followed, and the contributions of the first seven factors were selected to construct them. For the experimental models whose significant factors were less than 7, the experimental models were built only by the significant factors. The linear regression analysis was then used to verify the correctness of experimental models by SPSS.
3.1.1 The Experimental Mode of Compressive Strength
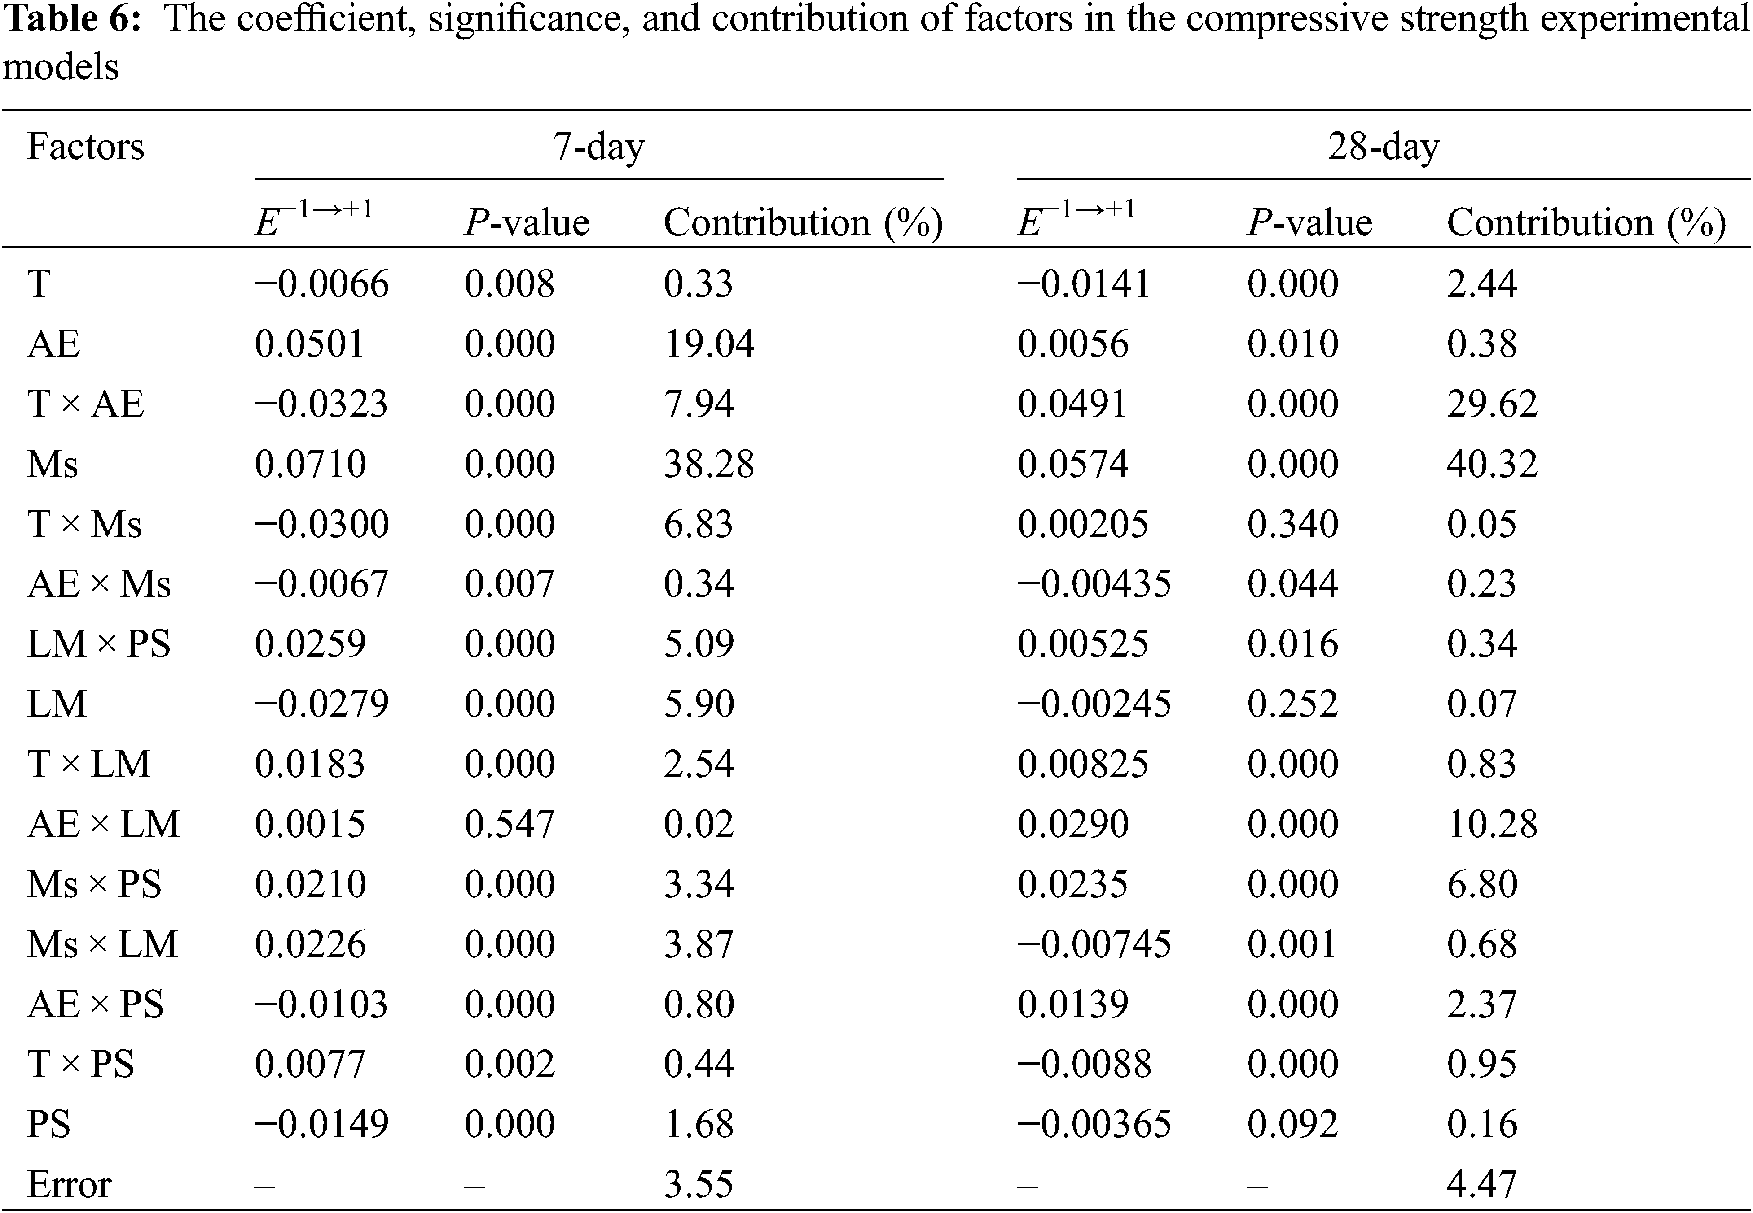
From Table 6, with the significance factors selected by P-value < 0.01 (Prob > F), excess significant factors exist in the experimental models of compressive strength at 7 and 28 day. There were 14 significant factors in the experimental models of 7-day and 10 significant factors in the experimental models of 28-day. The ‘one-half criterion’ was used to investigate the contribution of the significant factors in those experimental models, the sequence of the first seven factors in the compressive strength at 7-day was Ms > AE > T × AE > T × Ms > LM > LM × PS > Ms × LM; the sequence of the first seven factors in the compressive strength at 28-day was Ms > T × AE > AE × LM > Ms × PS > T > AE × PS > T × PS. The experimental models were:
3.1.2 The Experimental Mode of Flexural Strength
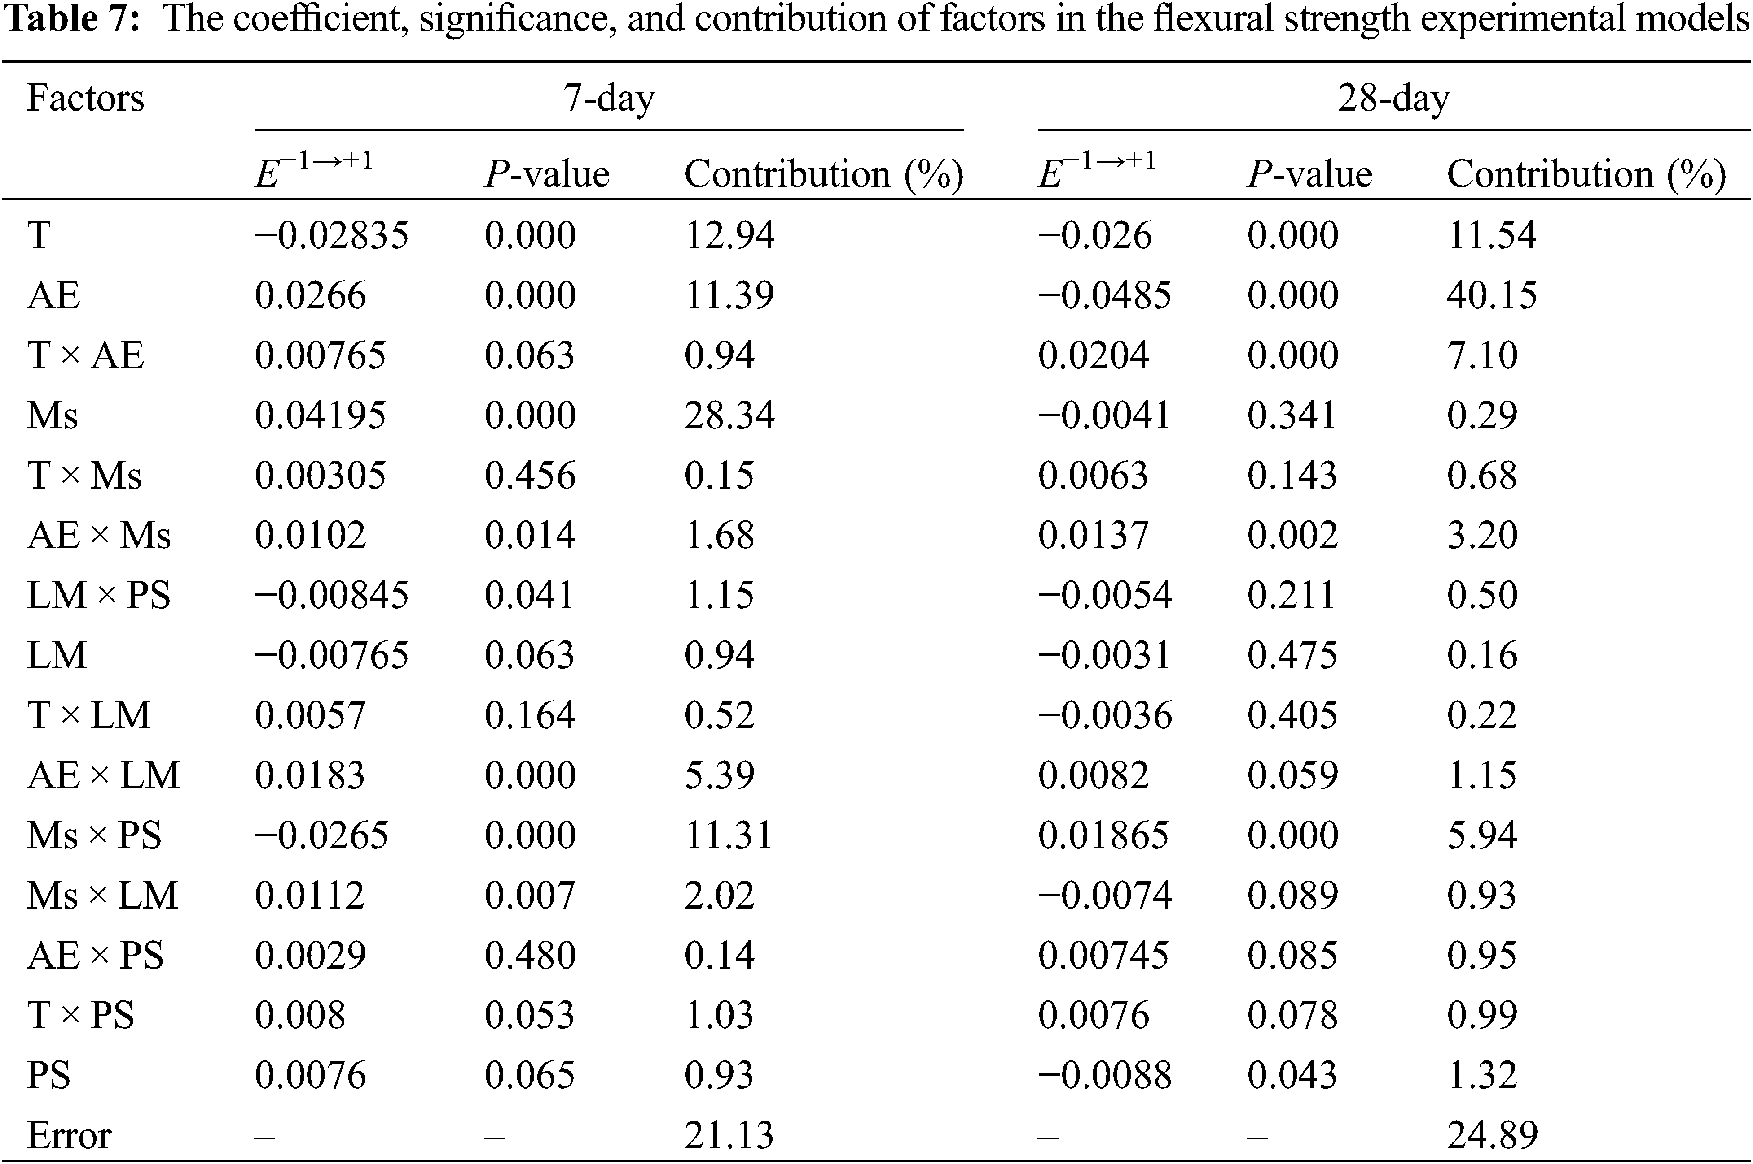
From Table 7, with the significance factors selected by P-value < 0.01 (Prob > F), there were 6 significant factors and 5 significant factors in the experimental models of 7 and 28 day flexural strength, respectively. Considering about the contribution of the significant factors in those experimental models, the sequence of the flexural strength at 7-day was Ms > T > AE > Ms × PS > AE × LM > Ms × LM; the sequence of the flexural strength at 28-day was AE > T > T × AE > Ms × PS > AE × Ms. The experimental models were:
3.1.3 Regression Analysis Verification of Experimental Models
The stepwise regression analysis was used to check the statistical accuracy of experimental models and evaluate the goodness of fit of experimental models. In the investigation, the confidence interval of ANOVA was 99%.
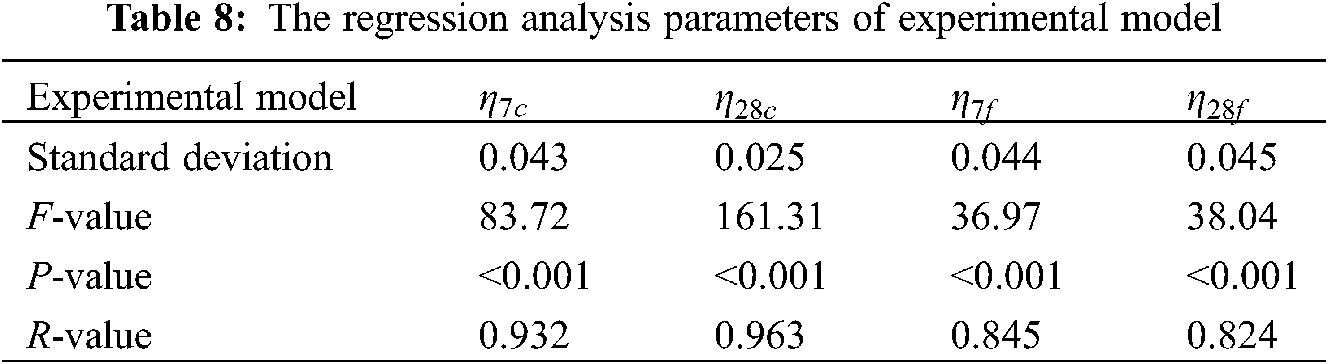
F-test was used to evaluate the statistical significance of experimental models. In Table 8, the F-value of each experimental model should be greater than the critical value of F-distribution. Since the 4 quality characteristics (the compressive and flexural strength at 7- and 28-day) all had 5 controllable parameters (T, AE, Ms, LM, PS) and 96 (16 terms × 6 specimens) independent samples, the critical value for an F-distribution was F0.01(5, 91) = 3.23. The F-value of η7c, η28c, η7f, η28f were 63.82, 152.65, 40.73, 38.04, and they were much larger than 3.23, which means the experimental models were statistically meaningful. P-value was used to evaluate the significance of each experimental model. The P-value of η7c, η28c, η7f, η28f were less than 0.01, which indicated that the results of the experimental models are reliable. In the investigation, Pearson product-moment correlation coefficient (R-value) was used to evaluate the goodness of fit of the experimental models. The R-value of η7c, η28c, η7f, η28f were 0.932, 0.963, 0.845 and 0.824. They were in the range of 0.8 to 1, which means each factor has a strong linear correlation with the results, and the experimental models all had good goodness of fit. Among them, the R-values of compressive strengths are greater than 0.9. Compared with the flexural strength, the experimental models of compressive strengths had better goodness of fit, which may be related to the number of significant factors.
3.2 Significant Factors in the Experimental Models of Compressive Strength
3.2.1 Significant Interactions of PPW in the Experimental Models of Compressive Strengths
The significant interactions were mainly related to lime mud (LM) in 7-day compressive strength, and its coefficient accounted for 18.6% of the total significant factors in the experimental model. The significant interactions are shown in Fig. 2.
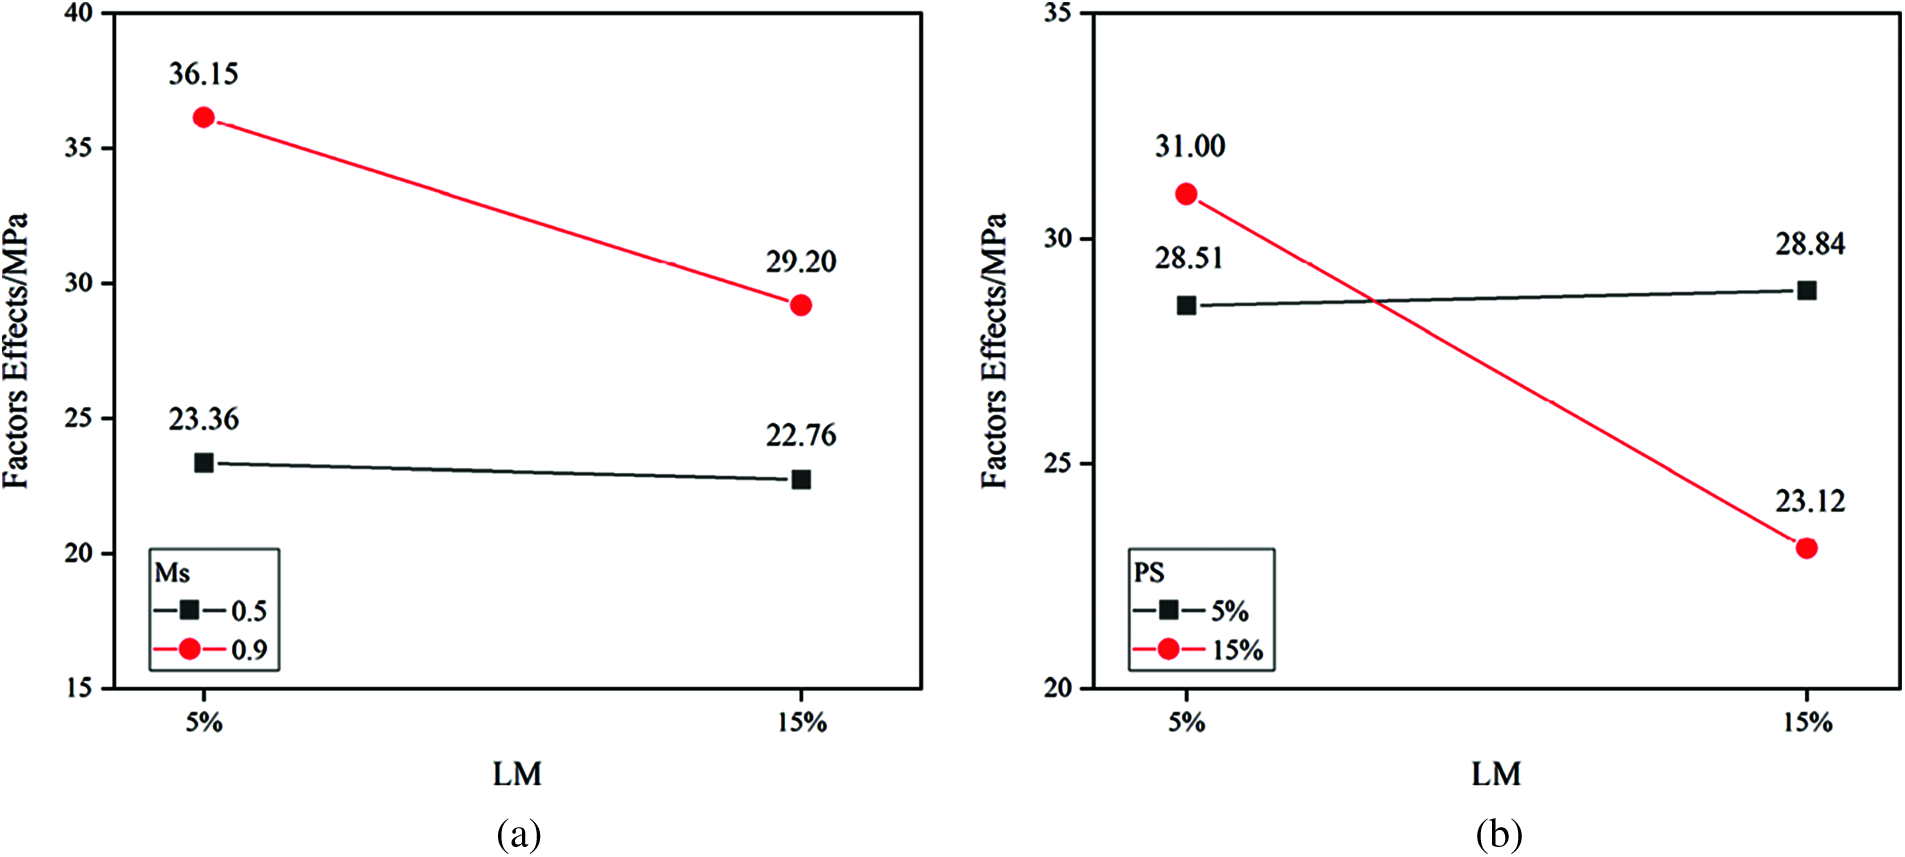
Figure 2: The significant interactions of PPW in 7-day compressive strength (a) Interactions of Ms × LM (b) Interactions of LM × PS
With the ratio of LM increased in binder, the compressive strength showed different trends on the Ms and Ps at different levels. The compressive strength exhibited a small fluctuation with the low Ms concentration (0.5). And an increase in the ratio of LM from 5% to 15% with the high Ms concentration (0.9) resulted in a 19.2% reduction in the 7-day compressive strength (Fig. 2a). The different trends of 7-day compressive strength were most likely due to the [SiO4]4− concentration. Lower Ms level caused the scarcity of [SiO4]4−, which could not support the complete hydration [52]. With sufficient [SiO4]4−, the inertness of LM (main calcite) curtailed the binder dissolution [53], which decreased the 7-day compressive strength of specimens. PS had similar effects on the 7-day compressive strength. At the high PS proportion (15%), the compressive strength decreased 25.4% with the increase in LM from 5% to 15%. It indicates that the addition of 30% PPW may cause insufficient pozzolanic reactivity of sample, which results in a rapid decrease in compressive strength. In Fig. 2b, when the PPW ratio is 20%, its average strength is 29.92 MPa, which is higher than the compressive strength of the other two PPW ratios.
In experimental models of 28-day compressive strength, the significant interactions related to waste were AE × LM, AE × PS, AE × PS, AE × PS, and the coefficient accounted for 38.4% of the total significant factors in the experimental model. The significant interactions existed in AE and PPW, PS and alkali-activated parameters. The interactions of those factors are shown in Fig. 3.

Figure 3: The significant interactions of PPW in 28-day compressive strength (a) Interactions of AE × LM (b) Interactions of AE × PS (c) Interactions of Ms × PS (d) Interactions of T × PS
From Figs. 3a and 3b, the 28-day compressive strengths had the same trend in AE × LM and AE × PS. It could be observed that the compressive strength increased when the ratio of waste increased with low AE concentration (5%); the compressive strength decreased when the ratio of waste increased with high AE concentration (10%). This was attributed to the OH− precipitated by PPW increases the pH of the activator at lower OH− concentration, which accelerates the hydration of the BFS. With the high level of OH− concentration, the increase in PPW ratio means that the amount of BFS involved in the reaction is reduced, and the scarcity of pozzolanic reactivity in PPW, which causes excess OH− to evaporate with water, forming carbonate on the surface of specimens and destroying the structure of CSH [54].
From Figs. 3c and 3d, in addition to the interaction of PS × AE, there was also a significant interaction in PS × T and PS × Ms. With the increase in LM from 5% to 15%, the 28-day compressive strength was enhanced by 10.3% at the low Ms concentration (0.5) and reduced by 12.2% at the high Ms concentration (0.9). This was related to the content of [SiO4]4−. With the lower Ms concentration level (0.5), the increase in waste enhanced the nucleation effect [55] and thus increased the precipitation of CSH [56,57]; with sufficient [SiO4]4−, the pozzolanic reactivity of paper sludge was inferior to BFS, which led to a decrease in compressive strength. From the interaction of PS and preparation time (Fig. 3d), with the increase in LM from 5% to 15%, the 28-day compressive strength was reduced by 9.0% at the low T level (10 min) and enhanced by 3.7% at the high T level (20 min). This might be attributed to the extent of preparation time that increased the dissolution of waste in the activator [54], due to the inertness of PS, a longer reaction time is required.
3.2.2 Control Parameters in the Experimental Models of Compressive Strengths
In addition to PPW, alkali-activated conditions also had an important impact on compressive strength. In the experimental mode of compressive strength, the contribution of the Ms accounted for 38.28% and 40.32% of the total parameters in the 7-day and 28-day compressive strength respectively. In terms of the increase in Ms from 0.5 to 0.9, the 7-day and 28-day compressive strength increased by 9.62 and 11.32 MPa, respectively. The trend of compressive strength was the same as alkali-activated slag (AAS) [58,59]. This was attributed to the increase of Ms that could promote CSH formation and contribute to a denser microstructure [60]. However, limited by the sodium silicate powder, the maximum of Ms in the study was 0.9. Compared with the optimal module section of AAS [61], Ms still could be improved to an extent.
The high concentration of AE was conducive to the 7-day compressive strength. With the increase in AE from 5% to 10%, the 7-day compressive strength was enhanced by 6.54 MPa. It was attributed to the high concentration of Na+ and OH− that accelerated the dissolution of raw material and the formation of hydrates [62,63]. This was also reflected in T × AE. The increase in preparation time and OH− concentration both resulted in a higher dissolution of raw material.
3.3 Significant Factors in the Experimental Models of Flexural Strength
3.3.1 Significant Interactions of PPW in the Experimental Models of Flexural Strengths
In experimental models of 7-day flexural strength, the significant interactions related to waste were Ms × PS, AE × LM, Ms × LM, and the coefficient accounted for 36.6% of the total significant factors. In experimental models of 28-day flexural strength, the significant interactions related to waste were Ms × PS, and the coefficient accounted for 14.7% of the total significant factors. The interactions of those factors are shown in Fig. 4.

Figure 4: The significant interactions of PPW in flexural strength (a) Interactions of AE × LM (7-day) (b) Interactions of Ms × LM (7-day) (c) Interactions of Ms × PS (7-day) (d) Interactions of Ms × PS (28-day)
From Figs. 4a and 4b, AE and Ms had the same effects on the 7-day flexural strength with the increase of LM substitution. Similar to Ms × LM in the 7-day compression strength, this was attributed to the face that the deficiency in OH− and [SiO4]4− could not support the hydration of AAS at the low AE and Ms concentration. With the high AE and Ms concentration, the inertia of LM might decrease the flexural strength.
In the interactions of Ms × PS, the 7-day and 28-day flexural strength were completely opposite. At the low Ms concentration (0.5) (Fig. 4c), 7-day flexural strength declined by 7.8% and 28-day flexural strength enhanced by 4.9% with the increase of PS. At the high Ms concentration (0.9) (Fig. 4d), 7-day flexural strength enhanced by 16.3% and 28-day flexural strength declined by 11.2% with the increase of PS. This was because the lignin in PS slowed down the hydration, thus improving the shrinkage and stability of the mortar [64], and facilitating the 28-day flexural strength at the low [SiO4]4− concentration. At the high [SiO4]4− concentration, the increase in PS enhanced nucleation effect, making the 7-day flexural strength increase rapidly. However, in the consideration of the scarcity of pozzolanic reactivity, the increase of PS substitution also caused the 28-day flexural reduction.
3.3.2 Control Parameters in the Experimental Models of Flexural Strengths
In the experimental models of 7-day flexural strength, the contribution of the Ms accounted for 28.34% of the total parameters. Combined with the effect of Ms increasing, the 7-day flexural strength increased by 0.8 MPa. It was not the same as AAS [60,65], which might be attributed to the insufficiency of [SiO4]4− at the low Ms concentration. In the experimental models of 28-day flexural strength, the contribution of the AE accounted for 40.15% of the total parameters. The flexural strength decreased rapidly with the increase of AE. This was attributed to the shrinkage caused by excessive alkali [54,66], which generated micro-cracks decrease the flexural strength.
3.4 Analysis of PPW Substitution Ratio
As the purpose of Taguchi Method is to find an optimal composition of alkali-activated binder, it is necessary to investigate the different ratios of PPW substituted for BFS in the mixture. The strengths of different ratios in binder are shown in Fig. 5.
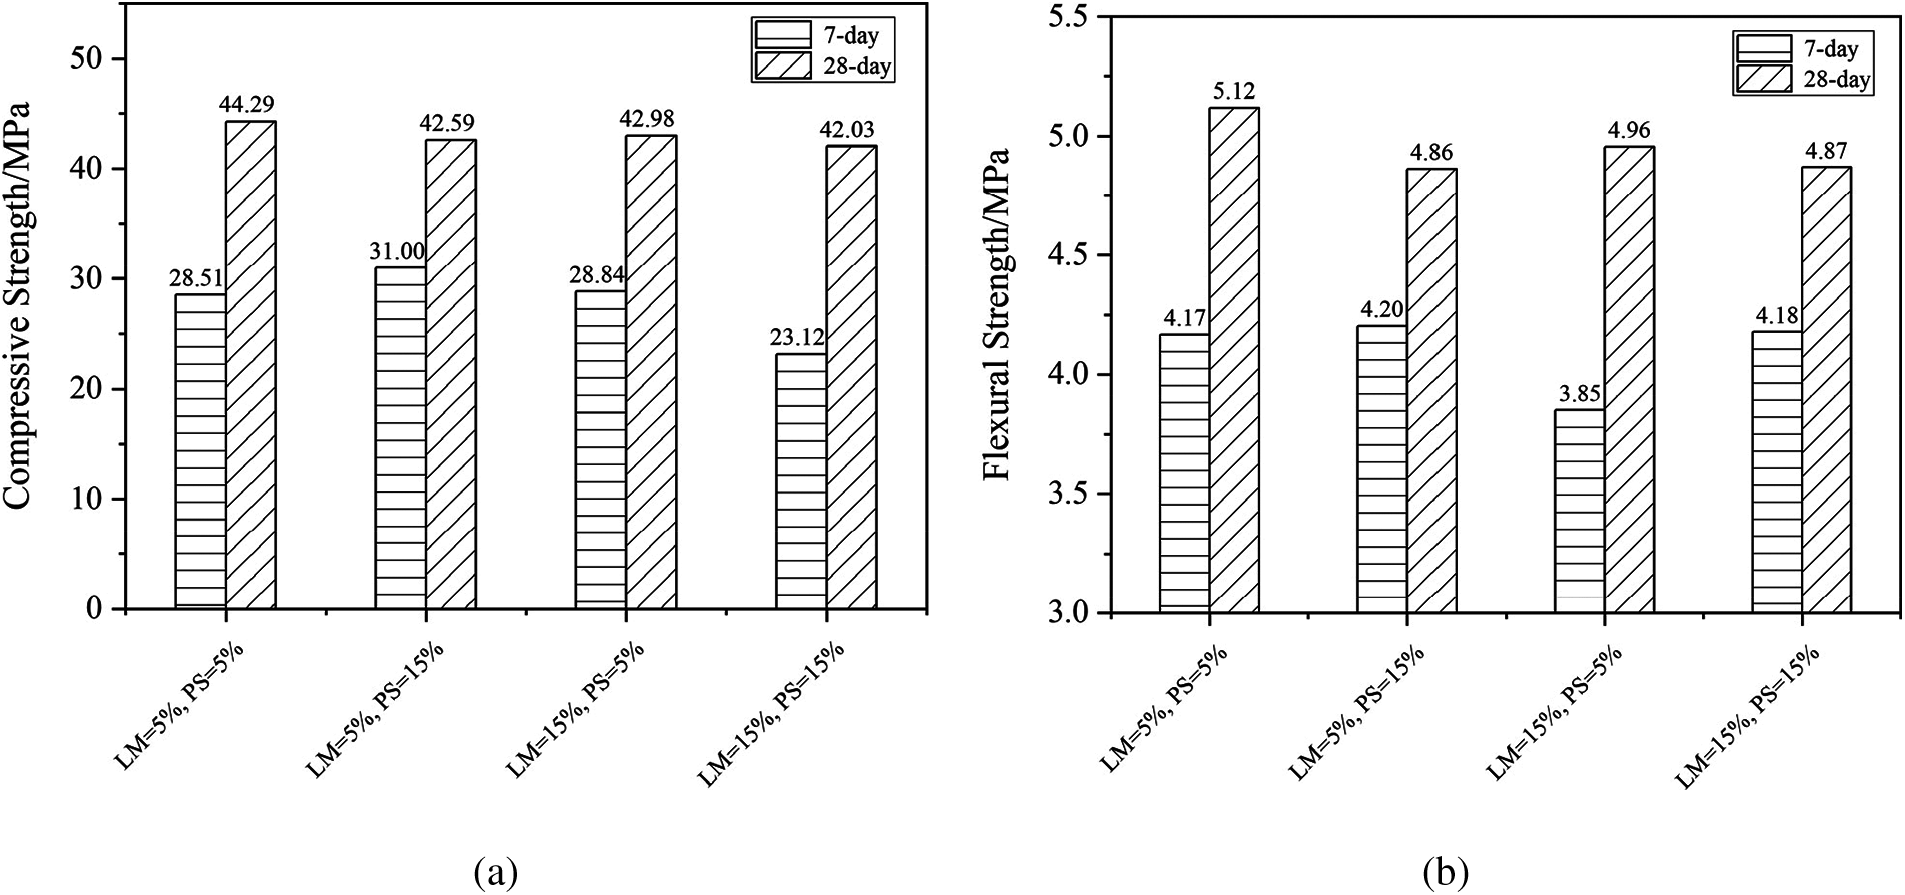
Figure 5: The impact of PPW substitution ratio (a) compressive strength (b) flexural strength
As seen in Fig. 5, with LM = 5% and PS = 15%, the 7-day compressive and flexural strengths have the peak points, which are 31.00 and 4.20 MPa, respectively. This is mutually corroborated with the conclusion of the significant interactions of 7-day compressive and flexural strength in the study. The 28-day compressive and flexural strengths decrease with the increase of PPW ratio, but the decrease is not obvious. With 10% of the PPW ratio, the compressive and flexural strengths are 44.29 and 5.12 MPa, respectively. In contrast to the 10% of PPW in replacing BFS, the compressive and flexural strengths decrease by 5% with 30% of the PPW ratio, which is 42.03 and 4.87 MPa, respectively. Therefore, in order to change more PPW into building materials, 30% of PPW replacement of BFS would be a better choice for translating PPW into materials.
3.5 Optimal Composition and Verification Experiments
3.5.1 Significant Parameters in the Experimental Models of Flexural Strengths
From the experimental models of 7-day compressive strengths, the equation has the optimal value in following conditions:
(1) k = j = i ⋅ j = i ⋅ k = +1
(2) l = l ⋅ m = k ⋅ l = −1
Therefore with k, j, i, m = +1 and l = −1, the η7c has the optimal value:
The optimal composition of 7-day compressive strength is: T+1 = 20 min, AE+1 = 10%, Ms+1 = 0.9, LM−1 = 5%, and PS+1 = 15%. Therefore, the optimal value is
From the experimental models of 28-day compressive strengths, the equation has the optimal value in following conditions:
(1) k = i ⋅ m = +1
(2) i = i ⋅ j = j ⋅ l = k ⋅ m = j ⋅ m = −1
Therefore with k, j = +1 and i, l, m = −1, the η28c has the optimal value:
The optimal composition of 28-day compressive strength is: T−1 = 10 min, AE+1 = 10%, Ms+1 = 0.9, LM−1 = 5%, and PS−1 = 5%. Therefore, the optimal value is
3.5.2 Optimal Composition and Verification Experiments of Flexural Strengths
From the experimental models of 7-day flexural strengths, the equation has the optimal value in the following conditions:
(1) k = j = k ⋅ m = +1
(2) i = j ⋅ l = k ⋅ l = −1
Therefore with k, j, m = +1 and i, l = −1, the η7f has the optimal value:
The optimal composition of 7-day flexural strength is: T−1 = 10 min, AE+1 = 10%, Ms+1 = 0.9, LM−1 = 5%, and PS+1 = 15%. It is not included in the experimental series, and the predicted optimal value is
From the experimental models of 28-day flexural strengths, the equation has the optimal value in following conditions:
(1) i = j = i ⋅ j = k ⋅ m = j ⋅ k = −1
Therefore with k = +1 and i, j, m = −1, the η28f has the optimal value:
The optimal composition of 28-day flexural strength is: T−1 = 10 min, AE−1 = 5%, Ms+1 = 0.9, PS−1 = 5%. Therefore, the optimal value is
3.5.3 Comparison of Parameters Effect
In previous literatures [29,31,33,34,37], the factors effect always investigates parameters without interactions. However, considering the complex composition of PPW, the interactions of parameters should be examined if they really affect the chosen optimal compositions or not. Among the compressive and flexural strengths, the optimal compositions selected by parameters effect without interactions are:
7-day compressive strength: T−1, AE+1, Ms+1, LM−1, PS−1;
28-day compressive strength: T−1, AE+1, Ms+1, LM−1, PS−1;
7-day flexural strength: T−1, AE+1, Ms+1, LM−1, PS+1;
28-day flexural strength: T−1, AE−1, Ms−1, LM−1, PS−1;
Because of the effect of parameters without interactions, there is only a 50% chance to have the real optimal compositions (28-day compressive strength and 7-day flexural strength) and other optimal compositions are proved to be wrong. Among them, the optimal composition of 7-day compressive strength obtained by the effect of parameters without interactions is 33.68 MPa, which is significantly smaller than the actual optimal ratio 47.41 MPa. The optimal composition of 28-day flexural strength obtained by the effect of parameters without interactions is 5.18 MPa, which is significantly smaller than the actual optimal ratio 5.96 MPa. Therefore, from the perspective of chosen optimal compositions, it is necessary to consider the significant interaction of parameters while the waste, which has inseparable impurities is used as the substitution for BFS.
This paper has investigated the second-order interactions of parameters in an alkali-activated mixture of PPW and BFS. Based on the test results, the following conclusions can be drawn:
(1) In selecting the optimal composition, interactions of parameters should firstly be investigated because interactions of parameters will affect the optimal composition selection. If not considering the effects of parameters interactions, it may lead to the wrong selection of the optimal composition. Compared with the interactions between the PPW themselves, the interactions between PPW and alkali-activated parameters are the main significant factors to the physical properties.
(2) The experimental models of compressive and flexural strengths, which alkali-activated the PPW as a substitution for BFS, have been given in this investigation. The maximum of 7-day and 28-day compressive strengths are 47.41 and 65.64 MPa, respectively; the prediction errors of 7-day and 28-day compressive strengths are 3.08% and 0.56%, respectively; the maximum of 7-day and 28-day flexural strengths are 47.41 and 65.64 MPa, respectively; the prediction errors of 7-day and 28-day flexural strengths are 3.08% and 0.56%, respectively.
(3) Although the compressive and flexural strengths will decrease with the increase of the PPW ratio, this decrease is limited. When the PPW increased from 10% to 30%, the reduction of strength is 5%. Therefore, considering the coefficient of utilization in translating PPW into building materials, 30% of PPW should be a suitable ratio in replacing BFS as the raw material of AAS under the consideration of circular materials.
Funding Statement: This work was supported by Ministry of education of Taiwan (Grant No. H108-AA09) for funding, CHP for materials provision, and NCKU C-Hub for space and instruments.
Conflicts of Interest: The authors declare that they have no conflicts of interest to report regarding the present study.
1. Tiseo, I. (2021). Production volume of paper and cardboard worldwide from 2008 to 2018. https://www.statista.com/statistics/270314/production-of-paper-and-cardboard-in-selected-countries/. [Google Scholar]
2. Mymrin, V., Pedroso, C. L., Pedroso, D. E., Avanci, M. A., Meyer, S. A. S. et al. (2020). Efficient application of cellulose pulp and paper production wastes to produce sustainable construction materials. Construction and Building Materials, 263, 120604. DOI 10.1016/j.conbuildmat.2020.120604. [Google Scholar] [CrossRef]
3. Monte, M. C., Fuente, E., Blanco, A., Negro, C. (2009). Waste management from pulp and paper production in the european union. Waste Management, 29(1), 293–308. DOI 10.1016/j.wasman.2008.02.002. [Google Scholar] [CrossRef]
4. de Azevedo, A. R. G., Alexandre, J., Xavier, G. de. C., Pedroti, L. G. (2018). Recycling paper industry effluent sludge for use in mortars: A sustainability perspective. Journal of Cleaner Production, 192, 335–346. DOI 10.1016/j.jclepro.2018.05.011. [Google Scholar] [CrossRef]
5. Faubert, P., Barnabé, S., Bouchard, S., Côté, R., Villeneuve, C. (2016). Pulp and paper mill sludge management practices: What are the challenges to assess the impacts on greenhouse gas emissions? Resources, Conservation and Recycling, 108, 107–133. DOI 10.1016/j.resconrec.2016.01.007. [Google Scholar] [CrossRef]
6. Buruberri, L. H., Seabra, M. P., Labrincha, J. A. (2015). Preparation of clinker from paper pulp industry wastes. Journal of Hazardous Materials, 286, 252–260. DOI 10.1016/j.jhazmat.2014.12.053. [Google Scholar] [CrossRef]
7. de Azevedo, A. R. G., Alexandre, J., Marvila, M. T., Xavier, G. de. C., Monteiro, S. N. et al. (2020). Technological and environmental comparative of the processing of primary sludge waste from paper industry for mortar. Journal of Cleaner Production, 249, 119336. DOI 10.1016/j.jclepro.2019.119336. [Google Scholar] [CrossRef]
8. Bajpai, P. (2015). Management of pulp and paper mill waste, London, UK: Springer International Publishing. [Google Scholar]
9. Makela, M., Watkins, G., Poykio, R., Nurmesniemi, H., Dahl, O. (2012). Utilization of steel, pulp and paper industry solid residues in forest soil amendment: Relevant physicochemical properties and heavy metal availability. Journal of Hazardous Materials, 207–208, 21–27. DOI 10.1016/j.jhazmat.2011.02.015. [Google Scholar] [CrossRef]
10. Toczyłowska-Mamińska, R. (2017). Limits and perspectives of pulp and paper industry wastewater treatment–A review. Renewable and Sustainable Energy Reviews, 78, 764–772. DOI 10.1016/j.rser.2017.05.021. [Google Scholar] [CrossRef]
11. Lindholm-Lehto, P. C., Knuutinen, J. S., Ahkola, H. S., Herve, S. H. J. E. S., Research, P. (2015). Refractory organic pollutants and toxicity in pulp and paper mill wastewaters. Environmental Science and Pollution Research, 22(9), 6473–6499. DOI 10.1016/j.jenvman.2021.113527. [Google Scholar] [CrossRef]
12. Kaur, R., Tyagi, R. D., Zhang, X. (2020). Review on pulp and paper activated sludge pretreatment, inhibitory effects and detoxification strategies for biovalorization. Environmental Research, 182, 109094. DOI 10.1016/j.envres.2019.109094. [Google Scholar] [CrossRef]
13. Mandeep, Kumar Gupta, G., Shukla, P. (2020). Insights into the resources generation from pulp and paper industry wastes: Challenges, perspectives and innovations. Bioresource Technology, 297, 122496. DOI 10.1016/j.biortech.2019.122496. [Google Scholar] [CrossRef]
14. Zhang, Q., Khan, M. U., Lin, X., Yi, W., Lei, H. (2020). Green-composites produced from waste residue in pulp and paper industry: A sustainable way to manage industrial wastes. Journal of Cleaner Production, 262, 121251. DOI 10.1016/j.jclepro.2020.121251. [Google Scholar] [CrossRef]
15. Martins, F. M., Martins, J. M., Ferracin, L. C., da Cunha, C. J. (2007). Mineral phases of green liquor dregs, slaker grits, lime mud and wood ash of a kraft pulp and paper mill. Journal of Hazardous Materials, 147 (1–2), 610–617. DOI 10.1016/j.jhazmat.2007.01.057. [Google Scholar] [CrossRef]
16. de Azevedo, A. R. G., Alexandre, J., Pessanha, L. S. P., Manhães, R. da. S. T., de Brito, J. et al. (2019). Characterizing the paper industry sludge for environmentally-safe disposal. Waste Management, 95, 43–52. DOI 10.1016/j.wasman.2019.06.001. [Google Scholar] [CrossRef]
17. Vashistha, P., Kumar, V., Singh, S. K., Dutt, D., Tomar, G. et al. (2019). Valorization of paper mill lime sludge via application in building construction materials: A review. Construction and Building Materials, 211, 371–382. DOI 10.1016/j.conbuildmat.2019.03.085. [Google Scholar] [CrossRef]
18. Singh, S. K., Singh, A., Singh, B., Vashistha, P. (2020). Application of thermo-chemically activated lime sludge in production of sustainable low clinker cementitious binders. Journal of Cleaner Production, 264, 121570. DOI 10.1016/j.jclepro.2020.121570. [Google Scholar] [CrossRef]
19. Torres, C. M. M. E., Silva, C. M., Pedroti, L. G., Fernandes, W. E. H., Ballotin, F. C. et al. (2020). Dregs and grits from kraft pulp mills incorporated to Portland cement clinker. Journal of Material Cycles and Waste Management, 22(3), 851–861. DOI 10.1007/s10163-020-00983-x. [Google Scholar] [CrossRef]
20. Yan, S., Sagoe-Crentsil, K., Shapiro, G. (2011). Reuse of de-inking sludge from wastepaper recycling in cement mortar products. Journal of Environmental Management, 92(8), 2085–2090. DOI 10.1016/j.jenvman.2011.03.028. [Google Scholar] [CrossRef]
21. Martínez-Lage, I., Velay-Lizancos, M., Vázquez-Burgo, P., Rivas-Fernández, M., Vázquez-Herrero, C. et al. (2016). Concretes and mortars with waste paper industry: Biomass ash and dregs. Journal of Environmental Management, 181, 863–873. DOI 10.1016/j.jenvman.2016.06.052. [Google Scholar] [CrossRef]
22. Malaiskiene, J., Kizinievic, O., Kizinievic, V., Boris, R. (2018). The impact of primary sludge from paper industry on the properties of hardened cement paste and mortar. Construction and Building Materials, 172, 553–561. DOI 10.1016/j.conbuildmat.2018.04.011. [Google Scholar] [CrossRef]
23. Ferreiro, S., Frías, M., Vigil de la Villa, R., Sánchez de Rojas, M. I. (2013). The influence of thermal activation of art paper sludge on the technical properties of blended portland cements. Cement and Concrete Composites, 37, 136–142. DOI 10.1016/j.cemconcomp.2012.11.005. [Google Scholar] [CrossRef]
24. Antunes Boca Santa, R. A., Bernardin, A. M., Riella, H. G., Kuhnen, N. C. (2013). Geopolymer synthetized from bottom coal ash and calcined paper sludge. Journal of Cleaner Production, 57, 302–307. DOI 10.1016/j.jclepro.2013.05.017. [Google Scholar] [CrossRef]
25. Novais, R. M., Carvalheiras, J., Senff, L., Labrincha, J. A. (2018). Upcycling unexplored dregs and biomass fly ash from the paper and pulp industry in the production of eco-friendly geopolymer mortars: A preliminary assessment. Construction and Building Materials, 184, 464–472. DOI 10.1016/j.conbuildmat.2018.07.017. [Google Scholar] [CrossRef]
26. Mamat, N., Kusbiantoro, A., Rahman, N. (2018). Hydrochloric acid based pre-treatment on paper mill sludge ash as an alternative source material for geopolymer. Materials Today: Proceedings, 5(10), 21825–21831. DOI 10.1016/j.matpr.2018.07.038. [Google Scholar] [CrossRef]
27. Saeli, M., Senff, L., Tobaldi, D. M., Carvalheiras, J., Seabra, M. P. et al. (2020). Unexplored alternative use of calcareous sludge from the paper-pulp industry in green geopolymer construction materials. Construction and Building Materials, 246, 118457. DOI 10.1016/j.conbuildmat.2020.118457. [Google Scholar] [CrossRef]
28. Adesanya, E., Ohenoja, K., Luukkonen, T., Kinnunen, P., Illikainen, M. (2018). One-part geopolymer cement from slag and pretreated paper sludge. Journal of Cleaner Production, 185, 168–175. DOI 10.1016/j.jclepro.2018.03.007. [Google Scholar] [CrossRef]
29. Türkmen, İ., Gül, R., Çelik, C. (2008). A taguchi approach for investigation of some physical properties of concrete produced from mineral admixtures. Building and Environment, 43(6), 1127–1137. DOI 10.1016/j.buildenv.2007.02.005. [Google Scholar] [CrossRef]
30. Molani, S., Azdast, T., Doniavi, A., Hasanzadeh, R., Moradian, M. et al. (2018). A taguchi analysis on structural properties of polypropylene microcellular nanocomposite foams containing Fe2O3 nanoparticles in batch process. Plastics, Rubber and Composites, 47(3), 106–112. DOI 10.1080/14658011.2018.1441778. [Google Scholar] [CrossRef]
31. Teimortashlu, E., Dehestani, M., Jalal, M. (2018). Application of taguchi method for compressive strength optimization of tertiary blended self-compacting mortar. Construction and Building Materials, 190, 1182–1191. DOI 10.1016/j.conbuildmat.2018.09.165. [Google Scholar] [CrossRef]
32. Jafari, K., Tabatabaeian, M., Joshaghani, A., Ozbakkaloglu, T. (2018). Optimizing the mixture design of polymer concrete: An experimental investigation. Construction and Building Materials, 167, 185–196. DOI 10.1016/j.conbuildmat.2018.01.191. [Google Scholar] [CrossRef]
33. Hadi, M. N. S., Farhan, N. A., Sheikh, M. N. (2017). Design of geopolymer concrete with GGBFS at ambient curing condition using Taguchi method. Construction and Building Materials, 140, 424–431. DOI 10.1016/j.conbuildmat.2017.02.131. [Google Scholar] [CrossRef]
34. Dave, S. V., Bhogayata, A. (2020). The strength oriented mix design for geopolymer concrete using Taguchi method and Indian concrete mix design code. Construction and Building Materials, 262, 120853. DOI 10.1016/j.conbuildmat.2020.120853. [Google Scholar] [CrossRef]
35. Onoue, K., Iwamoto, T., Sagawa, Y. (2019). Optimization of the design parameters of fly ash-based geopolymer using the dynamic approach of the Taguchi method. Construction and Building Materials, 219, 1–10. DOI 10.1016/j.conbuildmat.2019.05.177. [Google Scholar] [CrossRef]
36. Olivia, M., Nikraz, H. (2012). Properties of fly ash geopolymer concrete designed by Taguchi method. Materials & Design (1980–2015), 36, 191–198. DOI 10.1016/j.matdes.2011.10.036. [Google Scholar] [CrossRef]
37. Mehta, A., Siddique, R., Singh, B. P., Aggoun, S., Łagód, G. et al. (2017). Influence of various parameters on strength and absorption properties of fly ash based geopolymer concrete designed by Taguchi method. Construction and Building Materials, 150, 817–824. DOI 10.1016/j.conbuildmat.2017.06.066. [Google Scholar] [CrossRef]
38. Zhang, L. W., Sojobi, A. O., Kodur, V. K. R., Liew, K. M. (2019). Effective utilization and recycling of mixed recycled aggregates for a greener environment. Journal of Cleaner Production, 236, 117600. DOI 10.1016/j.jclepro.2019.07.075. [Google Scholar] [CrossRef]
39. Krishnaiah, K., Shahabudeen, P. (2012). Applied design of experiments and taguchi methods, Delhi, India: PHI Learning Pvt., Ltd. [Google Scholar]
40. Kackar, R. N. (1985). Off-line quality control, parameter design, and the Taguchi method. Journal of Quality Technology, 17(4), 176–188. DOI 10.1080/00224065.1985.11978964. [Google Scholar] [CrossRef]
41. Bureau of Standards (2015). Ground granulated blast-furnace slag for use in concrete and mortars, vol. CNS12549. [Google Scholar]
42. CHC (2020). https://www.chc.com.tw/. [Google Scholar]
43. CHC (2018). Chung Hwa Pulp Corporation. http://www.chp.com.tw/. [Google Scholar]
44. Materials, A. S. f. T. a. (2006). Standard specification for aggregate for masonry mortar, vol. ASTM C144–04. [Google Scholar]
45. Lee, H. H. J. G. L. B. C., Ltd. (2000). Taguchi methods: Principles and practices of quality design. [Google Scholar]
46. Taguchi, G. (1986). Introduction to quality engineering: Designing quality into products and processes, White Plains, N. Y. [Google Scholar]
47. Mojaver, M., Azdast, T., Hasanzadeh, R. (2021). Assessments of key features and taguchi analysis on hydrogen rich syngas production via gasification of polyethylene, polypropylene, polycarbonate and polyethylene terephthalate wastes. International Journal of Hydrogen Energy, 46(58), 29846–29857. DOI 10.1016/j.ijhydene.2021.06.161. [Google Scholar] [CrossRef]
48. Yi, T., Liou, S. R., Kuo, W. Y. (2019). Feasibility of alkali activated pulp wastes as cementitious materials. National Cheng Kung University, Tainan, Taiwan, (Unpublished). [Google Scholar]
49. Materials, A. S. f. T. a. (2020). Standard practice for mechanical mixing of hydraulic cement pastes and mortars of plastic consistency, vol. ASTM C305-20. [Google Scholar]
50. Materials, A. S. f. T. a. (2020). Standard test method for compressive strength of hydraulic cement mortars (Using 2-in. or [50 mm] cube specimensvol. ASTM C109/C109M-20b. [Google Scholar]
51. Materials, A. S. f. T. a. (2020). Standard test method for flexural strength of hydraulic-cement mortars, vol. ASTM C348-20. [Google Scholar]
52. Luukkonen, T., Sreenivasan, H., Abdollahnejad, Z., Yliniemi, J., Kantola, A. et al. (2020). Influence of sodium silicate powder silica modulus for mechanical and chemical properties of dry-mix alkali-activated slag mortar. Construction and Building Materials, 233, 117354. DOI 10.1016/j.conbuildmat.2019.117354. [Google Scholar] [CrossRef]
53. Panesar, D. K., Zhang, R. (2020). Performance comparison of cement replacing materials in concrete: Limestone fillers and supplementary cementing materials–A review. Construction and Building Materials, 251, 118866. DOI 10.1016/j.conbuildmat.2020.118866. [Google Scholar] [CrossRef]
54. Chen, J. H. (2009). Silicon-contained waste as a raw material of inorganic polymers (Dissertation). National Cheng Kung University. [Google Scholar]
55. Courard, L., Michel, F., Perkowicz, S., Garbacz, A. (2014). Effects of limestone fillers on surface free energy and electrical conductivity of the interstitial solution of cement mixes. Cement and Concrete Composites, 45, 111–116. DOI 10.1016/j.cemconcomp.2013.09.014. [Google Scholar] [CrossRef]
56. Li, L. G., Kwan, A. K. H. (2015). Adding limestone fines as cementitious paste replacement to improve tensile strength, stiffness and durability of concrete. Cement and Concrete Composites, 60, 17–24. DOI 10.1016/j.cemconcomp.2015.02.006. [Google Scholar] [CrossRef]
57. Ke, X., Bernal, S. A., Provis, J. L. (2016). Controlling the reaction kinetics of sodium carbonate-activated slag cements using calcined layered double hydroxides. Cement and Concrete Research, 81, 24–37. DOI 10.1016/j.cemconres.2015.11.012. [Google Scholar] [CrossRef]
58. Al-Otaibi, S. (2008). Durability of concrete incorporating GGBS activated by water-glass. Construction and Building Materials, 22(10), 2059–2067. DOI 10.1016/j.conbuildmat.2007.07.023. [Google Scholar] [CrossRef]
59. Krizan, D., Zivanovic, B. (2002). Effects of dosage and modulus of water glass on early hydration of alkali–slag cements. Cement and Concrete Research, 32(8), 1181–1188. DOI 10.1016/S0008-8846(01)00717-7. [Google Scholar] [CrossRef]
60. Fang, S., Lam, E. S. S., Li, B., Wu, B. (2020). Effect of alkali contents, moduli and curing time on engineering properties of alkali activated slag. Construction and Building Materials, 249, 118799. DOI 10.1016/j.conbuildmat.2020.118799. [Google Scholar] [CrossRef]
61. Wang, S. D., Scrivener, K. L., Pratt, P. L. (1994). Factors affecting the strength of alkali-activated slag. Cement and Concrete Research, 24(6), 1033–1043. DOI 10.1016/0008-8846(94)90026-4. [Google Scholar] [CrossRef]
62. Sithole, N. T., Mashifana, T. (2020). Geosynthesis of building and construction materials through alkaline activation of granulated blast furnace slag. Construction and Building Materials, 264, 120712. DOI 10.1016/j.conbuildmat.2020.120712. [Google Scholar] [CrossRef]
63. De Filippis, U., Prud’homme, E., Meille, S. (2021). Relation between activator ratio, hydration products and mechanical properties of alkali-activated slag. Construction and Building Materials, 266, 120940. DOI 10.1016/j.conbuildmat.2020.120940. [Google Scholar] [CrossRef]
64. Yan, S., Sagoe-Crentsil, K., Shapiro, G. (2012). Properties of cement mortar incorporating de-inking waste-water from waste paper recycling. Construction and Building Materials, 29, 51–55. DOI 10.1016/j.conbuildmat.2011.09.012. [Google Scholar] [CrossRef]
65. Aydın, S., Baradan, B. (2014). Effect of activator type and content on properties of alkali-activated slag mortars. Composites Part B: Engineering, 57, 166–172. DOI 10.1016/j.compositesb.2013.10.001. [Google Scholar] [CrossRef]
66. Ye, H., Cartwright, C., Rajabipour, F., Radlińska, A. (2017). Understanding the drying shrinkage performance of alkali-activated slag mortars. Cement and Concrete Composites, 76, 13–24. DOI 10.1016/j.cemconcomp.2016.11.010. [Google Scholar] [CrossRef]
 | This work is licensed under a Creative Commons Attribution 4.0 International License, which permits unrestricted use, distribution, and reproduction in any medium, provided the original work is properly cited. |