| Journal of Renewable Materials |
DOI: 10.32604/jrm.2022.018625
ARTICLE
The Estimation of the Higher Heating Value of Biochar by Data-Driven Modeling
1Key Laboratory of Poyang Lake Environment and Resource Utilization, Ministry of Education and School of Resources, Environmental & Chemical Engineering, Nanchang University, Nanchang, China
2School of Energy Science and Engineering, Central South University, Changsha, China
3Department of Chemical and Biomolecular Engineering, National University of Singapore, Singapore
4Department of Agricultural Engineering, Cairo University, Giza, Egypt
*Corresponding Authors: Wenguang Zhou. Email: wgzhou@ncu.edu.cn; Lijian Leng. Email: lljchs@126.com
Received: 06 August 2021; Accepted: 22 September 2021
Abstract: Biomass is a carbon-neutral renewable energy resource. Biochar produced from biomass pyrolysis exhibits preferable characteristics and potential for fossil fuel substitution. For time- and cost-saving, it is vital to establish predictive models to predict biochar properties. However, limited studies focused on the accurate prediction of HHV of biochar by using proximate and ultimate analysis results of various biochar. Therefore, the multi-linear regression (MLR) and the machine learning (ML) models were developed to predict the measured HHV of biochar from the experiment data of this study. In detail, 52 types of biochars were produced by pyrolysis from rice straw, pig manure, soybean straw, wood sawdust, sewage sludge, Chlorella Vulgaris, and their mixtures at the temperature ranging from 300 to 800°C. The results showed that the co-pyrolysis of the mixed biomass provided an alternative method to increase the yield of biochar production. The contents of ash, fixed carbon (FC), and C increased as the incremental pyrolysis temperature for most biochars. The Pearson correlation (r) and relative importance analysis between HHV values and the indicators derived from the proximate and ultimate analysis were carried out, and the measured HHV was used to train and test the MLR and the ML models. Besides, ML algorithms, including gradient boosted regression, random forest, and support vector machine, were also employed to develop more widely applicable models for predicting HHV of biochar from an expanded dataset (total 149 data points, including 97 data collected from the published literature). Results showed HHV had strong correlations (|r| > 0.9, p < 0.05) with ash, FC, and C. The MLR correlations based on either proximate or ultimate analysis showed acceptable prediction performance with test R2 > 0.90. The ML models showed better performance with test R2 around 0.95 (random forest) and 0.97–0.98 before and after adding extra data for model construction, respectively. Feature importance analysis of the ML models showed that ash and C were the most important inputs to predict biochar HHV.
Keywords: Biochar; higher heating value; machine learning; prediction; proximate analysis; ultimate analysis
Thermochemical conversion of biomass is one of the optional pathways to overcome the energy crisis, environmental pollution, and sustainable development issues of the world. There are about 13 billion tons of biomass resources per year on the planet that can be used [1]. Significant momentum has been attained in the use of renewable biomass as an alternative to traditional fossil fuels in the energy application fields [2]. However, the characteristics of raw biomass, such as high moisture content, large volume, low energy density, and low combustion calorific value, are several significant problems upon its use as fuel. As a solid product produced by the thermochemical conversion of biomass at temperatures below 900°C and oxygen-limited environment. Biochar has excellent potential for application in the energy storage [3], and biochar has a lower moisture content, higher energy density, higher stability, and more accessible transportation than biomass. Moreover, it is necessary to grasp the fuel properties (i.e., higher heating value (HHV)) of biochar for its application in the energy field. Generally, the basic principles of HHV analysis were straightforward, and they could be experimentally determined by the integrated system offered by the manufacturers. The HHV of the biochar samples can be determined by measuring the enthalpy difference of the sample before and after the reaction in an adiabatic oxygen bomb. However, the use of instruments to determine the properties of biochar has some disadvantages, such as high cost and time-consuming. Therefore, it is necessary and economical to develop the HHV prediction model based on some common characteristic indexes.
The ultimate and proximate results have been used to predict the carbon sequestration potential (stability) [4] and HHV [5]. And a large number of traditional multi-linear regression (MLR) models have been built and studied to predict the HHV of municipal solid waste, coal, biomass, etc. [6]. Mateus and coworkers developed a highly accurate HHV linear regression prediction model (R2 = 0.9997) based on the ultimate analysis of bio-oil produced by liquefaction [7]. In addition to the traditional MLR method widely used by researchers to predict HHV, many researchers have used artificial intelligence algorithm technology to predict HHV. These artificial intelligence algorithms can do well with both linear and nonlinear relationships between the input and target variables. Samadi and coworkers used the gradient boosting regression (GBR) algorithm to predict the HHV of biomass according to different training parameters (i.e., stochasticity, tree size, and learning rate), and the obtained model had good prediction performance (R2 = 0.93) [8]. Xing and coworkers [9] trained biomass HHV prediction models using empirical correlation, random forest (RF), support vector machine (SVM), and artificial neural network algorithms respectively by proximate and ultimate analysis data. Between the two types of data models of proximate analysis and ultimate analysis, RF (R2 = 0.962) and SVM (R2 = 0.953) have showed satisfactory predictive performance.
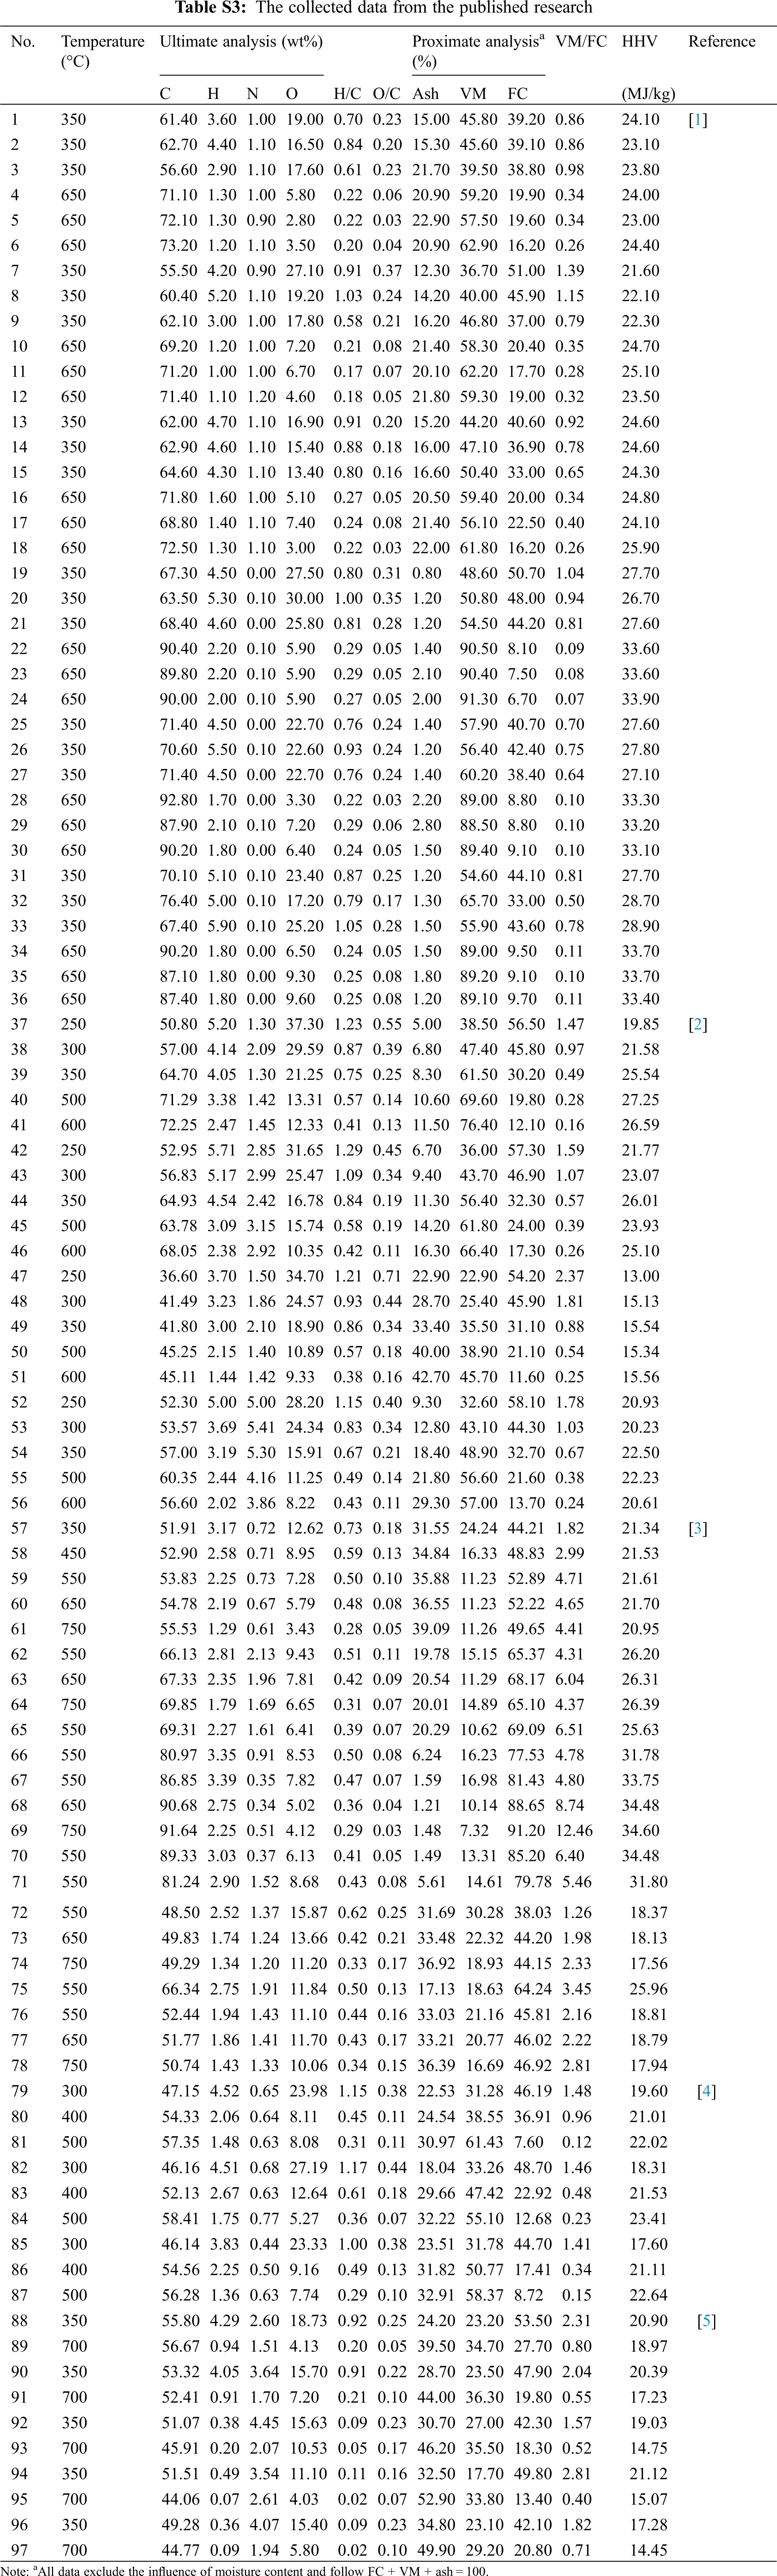
However, the studies focused on the prediction of HHV from the basic properties of biochar are limited. In addition, as a kind of solid fuel, biochar is very different from other natural materials, which impedes the application of existing models to predict the HHV of biochar. In this light, the aim of this research was to develop accurate models for the prediction of the HHV of biochar through GBR, RF, SVM algorithm, and linear regression method. In this study, 52 biochar samples were obtained from our experiments to explore the relationship between biochar characteristics and establish the HHV prediction models. Then, models were optimized by adding 97 data points from the published studies into the initial sample dataset. Finally, the predictive performance measures and relative importance analysis were conducted to evaluate the models.
2.1 Materials and Sample Preparation
A total of 52 biochar samples were produced through the pyrolysis process under various conditions from four different representative biomass species, including agricultural residues, algae, animal manure, and sludge. The rice straw (RS), pig manure (PM), soybean straw (SS), and wood sawdust (WD) were collected from local farmers in Jiangxi Province, China. The Chlorella Vulgaris (CL) and sewage sludge (SW) were provided from a biotechnology company in Shanxi Province of China and a municipal wastewater treatment plant in Jiangxi Province of China, respectively. Two types of biomasses were selected and mixed with a mass ratio of 1:1 to form the mixture, and the mixture was named as an abbreviated combination of the two kinds of biomass. All six biomasses and the mixtures were pulverized to a particle size of fewer than 350 microns and dried at 105°C for two hours to constant weight. During pyrolysis, the biomass was placed in oxygen-free reactors, and the temperature was increased from room temperature to target temperatures (ranged from 300 to 800°C, in 100°C intervals) with the heating rate of 10 °C/min. The residence time at the target temperature was one hour.
The ash, volatile matter (VM), and fixed carbon (FC) of biochars were analyzed following the procedures in previous study [10], which was carried out in an automatic proximate analyzer. The elemental composition (i.e., C, H, N, and S) of biochars was determined using an ultimate analyzer system (Elementar Analysensysteme GmbH, Vario EL III), and the O content was calculated by difference (O = 100 − C − H − N − S − ash). The HHV of biochars was determined by an automatic calorimeter (ZDHW-9000C, HB-Huanuo, China). About 1.0 g of the biochar sample was placed in an oxygen bomb calorimeter filled with excess oxygen. The HHV of the biochar was obtained after comparison with the heat capacity of the standard substance of benzoic acid (GBW130035, National Institute of Metrology, China) before and after burning and correction of additional heating such as point heating [11].
The MLR equations based on the ultimate and proximate analysis data were carried out by using Origin 2021b. In this research, three ML models (GBR, RF, SVM) were developed to predict the HHV of biochar through the scikit-learn Python library. GBR is a powerful non-parametric method for prediction. The algorithm principle of GBR is to train a new prediction tree in turn, and learn errors from the previous tree (n – 1) to get a new tree (n) with lower prediction errors [8,12,13]. RF has statistical advantages such as the low risk of overfitting and fewer parameters to be specified and can be used to deal with nonlinear and linear relationships between variables [14]. SVM is a ML algorithm that uses the nonlinear kernel function to map the initial training samples to the high-dimensional feature space, thus transforming the problem from nonlinear to linear and obtaining the optimal solution [9]. All of the input data were normalized according to the studies of Li et al. [15,16]. The ratio of the training dataset to the test dataset was 8:2, and cross validation was carried out to avoid bias in the training process. The performance of MLR and ML models in this study was evaluated in terms of coefficient of determination (R2), mean absolute error (MAE), and root mean square error (RMSE). The calculations of R2, MAE, and RMSE are defined as follows:
where HHVexperimental, HHVpredicted, and
3.1 Biochar Production and Characterization
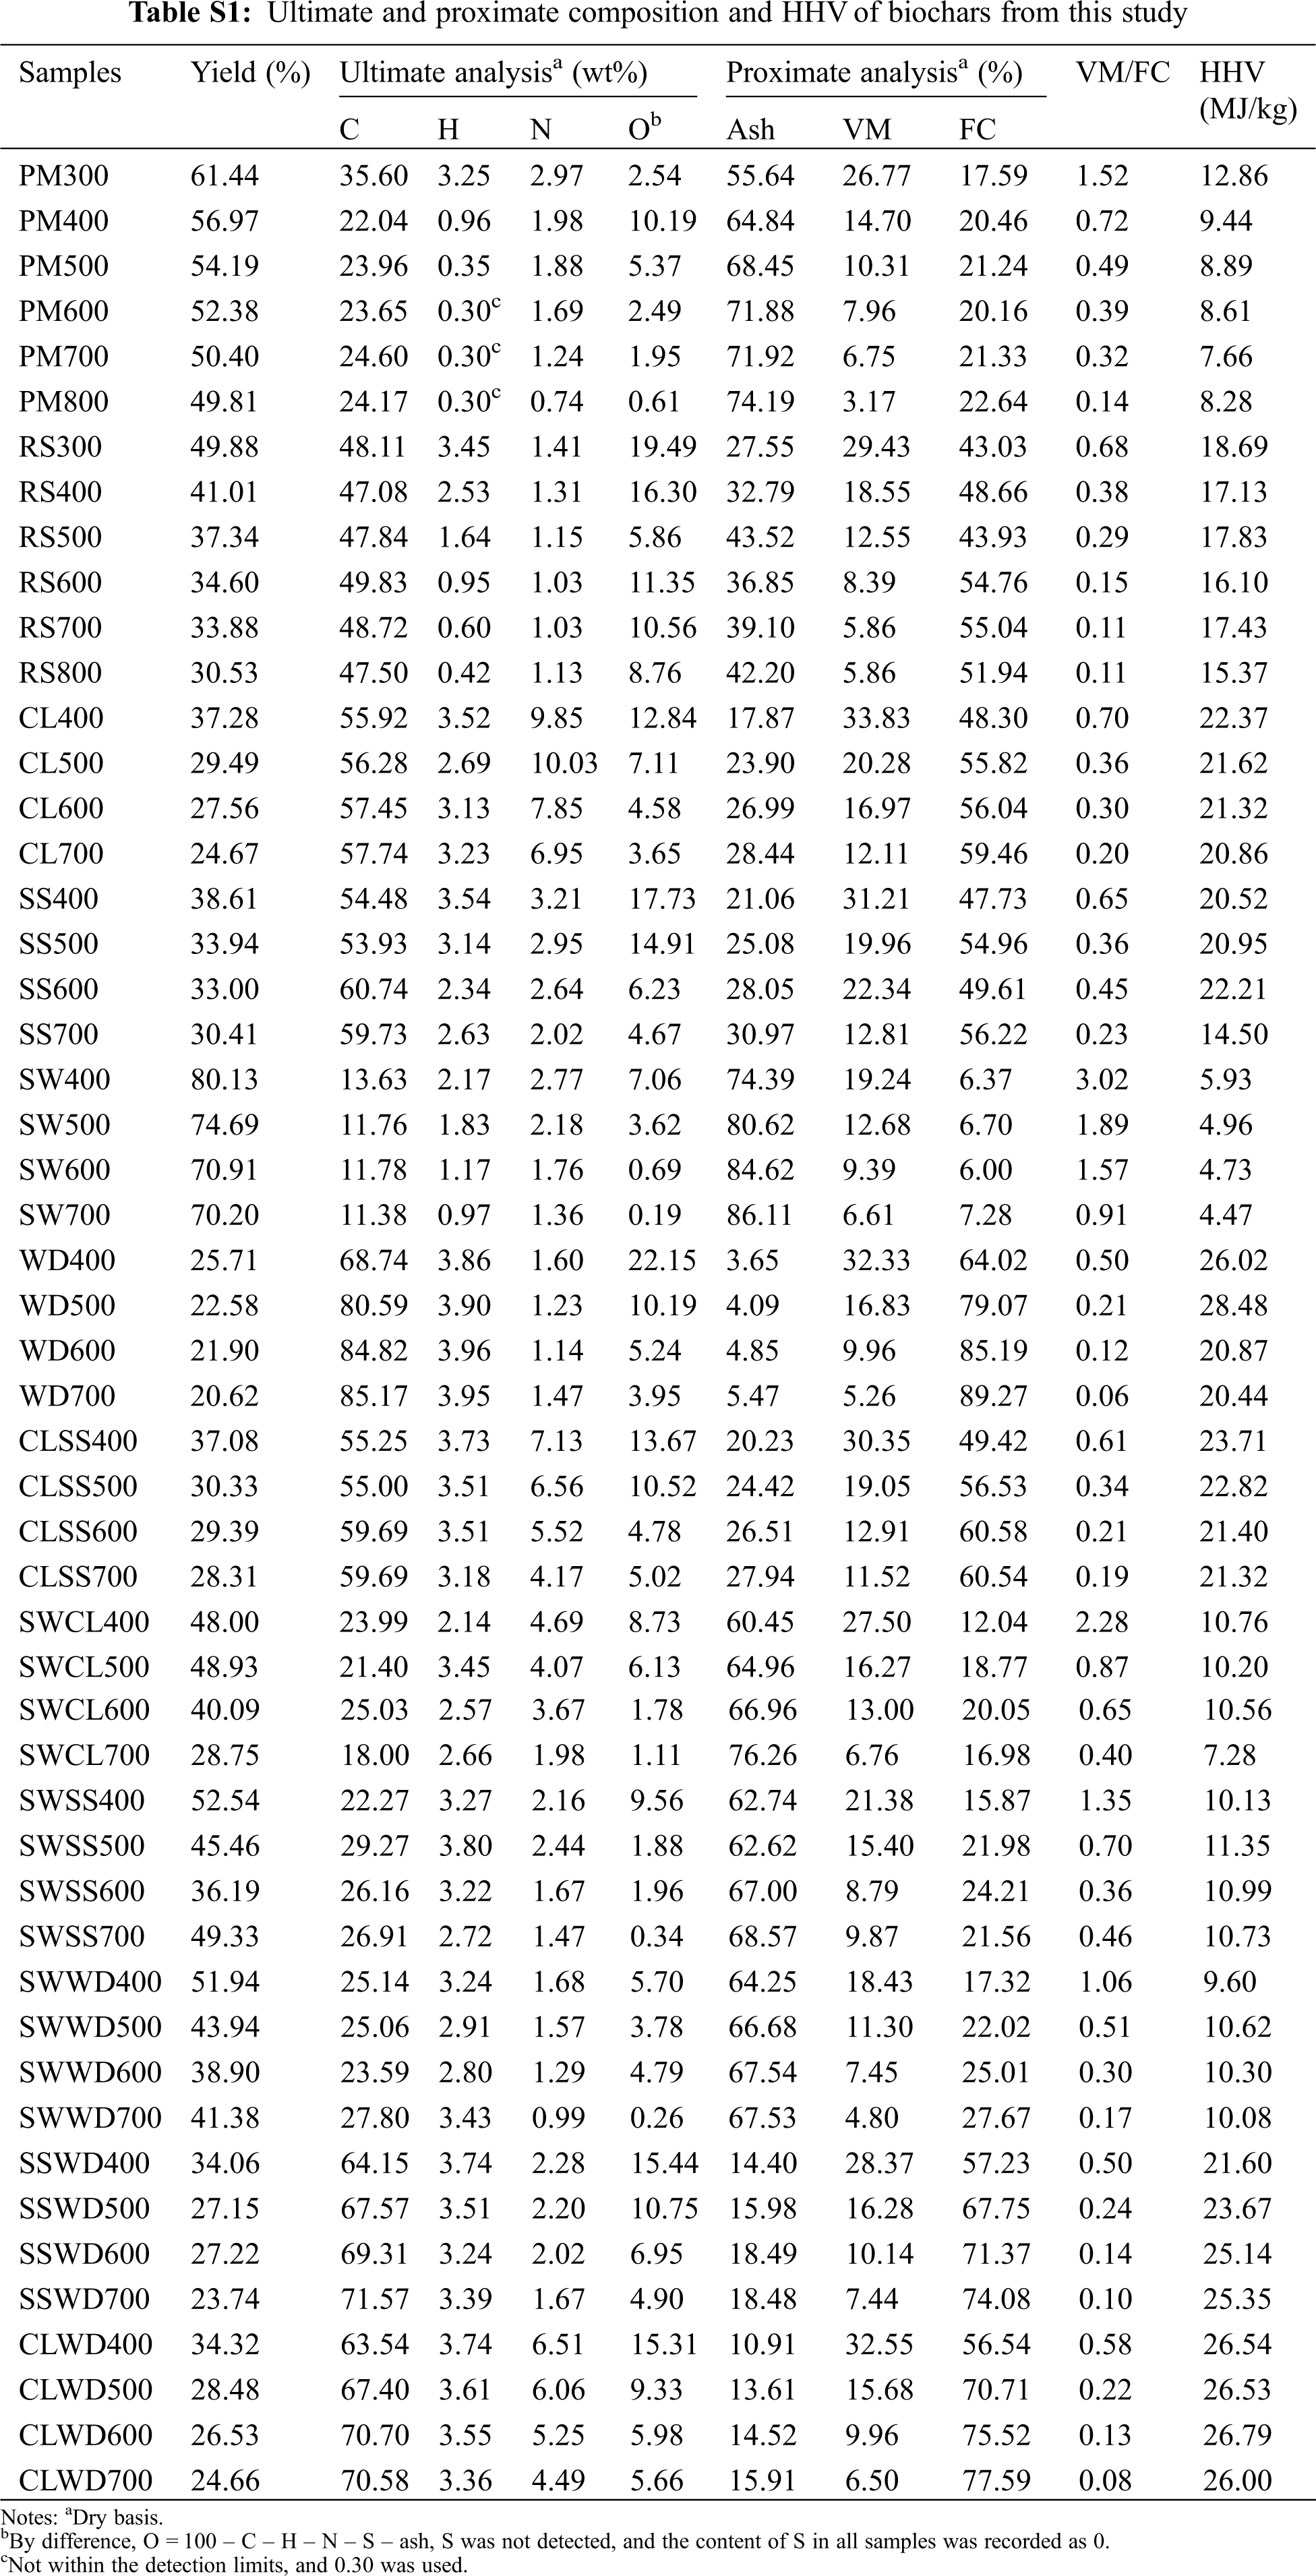
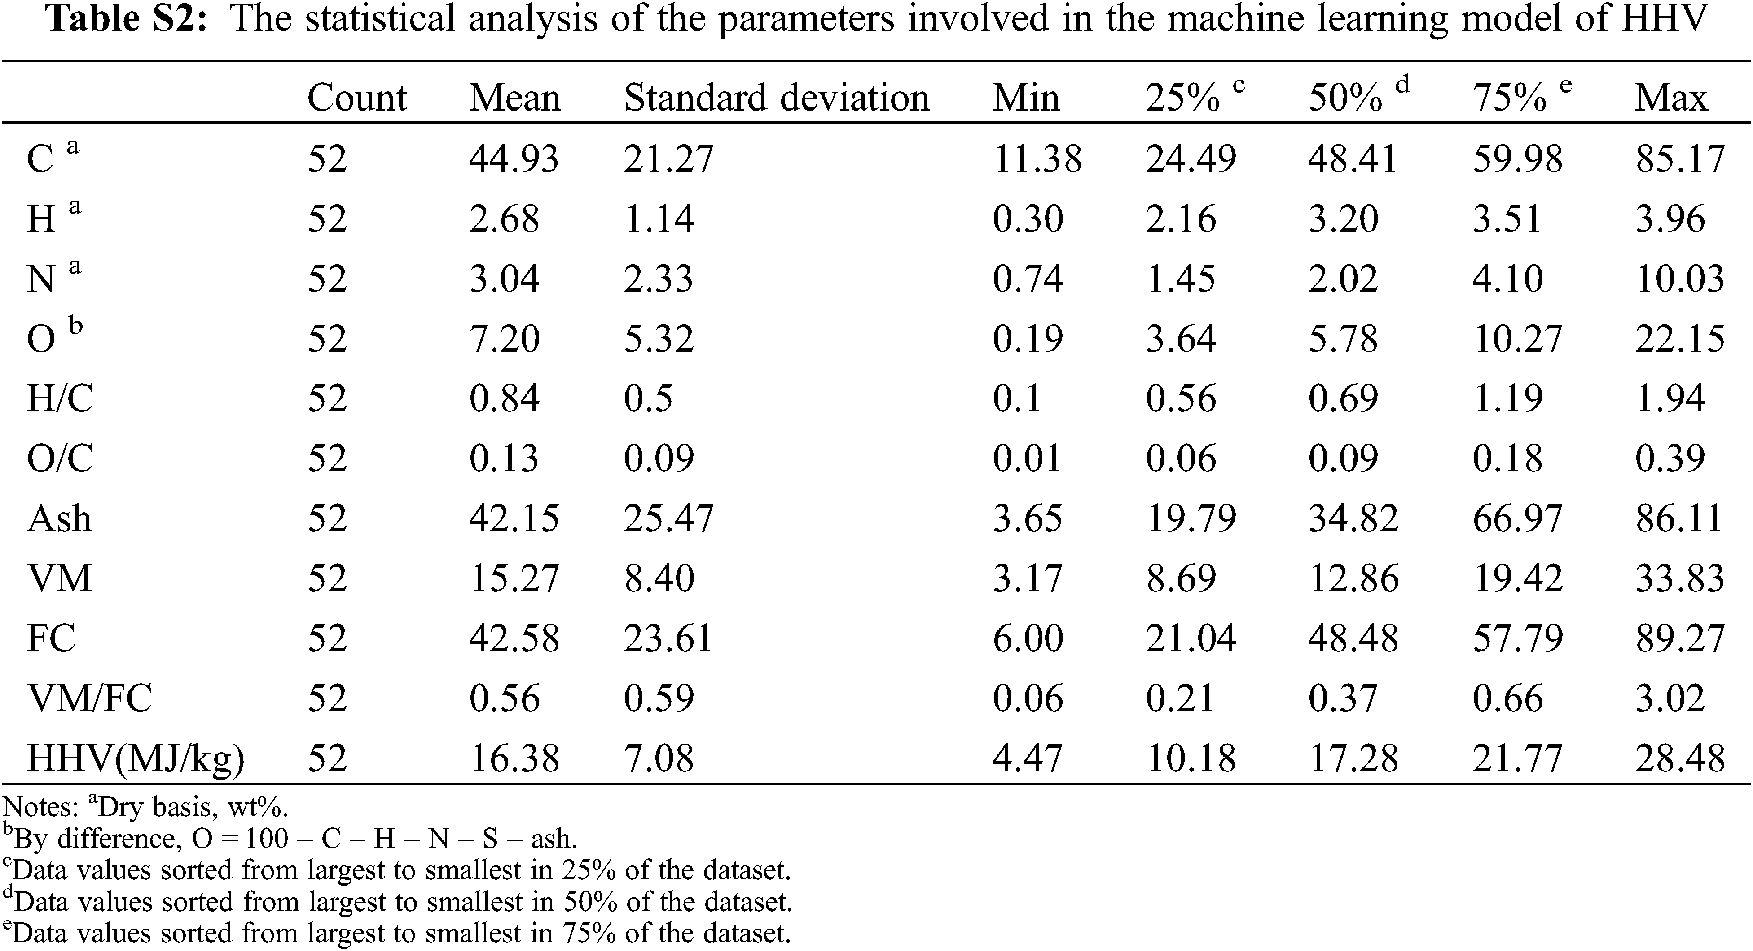
Biochar is the pyrogenic carbonaceous material, and the formation of biochar is a process of continuous decomposition and recombination of macromolecules. With the rise of pyrolysis temperature, the category of biochar gradually evolved from transition char to turbostratic char [18], and the stability of biochar was also improved [19]. As shown in Fig. 1a, the yield of biochar decreases with the increase of pyrolysis temperature. Similar results were also verified by Zhao et al. [20] that pyrolysis temperature had a significant (p < 0.05) effect on the biochar yield. The co-pyrolysis of the biomass mixture could improve the yield of most biochar (compared to the theoretical yield calculated by considering no interaction between biomasses), it would provide a feasible scheme for enhancing the yield of biochar. In the data composed of ultimate analysis (Tables 1 and S1 in supporting information), biochars derived from PM at the 400°C∼ had lower C content than that of feedstocks, and the similar results could be found in the study of Gascó et al. [21] Biochar derived from PM may contain aromatic carbons that were difficult to burn during the ultimate analysis process, so its C results would be underestimated [22]. C was the main component of biochar, with the content ranged from 11.38% to 85.17%. The C content of biochar did not increase with the increase of pyrolysis temperature, which was different from the research results of using three lignin-like biomass [23]. A portion of the unstable C in biochar was converted to stable C during biochar formation, and the variation was not fixed due to the difference in the biomass composition [10,20]. O content ranked the second in most biochar samples with the mean values 7% (Fig. 2), which was related to the complex pyrolysis mechanism of biochar and the biochemical composition of each biomass. The loss of O and H was mainly due to breaking weak O bonds during biochar formation [24]. S was not detected in all samples, so the content of S of all samples below was recorded as 0. The O/C of all biochar was less than 0.4 (Fig. 1b), meaning the half-life of these biochars O/C ≤ 0.6 can exceed 100 years [25]. The greater stable biochar would have the more favorable storage and transport advantages in its use as fuel.

Figure 1: (a) The yield of biochar produced from six biomass and their mixtures. (b) The Van Krevelen diagram of biochars. (c) Triangle plot of proximate analysis of biochars. The numbers behind the different colored squares in the illustration represented the maximum pyrolysis temperature of biochar. (d) The Pearson correlations between the indicators and HHV values. The blue and red circles represent the positive and negative correlation, respectively. The label meant biomass: rice straw (RS), pig manure (PM), soybean straw (SS), wood sawdust (WD), Chlorella Vulgaris (CL), and sewage sludge (SW). Mixed biomass was abbreviated by the two forms of biomass

Figure 2: Boxplot of variables related to biochar characteristics. Each data index in the dataset is evenly divided into quartiles based on 25% of each part

In the ternary diagram (Fig. 1c) of proximate analysis, with the rise of pyrolysis temperature, the FC of biochar increased to close to 100%, which is the same as our previous research results [10]. As expected, ash remains in the solid as the temperature increases despite the thermal decomposition of organic matter [27]. And VM showed a decrease with the increasing pyrolysis temperature. According to the proximate analysis (Fig. 2), FC and Ash were the two main components of the experimental data, with mean values of 43% and 42%, respectively. CL400 had the highest VM, which was 33.83%. The HHV of some biochar (Table S1) produced at low temperature was higher than that of biomass (Table 1), and the high energy density would be one of the advantages for its use as solid fuel. With the increase of pyrolysis temperature, the HHV of biochar would decrease. The average HHV of the 52 biochar samples was 16.38 MJ/kg, and the HHV value of more than half of the samples was greater than 16.38 MJ/kg (Fig. 2). The HHV of biochar derived from PM and SW was low, and the maximum HHV was only 12.86 MJ/kg (PM300), which was related to their high ash content. All biochars produced by the co-pyrolysis of WD and CL have the greater HHV than that of the theoretical value (average HHV of the biochar derived from two feedstocks at the same temperature). These results may be caused by the changes of the ash and indicated that WD and CL had a synergistic effect in the process of co-pyrolysis [28]. Biochar derived by biomass mixture had higher HHV than the theoretical HHV of mixed-biomass biochar, it would provide a feasible scheme for improving the HHV of biochar. Pyrolysis of biomass is a process in which char gradually evolves into pure carbon, and as this process occurs (the increase of temperature), the C–H, C–O, and O–H contained in the biochar were gradually eliminated, and the energy structure of the biochar becomes stable with aromatic resonances and π–π stacking of graphitic sheets [27].
The Pearson correlation coefficients (r) between the basic experimental data were shown in Fig. 1d. HHV had significant correlations (|r| > 0.36, p < 0.05) with other indicators except VM, and H/C. HHV positively (0.44 < r < 0.94, p < 0.05) correlated with FC, C, H, N and O and negatively (−0.96 < r < −0.48, p < 0.05) correlated with ash, VM/FC and H/C. These result were generally in consistent with the results of previous studies [29,30]. In particular, HHV was strongly (|r| > 0.9, p < 0.05) correlated with ash (r = −0.97, p < 0.05), FC (r = 0.90, p < 0.05), and C (r = 0.94, p < 0.05). Therefore, lower ash content and higher C and FC contents of biomass mean higher biochar HHV.
3.2 HHV Prediction Using Data of This Study
3.2.1 HHV Prediction by MLR Equations for Biomass and Coal Developed in Previous Studies
Many models had been developed in the published studies for the prediction of HHV of biomass and coal, among them the Dulong formula (HHVDulong = 0.3383 × C + 1.443 × H − 0.1804 × O + 0.0942 × S) and the Milne formula (HHVMilne = 0.3410 × C + 1.322 × H − 0.1200 × O − 0.1200 × N − 0.0153 × ash) were widely used for biomass and coal, respectively [31,32]. In this study, the HHV of biochar (test dataset, n = 11) was calculated according to the Dulong formula and the Milne formula, and the performance of predicted equations is shown in Figs. 3a and 3b. Most of the predicted data were within a 20% margin of error. There were some data predicted by the Dulong formula and the Milne formula mapped outside of the region, indicating whose error was more than 20%. Compared with the Dulong formula, the Milne formula introduced ash for HHV calculation, and its prediction performance (R2 = 0.9204, MAE = 0.1280, RMSE = 1.9053) was better than that of the Dulong formula (R2 = 0.8892, MAE = 0.1471, RMSE = 2.2483). Although the Milne formula predicted HHV by combining the results of ultimate analysis and proximate analysis, one of the predicted results of the Milne formula was still outside the prediction error range of 20%. The proximate analysis results from various test methods [22] and the thermal behaviors differences among biomass, coal, and biochar [33] may be the two major reasons for the inaccurate prediction results of these [34]. It is necessary to build the prediction model based on the basic property data to predict the biochar HHV more accurately.

Figure 3: Comparison between predicted and experimental HHV (n = 11, test dataset). (a) The predicted HHV calculated by the Dulong formula from the experimental test datasets, (b) the predicted HHV calculated by the Milne formula from the experimental test datasets. (c) The predicted HHV calculated by Eq. (5) from the experimental test datasets, (d) the predicted HHV calculated by Eq. (12) from the experimental test datasets data. The middle region of the solid lines of the three functions indicated 20% relative error
3.2.2 Biochar HHV Prediction by MLR Equations Constructed by This Study
As shown in Table 2, Eq. (5) had the best prediction performance (training R2 = 0.9327, training MAE = 0.0876, training RMSE = 1.8385) among the equations based on the training dataset containing ultimate and proximate compositions. And all equations (only except for Eq. (2), test R2 > 0.9191) had good generalization ability (test R2 > 0.9204) compare with that of the Dulong formula (test R2 = 0.8892) and the Milne formula (test R2 = 0.9204). Compared with the test predictive performance of Eq. (1) (test R2 = 0.9449, test MAE = 0.0812, test RMSE = 1.5848), the test predictive performance of Eq. (3) (test R2 = 0.9529, test MAE = 0.0779, test RMSE = 1.4656) with the additional introduction of H as a new independent variable was slightly improved. This was the same as the result of Pearson correlation analysis (Fig. 1d). H had a significantly weak correlation (r = 0.37, p < 0.05) with HHV. The range of the experimental proximate analysis data used as the independent variable for the development of models was 1.87% ≤ ash ≤ 86.11%, 3.17% ≤ VM ≤ 54.22%, and 6.00% ≤ FC ≤ 91.99% (Fig. 2), and these equations are based on the proximate analysis and had good training predictive performance (training R2 > 0.9). The equations (Eqs. (7)–(9), training R2 = 0.9215) had a stronger correlation than the monadic equation (Eq. (6), training R2 = 0.9207) of ash, which was the same as the conclusion of Qian et al. [5]. Eq. (10), which was composed of ash and VM/FC, had the good test predictive ability of HHV and was a little bit worse than Eq. (6) with lower test R2 (0.9694 vs. 0.9726), test MAE (0.0612 vs. 0.0587), and test RMSE (1.1816 vs. 1.1184). In Eqs. (11) and (12), ash, FC, and C were strongly correlated (|r| > 0.9, p < 0.05, Fig. 1d) with HHV, and their training predictive performance was not improved compared with Eqs. (5) and (10) (Table 2).

The comparison of Eqs. (5) and (12) between predicted and experimental HHV is shown in (Figs. 3c and 3d). The data points were basically distributed around the Y = X equation line, and there was no outlier outside 20% error. Though the same test MAE of 0.0741 was achieved from both Eqs. (5) and (12) had the higher test R2 and lower test RMSE than that of Eq. (5), expressing better prediction and generalization ability. It could also be seen that the generalization ability of each equation was different, and its prediction in the test dataset and the training dataset would also show different amplitude changes.
3.2.3 Biochar HHV Prediction by ML Models Constructed in This Study
The performance of the ML models was validated with the test dataset shown in Fig. 4. Obviously, the training data and test data were distributed around the Y = X function graph, which intuitively illustrated the accuracy and reliability of the three ML models. Compared with the MLR prediction models (Eqs. (5) and (10), Table 2), the predictive performance of the training dataset was enhanced when three ML algorithms were applied to predict the HHV of biochar. In the training dataset, the GBR model had great predictive ability (R2 = 1.00, MAE = 0.22, RMSE = 0.24). In the test dataset, the lower R2 (0.93) of the GBR model is found with MAE = 1.33, and RMSE = 1.74. The modeling process of the GBR algorithm based on boost theory was a process in which the prediction error decreases continuously. In the study of Samadi et al. [8], the prediction performance of HHV prediction model based on GBR (R2 = 0.93) algorithm was better than that of models of genetic programming (R2 = 0.90) and artificial neural networks (R12 = 0.88, R22 = 0.89). For the RF model, the training dataset also showed good predictive performance with R2 = 0.98, MAE = 0.68, and RMSE = 0.88. Moreover, the better performance of the RF model was found in the test dataset with R2 = 0.95, MAE = 1.12, RMSE = 1.45. The excellent prediction performance of the RF model was related to the principle of its algorithm. As a ML algorithm that adopted an integrated learning method, RF had better robustness in the learning process and a lower risk of overfitting and noisy data than other ensemble learning models [9].

Figure 4: Predicted data vs. the experimental data based on the GBR (a), RF (b), and SVM (c) models with training and test dataset. The red line in the graph is the plot of Y = X, and the points on the line meant that the predicted and experimental values were the same
In the analysis of relative importance (RI), FC, ash, and C were the main influencing features among studied factors (Fig. 5). FC (RI = 0.3569) and ash (RI = 0.4993) were the most important features in HHV prediction based on GBR and RF, respectively. This result was consistent with the Pearson correlation analysis results in Section 3.1. The C of biochar was the main component of its ultimate composition, and C was the main energy supplier in the combustion process of biochar. FC and ash content had highly positively correlation (r = 0.90, p < 0.05, Fig. 1d) and negatively correlation (r = −0.97, p < 0.05, Fig. 1d) with HHV, respectively. However, the relative importance of all features is not completely consistent with the results of Pearson correlation analysis, especially the contribution of O to HHV in the GBR (RI = 0.0013) and RF (RI = 0.0035) models. The reason may be that Pearson correlation is the linear correlation between each feature and HHV, while the relative importance obtained from the ML model included both the linear and nonlinear correlations [35]. In order to improve the generalization ability and broaden the applicability of the ML models, the wider range of dataset would help improve the model.

Figure 5: Relative contributions of each feature in GBR (a) and RF (b) algorithm
3.3 Optimized HHV Prediction by Additional Dataset
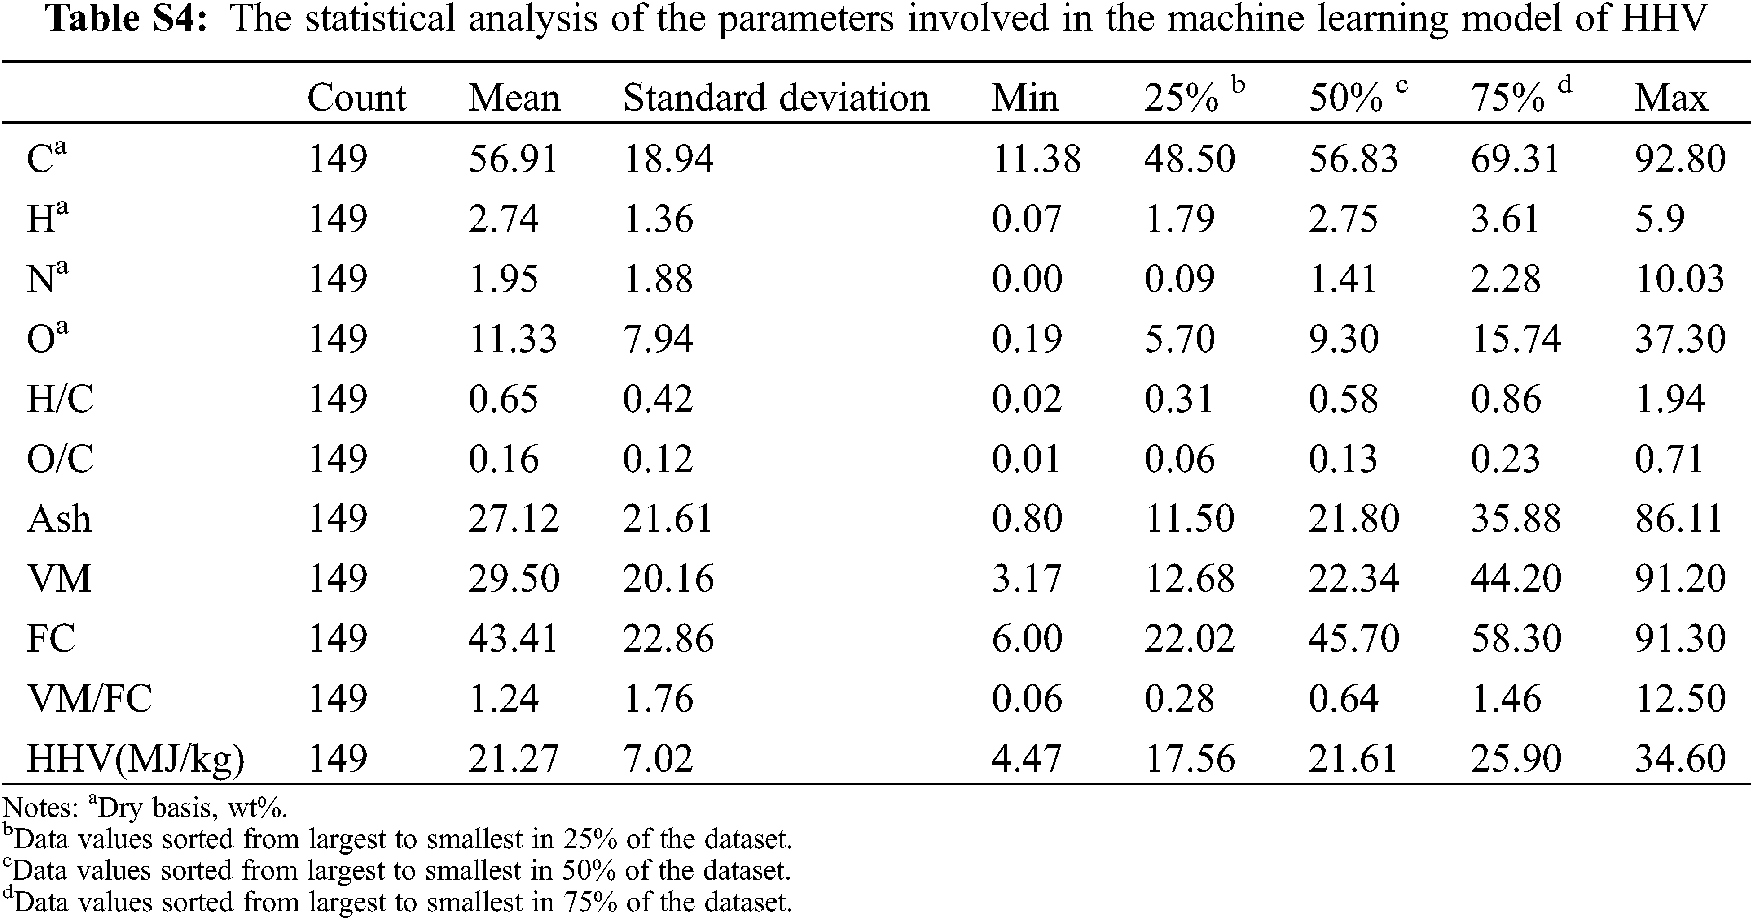
It is worth noting that ML algorithms are data-driven artificial intelligence algorithms. In the application of regression prediction, the more amount of input data, the broader the applicability of the model, and the better the prediction. In addition, the results of the properties of biochar from varied measuring instruments can lead to a significant difference. The models in Section 3.2 showed good prediction performance, but few numbers and small variation intervals of the dataset had been used to develop the models. These characteristics of the dataset would lead to the weak generalization ability of the models. Therefore, new models were built after introducing additional data points from previous studies. The statistical analysis of the new merged input dataset (n = 149) was shown in Fig. 6 and Table S3. Compared with the original statistical results previous dataset (n = 52, Fig. 2), the average HHV value increased to 21.27 MJ/kg, which is 4.89 MJ/kg higher. The variation interval expanded from 5–28 MJ/kg (Fig. 2) to 5–35 MJ/kg (Fig. 6).

Figure 6: Boxplot of variables related to biochar characteristics (n = 149). Each data index in the dataset is evenly divided into quartiles based on 25% of each part
The best prediction performance of the MLR models developed from the new dataset was not greatly improved compared with the equations in Table 2. The best equation was Eq. (15) with training R2= 0.9284, training MAE = 0.0654, and training RMSE = 1.8626 (Table 3), but the applicability of the model was reduced (test R2= 0.8749, test MAE = 0.0857, test RMSE = 2.5070) compared with equations in Table 2. However, for the ML models, the GBR, RF, and SVM models all showed good prediction performance, where training R2 was 1.00, 0.99, and 0.98 (Fig. 7), respectively. The GBR algorithm model had the best performance with R2 = 1.00, MAE = 0.32, and RMSE = 0.37 and R2 = 0.98, MAE = 0.83, and RMSE = 1.08 for the training and test datasets, respectively. Overall, the predictive performance of the expanded dataset (n = 149) was better than the original dataset (n = 52), which showed a sizeable dataset could generally represent better prediction performance. Fig. 8 described the relative contributions of each feature based on GBR and RF models. The relative importance of C in both GBR and RF models was the major one with values of 0.7087 and 0.8834, respectively. As a solid product of biomass by thermochemical conversion, the HHV of biochar mainly came from the combustion fracture of the C–H bond, and the contribution of O, H, and N to the HHV of biochar was limited [9]. Ash was the second most important feature of the two models, with values of 0.2343 and 0.0699, respectively. It also can be found that the third important feature of the two models was not the same, but the relative importance of the two features was lower than 0.02 that can be negligible.

Figure 7: Predicted data vs. the experimental data based on the GBR (a), RF (b), and SVM (c) models with the expanded dataset (n = 149). The red line in the graph was a plot of Y = X, and the points on the line meant that the predicted and experimental values were the same

Figure 8: Relative contributions of each feature in GBR (a) and RF (b) algorithm

Biochars produced from a wide range of biomass were characterized. Compared with biochar from the pyrolysis of individual biomass, biochar with higher yield and HHV could be obtained by the pyrolysis of biomass mixtures. Pyrolysis temperature and biomass mixture can affect the biochar yield and properties. Moreover, the MLR and ML prediction models were successfully developed to predict the HHV of biochar based on 52 experiment data. ML approaches showed better prediction ability (training R2 ≥ 0.96) of the biochar HHV prediction compared with MLR (training R2 < 0.94). The HHV of biochar (test dataset) was successfully predicted from the ultimate and proximate analysis with the GBR algorithm with R2 = 0.98, MAE = 0.83, RMSE = 1.08 trained by the experimental training dataset. The RF and SVM models also had a similarly good performance of the HHV prediction with the R2 = 0.97, MAE = 0.93, RMSE = 1.22 and R2 = 0.97, MAE = 0.93, RMSE = 1.23, respectively. With the expanded datasets (n = 149), the predictive performance of ML models was improved. Feature importance analysis showed that ash and C had the highest relative importance to HHV prediction, while VM and FC had limited effects. The ML approaches can predict the HHV of biochar with high accuracy and play an important role in the development of biochar fuel applications.
Funding Statement: The work was supported by the National Natural Science Foundation of China (No. 51808278) and the Science Foundation for Youths of Jiangxi Province, China (20192BAB213012). This research was also supported by the College Students’ Innovative Entrepreneurial Training Plan Program, China (No. 201910403049).
Conflicts of Interest: The authors declare that they have no conflicts of interest to report regarding the present study.
1. Shen, F., Xiong, X., Fu, J., Yang, J., Qiu, M. et al. (2020). Recent advances in mechanochemical production of chemicals and carbon materials from sustainable biomass resources. Renewable and Sustainable Energy Reviews, 130, 109944. DOI 10.1016/j.rser.2020.109944. [Google Scholar] [CrossRef]
2. Waqas, M., Aburiazaiza, A. S., Miandad, R., Rehan, M., Barakat, M. A. et al. (2018). Development of biochar as fuel and catalyst in energy recovery technologies. Journal of Cleaner Production, 188, 477–488. DOI 10.1016/j.jclepro.2018.04.017. [Google Scholar] [CrossRef]
3. Leng, L., Xiong, Q., Yang, L., Li, H., Zhou, Y. et al. (2021). An overview on engineering the surface area and porosity of biochar. Science of the Total Environment, 763, 144204. DOI 10.1016/j.scitotenv.2020.144204. [Google Scholar] [CrossRef]
4. Leng, L., Huang, H., Li, H., Li, J., Zhou, W. (2019). Biochar stability assessment methods: A review. Science of the Total Environment, 647, 210–222. DOI 10.1016/j.scitotenv.2018.07.402. [Google Scholar] [CrossRef]
5. Qian, C., Li, Q., Zhang, Z., Wang, X., Hu, J. et al. (2020). Prediction of higher heating values of biochar from proximate and ultimate analysis. Fuel, 265, 116925. DOI 10.1016/j.fuel.2019.116925. [Google Scholar] [CrossRef]
6. Vargas-Moreno, J. M., Callejón-Ferre, A. J., Pérez-Alonso, J., Velázquez-Martí, B. (2012). A review of the mathematical models for predicting the heating value of biomass materials. Renewable and Sustainable Energy Reviews, 16(5), 3065–3083. DOI 10.1016/j.rser.2012.02.054. [Google Scholar] [CrossRef]
7. Mateus, M. M., Bordado, J. M., Galhano dos Santos, R. (2021). Estimation of higher heating value (HHV) of bio-oils from thermochemical liquefaction by linear correlation. Fuel, 302, 121149. DOI 10.1016/j.fuel.2021.121149. [Google Scholar] [CrossRef]
8. Samadi, S. H., Ghobadian, B., Nosrati, M. (2021). Prediction of higher heating value of biomass materials based on proximate analysis using gradient boosted regression trees method. Energy Sources, Part A: Recovery, Utilization and Environmental Effects, 43(6), 672–681. DOI 10.1080/15567036.2019.1630521. [Google Scholar] [CrossRef]
9. Xing, J., Luo, K., Wang, H., Gao, Z., Fan, J. (2019). A comprehensive study on estimating higher heating value of biomass from proximate and ultimate analysis with machine learning approaches. Energy, 188, 116077. DOI 10.1016/j.energy.2019.116077. [Google Scholar] [CrossRef]
10. Chen, J., Wang, P., Ding, L., Yu, T., Leng, S. et al. (2021). The comparison study of multiple biochar stability assessment methods. Journal of Analytical and Applied Pyrolysis, 156, 105070. DOI 10.1016/j.jaap.2021.105070. [Google Scholar] [CrossRef]
11. CS, P. (2008). Determination of calorific value of coal. Chinese Standard No. GB/T 213-2008. General Administration of Quality Supervision, Inspection and Quarantine of the People’s Republic of China and Standardization Administration of the People’s Republic of China. http://openstd.samr.gov.cn/bzgk/gb/newGbInfo?hcno=8FF3EA84987B3B87C3A2E5922D41AC2D. [Google Scholar]
12. Zhu, X., Wan, Z., Tsang, D. C. W., He, M., Hou, D. et al. (2021). Machine learning for the selection of carbon-based materials for tetracycline and sulfamethoxazole adsorption. Chemical Engineering Journal, 406, 126782. DOI 10.1016/j.cej.2020.126782. [Google Scholar] [CrossRef]
13. Onsree, T., Tippayawong, N. (2021). Machine learning application to predict yields of solid products from biomass torrefaction. Renewable Energy, 167, 425–432. DOI 10.1016/j.renene.2020.11.099. [Google Scholar] [CrossRef]
14. Zhu, X., Li, Y., Wang, X. (2019). Machine learning prediction of biochar yield and carbon contents in biochar based on biomass characteristics and pyrolysis conditions. Bioresource Technology, 288, 121527. DOI 10.1016/j.biortech.2019.121527. [Google Scholar] [CrossRef]
15. Li, J., Pan, L., Suvarna, M., Tong, Y. W., Wang, X. (2020). Fuel properties of hydrochar and pyrochar: Prediction and exploration with machine learning. Applied Energy, 269, 115166. DOI 10.1016/j.apenergy.2020.115166. [Google Scholar] [CrossRef]
16. Li, J., Zhang, W., Liu, T., Yang, L., Li, H. et al. (2021). Machine learning aided bio-oil production with high energy recovery and low nitrogen content from hydrothermal liquefaction of biomass with experiment verification. Chemical Engineering Journal, 425, 130649. DOI 10.1016/j.cej.2021.130649. [Google Scholar] [CrossRef]
17. Shen, J., Zhu, S., Liu, X., Zhang, H., Tan, J. (2010). The prediction of elemental composition of biomass based on proximate analysis. Energy Conversion and Management, 51(5), 983–987. DOI 10.1016/j.enconman.2009.11.039. [Google Scholar] [CrossRef]
18. Keiluweit, M., Nico, P. S., Johnson, M. G., Kleber, M. (2010). Dynamic molecular structure of plant biomass-derived black carbon (biochar). Environmental Science & Technology, 44(4), 1247–1253. DOI 10.1021/es9031419. [Google Scholar] [CrossRef]
19. Chen, D., Yu, X., Song, C., Pang, X., Huang, J. et al. (2016). Effect of pyrolysis temperature on the chemical oxidation stability of bamboo biochar. Bioresource Technology, 218, 1303–1306. DOI 10.1016/j.biortech.2016.07.112. [Google Scholar] [CrossRef]
20. Zhao, B., O’Connor, D., Zhang, J., Peng, T., Shen, Z. et al. (2018). Effect of pyrolysis temperature, heating rate, and residence time on rapeseed stem derived biochar. Journal of Cleaner Production, 174, 977–987. DOI 10.1016/j.jclepro.2017.11.013. [Google Scholar] [CrossRef]
21. Gascó, G., Paz-Ferreiro, J., Álvarez, M. L., Saa, A., Méndez, A. (2018). Biochars and hydrochars prepared by pyrolysis and hydrothermal carbonisation of pig manure. Waste Management, 79, 395–403. DOI 10.1016/j.wasman.2018.08.015. [Google Scholar] [CrossRef]
22. Singh, B., Camps-Arbestain, M., Lehmann, J. (2017). Biochar: A guide to analytical methods. Australian: CSIRO Publishing. [Google Scholar]
23. Suliman, W., Harsh, J. B., Abu-Lail, N. I., Fortuna, A. M., Dallmeyer, I. et al. (2016). Influence of feedstock source and pyrolysis temperature on biochar bulk and surface properties. Biomass and Bioenergy, 84, 37–48. DOI 10.1016/j.biombioe.2015.11.010. [Google Scholar] [CrossRef]
24. Demirbas, A. (2004). Effects of temperature and particle size on bio-char yield from pyrolysis of agricultural residues. Journal of Analytical and Applied Pyrolysis, 72(2), 243–248. DOI 10.1016/j.jaap.2004.07.003. [Google Scholar] [CrossRef]
25. Spokas, K. A. (2010). Review of the stability of biochar in soils: Predictability of O:C molar ratios. Carbon Management, 1(2), 289–303. DOI 10.4155/cmt.10.32. [Google Scholar] [CrossRef]
26. Xu, S., Chen, J., Peng, H., Leng, S., Li, H. et al. (2021). Effect of biomass type and pyrolysis temperature on nitrogen in biochar, and the comparison with hydrochar. Fuel, 291, 120128. DOI 10.1016/j.fuel.2021.120128. [Google Scholar] [CrossRef]
27. Ronsse, F., van Hecke, S., Dickinson, D., Prins, W. (2013). Production and characterization of slow pyrolysis biochar: Influence of feedstock type and pyrolysis conditions. GCB Bioenergy, 5(2), 104–115. DOI 10.1111/gcbb.12018. [Google Scholar] [CrossRef]
28. Fakayode, O. A., Aboagarib, E. A. A., Zhou, C., Ma, H. (2020). Co-pyrolysis of lignocellulosic and macroalgae biomasses for the production of biochar–A review. Bioresource Technology, 297, 122408. DOI 10.1016/j.biortech.2019.122408. [Google Scholar] [CrossRef]
29. Setyawati, W., Damanhuri, E., Lestari, P., Dewi, K. (2015). Correlation equation to predict HHV of tropical peat based on its ultimate analyses. Procedia Engineering, 125, 298–303. DOI 10.1016/j.proeng.2015.11.048. [Google Scholar] [CrossRef]
30. Choi, H. L., Sudiarto, S. I. A., Renggaman, A. (2014). Prediction of livestock manure and mixture higher heating value based on fundamental analysis. Fuel, 116, 772–780. DOI 10.1016/j.fuel.2013.08.064. [Google Scholar] [CrossRef]
31. Vhathvarothai, N., James, N., Qiming, J. Y. (2014). An investigation of thermal behaviour of biomass and coal during copyrolysis using thermogravimetric analysis. International Journal of Energy Research, 38, 1145–1154. DOI 10.1002/er.3120. [Google Scholar] [CrossRef]
32. Channiwala, S. A., Parikh, P. P. (2002). A unified correlation for estimating HHV of solid, liquid and gaseous fuels. Fuel, 81 (8), 1051–1063. DOI 10.1016/S0016-2361(01)00131-4. [Google Scholar] [CrossRef]
33. Liu, Z., Balasubramanian, R. (2013). A comparison of thermal behaviors of raw biomass, pyrolytic biochar and their blends with lignite. Bioresource Technology, 146, 371–378. DOI 10.1016/j.biortech.2013.07.072. [Google Scholar] [CrossRef]
34. Liu, W. J., Jiang, H., Yu, H. Q. (2019). Emerging applications of biochar-based materials for energy storage and conversion. Energy and Environmental Science, 12(6), 1751–1779. DOI 10.1039/C9EE00206E. [Google Scholar] [CrossRef]
35. Panapitiya, G., Avendano-Franco, G., Ren, P., Wen, X., Li, Y. et al. (2018). Machine-learning prediction of CO adsorption in thiolated, Ag-alloyed Au nanoclusters. Journal of the American Chemical Society, 140(50), 17508–17514. DOI 10.1021/jacs.8b08800. [Google Scholar] [CrossRef]
Appendix
References
1. Crombie, K., Mašek, O. (2015). Pyrolysis biochar systems, balance between bioenergy and carbon sequestration. GCB Bioenergy, 7(2), 349–361. DOI 10.1111/gcbb.12137.
2. Tag, A. T., Duman, G., Ucar, S., Yanik, J. (2016). Effects of feedstock type and pyrolysis temperature on potential applications of biochar. Journal of Analytical and Applied Pyrolysis, 120, 200–206. DOI 10.1016/j.jaap.2016.05.006.
3. Qian, C., Li, Q., Zhang, Z., Wang, X., Hu, J. et al. (2020). Prediction of higher heating values of biochar from proximate and ultimate analysis. Fuel, 265, 116925. DOI 10.1016/j.fuel.2019.116925.
4. Vieira, F. R., Romero Luna, C. M., Arce, G. L. A. F., Ávila, I. (2020). Optimization of slow pyrolysis process parameters using a fixed bed reactor for biochar yield from rice husk. Biomass and Bioenergy, 132, 105412. DOI 10.1016/j.biombioe.2019.105412.
5. Cantrell, K. B., Hunt, P. G., Uchimiya, M., Novak, J. M., Ro, K. S. (2012). Impact of pyrolysis temperature and manure source on physicochemical characteristics of biochar. Bioresource Technology, 107, 419–428. DOI 10.1016/j.biortech.2011.11.084.
 | This work is licensed under a Creative Commons Attribution 4.0 International License, which permits unrestricted use, distribution, and reproduction in any medium, provided the original work is properly cited. |