| Journal of Renewable Materials |
DOI: 10.32604/jrm.2022.018919
ARTICLE
Comparative Study on Various Strength Parameters of Structural Elements Made from Cross-Laminated Timber
1School of Engineering Technology–Civil, Melbourne Polytechnic, Epping, 3076, Australia
2School of Engineering, Deakin University, Waurn Ponds, 3216, Australia
*Corresponding Author: Mahmud Ashraf. Email: mahmud.ashraf@deakin.edu.au
Received: 24 August 2021; Accepted: 30 September 2021
Abstract: Cross laminated timber (CLT) is an innovative and environment friendly engineered timber product with superior structural performance. CLT offers strong resistance against both in-plane and out-of-plane loading. Hence, it is widely used as floors, roofs or wall elements. Considerable experimental research on CLT under various loading conditions has been done in the recent past. This article presents a comprehensive review of various design methods to determine basic mechanical properties such as tension, compression and rolling shear strength of CLT with primary focus on Norway spruce. All relevant experimental data available from existing literature were collated and consequently been used to evaluate the performance of various methods to design CLT structures. The comparison revealed that different methods show considerable variance in predicting the capacity of CLT panels due to the variation in timber species, which affects the corresponding mechanical properties of the lamella. In addition to species, rolling shear properties can also vary considerably depending on the type of experimental technique used for testing. A predictive model has also been proposed to correlate rolling shear strength obtained from shear analogy method to that obtained using planar shear.
Keywords: Cross-laminated timber; mass timber; mechanical strength; rolling shear strength; planar shear test; short span bending test
Cross-laminated timber (CLT) is a promising engineered wood product that has gained popularity for mid- and high-rise construction. CLT is produced by stacking wood lamellae as cross-layers and joining these layers using structural adhesives. Cross-layering offers strength under both in- and out-of-plane loading, making it a viable application for walls and floors [1]. CLT offers mechanical properties similar to concrete while weighing only 1/5th of the same sized concrete element. The construction time is significantly reduced due to ease in handling, transportation and less labour requirement. Although CLT originated in Europe, it emerged as a popular construction material in other parts of the world, such as Canada, USA, Japan, China, New Zealand and Australia.
In recent years, extensive research has been conducted on the bending strength properties of CLT panels due its superior performance as a bending element [1–5]. Timber is an orthotropic material with significantly higher mechanical strength along the fibre direction. Nevertheless, strength perpendicular to the grain also requires attention for various structural applications, and numerical simulations to conduct reliable parametric studies. Brandner et al. [6] explored the tensile properties perpendicular to the grain of Norway spruce species, whereas Ido et al. [7] investigated the tensile properties parallel to the grain of Japanese Sugi. A state-of-the-art review on compressive properties perpendicular to the grain was conducted by Brandner [8]. This research which focused on compressive properties of CLTs perpendicular to the grain explored testing, mechanical properties and design methods. Similar effort for compressive strength properties parallel to the grain is lacking in literature, with a handful of research conducted by Oh et al. [9] on Korean larch species, He et al. [3] on Canadian hemlock no. 2 lumber and Pang et al. [10] on Korean larch and pine species. Although these tests cover some Asian and Canadian timber species, test results on European species are absent in literature. Again, a unified approach to establish the design methodology for CLT compression parallel to grain was not attempted through these studies. Rolling shear (RS) is another critical failure mode for CLT and has been investigated by several researchers. Aicher et al. [11] investigated RS modulus and strength for Beech made 3-ply CLT samples by two plate shear tests and short span flexure tests. Two plate shear tests were conducted on four different sawing patterns: flat-sawn, semi-quarter sawn, quarter sawn and with pith. Among these, the semi-quarter sawn sample showed the highest RS strength. Zhou et al. [12] conducted planar shear tests and short span bending tests on black spruce made CLT specimen. Based on RS properties and shear analogy theory, the deflection of the panels under centre point loading was predicted. Li [13] conducted modified planar shear tests along with short span bending tests on 3-layered NZ Radiata Pine CLT samples and concluded that the lamella thickness has great significance on RS strength. In addition to planar shear tests, torsional shear tests were also used by researchers to obtain RS strength of CLT specimen; Li et al. [14] reported that the torsional shear test yielded higher strengths compared to the short span bending test. These tests were performed on 5-layer and 3-layer Spruce-Pine-Fir CLT panels. Ehrhart et al. [15] tested 6 different European softwood and hardwood species for rolling shear strength and modulus using planar shear tests. The significance of various factors such as density, sawing pattern, distance of the sample from the pith and the ratio of lamella width (wl) and thickness (tl) on the RS properties such as RS strength and stiffness were evaluated. Research outcomes indicated that the ratio of lamella width-to-thickness (wl/tl) and sawing pattern are the key factors contributing to RS properties, with decrease in wl/tl resulting in reduction of the RS strength and modulus [11–15]. Finally, based on the critical analysis over 200 species, two separate empirical relationship were proposed for RS strength and modulus with respect to wl/tl.
To promote the use of CLT in construction, a unified design process is essential. Even though some research work exists on design equations for CLT strength [9,15,16], these rules were developed based on different principles which are either empirical or theoretical. Moreover, proposed design equations were either developed or verified based on the test results of the timber species considered in specific studies. General applicability of these rules for CLT panels produced from other species worldwide are yet to be verified.
Various governing bodies have also published several handbooks and manuals recently, e.g., CLT Handbook: Canadian version [17], US version [18], and the Swedish Handbook [19]. Apart from these handbooks, a few standards exist, which include Japanese Agricultural Standard for CLT [20], European standard DIN EN 16351 [21], APA Standards Committee [22]. These standards specify minimum requirements for CLTs to be used in construction, however a standardised design method is yet to be included, which is very much required to promote the use of CLT structures.
Current research work at School of Engineering in Deakin University, Australia, involves extensive experimental work on CLT specimens made from Norway spruce (Picea abies). Experimental tests were focussed to determine the tensile, compressive and rolling shear strengths of specimens made from CLT (not as single timber lamella). For the rolling shear strength test, two different test methods were implemented: planar shear test (PST) and out-of-plane short span bending tests (SSB). Furthermore, test results available in literature were extracted and collated along with results of the current program to evaluate the efficiency of the currently available design equations. All test evidence were carefully analysed to proposed design equations for predicting tensile and compressive strength of CLT panels. In addition, a predictive model has been proposed to correlate rolling shear strength obtained by shear analogy method and planar shear test.
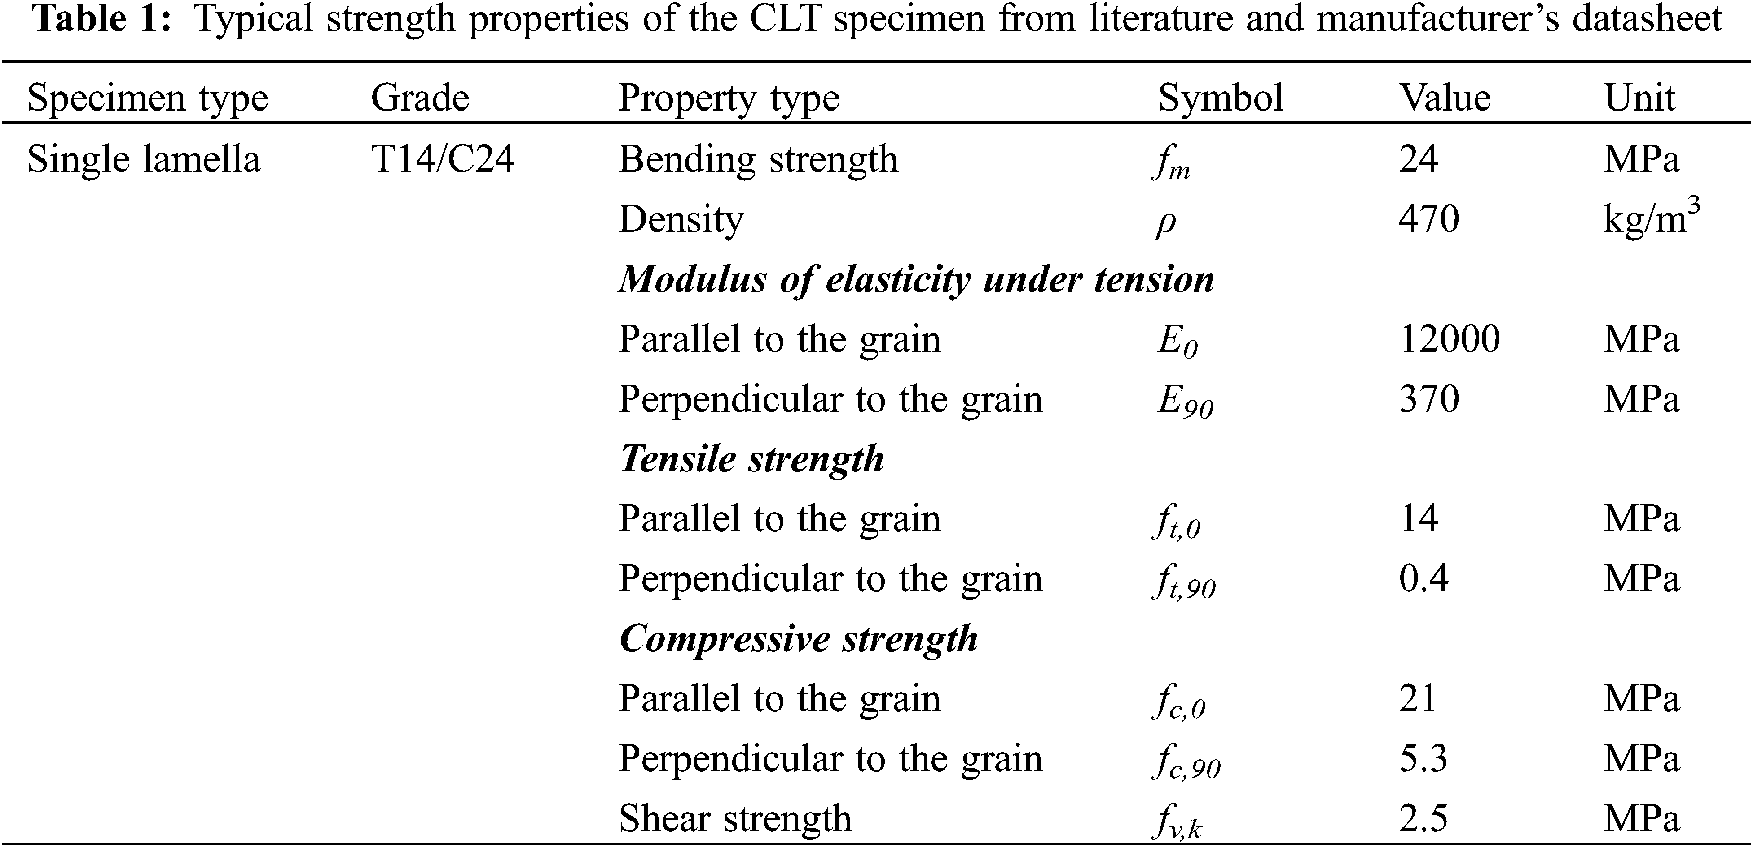
The CLT used for the experiments was made of Norway Spruce (Fig. 1). The dimensions of the CLT panels were 1500 × 1450 × 60 mm (i.e., Length × Width × Thickness) and the grade of each lamella was C24, as classified by Unterwieser et al. [16]. The CLT panels consist of three layers, each with a thickness of 20 mm resulting in a total thickness of 60 mm. The narrow face of the CLT was not bonded, whereas Polyurethane based adhesives were used for finger joints and surface bonding. The average moisture content of the CLT was 10%. Typical visual of the samples is presented in Fig. 1. Material properties relevant to the CLT specimen were retrieved from EN 338 [23] and presented in Table 1.
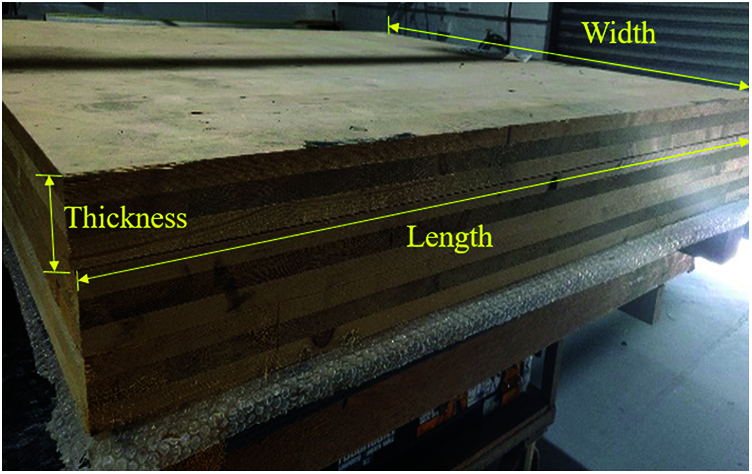
Figure 1: CLT samples produced from Norway spruce
2.2 Sample Dimensions and Test Methodology
Dog-bone samples were made for tensile testing (Fig. 2). Length, width and depth of the tensile region were 100, 20 and 60 mm, respectively. Four G250 steel plates were bolted to the gripping region of the tensile samples to avoid local crushing of the samples. The top and bottom side steel plates had a thickness of 25 and 5 mm, respectively. One 25 mm diameter bolt was used to connect the top side plates to apply the tensile load to the samples. Two 16 mm diameter bolts were used to connect the tensile sample and the side plates, as shown in Fig. 2 along with the dimensions of the test rig.
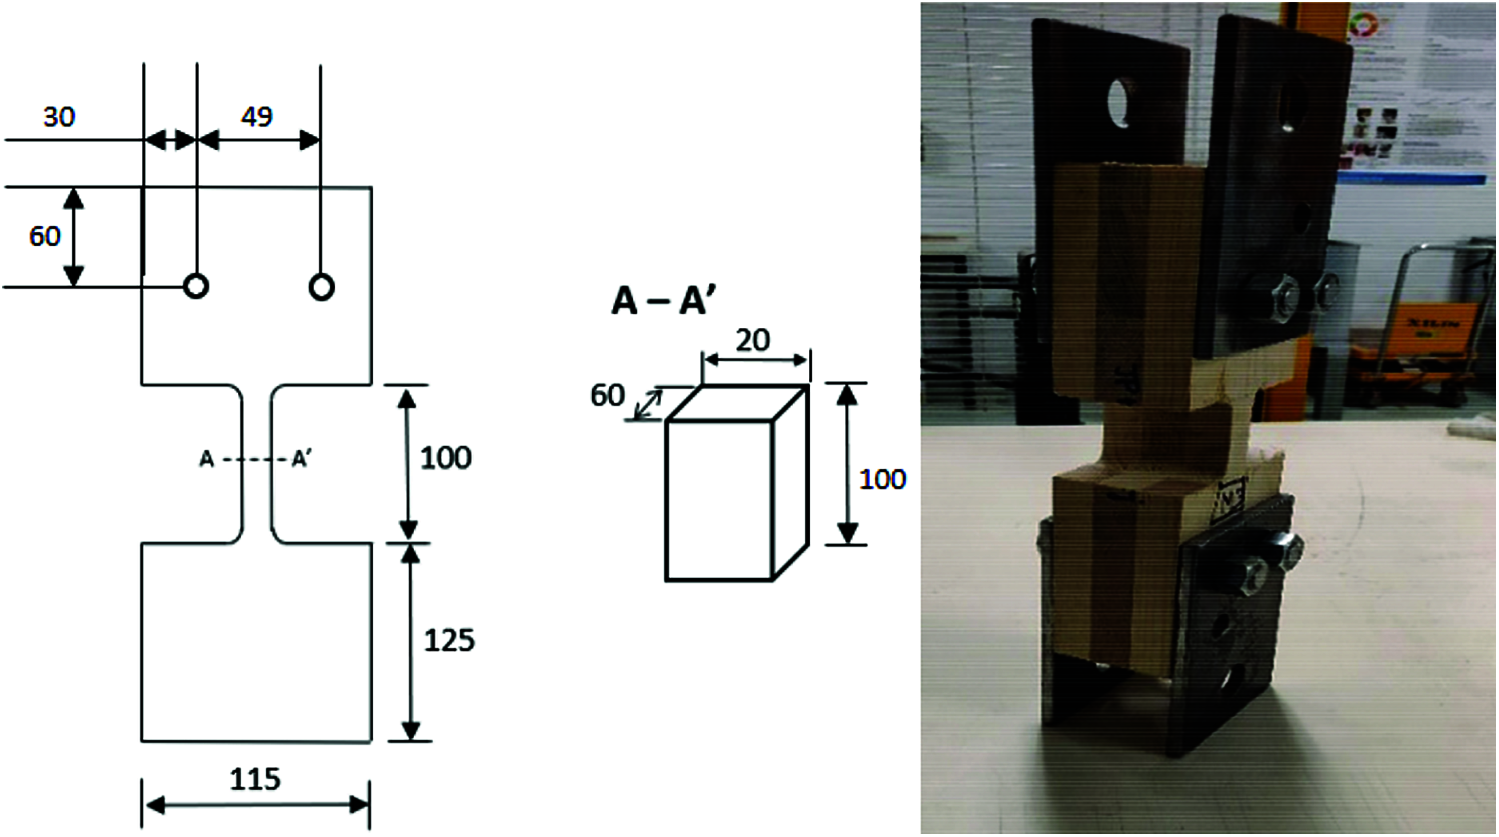
Figure 2: CLT samples prepared for tensile strength testing
When a CLT panel is subjected to two-way action, both the major and minor axes will carry the applied transverse loading. Accordingly, tensile capacity along both the major and minor axes were considered for this study. Fig. 3 shows the major and minor axis of a 3 layered CLT panel. As a part of the current test program, a total 5 specimens were tested for tensile strength. The loading was displacement controlled where the displacement rate was chosen according to ASTM D198 [24], as 1.5 mm/min.
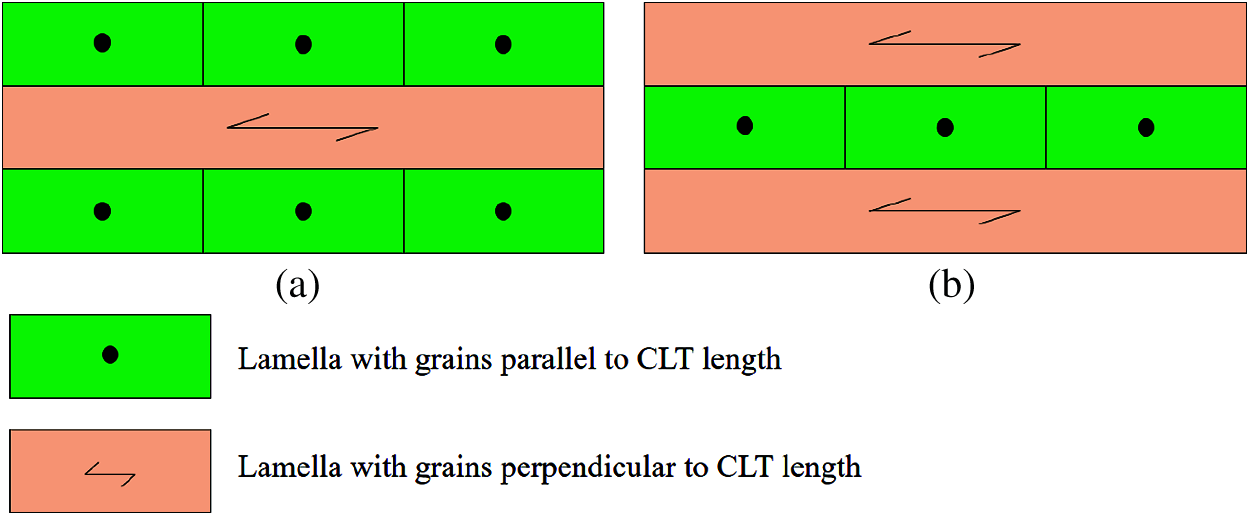
Figure 3: Axis orientation of CLT samples (a) Major and (b) Minor
For compressive strength testing, sample size was selected to be 200 × 100 × 60 mm, as shown in Fig. 4. Similar to the tensile specimens, for compressive strength samples were tested along both the major and minor axes. In this case, a total of 12 specimens were tested. As per AS/NZS 4063.1 [25], the sample should fail within 2–5 min from commencement. The test load rate was 0.824 kN/s, so that the sample fails within 3.5 min to comply with the standard requirements.
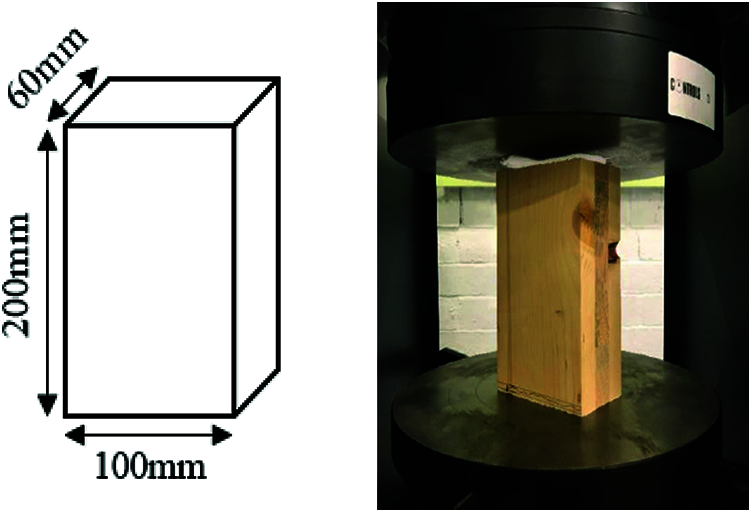
Figure 4: Test setup and sample dimensions for compressive strength experiment
Rolling shear is the shear capacity of timber in the perpendicular plane. Following the standards and literature available on CLT [12,13,21,24], two different setups-planar shear and out-of-plane short span bending, are used to determine rolling shear strengths.
The ideal setup for rolling shear determination is the planar shear method, commonly used for single timber boards. However, the planar shear test method requires a specific type of test setup and sample preparation. Unlike single layer boards or Glue-Laminated Timber (GLT), CLT panels typically contain odd number of layers, where the inner layer(s) are laid transversely to the panel length. Under 4-point bending, a beam specimen with shorter span endures high shear stress concentration within the support and load point on both sides. Failure initiated due to the shear stress concentration in the inner transverse layer can be utilized to determine the rolling shear capacity of the CLT panel. Thus, as an alternative to planar shear method, DIN EN 16351 [21] sets out the guideline to perform 4-point bending test for shorter span CLT panels to determine the rolling shear capacity. This alternative method is convenient to conduct with respect to planar shear test method, due to the similarity with bending capacity tests. Current test program conducts both planar shear test and short span bending tests to obtain rolling shear strength of the specimen. The following section contains further details on the test setup and procedures.
This test program followed the procedure suggested in DIN EN 16351 [21]. A total of 8 samples with dimensions of 240 (length) × 100 (width) × 60 (thickness) mm were prepared. The length of the samples was selected to meet the 14° inclination requirement based on DIN EN 16351, as shown in Fig. 5. To replicate rolling supports/friction free supports, Teflon sheets were used. The loading was displacement controlled and the rate was selected so that the experimental process was complete within 3–5 min; final displacement rate was considered as 0.48 mm/min.
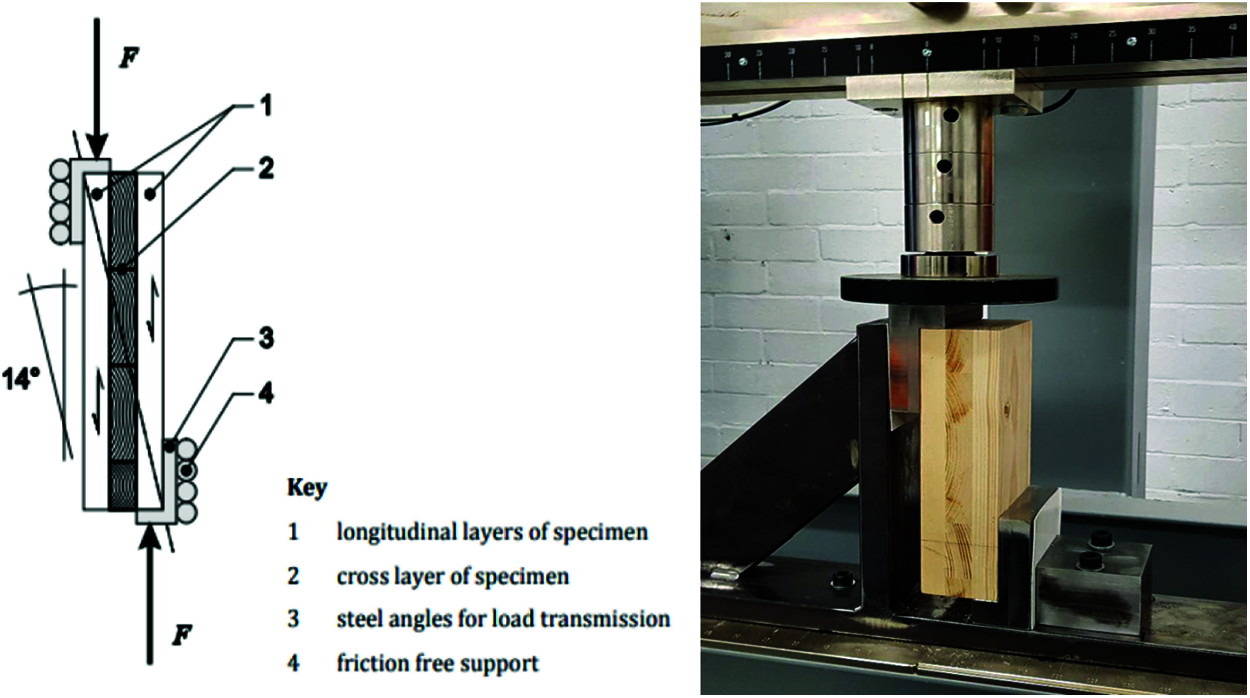
Figure 5: Test setup to determine rolling shear properties of CLT following planar shear experiment
The samples were prepared in such a way that failure occurs due to shear rather than bending (Fig. 6). It can be noted that the span-to-depth ratio of the sample normally determines whether shear or bending will govern. According to DIN EN 16351 [21], in order to ensure failing of CLT panel under shear, the total span length should be limited to 12 times the depth of the panel. Here, the depth of CLT equals the summation of the thickness of all layers. In the current test program, the span length was maintained as 7 times the depth of the CLT panel. Furthermore, the distance between the loading and the supports should be minimal to ensure that the initial failure would be due to shear. The minimum spacing in the shear zone should be lower or equal to 3 times the depth of the beam to ensure shear failure when subjected to out-of-plane loading. To accommodate the above-mentioned criterion, a shear span of 2.50 times the depth was selected. Accordingly, final dimensions of the samples were–525 (length) × 200 (width) × 60 (thickness) mm. The samples were tested under four-point bending, as shown in Figs. 6 and 7. The supporting bars and the loading pins were adjusted to have an even spacing of 150 mm. The test was force controlled and rate of loading was selected as 4.5 kN/min.
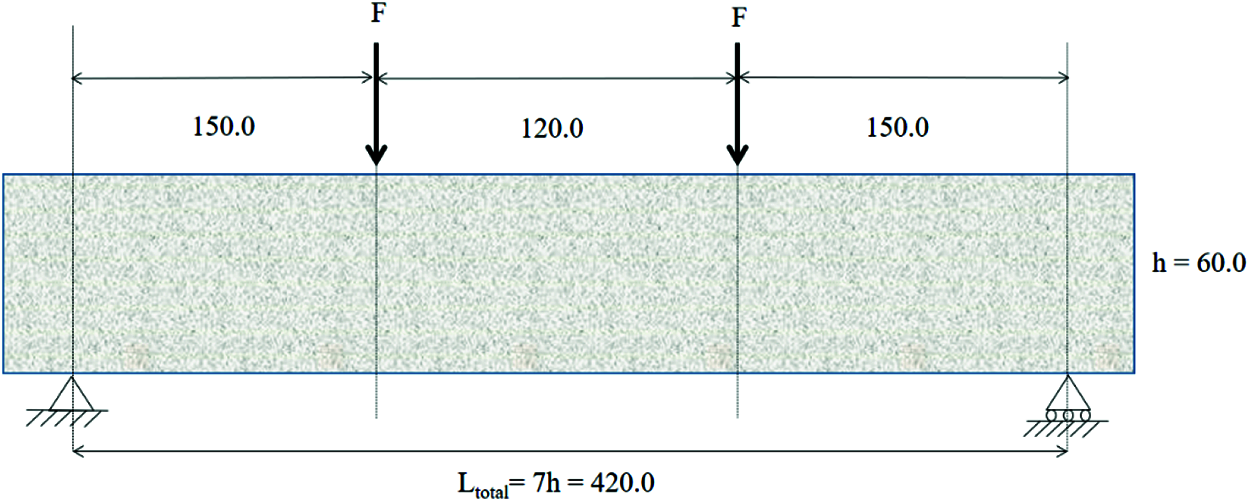
Figure 6: Four-point bending test setup for short span bending experiment
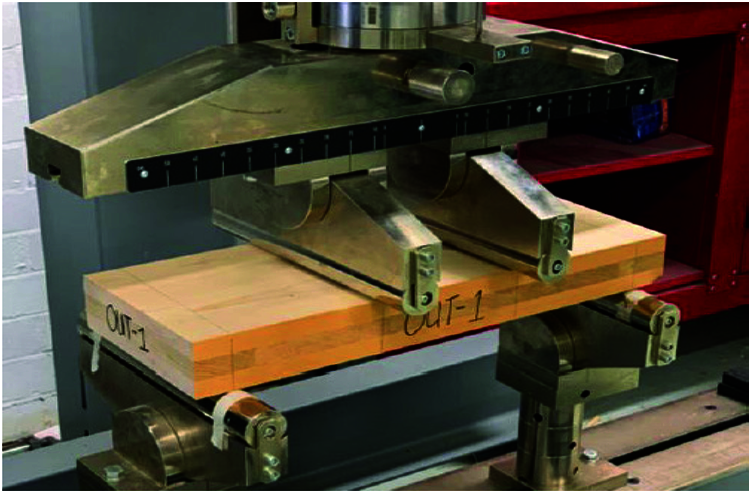
Figure 7: Test set up for short span bending test to determine shear properties
Rolling shear strength of any beam can be obtained from flexure theory, according to ASTM D198 [24]. For a beam specimen tested under four-point bending test setup, the maximum shear stress can be determined from Eq. (1), where τmax is the maximum shear stress, Fmax is the maximum load, and b and d are the width and depth of the section, respectively. In literature, there are three different methods which are widely used to calculate various strength parameters of CLT panels under a given load condition. These are mechanically jointed beam theory (modified Gamma method), shear analogy method and Timoshenko beam theory [17]. Bogensperger et al. [26] provided a detailed description on the development of each method, the related equations and worked example to determine various design parameters (i.e., maximum bending stress or maximum shear stress) under different load conditions. In this study, the rolling shear strengths will be calculated using these methods based on the load information obtained from short span bending tests. These theoretical methods for calculating the design utilised parameters obtained from Table 1. Consequently, strengths calculated from these methods will be compared with that obtained using basic equation stemming from flexure theory presented in Eq. (1).
In the current section, the results obtained from the experiments will be presented. Figs. 8–11 illustrate the strength vs. deformation curves and Table 2 shows the summary of all the results. The test types, total numbers of tests, mean strength (in MPa), corresponding CoV, and the 5th percentile value are provided. In order to account for the variability that exists in wood or timber based product in relation to any mechanical properties, the 5th percentile characteristic value is recommended to consider for design purpose as suggested by EN BS 14358 [27]. Therefore, along with the mean strength, corresponding 5th percentile values are also reported.
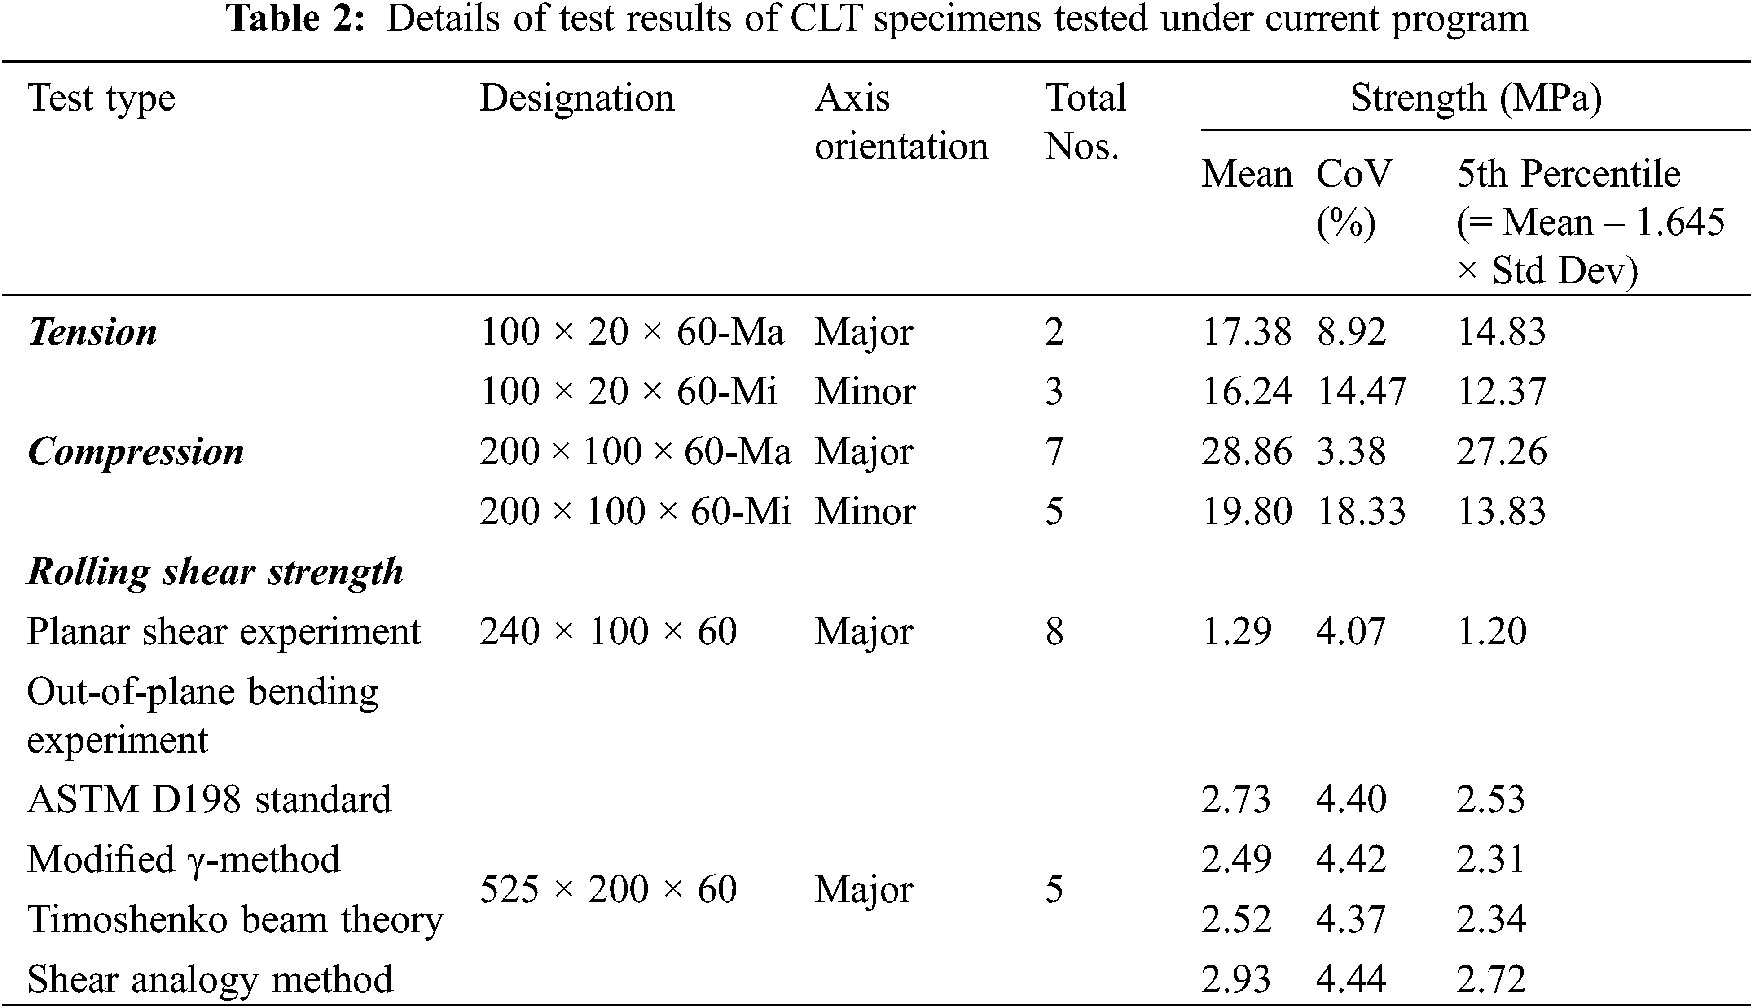
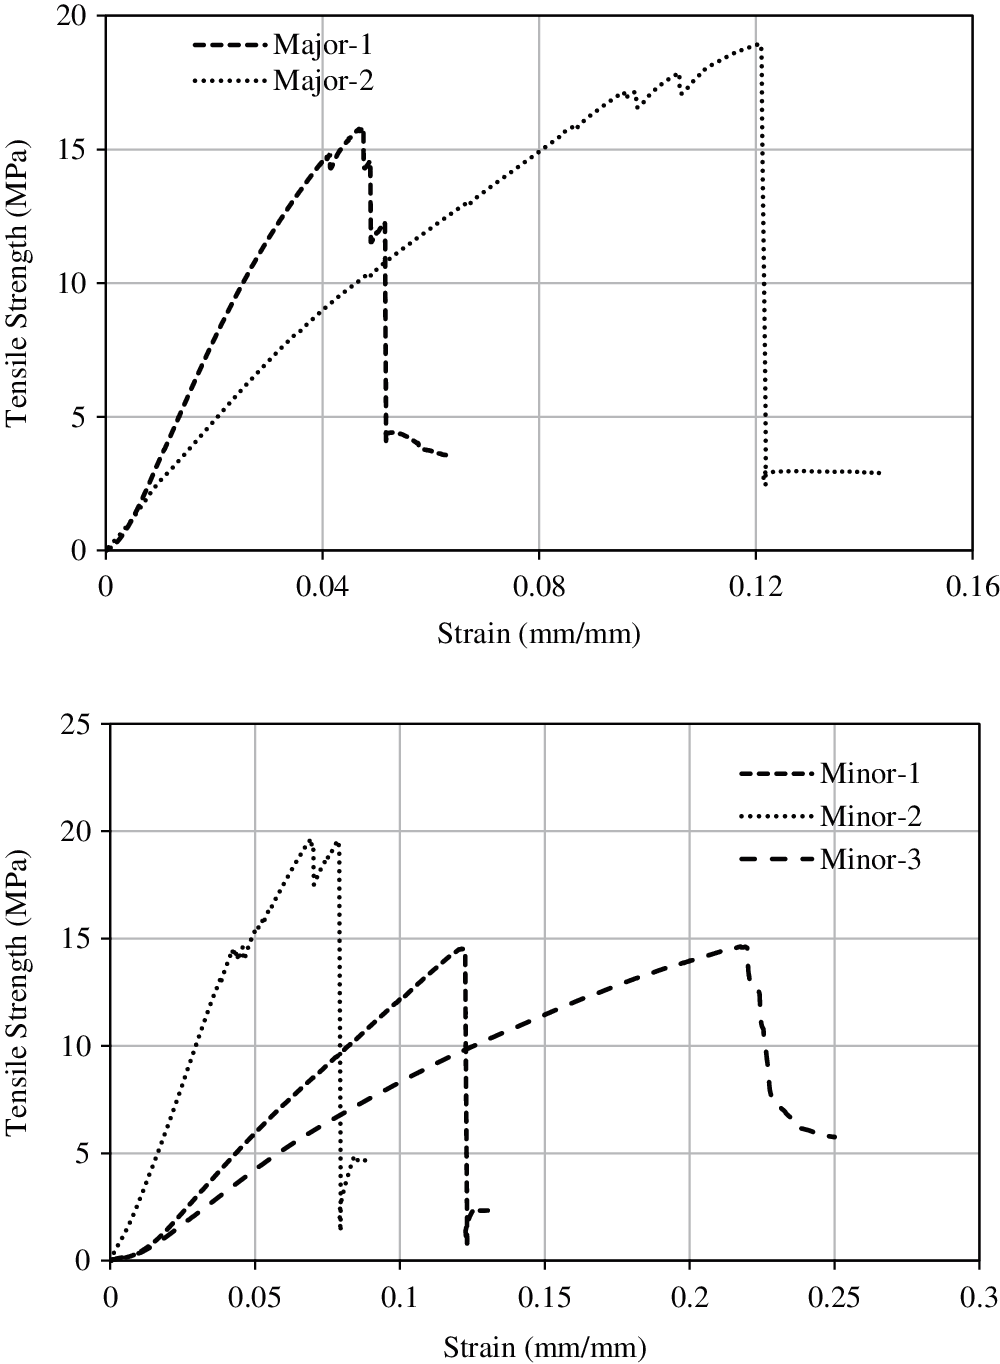
Figure 8: Tensile strength vs. deformation curves about major (top) and minor (bottom) axis CLT specimen
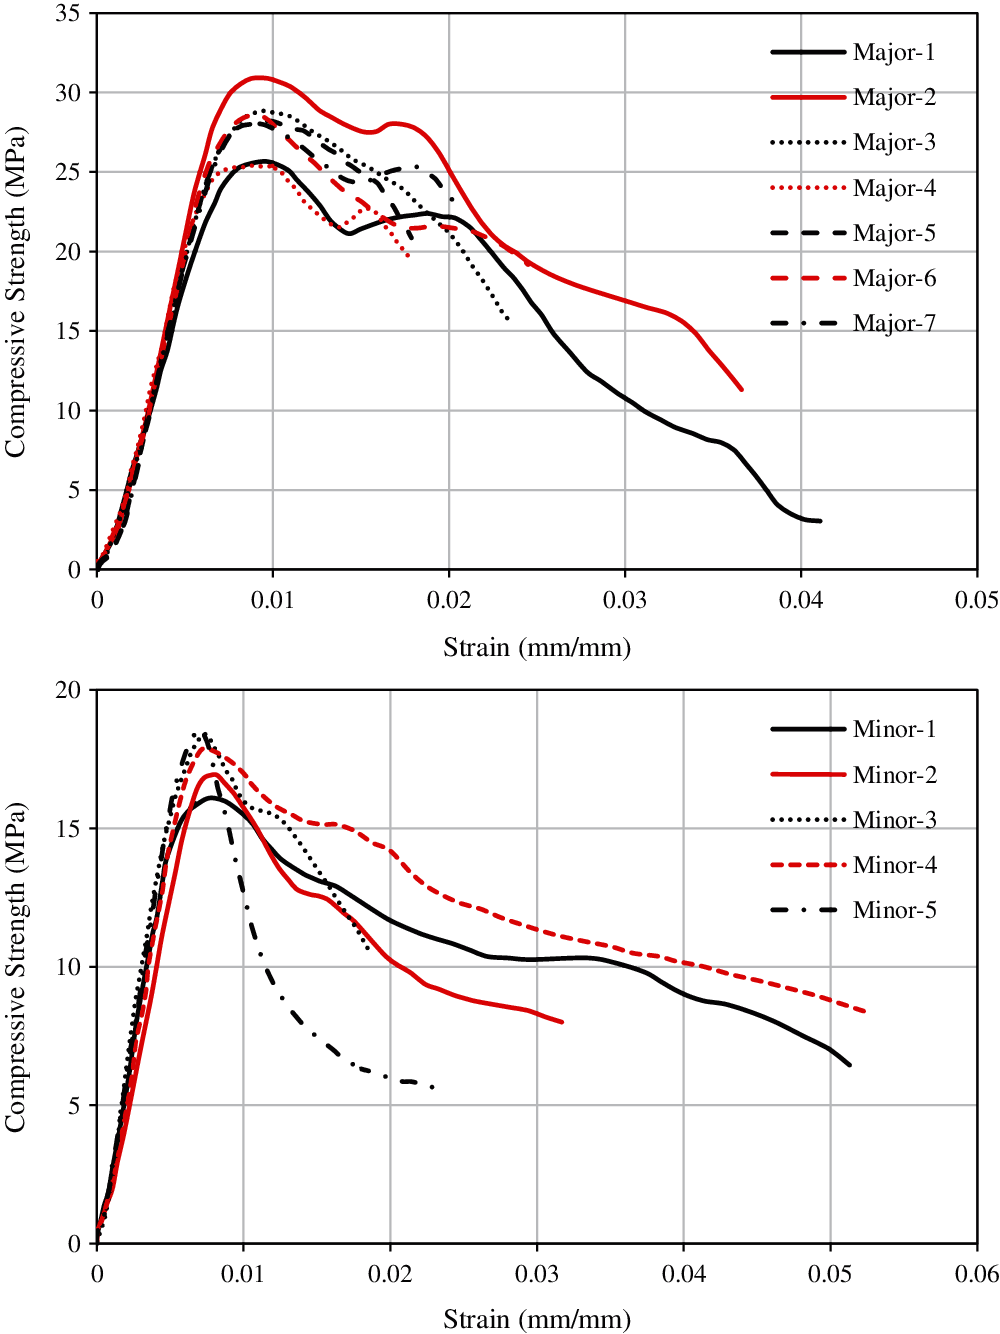
Figure 9: Compressive strength vs. strain curves about major (top) and minor (bottom) axis CLT specimen
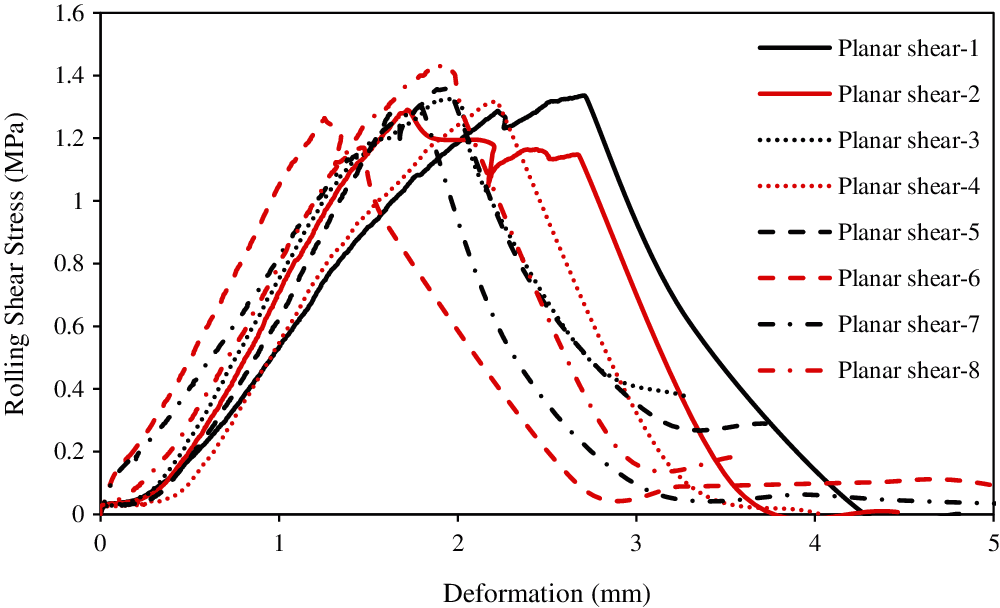
Figure 10: Rolling shear stress vs. deformation results from planar shear tests
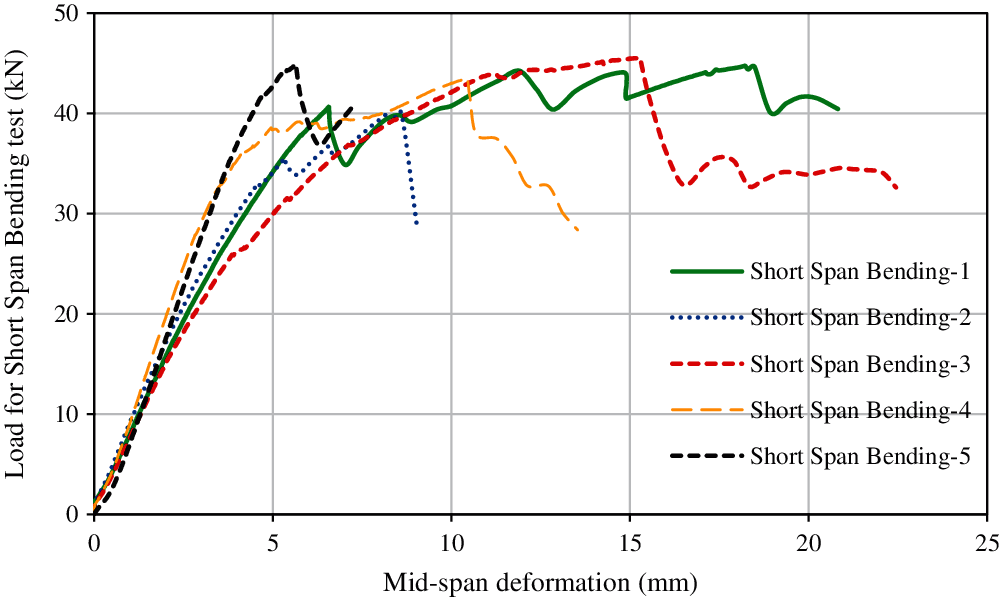
Figure 11: Load vs. deformation curves for short span bending tests on CLT specimen
Tension and compression tests were conducted along both major and minor axes. It should be noted that for major direction, two layers are carrying the applied loads parallel to the grain, while only one layer is carrying the applied load for minor orientation (since the tested samples were 3 layered CLT). Accordingly, for both cases of tension and compression, specimens tested along major axis orientation were stronger when compared to minor axis. From Table 2, it can be observed that this difference was approximately 6.56% for tensile strength and 31.39% for compressive strength. This observation is also demonstrated graphically in strength vs. deformation curves presented in Figs. 8 and 9 for tension and compression, respectively.
From Figs. 8 and 9 it can also be observed that the strength increase was gradual in all type of tests conducted. Once an ultimate strength is reached, significant sudden drop was observed in all tensile tests, whereas the drop was gradual in case of compression tests. As expected, timber behaves non-linearly under compression and exhibit brittle behaviour in tension.
The rolling shear stress-vs.-deformations obtained during PST are presented in Fig. 10. It can be observed that the rolling shear strength increases gradually with the increase of deformation. Upon reaching ultimate strength, it follows a gradual decreasing pattern. In addition to that, Fig. 11 presents the load-deformation behaviour obtained from SSB test. Maximum load capacity obtained from these load-deformation curves were used to calculate the rolling shear strength from the four different methods, as described in the previous section. Rolling shear strength calculated using SSB test data in conjunction with different theories and that from PST were presented in Table 2. Among the four different methods, modified γ-method produced the lowest shear strength of 2.49 MPa and shear analogy method provided the maximum shear strength of 2.93 MPa. It is evident from Table 2 that RS strength obtained using PST was low: 48.19% compared to modified γ-method and 55.97% lower compared to the shear analogy method. In the following sections, these test results will be compiled with additional experimental results from literature to evaluate existing prediction models.
In this section, various prediction models available in literature to calculate tension, compression and rolling shear strengths will be described, prior to the evaluation of their efficiency in the later sections. As reported by Brandner et al. [28], the prediction models to determine the mechanical properties of a CLT panel are based on two methods,
1) Mechanical properties of single sawn boards determined experimentally followed by the calculation of the properties of CLT panel and
2) Direct testing of CLT panels.
DIN EN 16351 [21] sets out the rules for determination of CLT strengths based on the experiments. This guideline delineates the standard methods of sample preparation, loading arrangements and finally the equations for determining the mechanical properties of CLT panel from test results. However, it should be recognised that from a structural designer’s points of view, testing CLT specimens prior to each design project is cumbersome and impractical. Consequently, the first method is deemed more suitable for structural design. Firstly, a brief discussion on existing strength prediction models will be presented, followed by a performance evaluation of each model against existing test results reported in literature.
3.1 Unterwieser et al. [16] for Bending, Tensile and Compressive Strength
Unterwieser et al. [16] proposed a set of equations to predict the tensile, compressive and bending properties of a CLT panel. These rules use the lamella strength to predict the CLT properties. While developing the equations for CLT, bearing models for glue-laminated timber (GLT) were adopted by incorporating various coefficients that account for the GLT-to-CLT transformation. For this development, Norway Spruce of grade T14 was considered. Depending on the variation of the lamella’s tensile strength, CLT grades were divided into two distinctive grades as CLT 24 h and CLT 28 h. It should be noted that these models were developed based on a specific type of 5-layered CLT beam panel, with panel cross-section of 600 × 150 mm (width × depth) and lamella cross-section of 150 × 30 mm (width × depth). These equations are provided through Eqs. (2)–(6) for CLT class 24 h.
The Eqs. (2) and (3) are related to the bending strength of CLT. Here, fm,CLT,k = bending strength of CLT specimen, ft,0,l,k = tensile strength of an individual lamella loaded parallel to the grain, ksys,m = coefficient to account for the system effect due to parallel actions of lamellae in long direction, kCLT/GLT = coefficient considering the difference in homogenisation effects between CLT and GLT, kh,CLT = depth factor equal to the depth factor of GLT which accounts for the use of panels with height difference with respect to the reference cross-section, and lastly, kCV_t = factor allowing for the coefficient of variation in strength of the base material–CV[ft,0,l].
The Eqs. (4) and (5) are related to the tensile strength of a CLT panel, where, ft,0,CLT,net,k is the tensile strength of CLT specimen and ksys,t,0 is the factor to account for system factor allowing conversion between bending and tensile strength. ksys,t,0 is dependent on the arrangement of the layup considering the number of lamellae N running in longitudinal direction (parallel to grain).
Two different proposals were suggested to determine the compression strength of a CLT panel. Firstly, the compression strength fc,0,CLT,net,k can be considered equal to the bending strength fm,CLT,k, as shown in Eq. (6). This was found to be a conservative estimation of compressive strength which is primarily used in the absence of significant experimental results to derive a relationship between the strength of lamella and compression strength of CLT. Additionally, compressive strength can also be obtained using the same equation used for GLT members, based on density = ρl,k and number of parallel-to-grain lamellae in the cross-sections = n (Eq. (7)).
3.2 Ido et al. [7] for Tensile Strength
Ido et al. [7] conducted tensile strength tests on CLT samples by varying the cross-sectional width and the number of lamellae. Based on the test results conducted on CLTs made from Japanese Sugi, a new equation was proposed (Eq. (8)). Here, ft,0,l,k = the tensile strength of a single lamella, Aactual = gross cross-sectional area and Atransformed = transformed area based on modulus of elasticity of lamellae in different layers.
Unlike Eq. (4), this proposal intends to account for the effect of using different strength lamellae in the CLT cross-section (heterogeneous layup). For CLT comprised of different graded laminas (i.e., strong lamella on the outer layers and weaker lamella in the inner layers), the tensile strength of the stronger lamella should be chosen as ft,0,l,k in Eq. (8). If the specimen is oriented about the minor axis, ft,0,l,k should be the tensile strength of the inner layers. The Atransformed can be calculated using Eq. (9) that considers the modulus of elasticity (MOE) values of different layers. In Eq. (9), i represents a single layer with parallel-to-grain lamella, n = the total layer number with parallel-to-grain lamella, Al,0,i = the gross-area of the ith layer, El,0,i = MOE of the ith layer and El,0,i-max = maximum MOE among all the parallel-to-grain layers.
3.3 Pang et al. [10] for Compressive Strength
Pang et al. [10] proposed a method to calculate the compressive load capacity of CLT specimens made from Korean larch and pine. They evaluated the effect of varying grade within the CLT cross-section. The proposal assumed that the deformation in each layer of the CLT cross-section is same. Thus, the load carrying capacity for all layers can be expressed using the capacity of one representative layer. The proposed formulation is given in Eq. (10), where, i–represents a parallel-to-grain lamella of interest which is assumed to initiate the failure, PCLT,i = load capacity at which the ith layer fails, n = the total lamella number with parallel-to-grain layers, j–represents a single lamella within parallel-to-grain layer, Al,0,j = the gross-area of the jth layer, El,0,j = MOE of the jth layer, Al,0,i = the gross-area of the ith layer, El,0,i = MOE of the ith layer and fc,0,l,i = compression strength of lamella in the ith layer. In this method, the design strength of the panel would be from the layer with maximum MOE, as that would yield the minimum load capacity using Eq. (10). Compressive strength can be determined using Eq. (11).
3.4 Ehrhart et al. [15] for Rolling Shear Strength and Modulus
For rolling shear properties, Ehrhart et al. [15] investigated CLT specimen produced from various European wood species under planar shear tests following [29]. Based on the experimental results, proposals were made for fr,CLT,k = rolling shear strength and Gr,CLT,mean = rolling shear modulus, and are presented in Eqs. (12) and (13), respectively. Both equations were expressed as a linear relationship of the ratio of wl = lamella width and tl = lamella thickness.
3.5 Comparison of Experimental Results with Strength Prediction Models
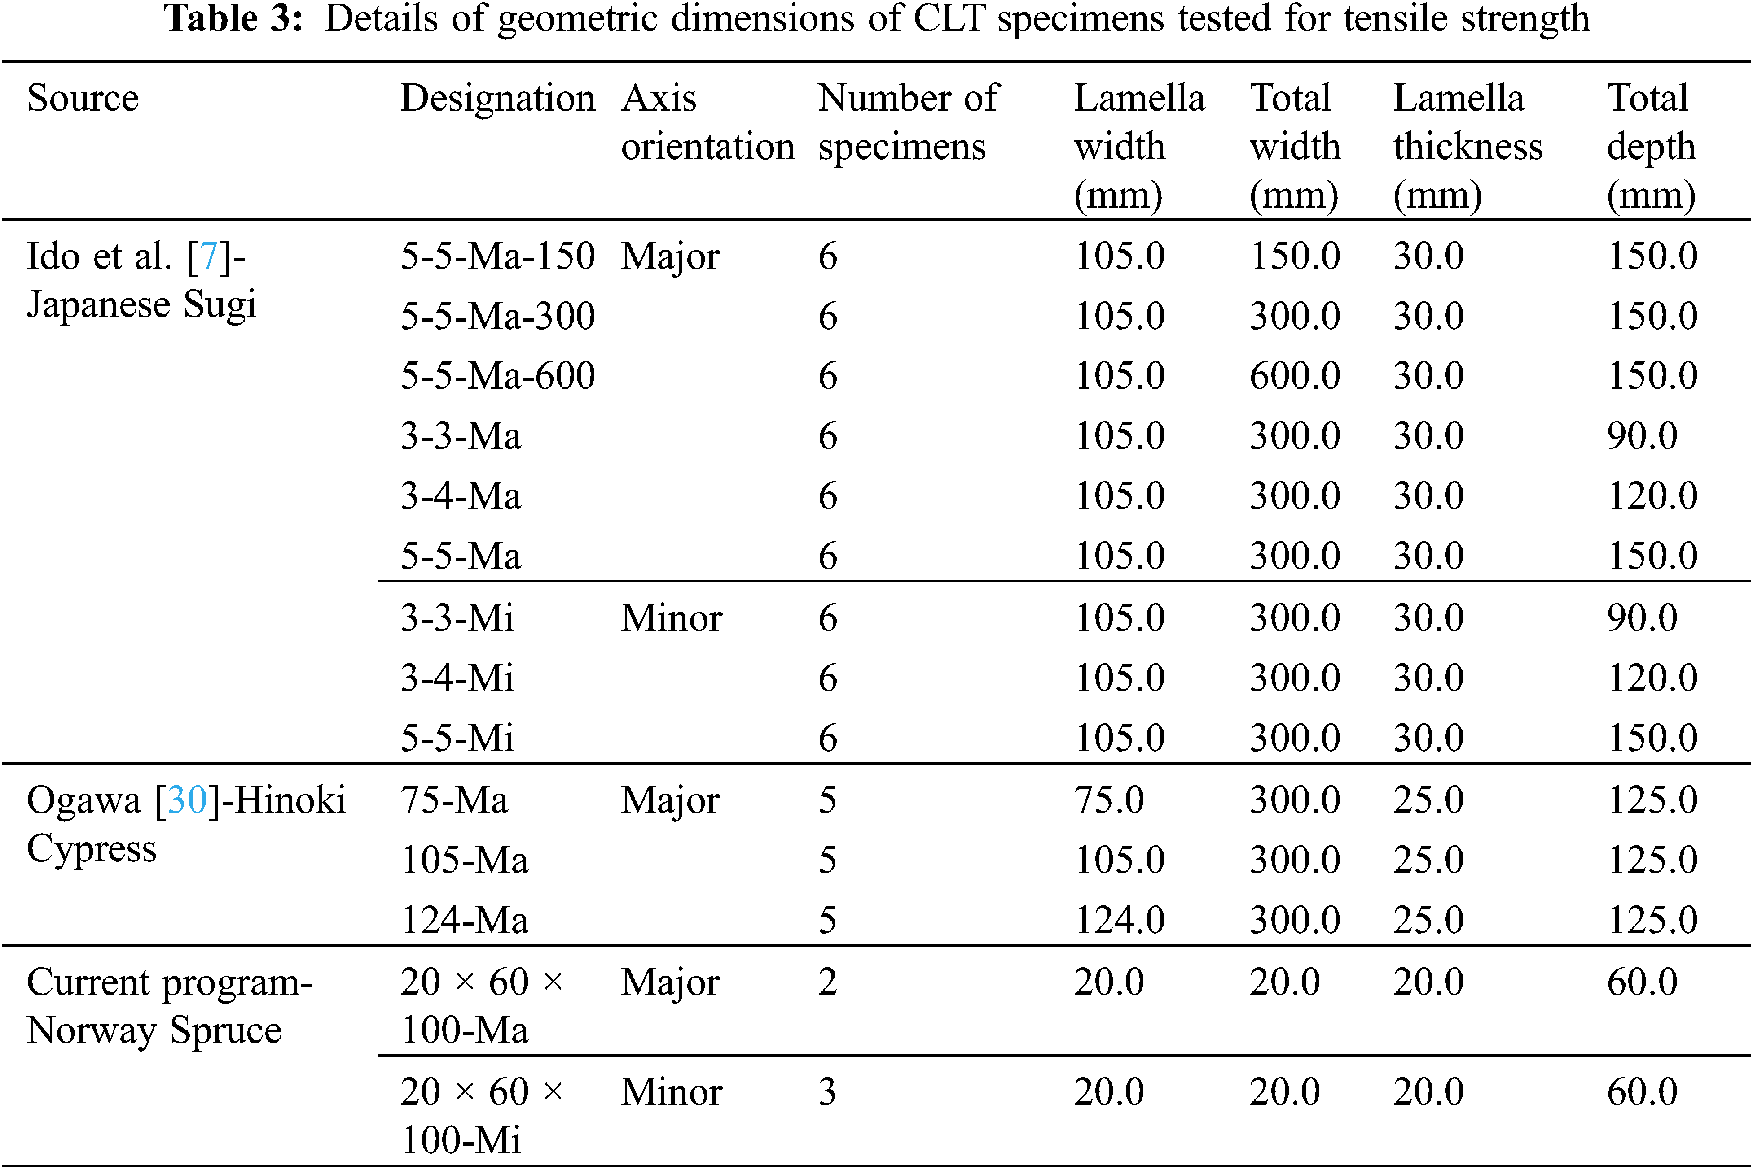
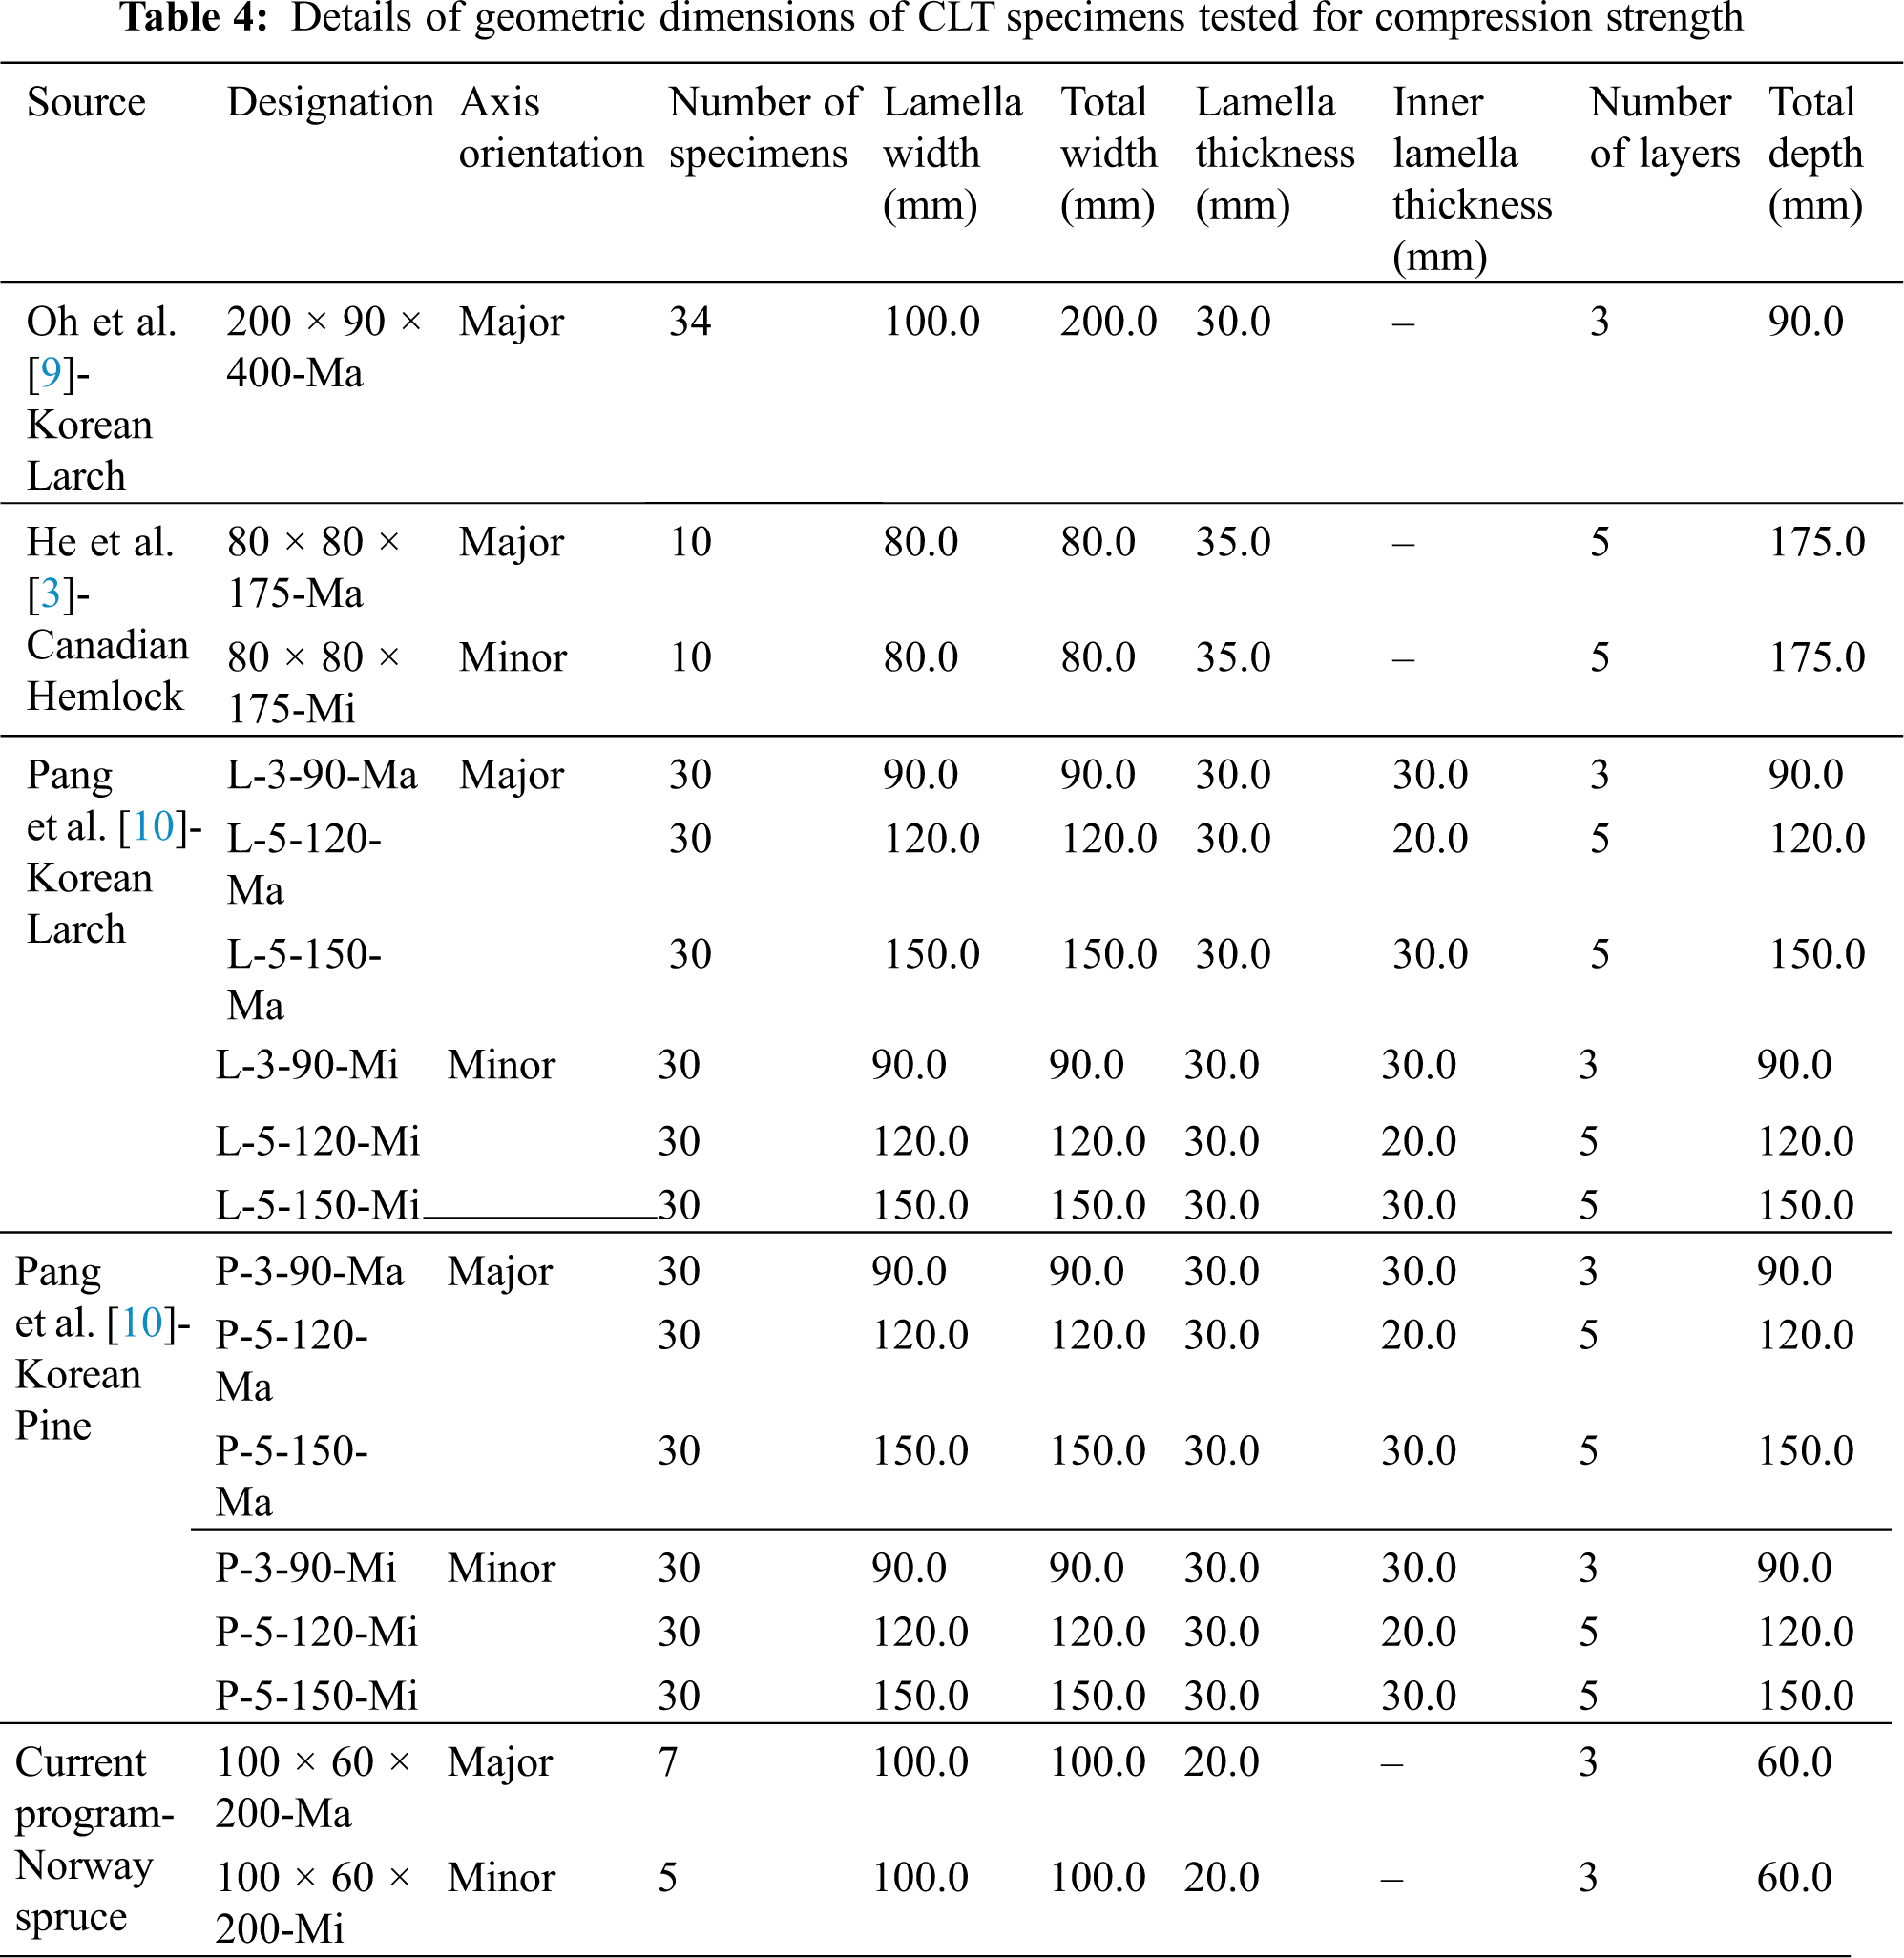
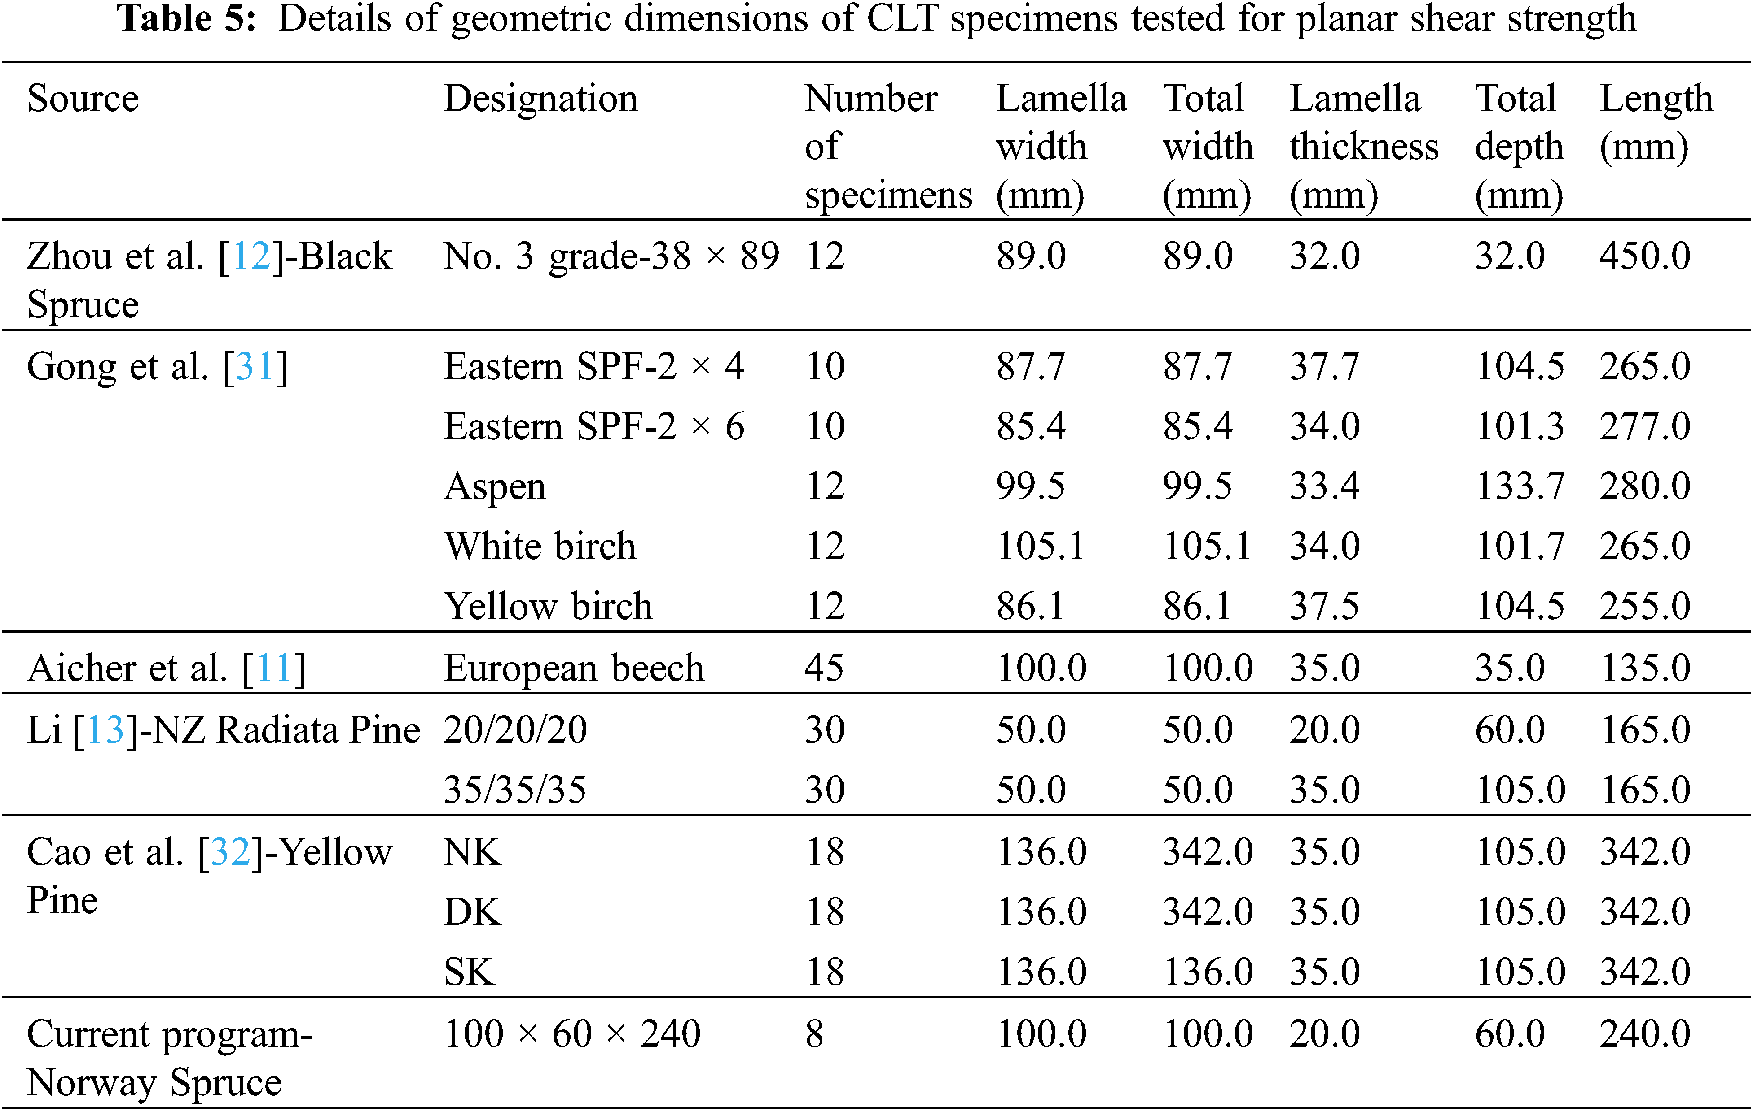
In this section, the experimental results obtained as part of the current study and results reported in literature will be used to evaluate the performance of the aforementioned prediction models. Tables 3–5 provide the geometry details for the specimens tested for tensile, compressive and rolling shear strength. The experimental results in terms of average tensile (ft,0,CLT,net,k-test), compressive (fc,0,CLT,net,k-test) and rolling shear (fr,CLT,k) strength are presented in Tables 6–12, along with the predictions using the equations presented in the previous section.
In Tables 6–12, the predicted tensile (ft,0,CLT,net,k-pred) and compressive strength (fc,0,CLT,net,k-pred) were compared against both the mean and 5th percentile strengths obtained from the experiments and literature. Commonly, the 5th percentile value of the experimental data set is used as the designed value as suggested in BS EN 14358 [27]. However, the 5th percentile strength was often missing in the reported literature. Thus, in those respective cases, the 5th percentile strength was determined assuming normal distribution of test data and based on the equations provided in BS EN 14358 [27] as shown in Table 2.
To evaluate the performance of the prediction models, the term Rpred/test was used, which is the ratio of the analytically calculated strength prediction to the strength obtained from experimental tests. To capture the overall prediction performance with a single term, the weighted average of all predictions was also considered, as shown in Eq. (14).
where, i = single test source, ni = number tests specimen within the ith source, Rpred/test,i = prediction-to-test strength for ith source and N = total test cases for that respective load condition (i.e., tensile, compressive or rolling shear strength).
Tensile strength predictions were evaluated for 74 test results of CLT specimens using the methods proposed by Unterwieser et al. [16] (Eq. (4)) and Ido et al. [7] (Eq. (8)). The original proposal given by Ido et al. [7] used the experimental lamella test results to predict CLT strengths rather than standard properties of lamella. Here, both experimental results and standard strength properties were used to evaluate the performance of this method. Tables 6–8 compare experimental and theoretical results proposed by Unterwieser et al. [16] and Ido et al. [7] (using experimental lamella test results and standard properties from code results, respectively).
The standard properties of Japanese Sugi [7] and Hinoki Cypress [30] were obtained from Japanese Agricultural Standard (JAS) for cross-laminated timber [20]. For the Japanese Sugi made CLTs, two different lamella grades were used–M60A in the outer layer, and M30A in the inner layer; while the Hinoki Cypress made CLTs constitute M120A graded lamella in the outer layer and M60A in the inner layer. No lamella tests were performed as part of the current study. Hence, lamella strength parameters are taken from manufacturer’s datasheet (Table 1).
While comparing among the various methods, it is observed that the Unterwieser et al. [16] method over-predicts the tensile strength in case of Asian species made CLTs, ranging from Rpred/test-mean = 1.05~2.07 and Rpred/test-05 = 1.22~2.15. However, this method performs quite accurately for current test results where CLTs were produced from European species (Norway Spruce) with Rpred/test-mean values of 0.85~0.86 and Rpred/test-05 = 0.92~0.96. Overall, the weighted average of Rpred/test-mean = 1.50 and for Rpred/test-05 = 1.67, reflects the overall conservative approach of this equation.
The second model, proposed by Ido et al. [7], performs satisfactorily for mean strengths, ranging between Rpred/test-mean = 0.92~1.11 for Asian species, when experimental lamella strengths were implemented. Besides, minimal over-prediction was observed for the 5th percentile strengths with Rpred/test-05 = 1.00~1.28. However, this method yielded very conservative results for Norway spruce. Nonetheless, weighted average for this method was observed to have improved, compared to Unterwieser et al. [16] method with values of Rpred/test-mean = 0.97 and Rpred/test-05 = 1.10. It can be noted here that if the standard lamella strength properties from codes are used in the Ido et al. [7] method, the overall prediction performance drops down to Rpred/test-mean = 0.60 and Rpred/test-05 = 0.68. Prediction performance of these three methods for Rpred/test-05 is depicted in Fig. 12.
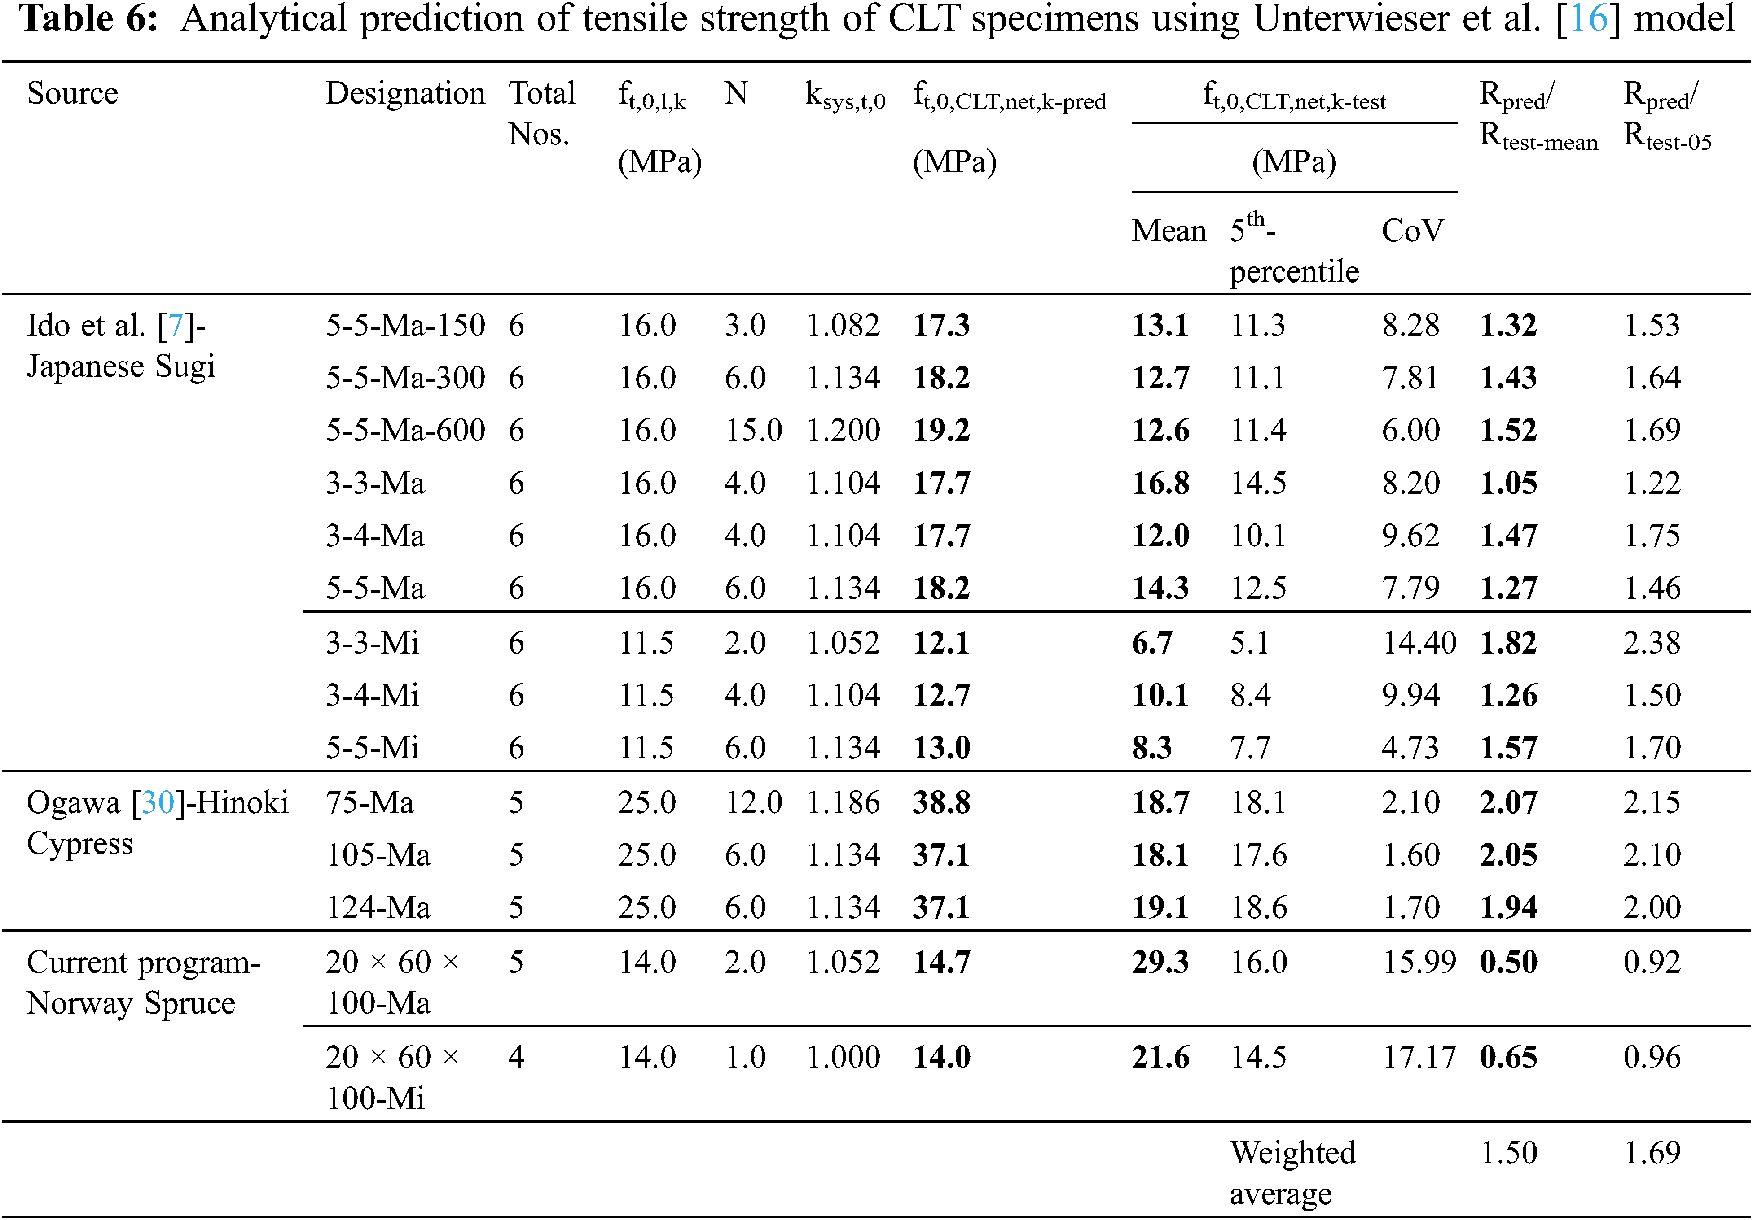
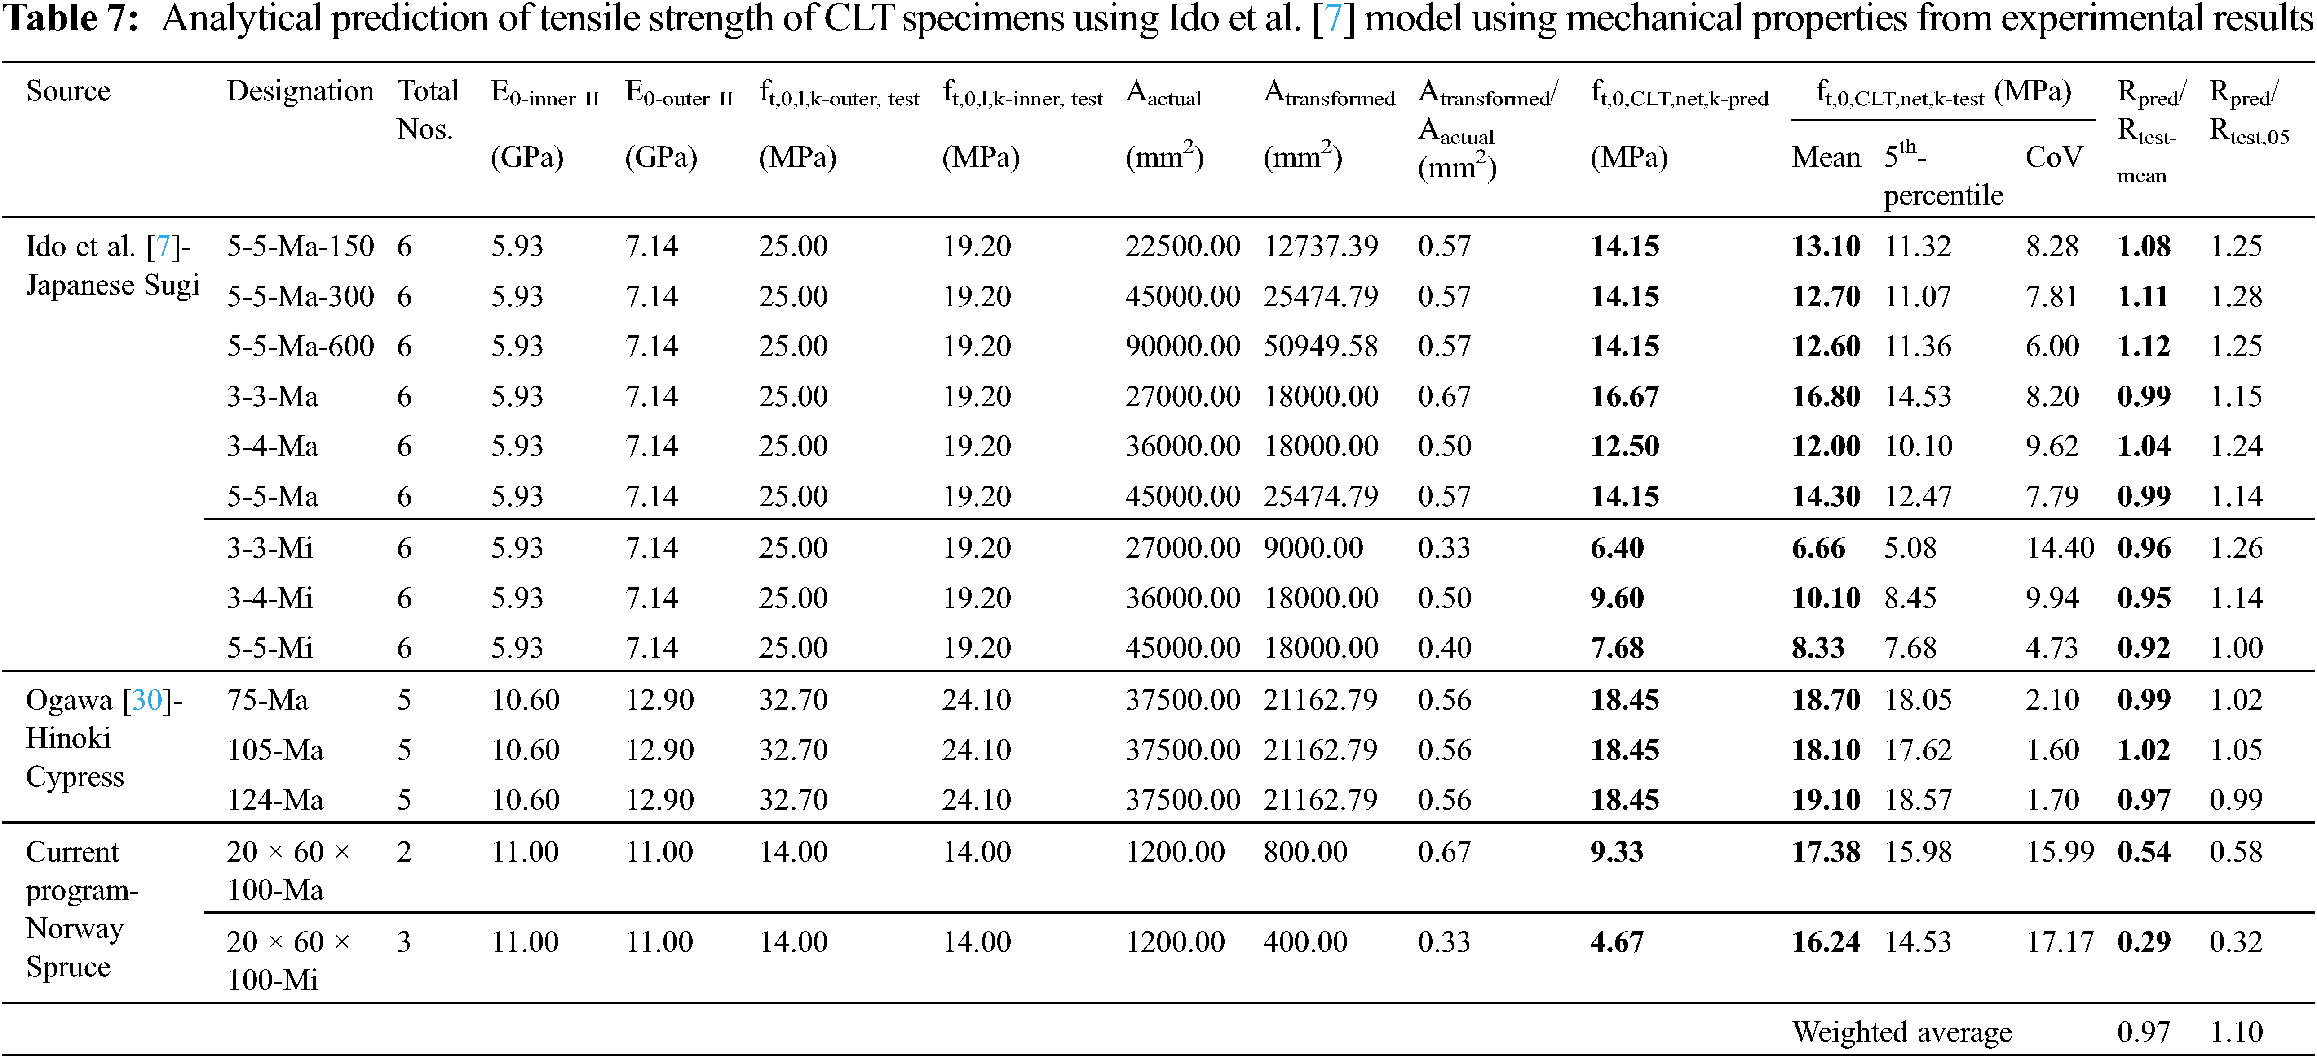
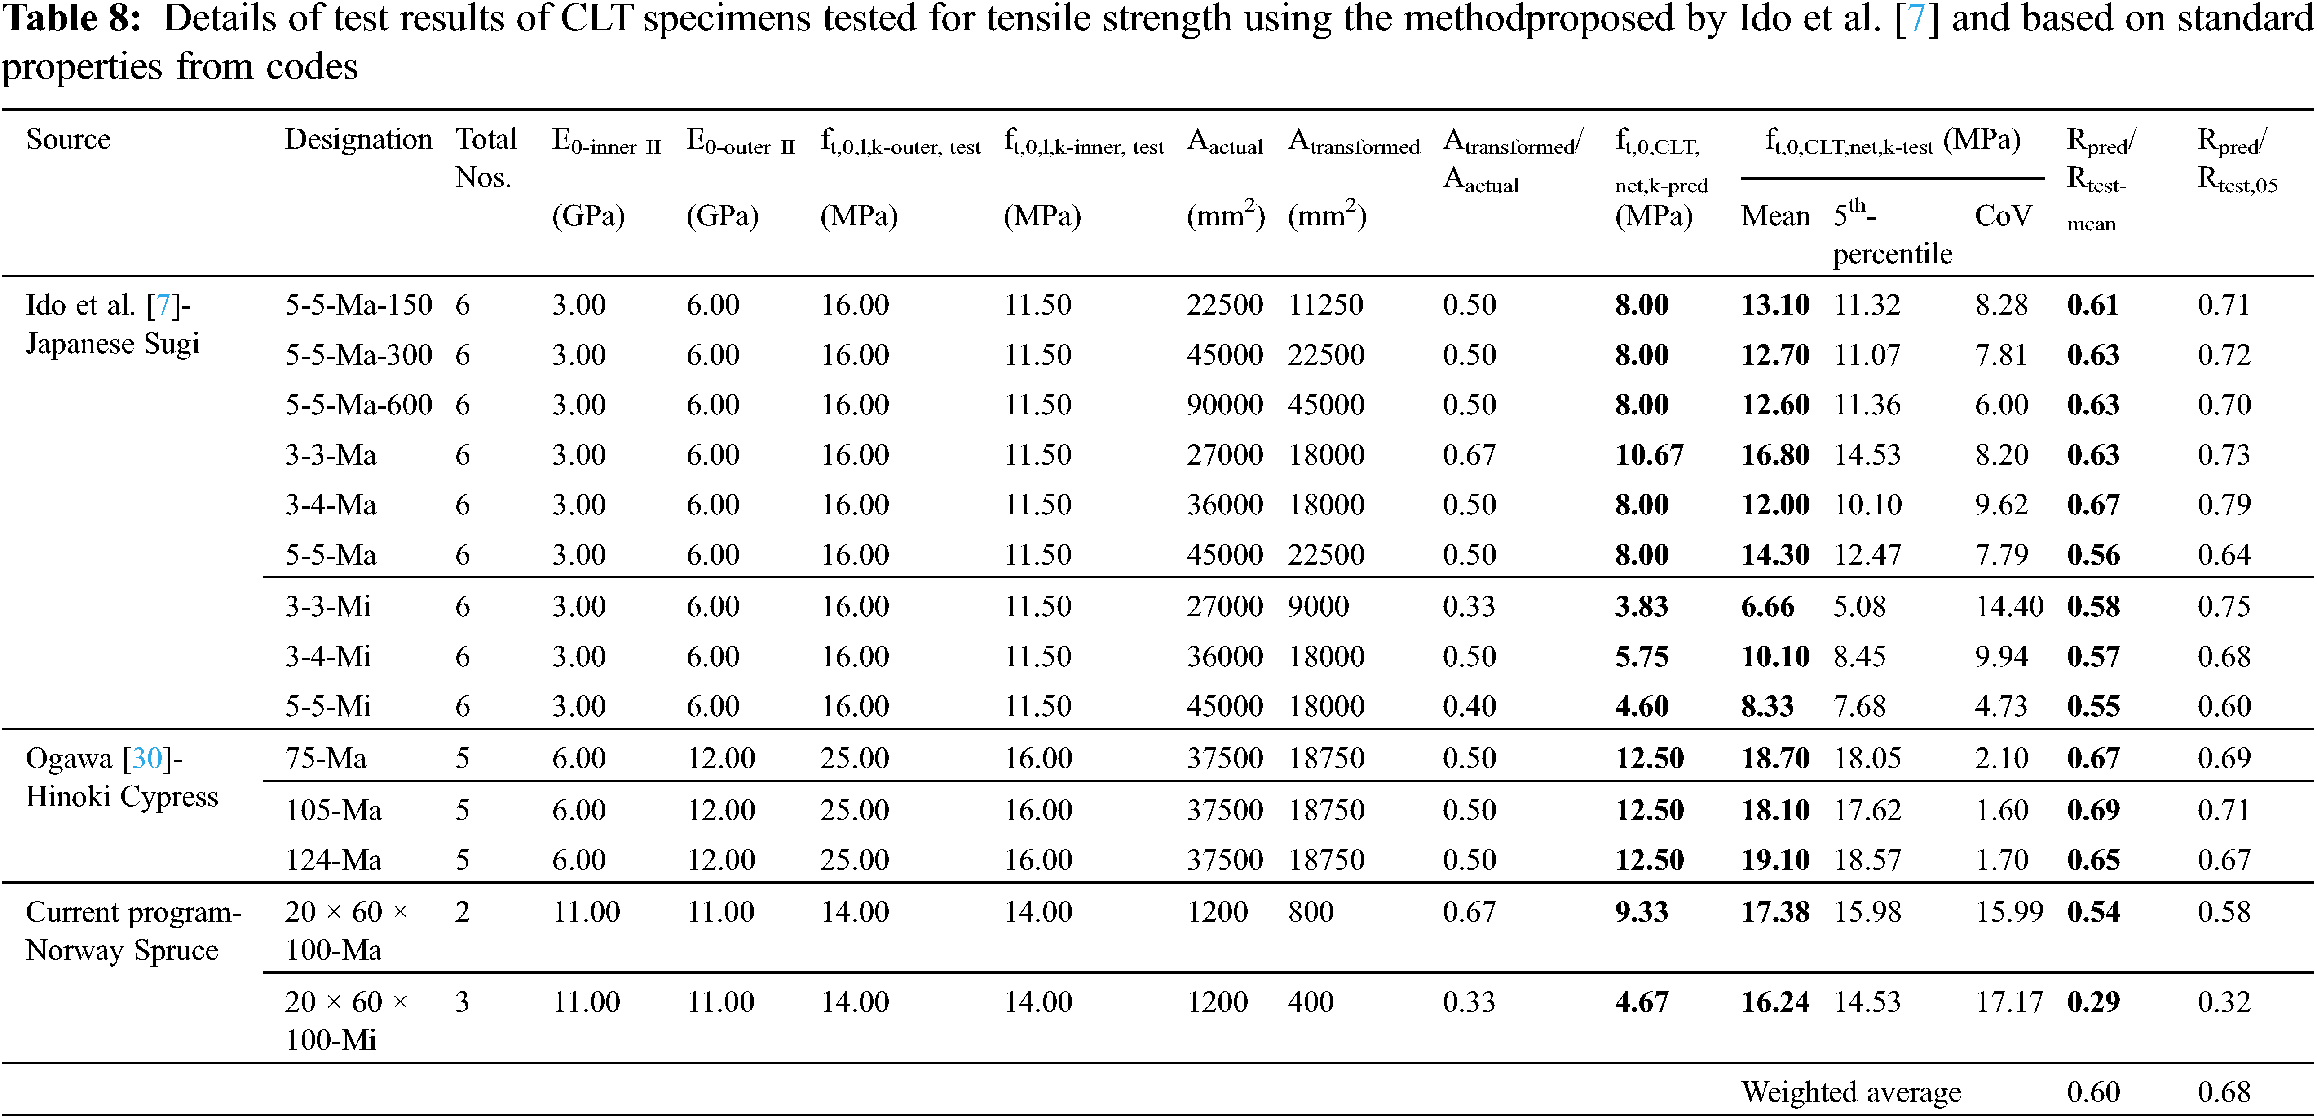
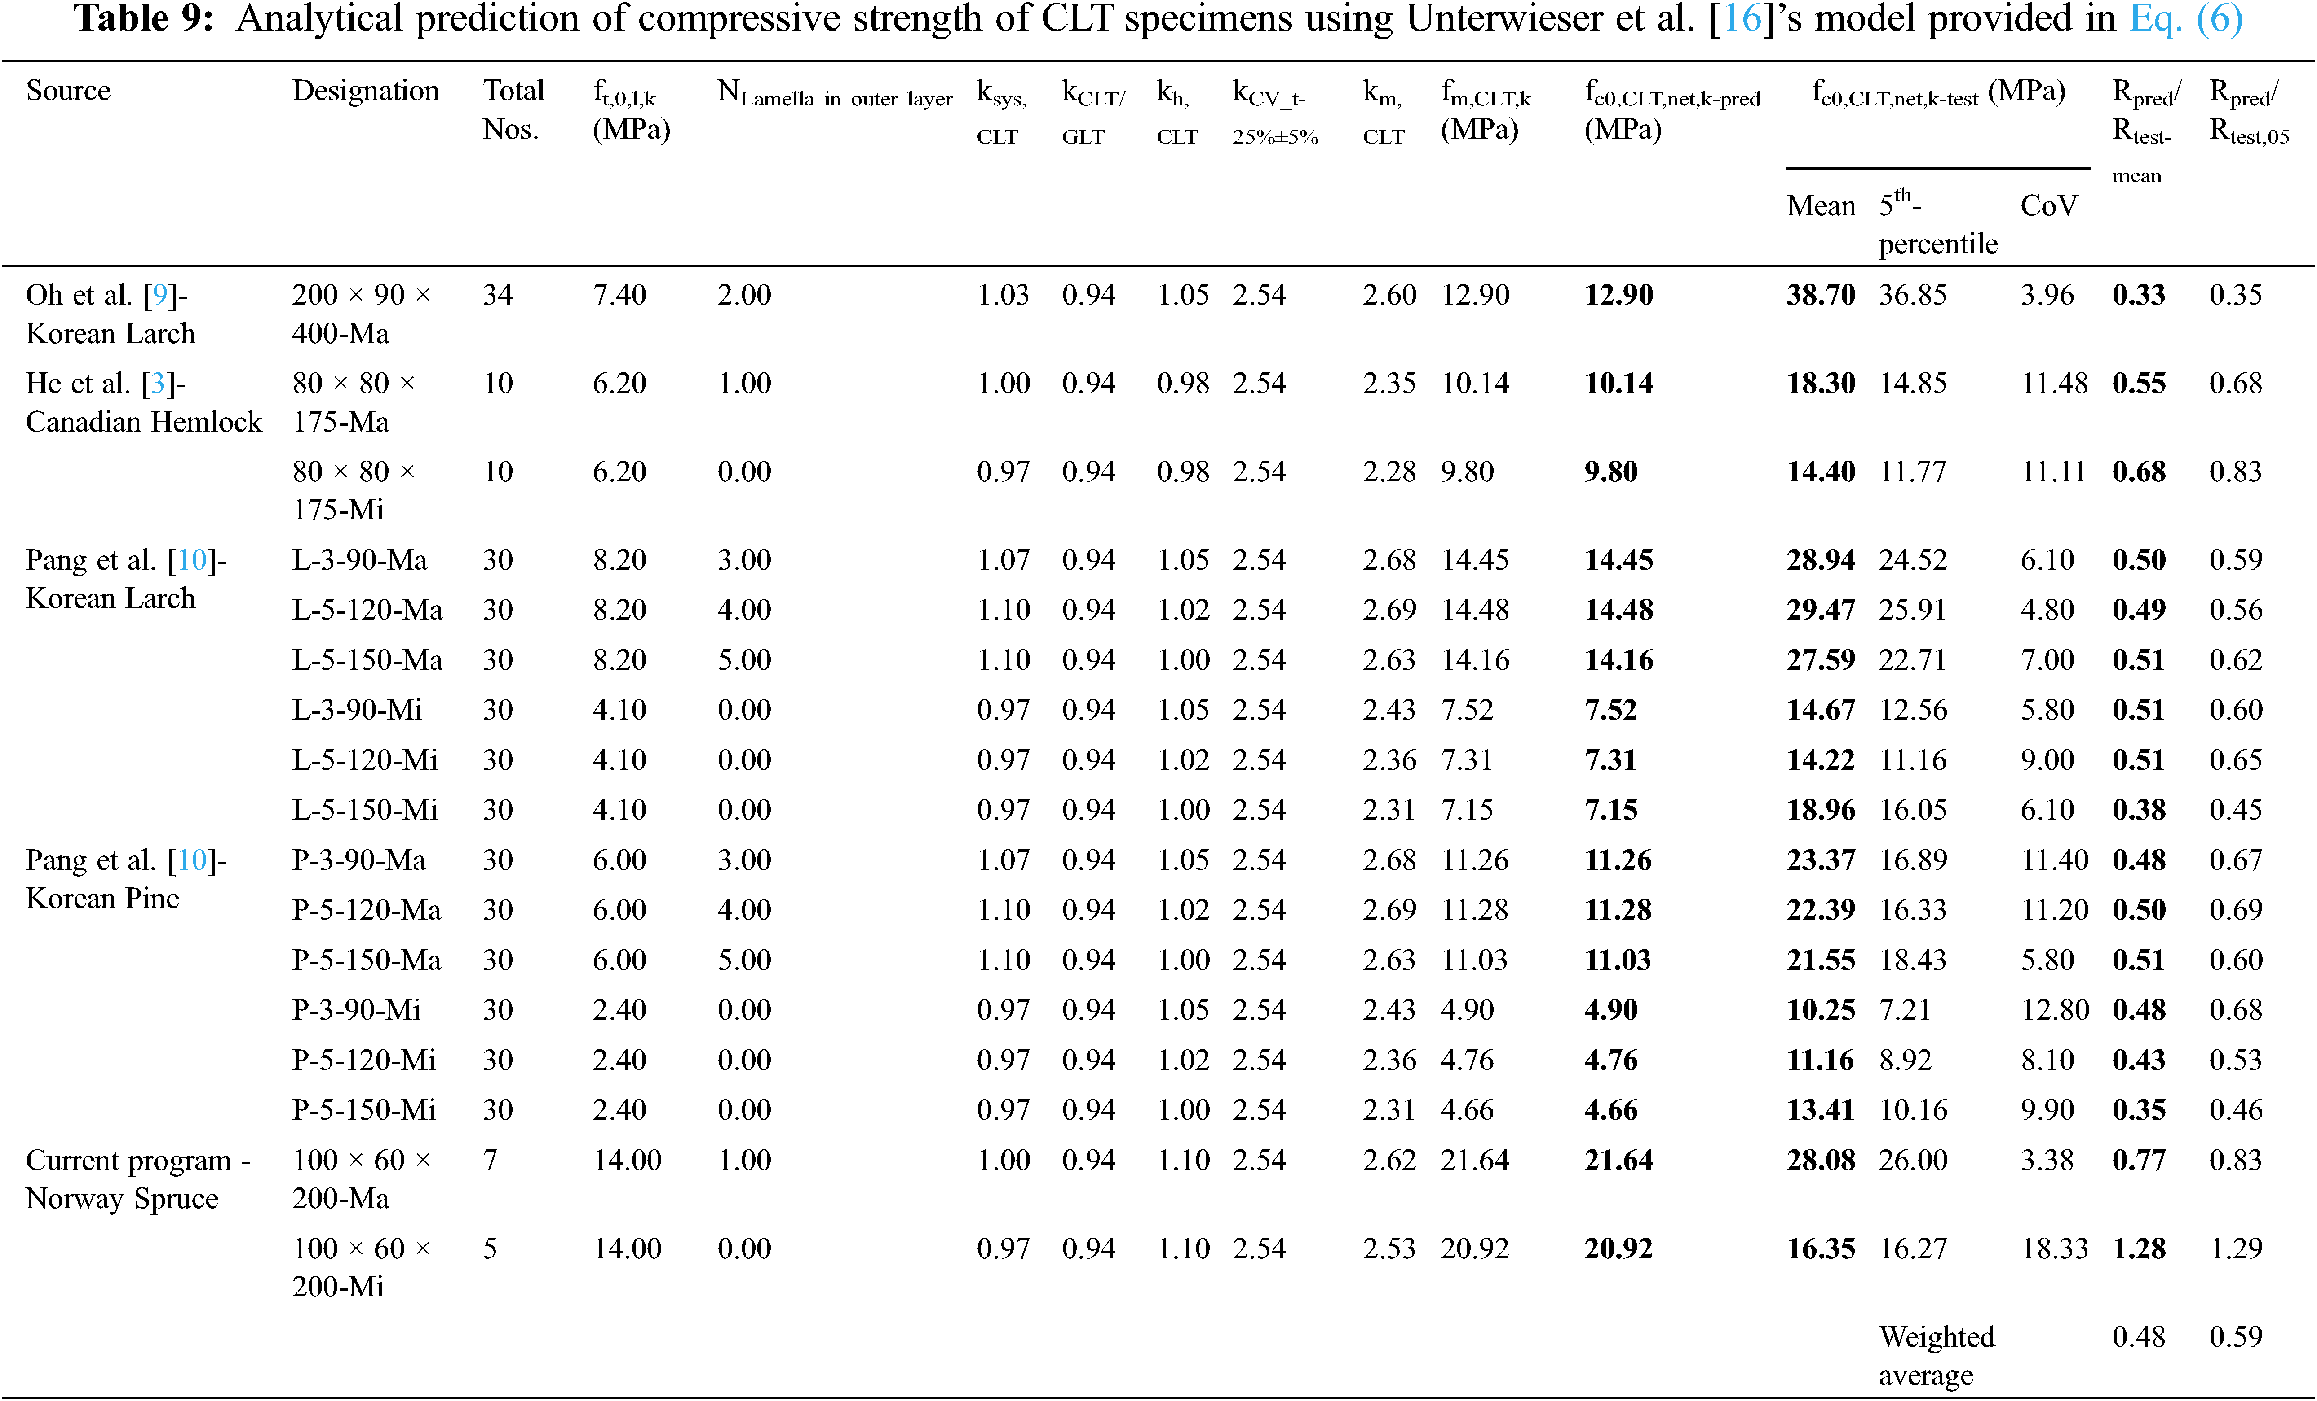
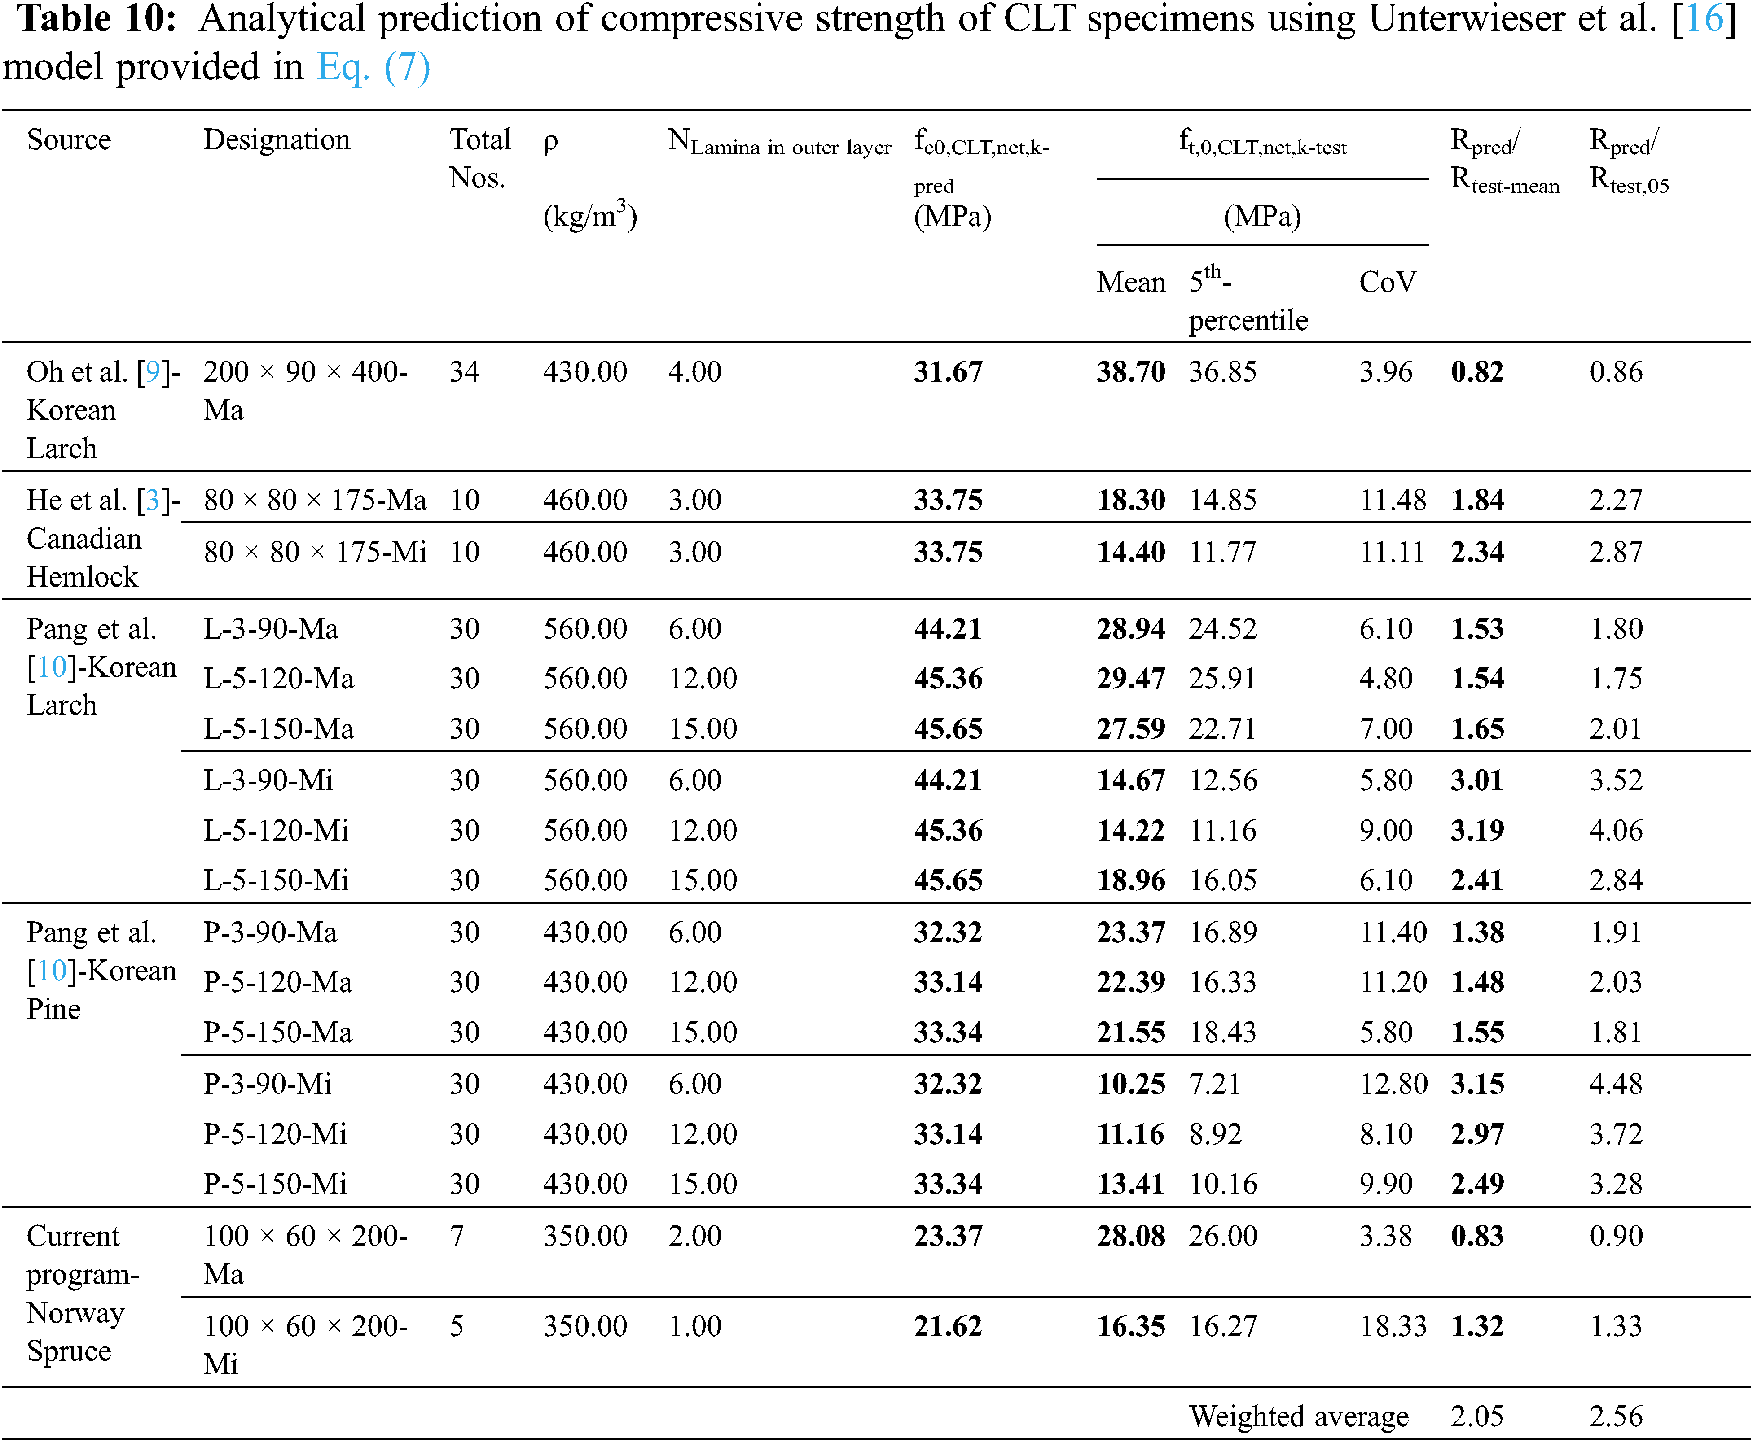
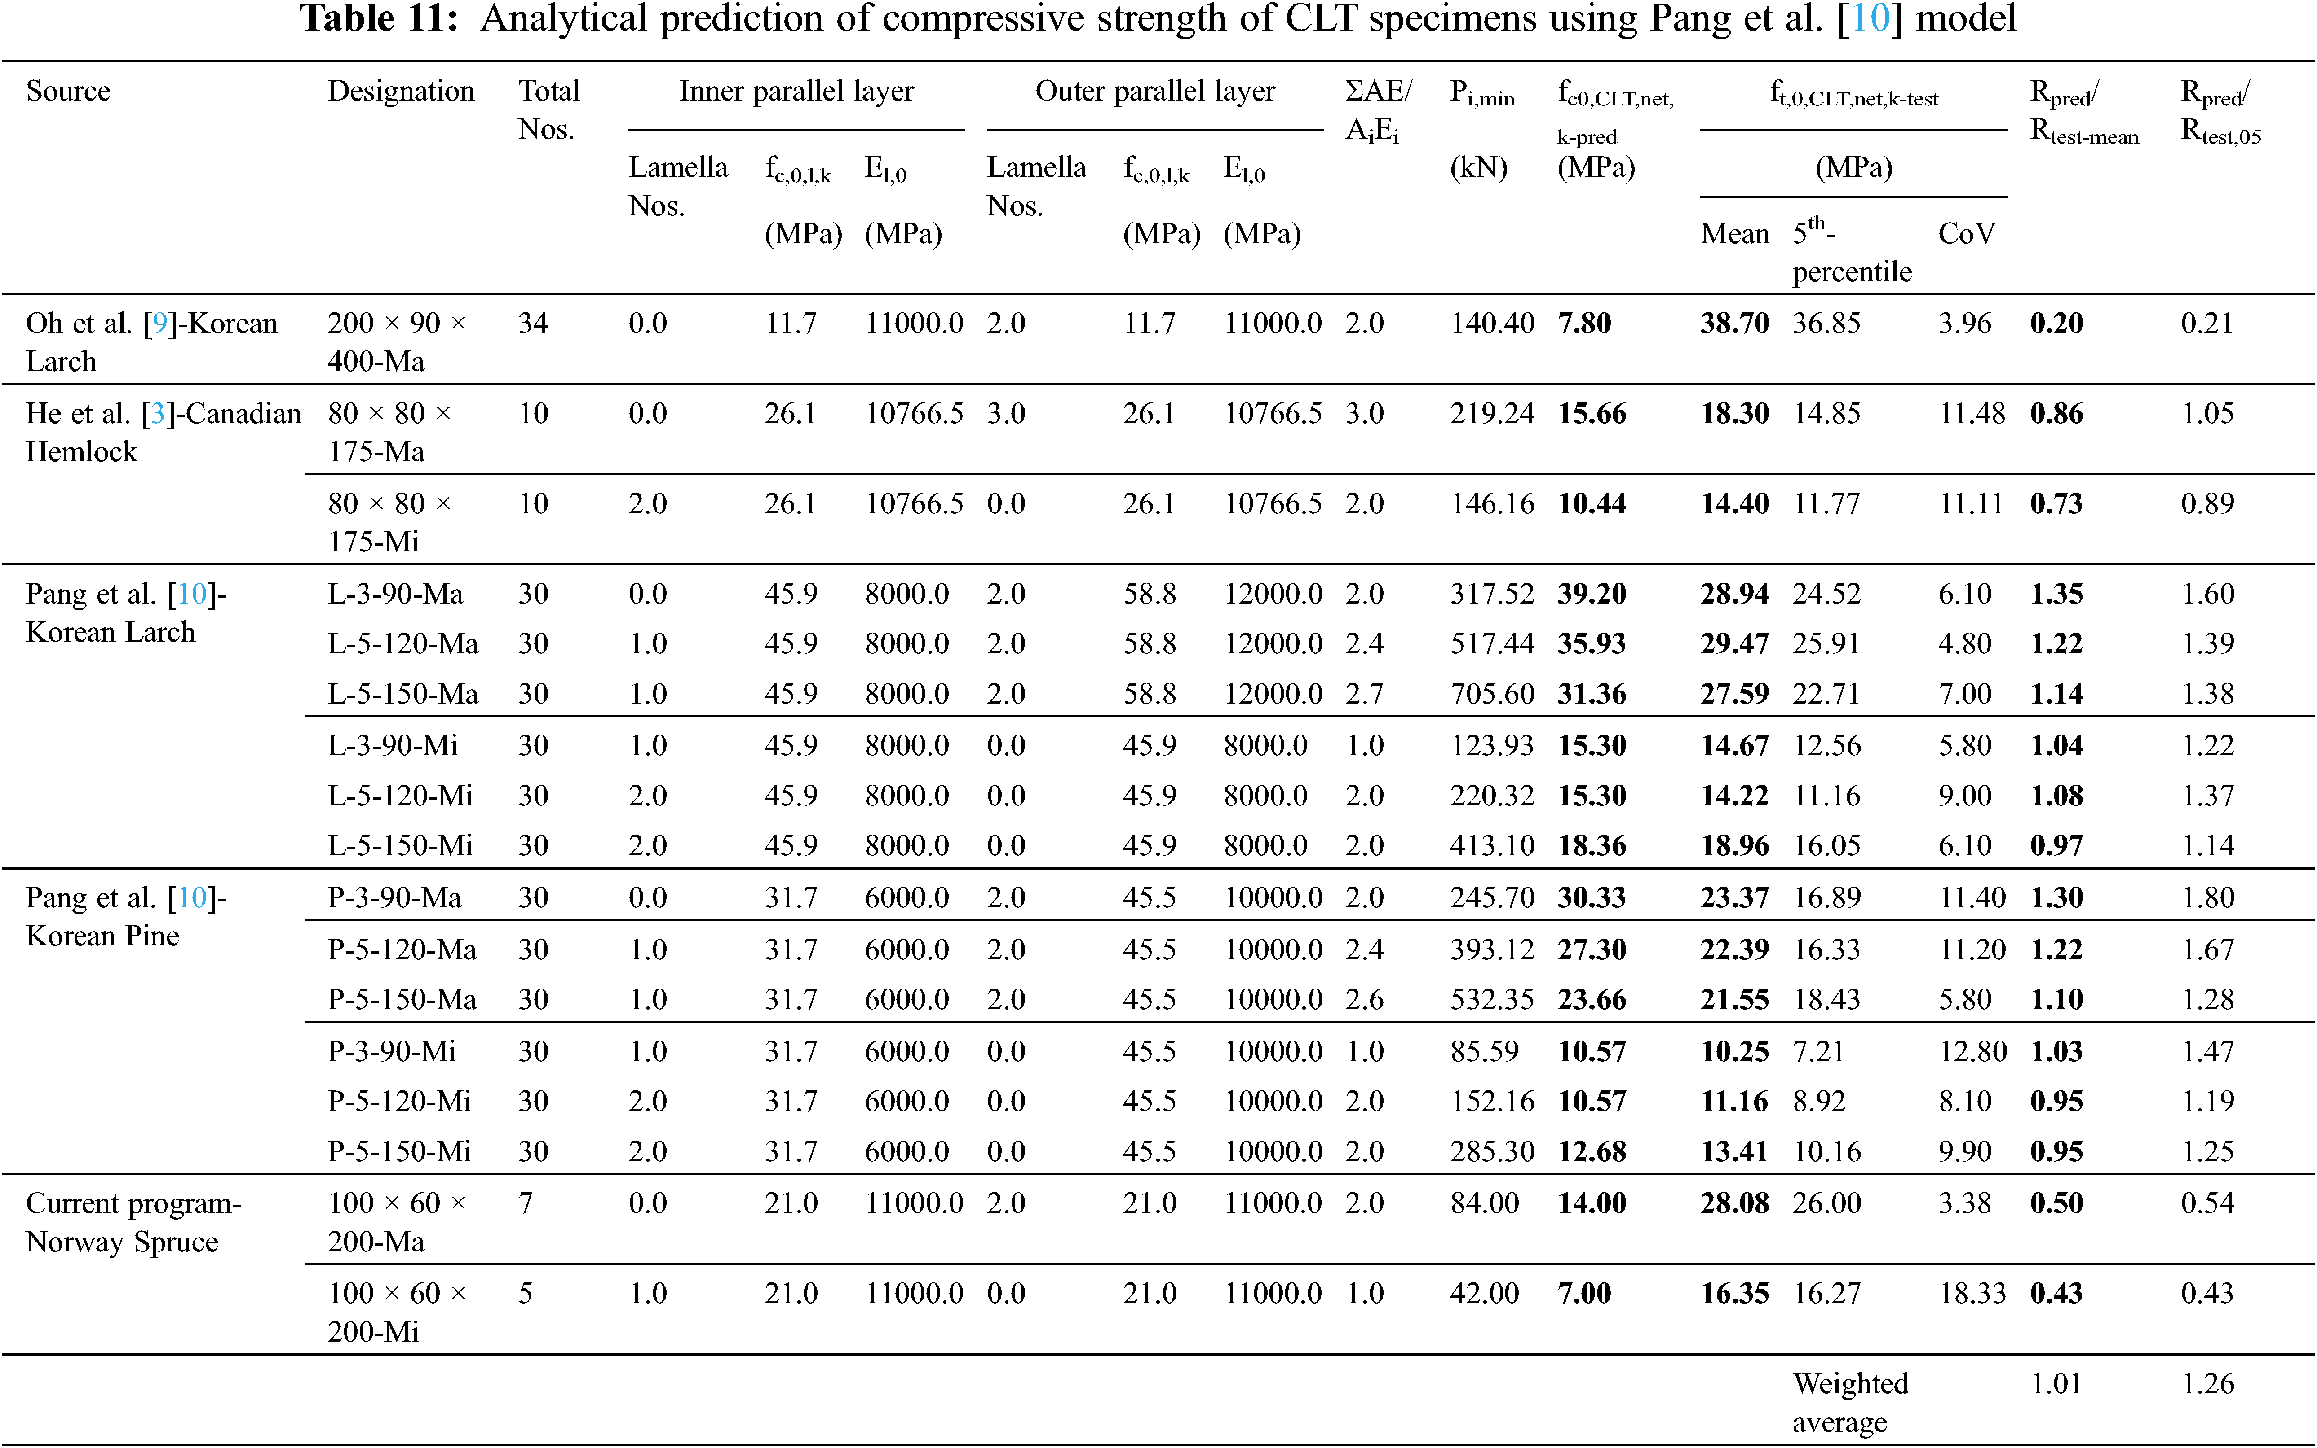
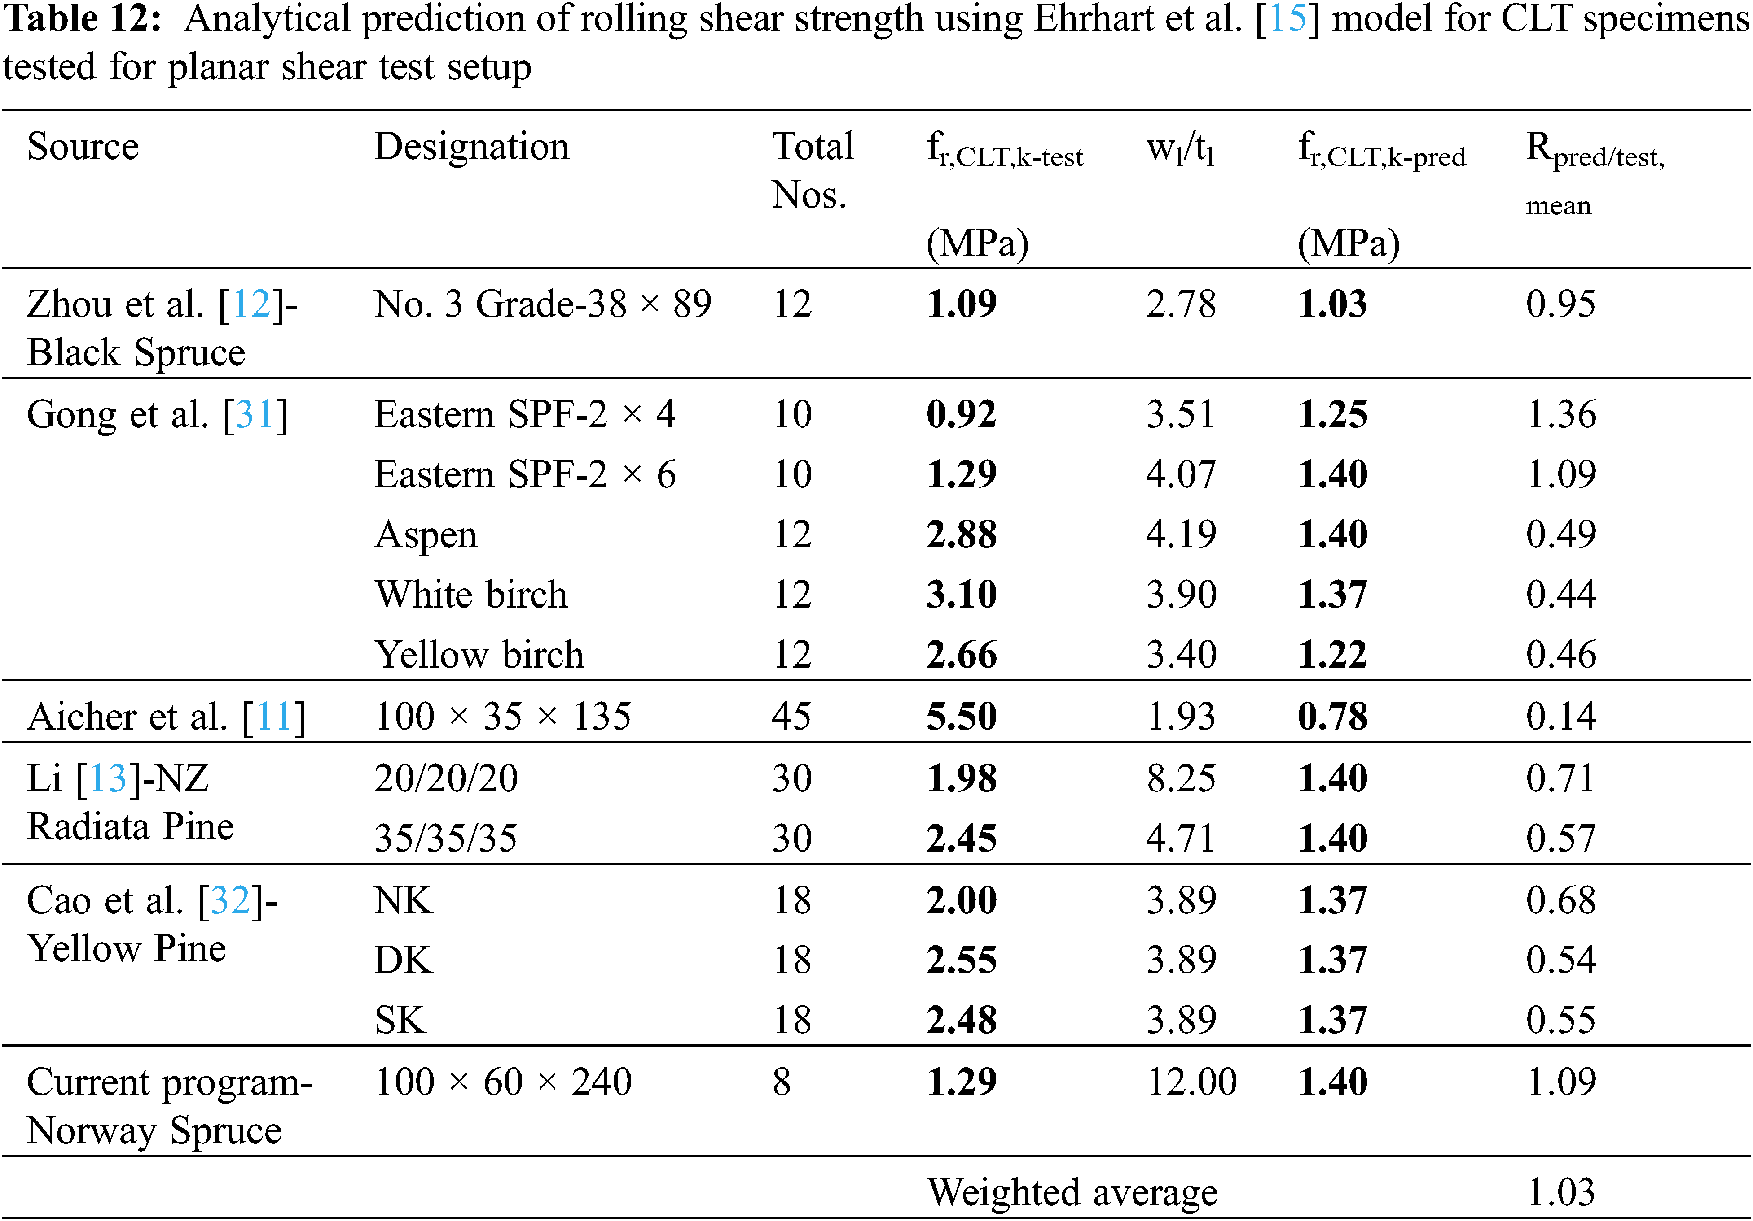
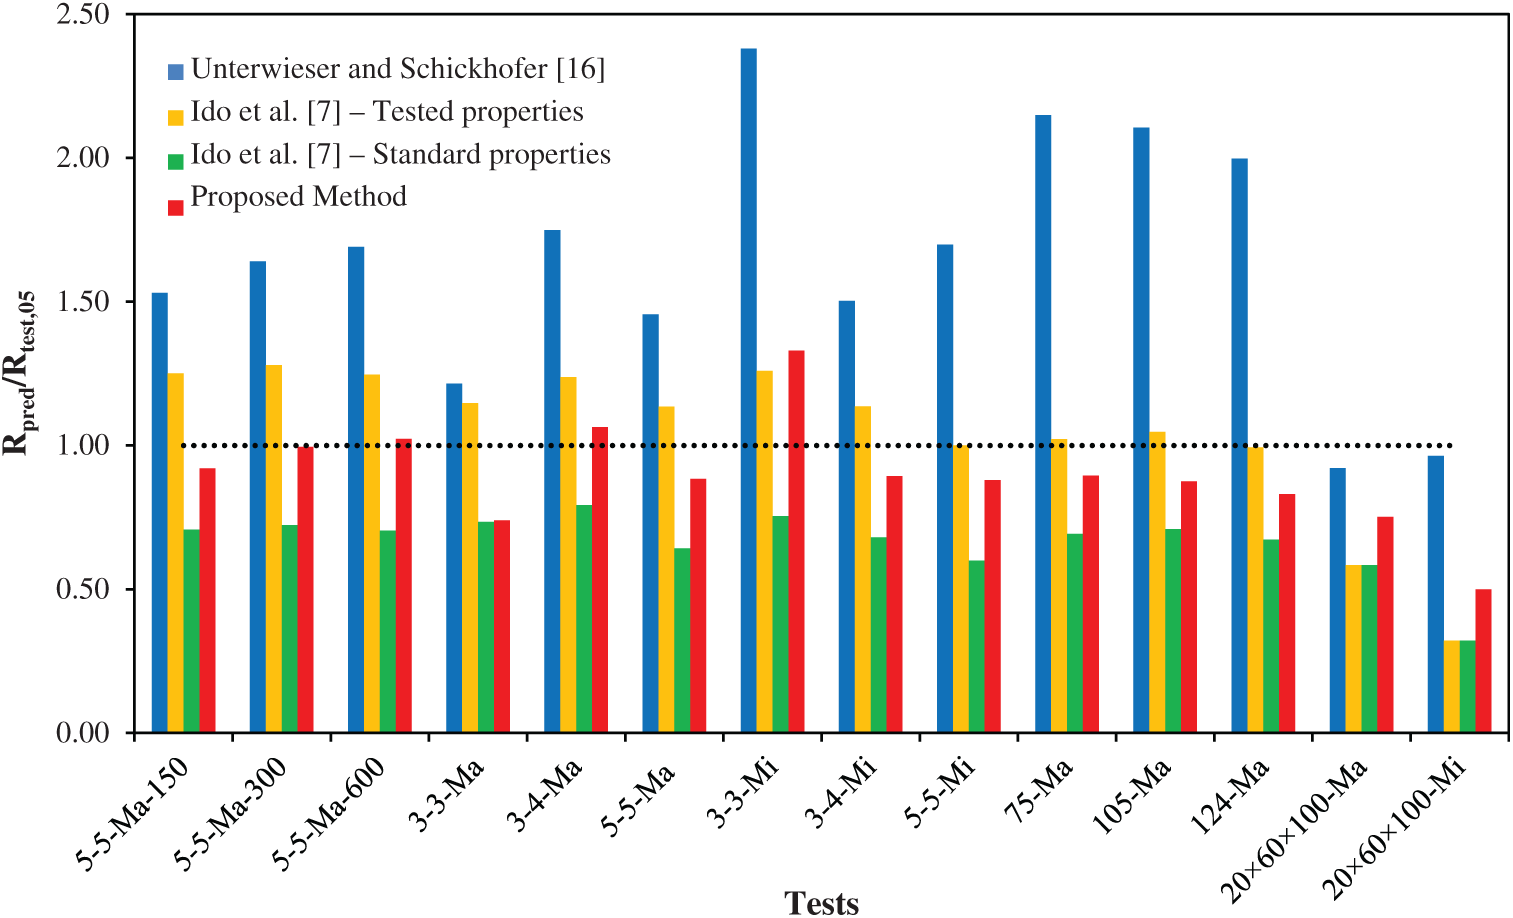
Figure 12: Tensile strength prediction performance for different methods
For compressive strength predictions, a total of 426 test results were used to evaluate the performance of three different methods for the prediction. These can be enumerated as follows:
• Method–C1 Unterwieser et al. [16] model (Eq. (6))
• Method–C2 Unterwieser et al. [16] model (Eq. (7)) and
• Method–C3 Pang et al. [10] model (Eq. (10)).
The specimens were taken from five different sources with four separate species, which are Canadian Hemlock [3], Korean Larch [9,10], Korean Pine [10] and Norway spruce (current program). It should be noted that the method proposed by Pang et al. [10] require the compressive strength of the lamella used in a CLT which was obtained from respective literature. While using Method–C1, tensile strength of the lamella was required (Eq. (16)). The studies containing the test results on compressive strength have no disclosed tensile properties. Accordingly, the tensile strengths were obtained from relevant standards and papers, such as, CSA O86-19 [33] for Canadian Hemlock and Hong et al. [34] for Korean larch and pine.
The Method–C1 produced a conservative estimation of compressive strength with a large variation of Rpred/test-mean = 0.33~1.28 and Rpred/test-05 = 0.35~1.28. The same observation was also reported by the authors. The weighted average for this method was found to be Rpred/test-mean = 0.48 and Rpred/test-05 = 0.59, reflecting the overall underestimation of the method. In contrast, Method-C2 (Eq. (7)) overestimated the compressive strength of CLT for all cases except for the major axis specimen of Norway Spruce. The Rpred/test-mean and Rpred/test-05 ranged between 0.82~3.15 and 0.86~4.48 respectively, while the corresponding weighted average were Rpred/test-mean = 2.05 and Rpred/test-05 = 2.56. High level of over prediction can be attributed to the fact that mix of species and grades were not considered within the design equation, neither the axial orientation nor the lamella strength.
The accuracy in prediction using Method–C3 was within the range of Rpred/test-mean = 0.20~1.30 and Rpred/test-05 = 0.21~1.80. The predictions for Korean Larch and Pine were accurate in terms of mean compressive strengths. However, conservative predictions were observed for other species. Compared to the prior two methods, this method showed better weighted average of Rpred/test-mean = 1.01 and Rpred/test-05 = 1.26. Prediction performance of these three methods is presented in Fig. 13.
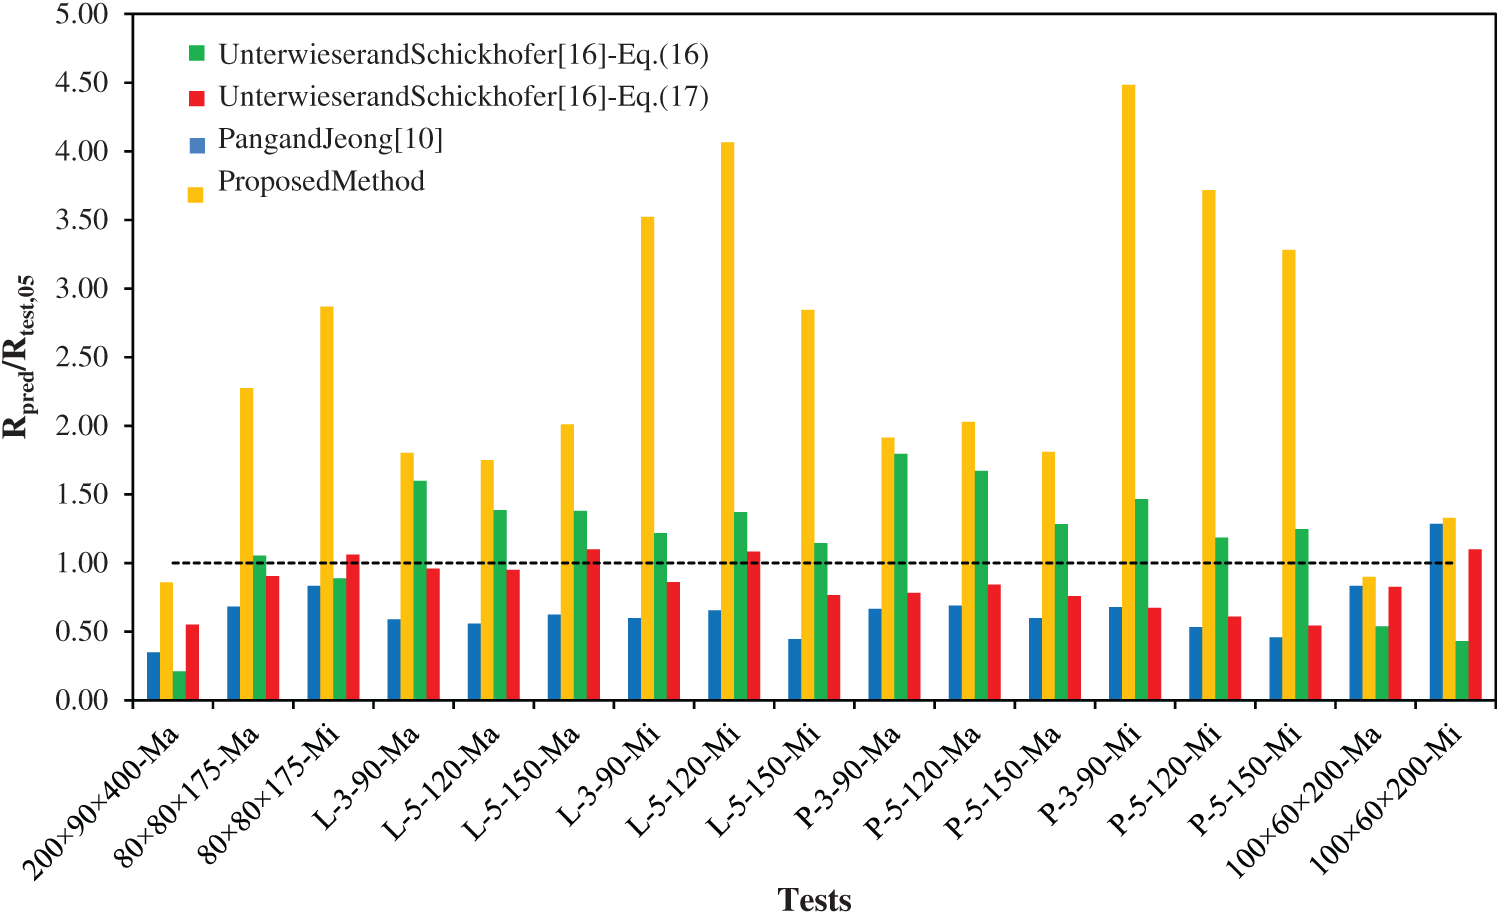
Figure 13: Compressive strength prediction performance for different methods
In Table 12, experimental rolling shear strength values obtained using planar shear test setup are summarized and compared with those obtained by the predictive model proposed by Ehrhart et al. [15] as shown in Eq. (12). Although the weighted average of the predicted vs. test results Rpred/test,mean was 1.03, there was obvious scatter in predictions, which is shown graphically in Fig. 14.
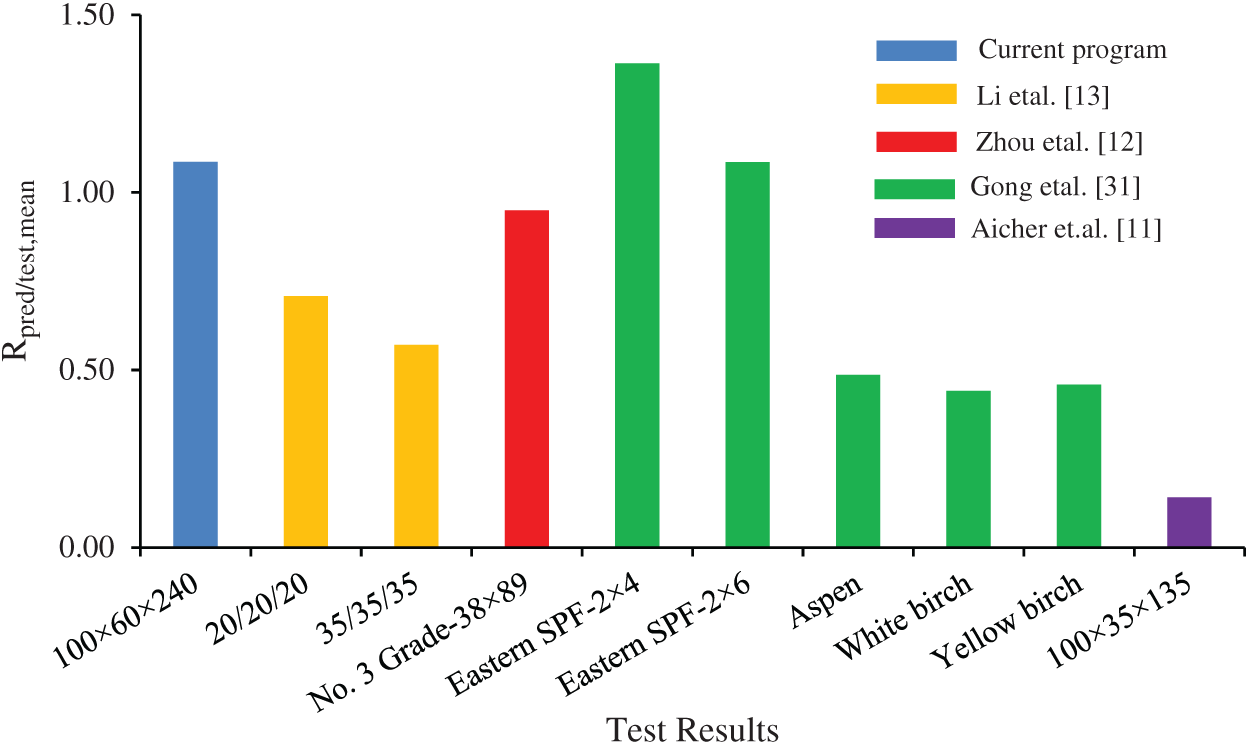
Figure 14: Prediction performance for rolling shear strengths using planar shear test using Ehrhart et al. [15] proposal–Eq. (12)
4 Development of New Proposals for Tensile, Compressive, and Rolling Shear Strength Prediction
This section will propose 3 new equations to predict tensile, compressive, and rolling shear strength for CLT specimen.
The new proposal is based on the previous method developed by Unterwieser et al. [16] and the test results assembled as a part of the current study. Tensile strength determined using Eq. (4) considers the total number of parallel-to-grain lamella (n) within the cross-section and based on that, finds a system factor ksys,t,0. The system factor ksys,t,0 was introduced to account for the contribution from adjacent lamella within the system while subjected to loading. If a particular lamella in the CLT section has low strength (i.e., 5th percentile), then it is assumed that the contribution from the surrounding lamellae will be of higher strength and balance the overall load carrying capacity. Thus, ksys,t,0 ≥ 1.0 was suggested in Eq. (5) when calculating the tensile strength of CLT section by means of lamella tensile strength.
While calculating ksys,t, no consideration was given to the axial orientation (i.e., major or minor) of the CLT specimen. Furthermore, n only included the total number of the lamella in the cross-section ignoring the effect of using various strength grades within the same CLT cross-section, whereas current literature report substantial evidence of combined strength grades.
Therefore, the proposed formulation was derived to account for the effect of different graded lamella within a CLT specimen and with distinction between major and minor axis specimen. The proposed equations are provided in Eqs. (15)–(18). The factors in Eqs. (16) and (17) were determined using nonlinear regression analysis based on the available data.
where, j = any layer with lamella parallel-to-grain in the cross-section, Nl,0,j = the number of full width lamella within the jth layer, and ft,l,0,j = lamella tensile strength of the jth layer and ft,l,0-min = the minimum lamella tensile strength in the cross-section.
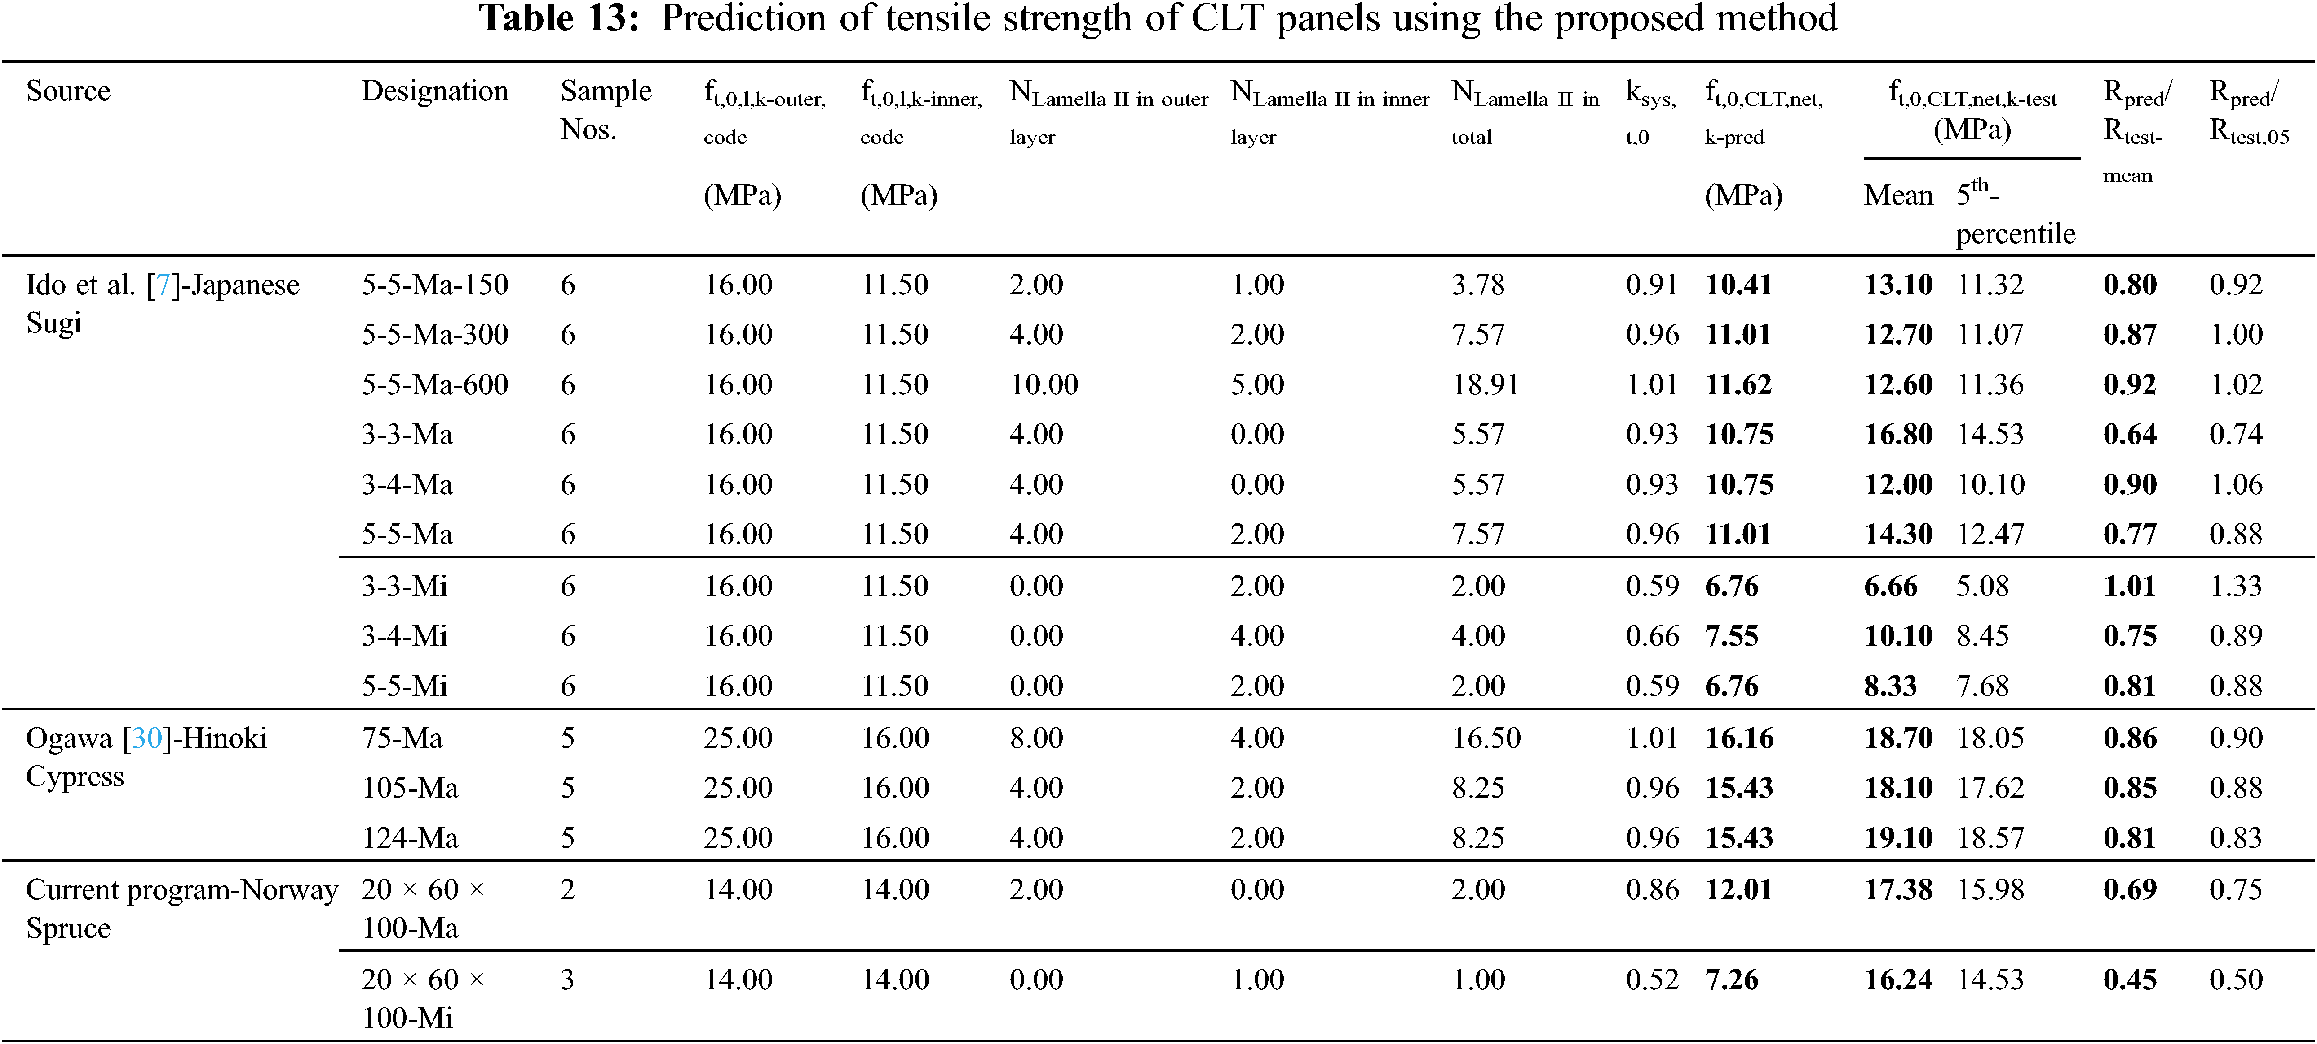
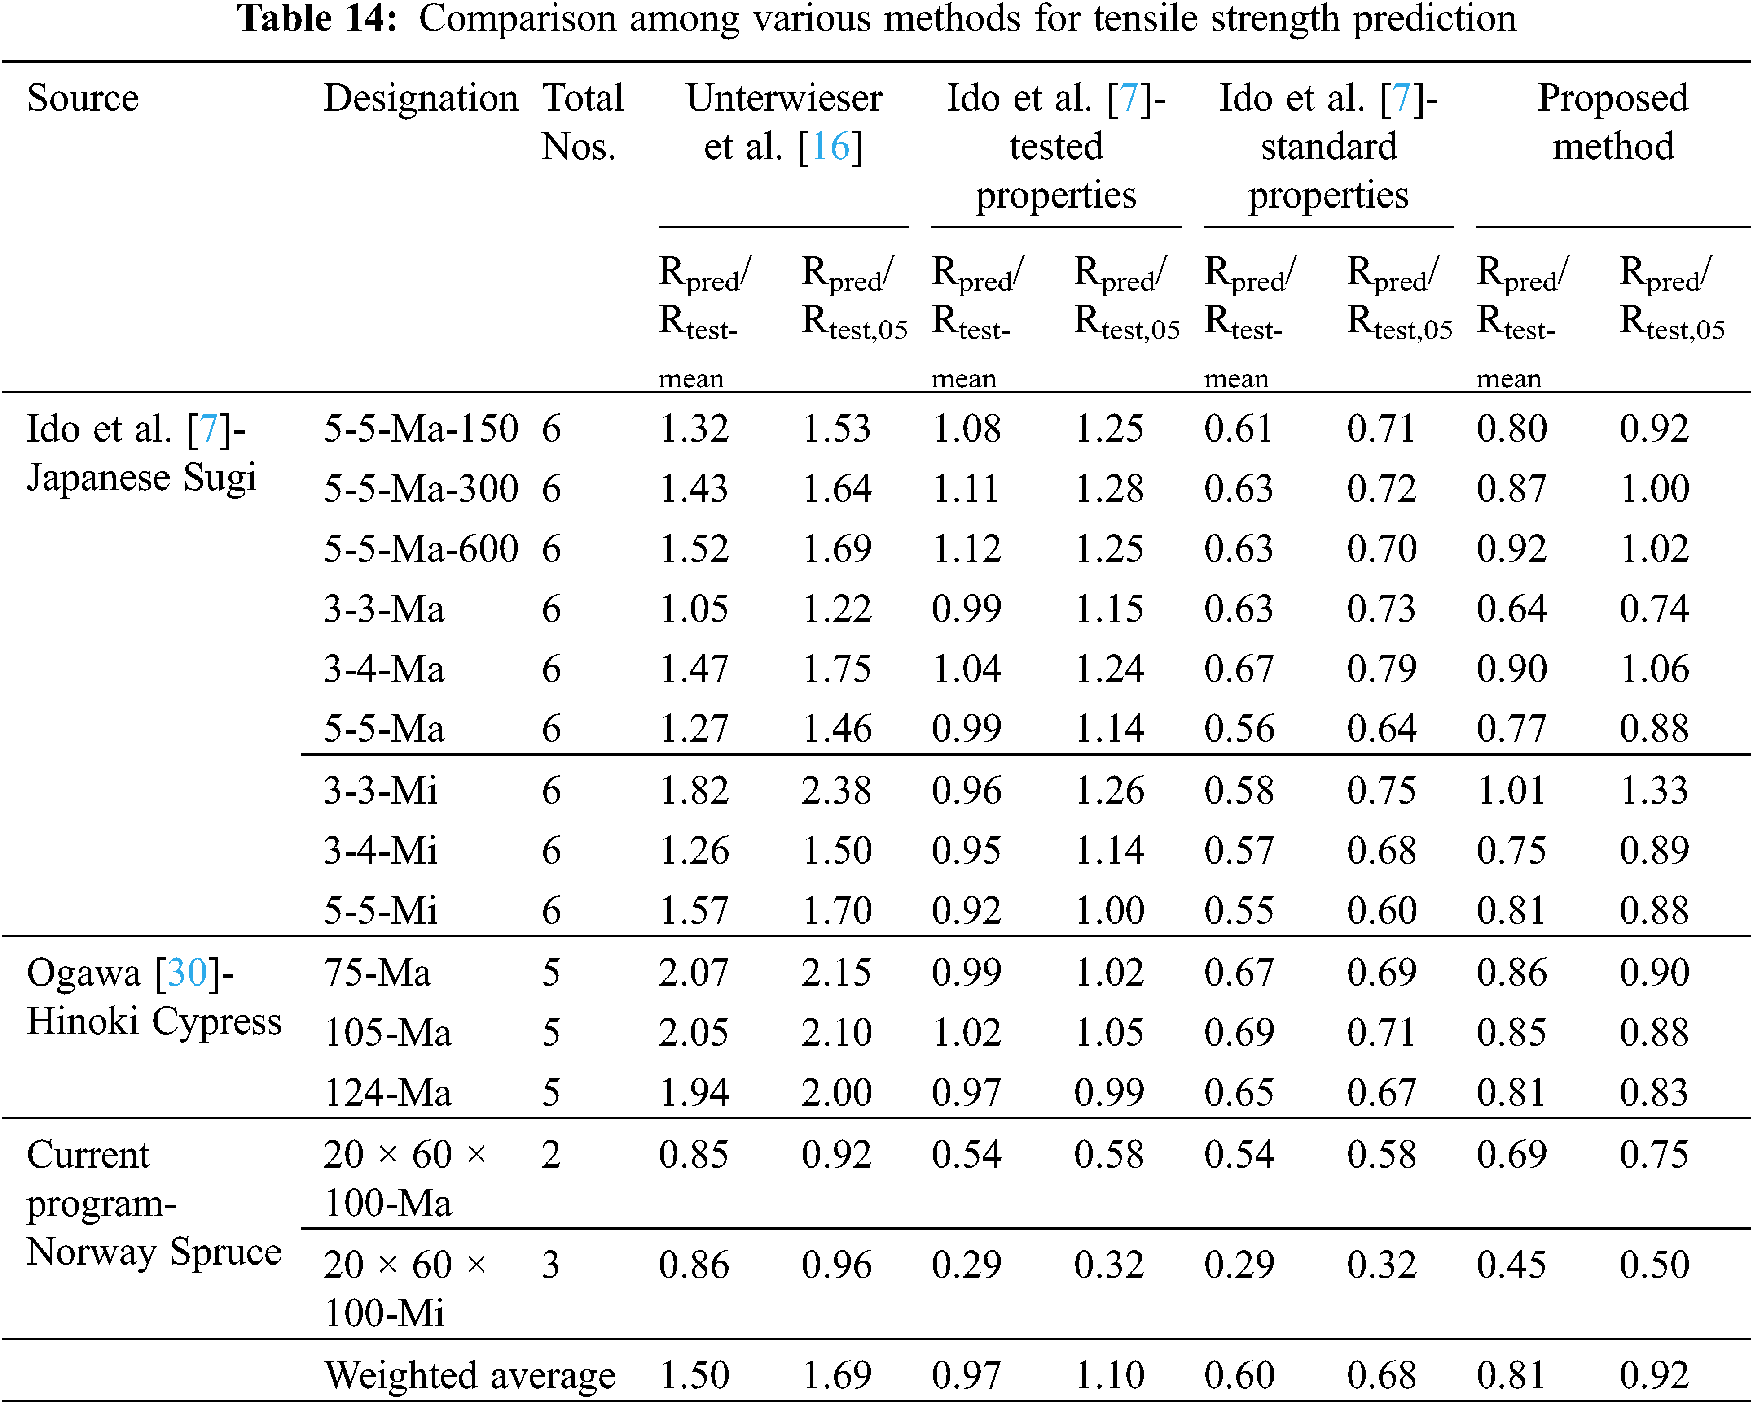
The detailed calculations for the predictions obtained using the proposed equation are presented in Table 13 and the overall comparison with other models are already showed in Fig. 12. It is worth mentioning that the proposed analytical equation was aimed at predicting the 5th percentile strength of a CLT section rather than mean strength, as 5th percentile strength is chosen as the design strength for timber structures. From Table 13, it is evident that the proposed method can predict the 5th percentile strength conservatively but with a high accuracy of Rpred/test-05 = 0.50~1.33 compared to the other methods discussed in the previous sections. Efficiency of the proposed method is further revealed when compared with other methods (Table 14) with weighted average of Rpred/test-mean = 0.81 and Rpred/test-05 = 0.92.
For compressive strength, Eq. (7) proposed by Unterwieser et al. [16] was modified. It is based on density and number of parallel-to-grain lamella in the cross-section, which overestimates the compressive strength of CLT (Table 10) compared to other methods.
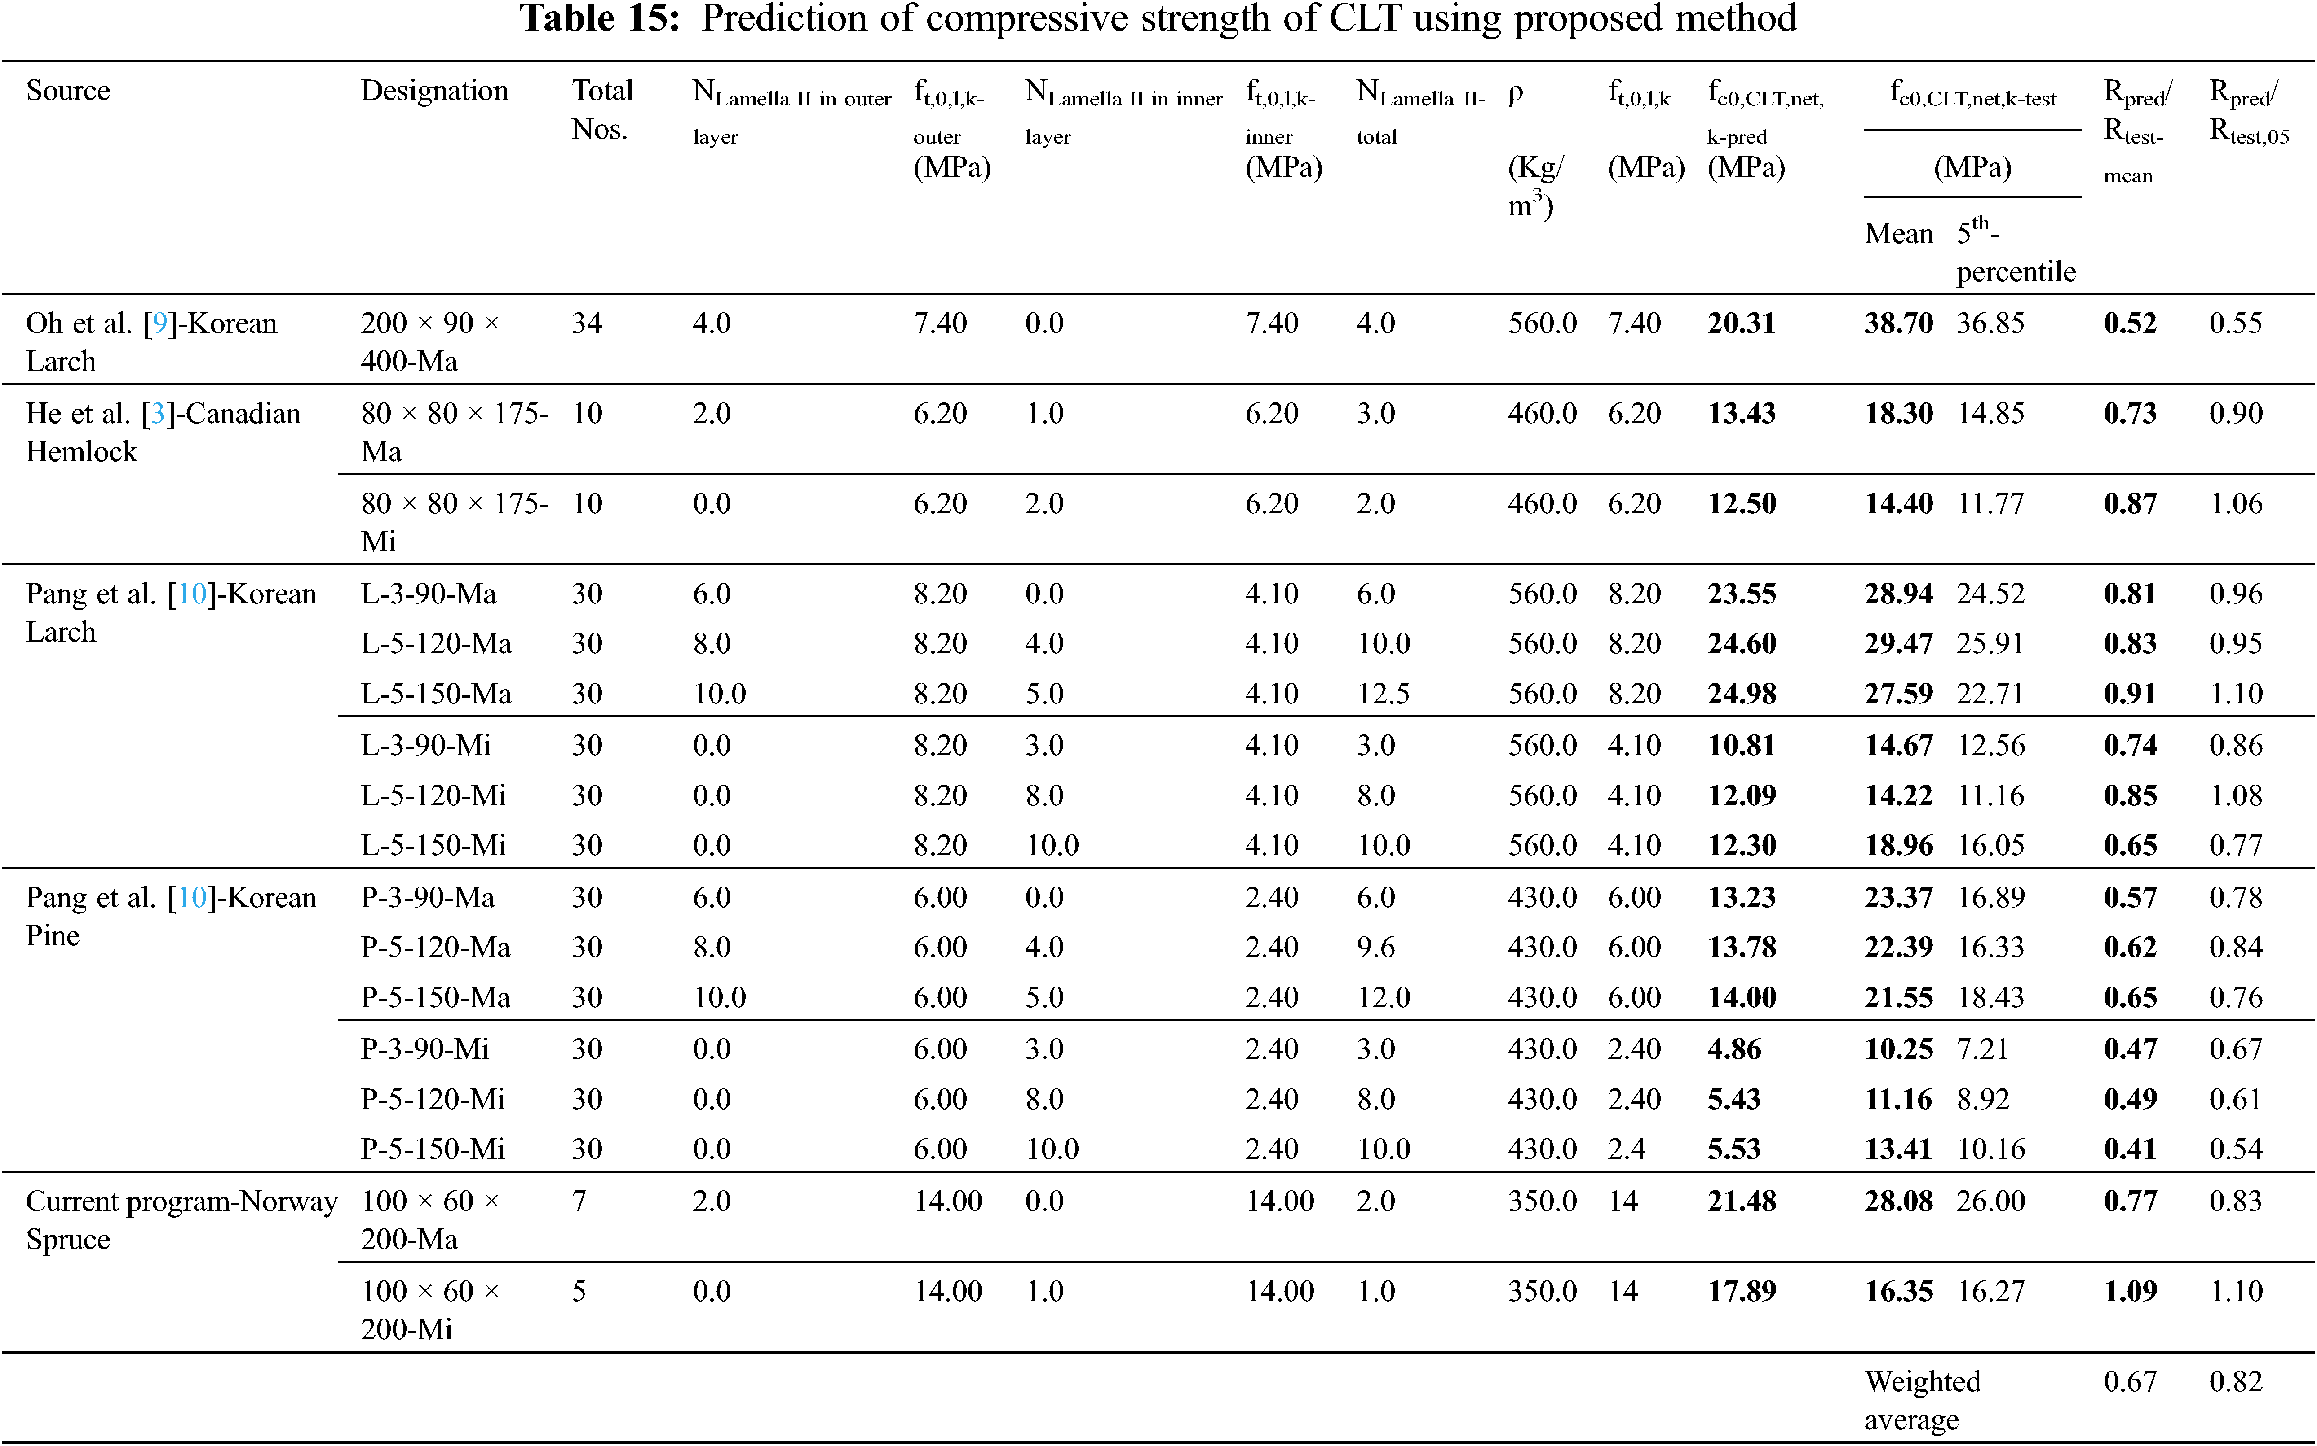
The modified equation is provided in Eq. (19), where ft,0,l,k-max is the maximum parallel-to-grain lamella strength of the specimen, ρl,k-max is the density of the corresponding lamella with maximum strength and n is the number of lamella within the cross-section determined using Eq. (20).
where, j = any layer with lamella parallel-to-grain in the cross-section, Nl,0,j is the number of full width lamella within the jth layer, and ft,l,0,j = lamella tensile strength of the jth layer and ft,l,0-max is the maximum lamella tensile strength in the cross-section.
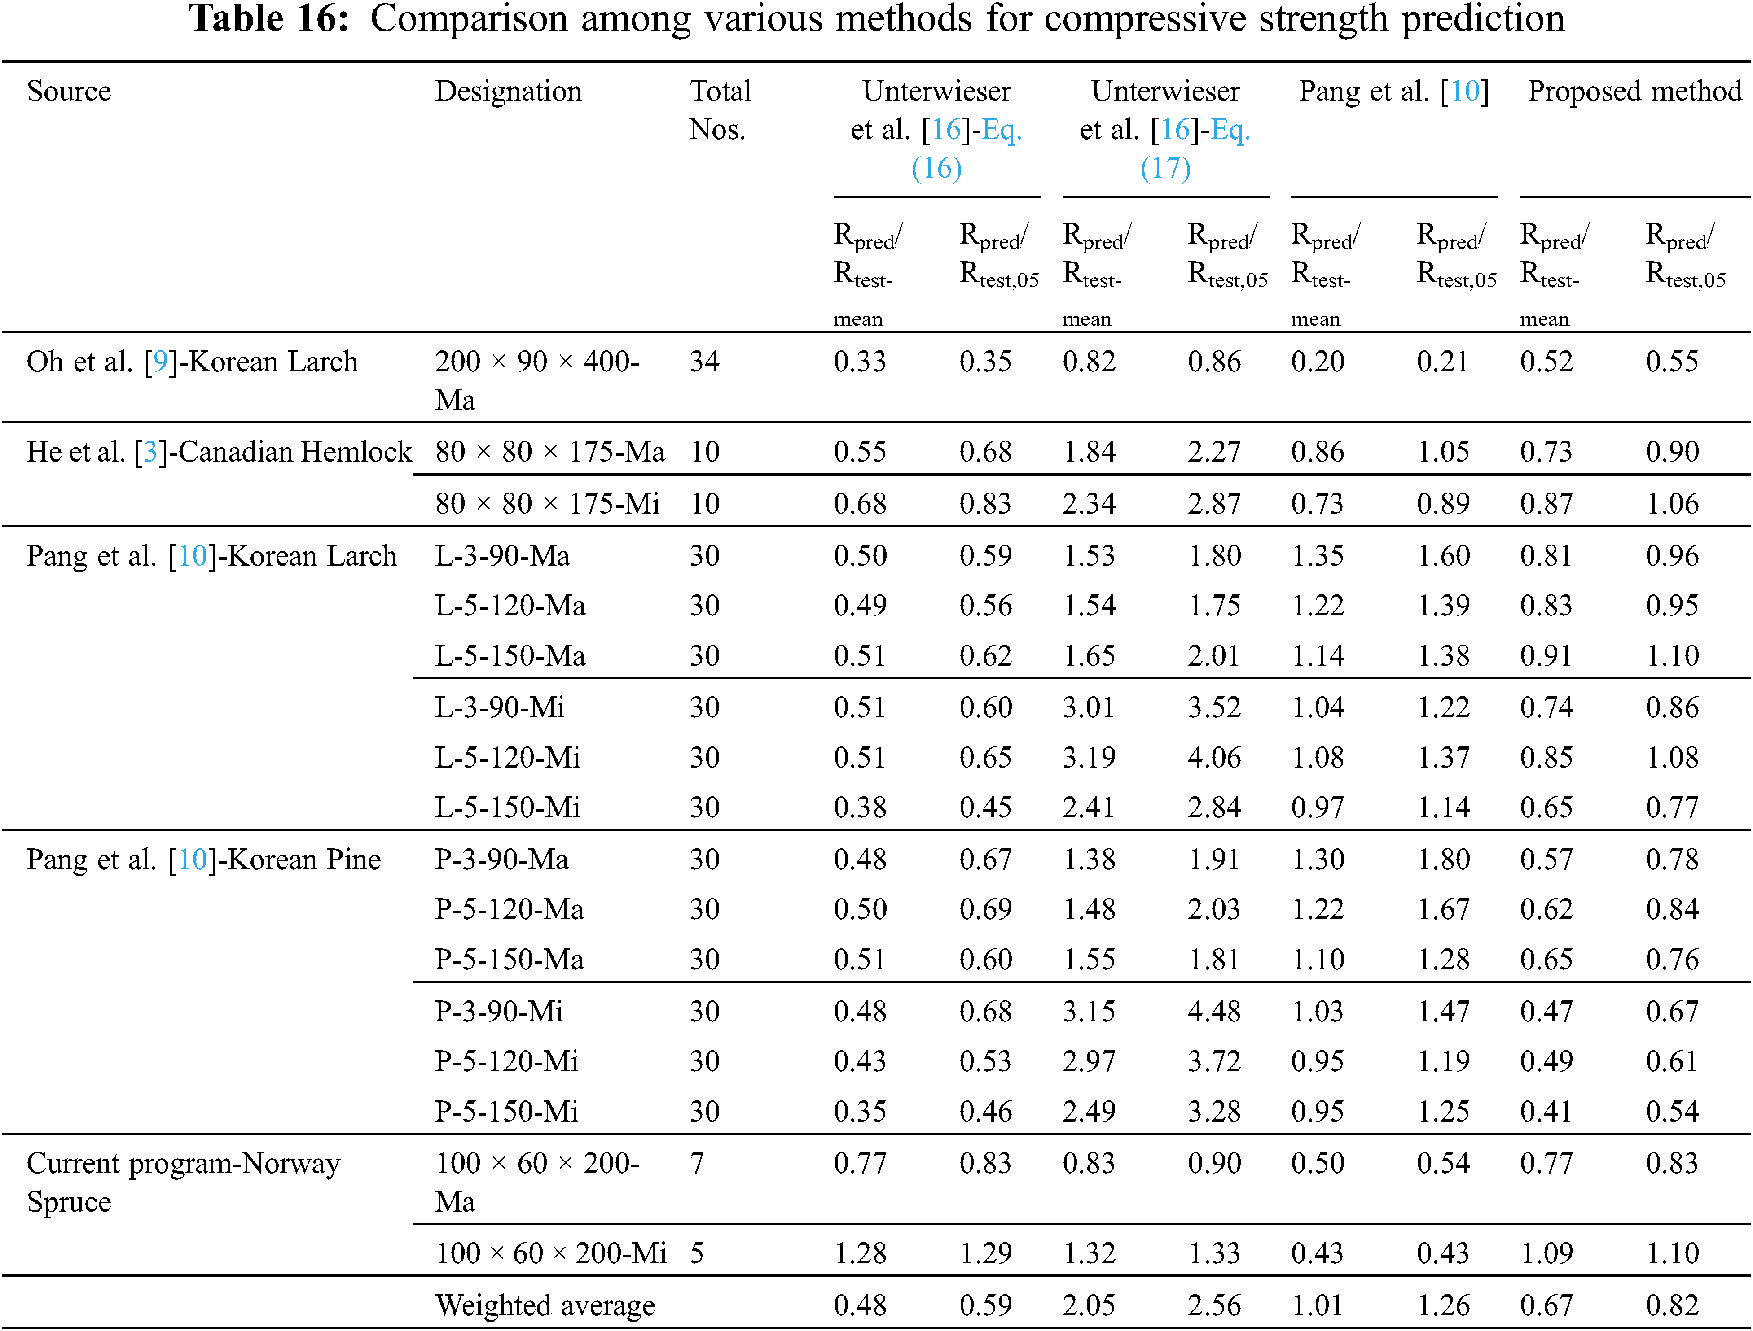
Table 15 contains the detailed calculation of the proposed method, which shows the range of Rpred/test-mean = 0.41~1.09 and Rpred/test-05 = 0.54~1.10. It can be observed that the predictions are in the conservative side. Furthermore, Table 16 compares all the methods related to compressive strength against the new proposal. The weighted average for this method is Rpred/test-mean = 0.67 and Rpred/test-05 = 0.82, which shows its efficiency in predicting the 5th percentile strength.
Experimental method to obtain rolling shear strength using short span bending and planar shear test was prescribed in DIN EN 16351 [21]. It can be observed that significant differences exist in rolling shear strength obtained from planar shear test and short span bending tests. Short span bending tests are often used to determine rolling shear strength due to the similarity of the test setup with normal bending test, whereas planar shear test requires special type of test equipment and sample preparation methods according to DIN EN 16351 [21]. However, conducting short span bending tests to determine rolling shear strength could be erroneous in cases where the beam specimen produces a different failure mode rather than rolling shear, such as delamination between layers or tensile cracking of the section under flexure.
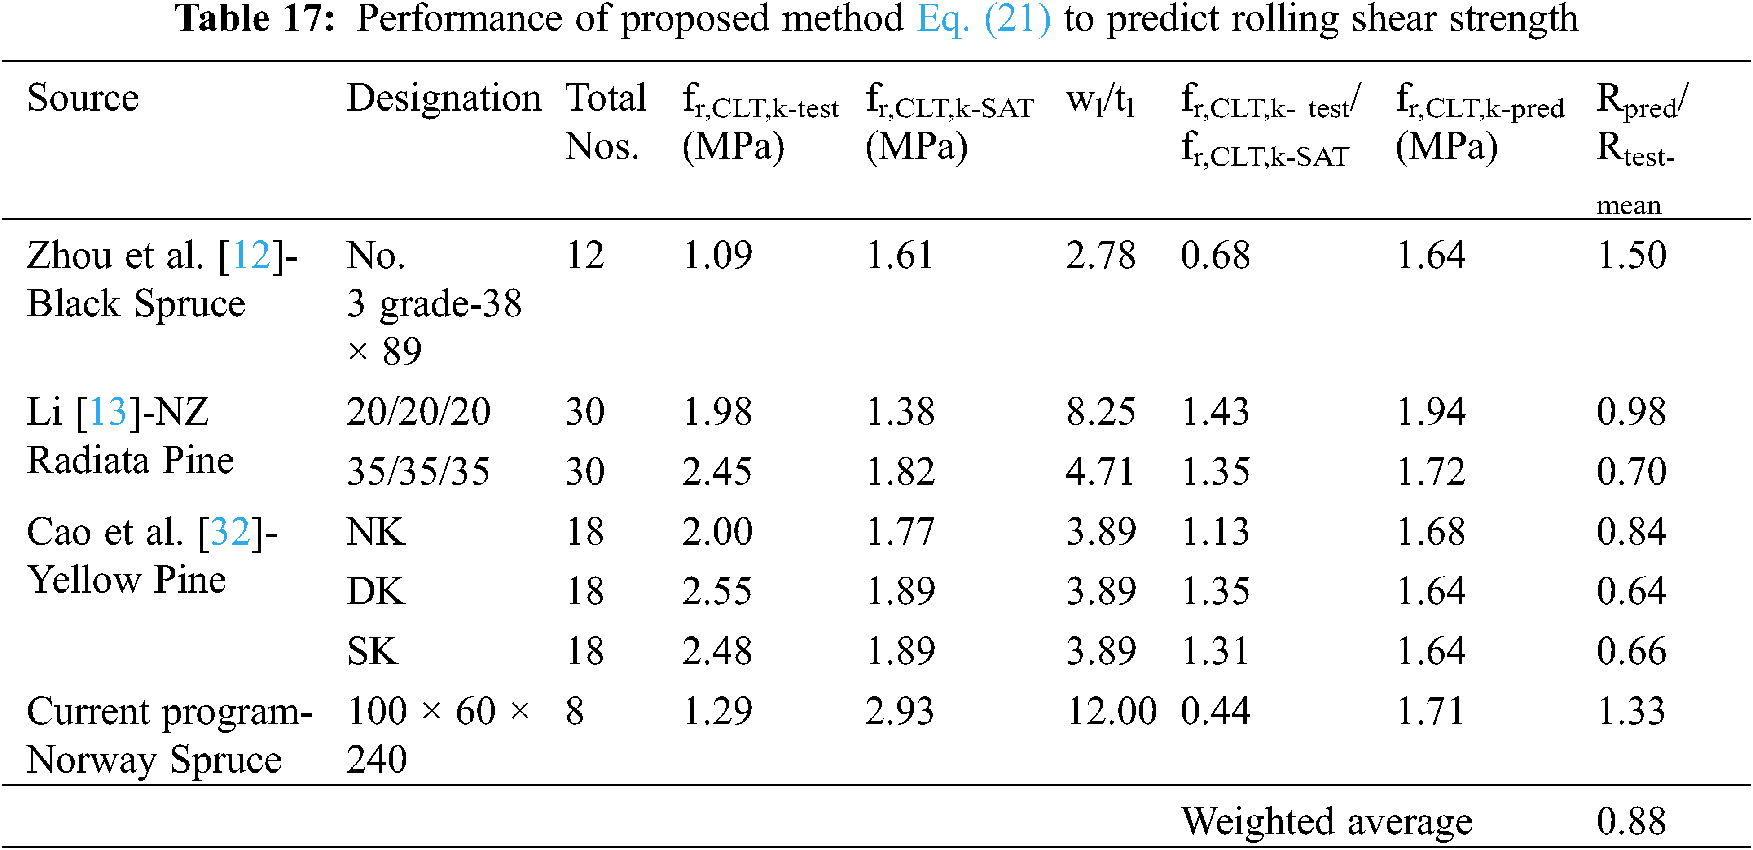
A comparison was presented in Table 17 between experimental results obtained from planar shear test (fr,CLT,k-test) and rolling shear strength obtained using shear analogy theory (fr,CLT,k-SAT), with the intention to develop a relationship. This comparison reveals that there are significant differences between experimental rolling shear strength and that obtained using the theory, which reassures the requirement to develop a relationship between these two. It can be noted that in addition to shear analogy theory, there are other existing theoretical methods to obtain the rolling shear strength as discussed in previous sections (Table 2). However, shear analogy method was chosen over these methods due to its accuracy over the other methods as reported in previous research [26]. Furthermore, shear analogy method is commonly used by other researchers for short span bending test to determine rolling shear strength.
Using the data available in the literature and results from current experiment, a new equation is proposed in Eq. (21), which considers the rolling shear strength from shear analogy theory fr,CLT,k-SAT and the width-to-thickness ratio of the lamella wl/tl. The coefficients in Eq. (21) were derived from nonlinear regression using the data reported in Table 17. The performance of Eq. (21) was also presented in Table 17, which shows the equation can conservatively predict rolling shear strength with a weighted average of Rpred /test-mean = 0.88.
Four different types of experiments were conducted to determine the tensile, compressive, and rolling shear strength of CLT specimen. For tension and compression, CLT samples were tested for both major and minor axis orientations. As expected, major axis samples demonstrated higher strength compared to minor axis. In tension, the difference between major and minor axes samples was 6.56%, while for compression this difference was found to be 31.39%. For rolling shear, the strengths obtained using the planar shear tests were found to be approximately 10%–20% lower than that calculated using theoretical method using the results from short span bending tests. A review of existing design equations to obtain tensile, compressive, and rolling shear strengths were presented, and it was revealed that the prediction accuracy varies greatly ranging from highly conservative, nearly accurate and over-predictive. As most of the available equations were developed from local species (Asian or European) and specific type of CLT specimen arrangements, these equations are mostly accurate within their corresponding scope. The current study modified the available equations for tensile and compressive strength predictions using data from European, Asian, and North American species based on non-linear regression. The accuracy of the proposed models was found to be 92% for tension and 82% for compression strength of CLT. Lastly, a relationship between rolling shear strengths obtained from planar shear test and short span bending test was established based on the experimental results of the current research and data reported in literature. Alike tensile and compressive predictions, this relationship also yielded 88% accuracy when used to predict rolling shear capacity based on the results from short span bending test.
Acknowledgement: The authors would like to thank Mr. Mitchell Thomas, Mr. Aiden Thompson, Mr. Matt Quinn and Mr. Sajidur Rahman for their contribution to this project. Also, the authors express their gratitude to Mr. Lube Veljanoski and Dr. Muhammad Ikramul Kabir for their support in this project.
Funding Statement: The authors received no specific funding for this study.
Conflicts of Interest: The authors declare that they have no conflicts of interest to report regarding the present study.
1. Chen, Y., Lam, F. (2013). Bending performance of box-based cross-laminated timber systems. Journal of Structural Engineering, 139(12), 4013006. DOI 10.1061/(ASCE)ST.1943-541X.0000786. [Google Scholar] [CrossRef]
2. Muñoz, F., Tenorio, C., Moya, R., Navarro-Mora, A. (2022). CLT fabricated with Gmelina arborea and Tectona grandis wood from fast-growth forest plantations: Physical and mechanical properties. Journal of Renewable Materials, 10(1), 1–17. DOI 10.32604/jrm.2022.017392. [Google Scholar] [CrossRef]
3. He, M., Sun, X., Li, Z. (2018). Bending and compressive properties of cross-laminated timber (CLT) panels made from Canadian hemlock. Construction and Building Materials, 185(9), 175–183. DOI 10.1016/j.conbuildmat.2018.07.072. [Google Scholar] [CrossRef]
4. Li, X., Ashraf, M., Subhani, M., Kafle, B., Kremer, P. (2019). Resistance of cross laminated timber members under axial loading—A review of current design rules in CIGOS 2019. Innovation for Sustainable Infrastructure. Berlin, Germany: Springer. [Google Scholar]
5. Sikora, K. S., McPolin, D. O., Harte, A. M. (2016). Effects of the thickness of cross-laminated timber (CLT) panels made from Irish sitka spruce on mechanical performance in bending and shear. Construction and Building Materials, 116(2), 141–150. DOI 10.1016/j.conbuildmat.2016.04.145. [Google Scholar] [CrossRef]
6. Brandner, R., Schickhofer, G. (2014). Spatial correlation of tensile perpendicular to grain properties in Norway spruce timber. Wood Science and Technology, 48(2), 337–352. DOI 10.1007/s00226-013-0606-z. [Google Scholar] [CrossRef]
7. Ido, H., Nagao, H., Harada, M., Kato, H., Ogiso, J. et al. (2016). Effects of the width and lay-up of sugi cross-laminated timber (CLT) on its dynamic and static elastic moduli, and tensile strength. Journal of Wood Science, 62(1), 101–108. DOI 10.1007/s10086-015-1527-2. [Google Scholar] [CrossRef]
8. Brandner, R. (2018). Cross laminated timber (CLT) in compression perpendicular to plane: Testing, properties, design and recommendations for harmonizing design provisions for structural timber products. Engineering Structures, 171(1/2), 944–960. DOI 10.1016/j.engstruct.2018.02.076. [Google Scholar] [CrossRef]
9. Oh, J. K., Lee, J. J., Hong, J. P. (2015). Prediction of compressive strength of cross-laminated timber panel. Journal of Wood Science, 61(1), 28–34. DOI 10.1007/s10086-014-1435-x. [Google Scholar] [CrossRef]
10. Pang, S. J., Jeong, G. Y. (2018). Load sharing and weakest lamina effects on the compressive resistance of cross-laminated timber under in-plane loading. Journal of Wood Science, 64(5), 538–550. DOI 10.1007/s10086-018-1741-9. [Google Scholar] [CrossRef]
11. Aicher, S., Christian, Z., Hirsch, M. (2016). Rolling shear modulus and strength of beech wood laminations. Holzforschung, 70(8), 773–781. DOI 10.1515/hf-2015-0229. [Google Scholar] [CrossRef]
12. Zhou, Q., Gong, M., Chui, Y. H., Mohammad, M. (2014). Measurement of rolling shear modulus and strength of cross laminated timber fabricated with black spruce. Construction and Building Materials, 64(3), 379–386. DOI 10.1016/j.conbuildmat.2014.04.039. [Google Scholar] [CrossRef]
13. Li, M. (2017). Evaluating rolling shear strength properties of cross-laminated timber by short-span bending tests and modified planar shear tests. Journal of Wood Science, 63(4), 331–337. DOI 10.1007/s10086-017-1631-6. [Google Scholar] [CrossRef]
14. Li, M., Lam, F., Li, Y. (2014). Evaluating rolling shear strength properties of cross laminated timber by torsional shear tests and bending tests. World Conference in Timber Engineering, pp. 10–14. Quebec City, Canada. [Google Scholar]
15. Ehrhart, T., Brandner, R., Schickhofer, G., Frangi, A. (2015). Rolling shear properties of some European timber species with focus on cross laminated timber (CLTTest configuration and parameter study. International Network on Timber Engineering Research: Proceedings of Meeting 48. Timber Scientific Publishing, KIT Holzbau und Baukonstruktionen. [Google Scholar]
16. Unterwieser, H., Schickhofer, G. (2013). Characteristic values and test configurations of CLT with focus on selected properties. COST FP1004 CLT Conference, pp. 21–22. Graz, Austria. [Google Scholar]
17. Gagnon, S., Pirvu, C. (2011). CLT handbook-Canadian edition. Quebec, Canada: Library and Archives Canada. [Google Scholar]
18. Karacebeyli, E., Douglas, B. (2013). CLT handbook (US edition). Point-Claire, Quebec: FPInnovations and Binational Softwood Lumber Council. [Google Scholar]
19. Swedish Wood (2019). The CLT handbook. Stockholm, Sweden. [Google Scholar]
20. Ministry of Agriculture, F. A. F (2013). Japanese agricultural standard for cross-laminated timber. Tokyo, Japan. [Google Scholar]
21. DIN EN 16351 (2018). Timber structures-cross laminated timber-requirements (German and English version prEN 16351:2018), pp. 196, Berlin, Germany: German Institute for Standardisation (Deutsches Institut für Normung). [Google Scholar]
22. Association, A. T. E. W. (2018). ANSI/APA PRG 320: 2018: Standard for performance-rated cross-laminated timber. Tacoma, WA: APA-The Engineered Wood Association. [Google Scholar]
23. EN 338 (2009). Structural timber-strength classes. Brussels, Belgium: European Committee for Standardization. [Google Scholar]
24. ASTM International (2009). Standard test methods of static tests of lumber in structural sizes. Pennsylvania: ASTM D198, ASTM International West Conshohocken. [Google Scholar]
25. Standards Australia (2010). AS/NZS 4063.1: Characterization of structural timber test methods. Standards Australia, NSW. [Google Scholar]
26. Bogensperger, T., Silly, G., Schickhofer, G. (2012). Comparison of methods of approximate verification procedures for cross laminated timber. Graz, Austria: Institute for Timber Engineering and Wood Technology Management. [Google Scholar]
27. BS EN 14358 (2016). Timber structures-calculation and verification of characteristic values. Brussels, Belgium: CEN. [Google Scholar]
28. Brandner, R., Flatscher, G., Ringhofer, A., Schickhofer, G., Thiel, A. (2016). Cross laminated timber (CLTOverview and development. European Journal of Wood and Wood Products, 74(3), 331–351. DOI 10.1007/s00107-015-0999-5. [Google Scholar] [CrossRef]
29. Standards, B. (2012). BS EN 408: 2010 + A1: 2012: Timber structures—Structural timber and glued laminated timber—determination of some physical and mechanical properties. London, UK: BSI Standards Publication. [Google Scholar]
30. Ogawa, K. (2018). Estimation of tensile strength distribution of orthogonal laminated plates by Monte Carlo method. Material, 67(12), 1087–1093 (in Japanese). DOI 10.2472/jsms.67.1087. [Google Scholar] [CrossRef]
31. Gong, M., Tu, D., Li, L., Chui, Y. (2015). Planar shear properties of hardwood cross layer in hybrid cross laminated timber. 5th International Scientific Conference on Hardwood Processing, pp. 15–17. Québec City, Canada. [Google Scholar]
32. Cao, Y., Street, J., Li, M., Lim, H. (2019). Evaluation of the effect of knots on rolling shear strength of cross laminated timber (CLT). Construction and Building Materials, 222, 579–587. DOI 10.1016/j.conbuildmat.2019.06.165. [Google Scholar] [CrossRef]
33. Canadian Standards Association (2019). Engineering design in wood. Ottawa, Ontario, Canada. [Google Scholar]
34. Hong, J. P., Lee, J. J., Park, M. J., Yeo, H., Pang, S. J. et al. (2015). Determination of grades and design strengths of machine graded lumber in Korea. Journal of the Korean Wood Science and Technology, 43(4), 446–455 (in Korean). DOI 10.5658/WOOD.2015.43.4.446. [Google Scholar] [CrossRef]
 | This work is licensed under a Creative Commons Attribution 4.0 International License, which permits unrestricted use, distribution, and reproduction in any medium, provided the original work is properly cited. |