| Journal of Renewable Materials |
DOI: 10.32604/jrm.2022.019608
ARTICLE
Short-Term and Long-Term Effects of Natural and Artificial Carbonaceous Substrates on Greenhouse Gas Fluxes
1Leibniz Institute for Agricultural Engineering and Bioeconomy e.V. (ATB), Potsdam, 14469, Germany
2TCKON Engineering Services Dr.-Ing. York Neubauer, Berlin, 13088, Germany
3Embrapa Soils, Rio de Janeiro, 24600-000, Brazil
*Corresponding Author: Jürgen Kern. Email: jkern@atb-potsdam.de
Received: 01 October 2021; Accepted: 23 November 2021
Abstract: The emissions of two greenhouse gases (GHG), carbon dioxide (CO2) and nitrous oxide (N2O), from six substrates with different carbonaceous content were compared in short and long-term incubation experiments. Three natural soils and three artificial chars were mixed with carbon (C) poor soil (Cambisol) to simulate real conditions after application of char to farmland. The natural soils were a Cambisol, an Anthrosol and a Histosol with C contents of 1.3%, 4.4% and 13.2%, respectively. The three chars produced through thermal conversion of wood chips by hydrothermal carbonisation (HTC), fluidized bed gasification and pyrolysis had C contents of 56.9%, 75.4% and 79.9%, respectively. Emission rates of CO2 and N2O from the rewetted substrates were measured by gas chromatography over a short time of 72 h and over a long period of nearly two years. The short-term CO2 emissions from the natural soils showed a clear relationship to their C content. The emission rate for the Histosol/Cambisol mixture was three times higher than that for the pure Cambisol, 77.1 vs. 23.5 mg CO2-C kg−1 organic matter (OM) per hour. The C emission rates for the char/Cambisol mixtures were much lower, ranging between 3.0 and 9.1 mg CO2-C kg OM−1 h−1, and did not correspond to their total C contents. Comparison between the two incubation lengths showed that the long-term CO2 emission rates were generally one order of magnitude lower than the short-term rates. The final emission rates for natural substrates over a period of two years were still twice those for artificial char substrates, between 2.2–3.5 mg CO2-C kg OM−1 h−1 and 1.3–1.8 mg CO2-C kg OM−1 h−1, respectively. Although the contents of total nitrogen (Ntot) and extractable nitrogen (Nmin) were considerable in the chars under study, enhanced N2O release was not observed in the incubation experiments. Instead, N2O emission rates in the three mixtures of chars and Cambisol were lower by one to two orders of magnitude compared to the pure Cambisol in short-term incubations. Even long-term N2O emissions were 5 to 9 times lower. The highest degree of N2O reduction was found for the HTC char. Because of the high global warming potential of N2O, this positive effect of chars may play an important role in mitigating emissions of CO2 equivalents. Both CO2 and N2O must be taken into account when balancing GHG emitted after chars (biochar, gasifier char, HTC char) are applied to soil.
Keywords: Biochar; HTC char; incubation experiment; GHG; carbon stability
The estimated net surface fluxes of the greenhouse gases CO2, CH4 and N2O have been increasing over recent decades, reaching atmospheric levels of 410 ppm, 1866 ppb and 332 ppb, respectively [1]. They are important drivers of the change to our climate. Increasing mean annual temperatures and intensified soil management are expected to decrease soil fertility through accelerated decomposition of soil organic matter (SOM). An assessment of the C budget of European croplands from different climatic regions and with contrasting crop rotations showed that C is being lost on an average of 95 g C m−2 yr−1 and it is occurring even when good agricultural management practices are applied [2]. This ongoing humus loss points to the need for new guidelines on how to maintain or, even better, to increase the soil C content [3].
One way to counteract the expected loss of SOM may be the application of charred biomass, which is produced by thermal conversion of different types of biomass under oxygen-limited conditions (hydrothermal carbonisation (HTC), pyrolysis and gasification). The C content of such chars can range up to 80% [4], and their application to soils may be able to reduce GHG emissions or sequester C in the soil for a long-term. The best-known and probably oldest example of C-enriched and sustainably fertile soil horizons is the Amazonian Dark Earth locally called Terra Preta de Índio, dark earth patches of pretic Anthrosols found in the Amazon region [5,6]. It is the result of long-term human settlement, which led to addition of charred residues and household wastes including human excrement, together with pottery shards [7].
Positive effects of chars can be found after application to soil [8], such as the improvement of soil structure, enhanced water retention [9] and the reduction of GHG emissions [10–12]. Although research on biochars and similar substrates has increased rapidly over the last years [13], there are still open questions regarding the characterisation of chars [14]. The C stability is one of the key properties of chars used as soil conditioners, since all environmental benefits depend on their longevity in soil [15–17]. Scientific consensus exists that, due to its inherent properties, the application of biochar to soil at a specific site is expected to sequester C, thereby reducing CO2 emissions to the atmosphere [18]. In most cases a high C content of the char is desired, which may also be related to its stability and resilience. The mean residence times (MRT) of chars in soil have been found to vary from decades to millennia. Steinbeiss et al. [19] reported a range of MRT for HTC char between 4 and 29 years in contrast to the MRT given for pyrolysis biochar of about 2000 years [20]. Increased temperatures in the charring process result in an advanced condensation of aromatic compounds in the chars, which explains their reduced accessibility to microorganisms. Furthermore, the length of the incubation period plays a crucial role in the calculated half-life of chars that do not follow a linear decay due to C pools with different degrees of stability [14]. Besides the question of char stability in the soil, another important point is the nutrient supply of soils in the presence of char substrates. Biochars may adsorb ammonium, nitrate, phosphate, and other ions and may form a nutrient pool more or less available for plant roots and microorganisms [21,22].
The objective of this study is to compare the effect of six substrates with different carbonaceous content on the rate of C mineralisation to CO2 and the production of N2O emissions in soil. In short and long-term incubation experiments, real conditions after application of char to farmland are simulated by mixing three different carbonaceous products from thermal conversion and three different natural soils with C-poor Cambisol. The overall goal is to obtain information about the long-term effects of different types of char on GHG fluxes and to evaluate if char application to soil might be a reliable way to sequester C sustainably.
2.1 Origin and Processing of Carbonaceous Substrates
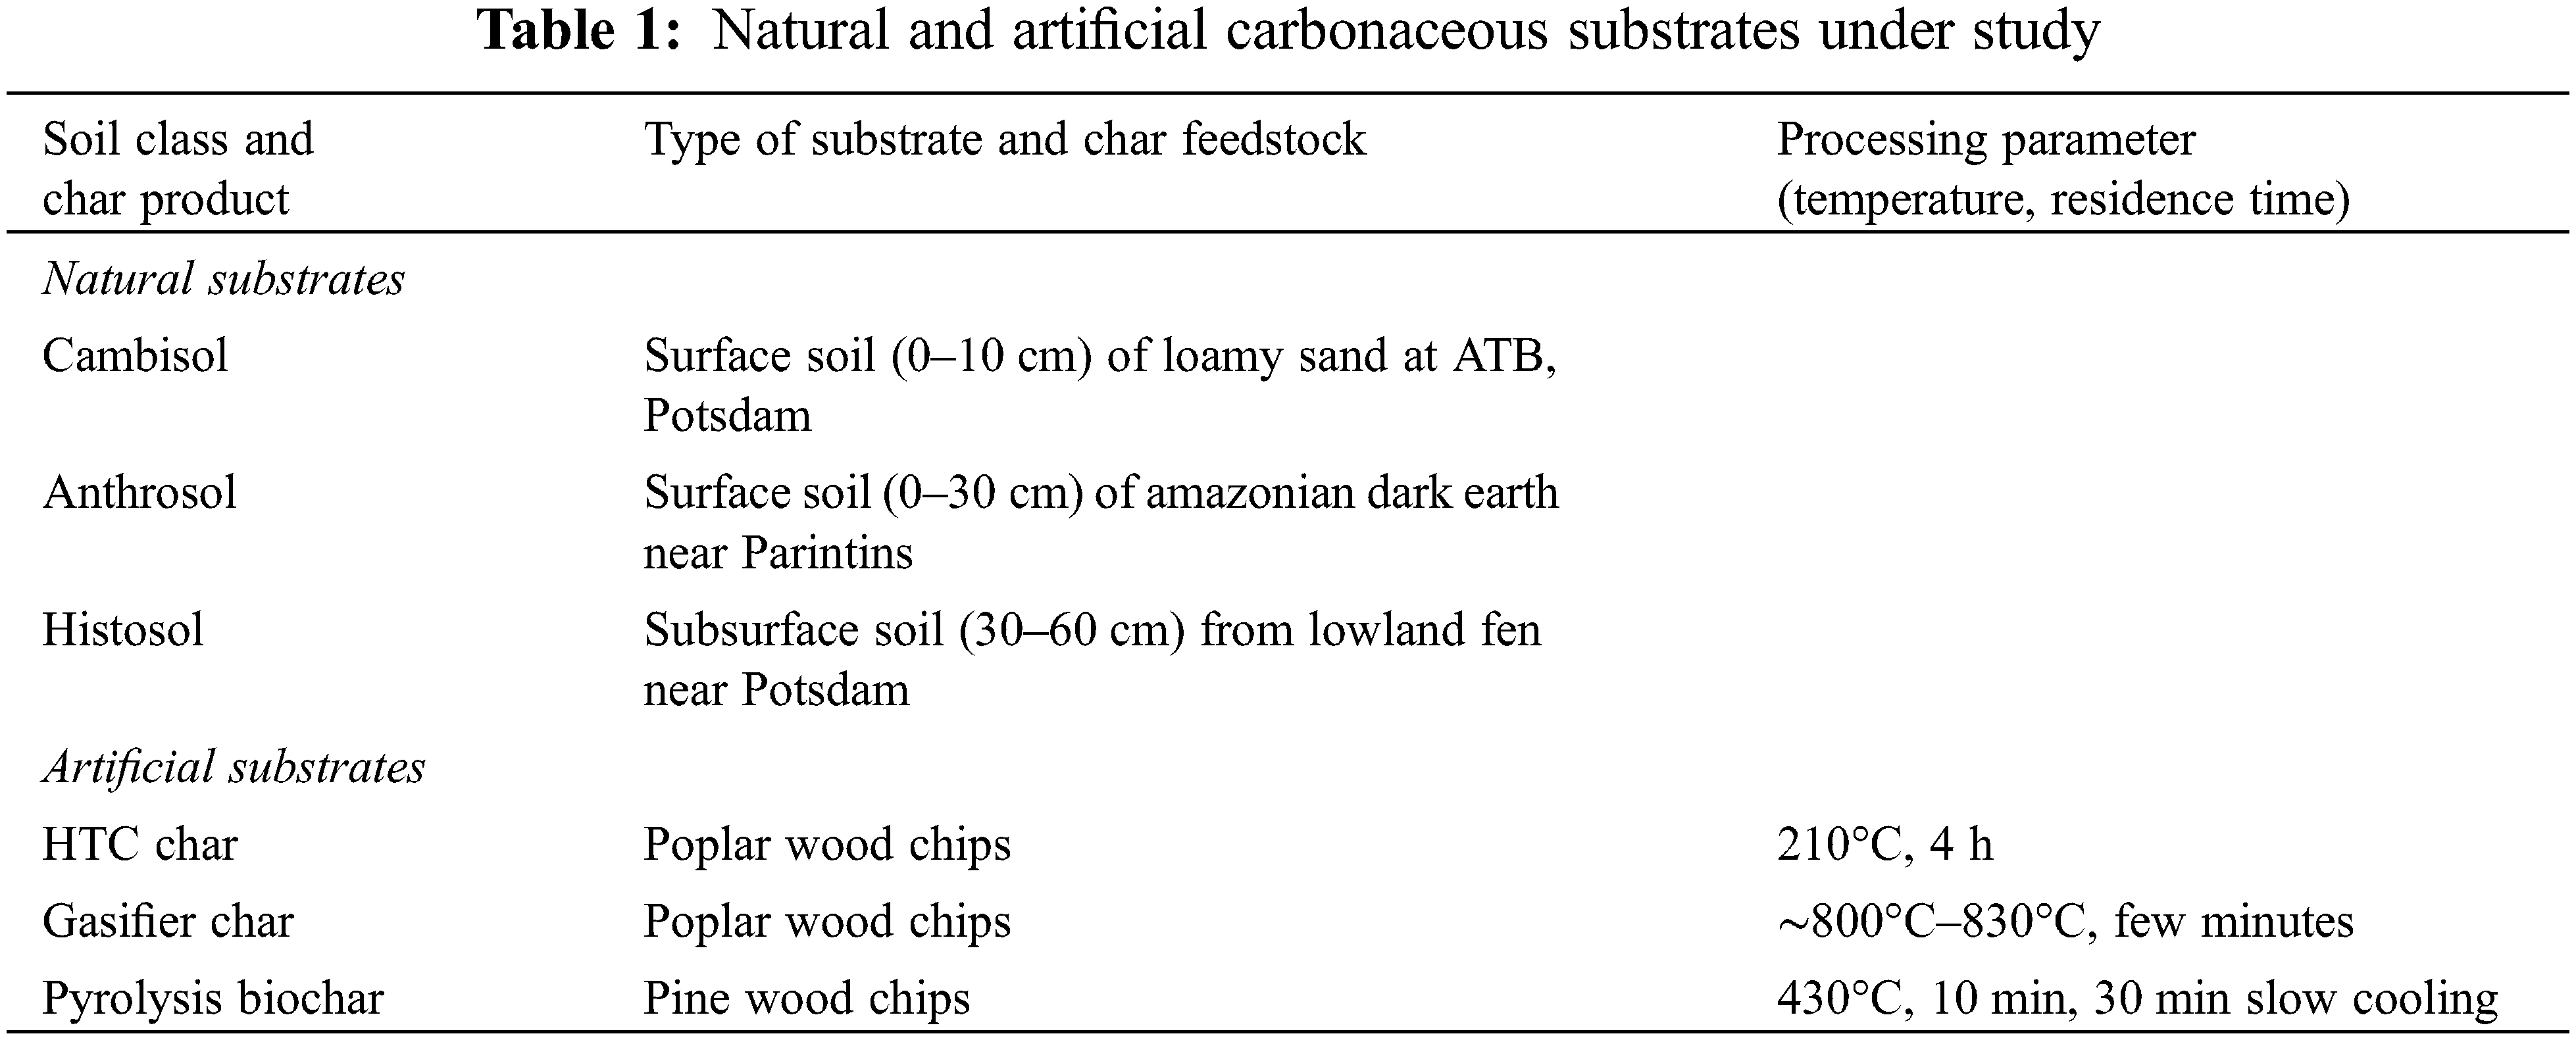
This study covers six substrates listed in Table 1 that differ in their carbonaceous content (Table 2). Among the three natural substrates are i) Cambisol from a short rotation coppice at the Leibniz Institute for Agricultural Engineering and Bioeconomy (ATB), Potsdam, ii) Anthrosol, an Amazonian Dark Earth from Central Amazonia and iii) Histosol from the subsurface of a riparian zone near Potsdam. The Cambisol, poor in organic matter, also served as inoculum for all substrates under study. The three artificial substrates are i) HTC char, which is a product from HTC of poplar wood operated at 210°C, ii) gasifier char, which derives from gasification of poplar wood in a fluidised bed operated at ∼800°C–830°C and iii) biochar from pyrolysis of pine wood at 430°C. After the chars were produced, they were stored in sterilised (120°C) glass vials at room temperature for 2–3 months. Before analyses and incubation experiments started, all substrates were prepared by grinding the material finely with a mortar.
2.2 Physical and Chemical Characterisation
The pH value was measured with a glass electrode in aqueous extracts (5 g dry weight in 25 ml deionised water). The organic matter (OM) of the dry matter was obtained after loss on ignition at 550°C when a residual ash was left over (Table 2). Total carbon (Ctot) and total nitrogen (Ntot) were measured by an elemental analyser (Varian CP 3800). Total phosphorus (Ptot) derived from an acid digestion with sulfuric acid using a selenium catalyst. Flow injection analysis was applied to measure Nmin (NH4+, NO3−, NO2−) and PO43− after CaCl2 extraction according to German standard methods [23]. Alkali, alkaline earth metals and heavy metals were measured after digestion in nitric acid at 190°C by ICP (Thermo Scientific ICAP 6000 Series). All values are related to dry weight (DW).
2.3 Design of Incubation Experiments
For the incubation experiments, 3 g of dried Cambisol were mixed with the same volume of carbonaceous substrates and put into sterilised (120°C) 125 ml jars. This resulted in the addition of 3.0 g of Cambisol to the Cambisol and the Anthrosol jar, while the other jars contained 0.6 g of the gasifier char with the lowest density and 1.0 g of Histosol, pyrolysis biochar and HTC char, respectively. All soil/char mixtures, each with six replicates, were rewetted and adjusted to a maximum water holding capacity of 60%–70% in order to enable anaerobic microzones to develop within the aerobic atmosphere. This design tested by Dicke et al. [12] allowed the simulation of wet soil conditions with high microbial activity.
Short-term incubations were run for 72 h and long-term incubations were studied over a period of 639 days at 22°C in the dark. Aerobic conditions were maintained over the whole incubation period. During the short-term incubations, the jars were not opened for the daily measurements. In contrast, for the long-term incubations, the headspace of the bottles was measured every two to three months and the bottles were opened after the measurement for three hours in order to maintain an aerobic atmosphere in the jars (ambient concentrations of CO2, N2O and CH4). In both cases, the short-term and the long-term incubation, 5 ml gas samples were injected into a gas chromatograph (Varian cp-3800) with an oven temperature of 70°C. Gas samples passed a 2 m long packed column (Porapak QSy80/100 2 m × 1/8” SS) for the flame ionisation detector (FID) and a 2 m long packed column (Hayesep D 80/100 2 m × 1/8” SS) for the 63Ni electron capture detector (ECD). Both flow paths were each connected upstream with a pre-column (Hayesep N 80/100 1 m × 1/8” SS).
After chromatographic separation, CO2 was analysed by FID operating at 300°C after methanisation and N2O by ECD operating at 360°C. The carrier gas for the ECD path was nitrogen with a flow rate of 10 ml min−1 and helium for the FID path with the same flow rate of 10 ml min−1. The calibration was done on each day at the beginning of the measurements with 3 different standards prepared by Air Liquide containing the following concentrations: i) 1 ppm CH4 and 0.3 ppm N2O, ii) 2 ppm CH4 and 5 ppm N2O and iii) 5 ppm CH4 and 50 ppm N2O. All flux rates were related to the OM content of the Cambisol and soil/char mixtures filled and incubated in the jars. That means that in both incubation sets (short-term and long-term) the values of accumulated CO2 and N2O were related to the total OM of the substrate mixtures in the glass jars.
Tests were also made with two chars without addition of Cambisol and its associated microorganisms in order to determine the CO2 flux not derived from microbial activities but only from volatilisation. To distinguish between biotic and abiotic processes of CO2 release, 1 g of pure dry chars from pyrolysis and HTC (see Table 1) with 6 replicates were incubated in 125 ml sterilised jars for 20 days. Cumulated CO2 was measured after the beginning at the days 1, 2, 3, 9 and 20.
The effects of the different substrates on cumulative CO2 and N2O emission rates after 72 h in the short-term incubations were tested with a generalised linear model. Since the cumulative emission rates are considered non-negative, a negative binomial distribution with a log link function was used in the one-factorial model. The substrates with six levels comprised the fixed factor. Differences between factor levels were tested with multiple pairwise comparisons, and the resulting p-values were adjusted with a simulation approach to maintain the global significance level of 0.05. The inverse link function was applied to the resulting estimates to present them in the original scale.
For the long-term incubation experiment, eleven measuring points in time were available for the cumulative CO2 and N2O emission rates from each substrate (see Fig. 3). The cumulative emission rates for both gases were log-transformed, and the effects of points in time within substrates were then tested using a repeated measures linear model with a spatial power covariance structure based on the difference of the points in time in days. Similar to the short-term incubation, differences between substrates were tested at all of the eleven points in time with multiple pairwise comparisons using the above-mentioned option to adjust p-values for multiple testing. The results were transformed back to the original scale here as well.
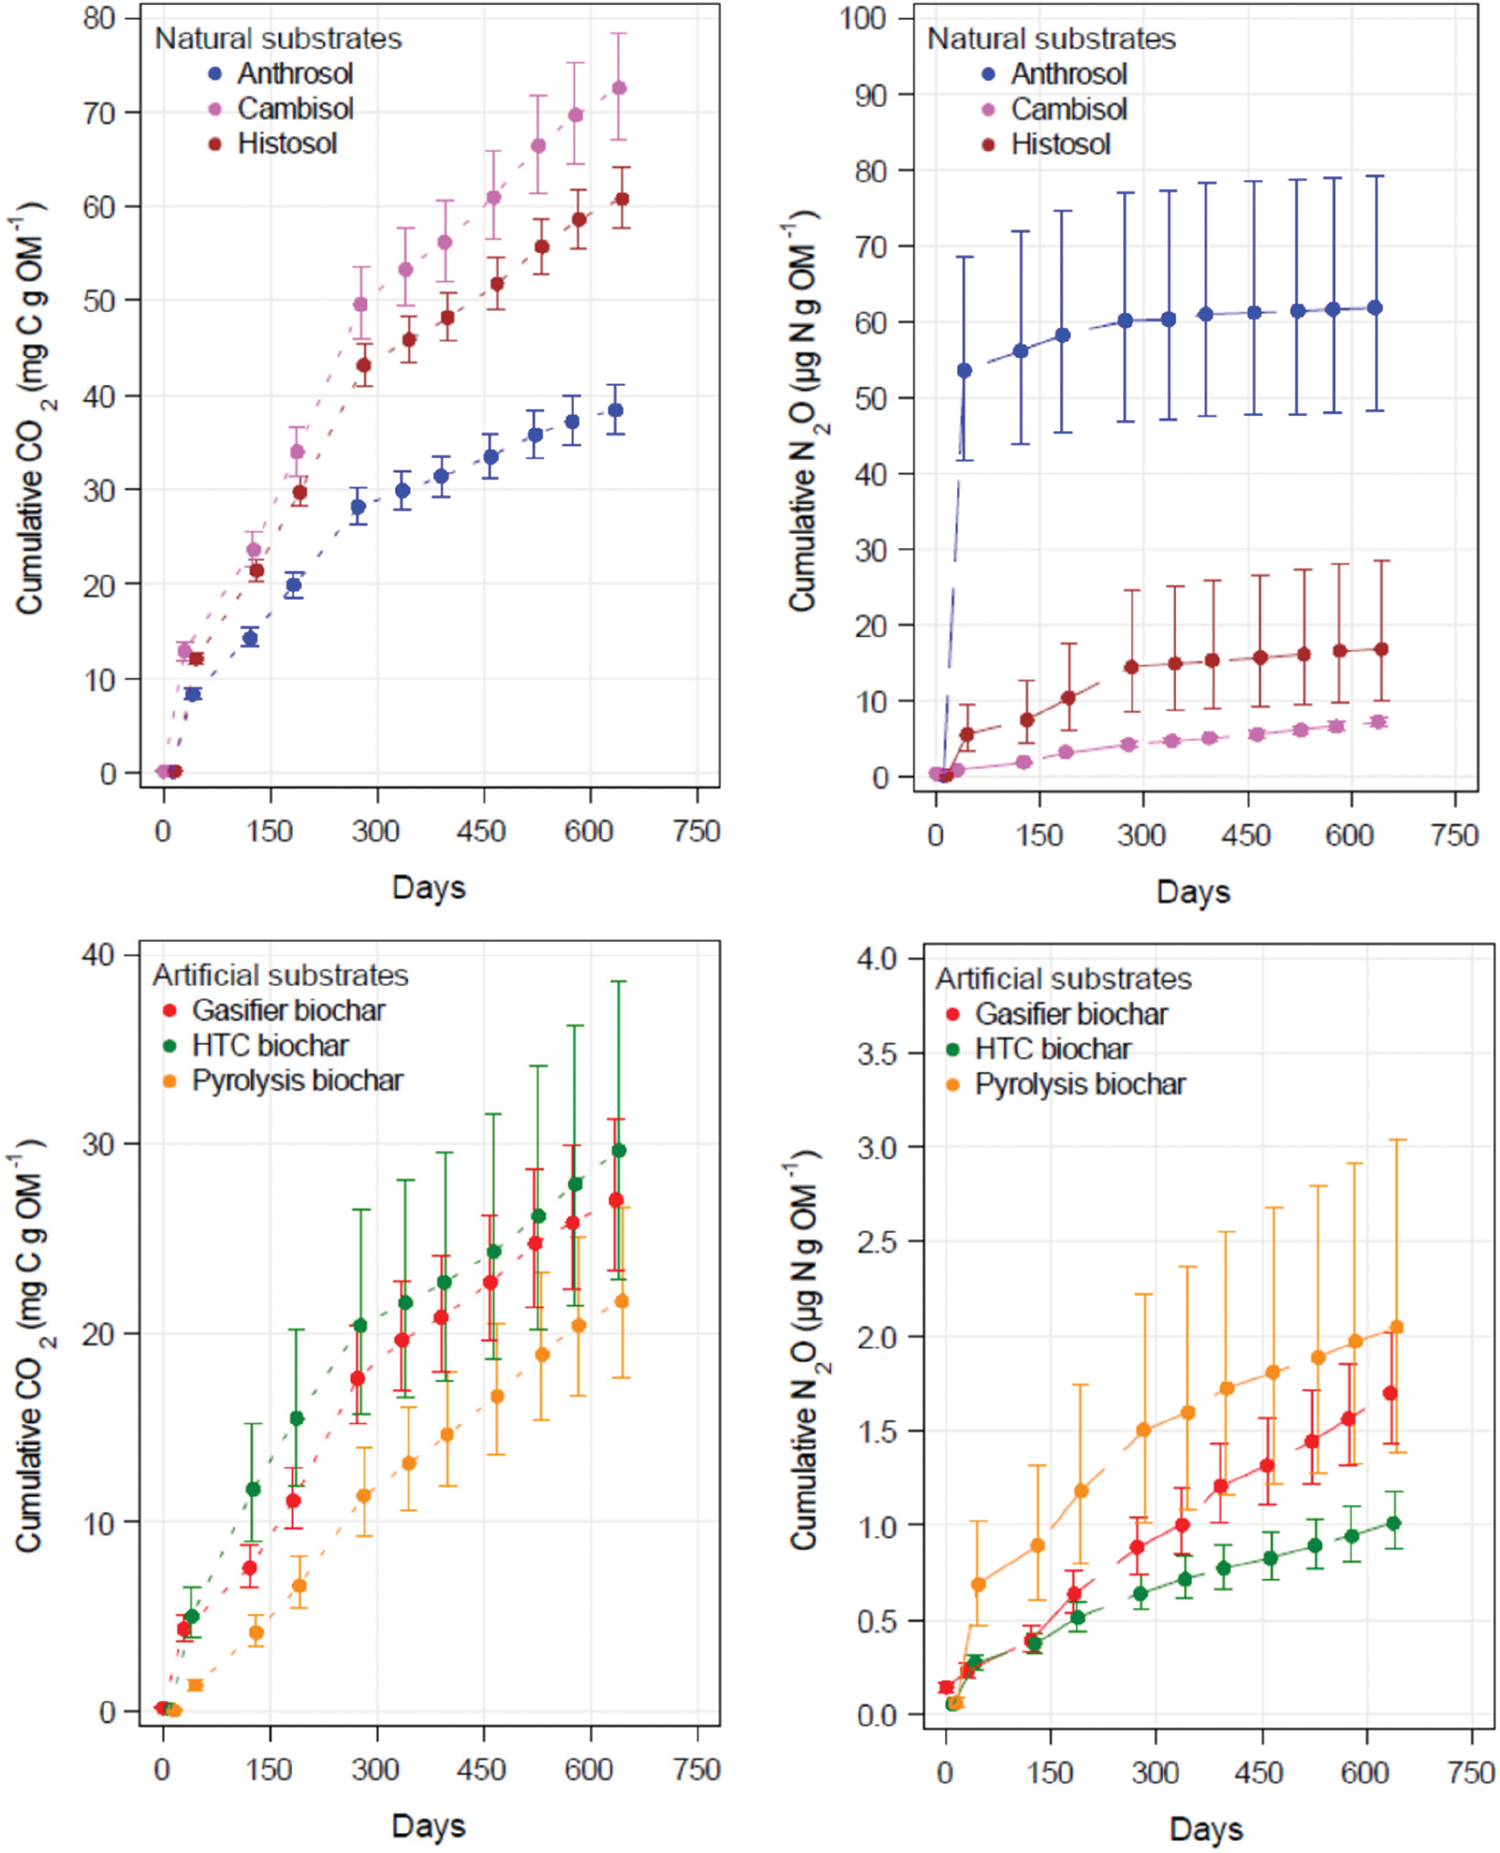
Figure 3: CO2 and N2O emission rates derived from 639 days incubation of natural and artificial substrates mixed with Cambisol. All values are related to the organic matter of the substrates (i.e., the dry ash-free weight)
The GLIMMIX procedure in SAS version 9.4 was used to perform all analyses.
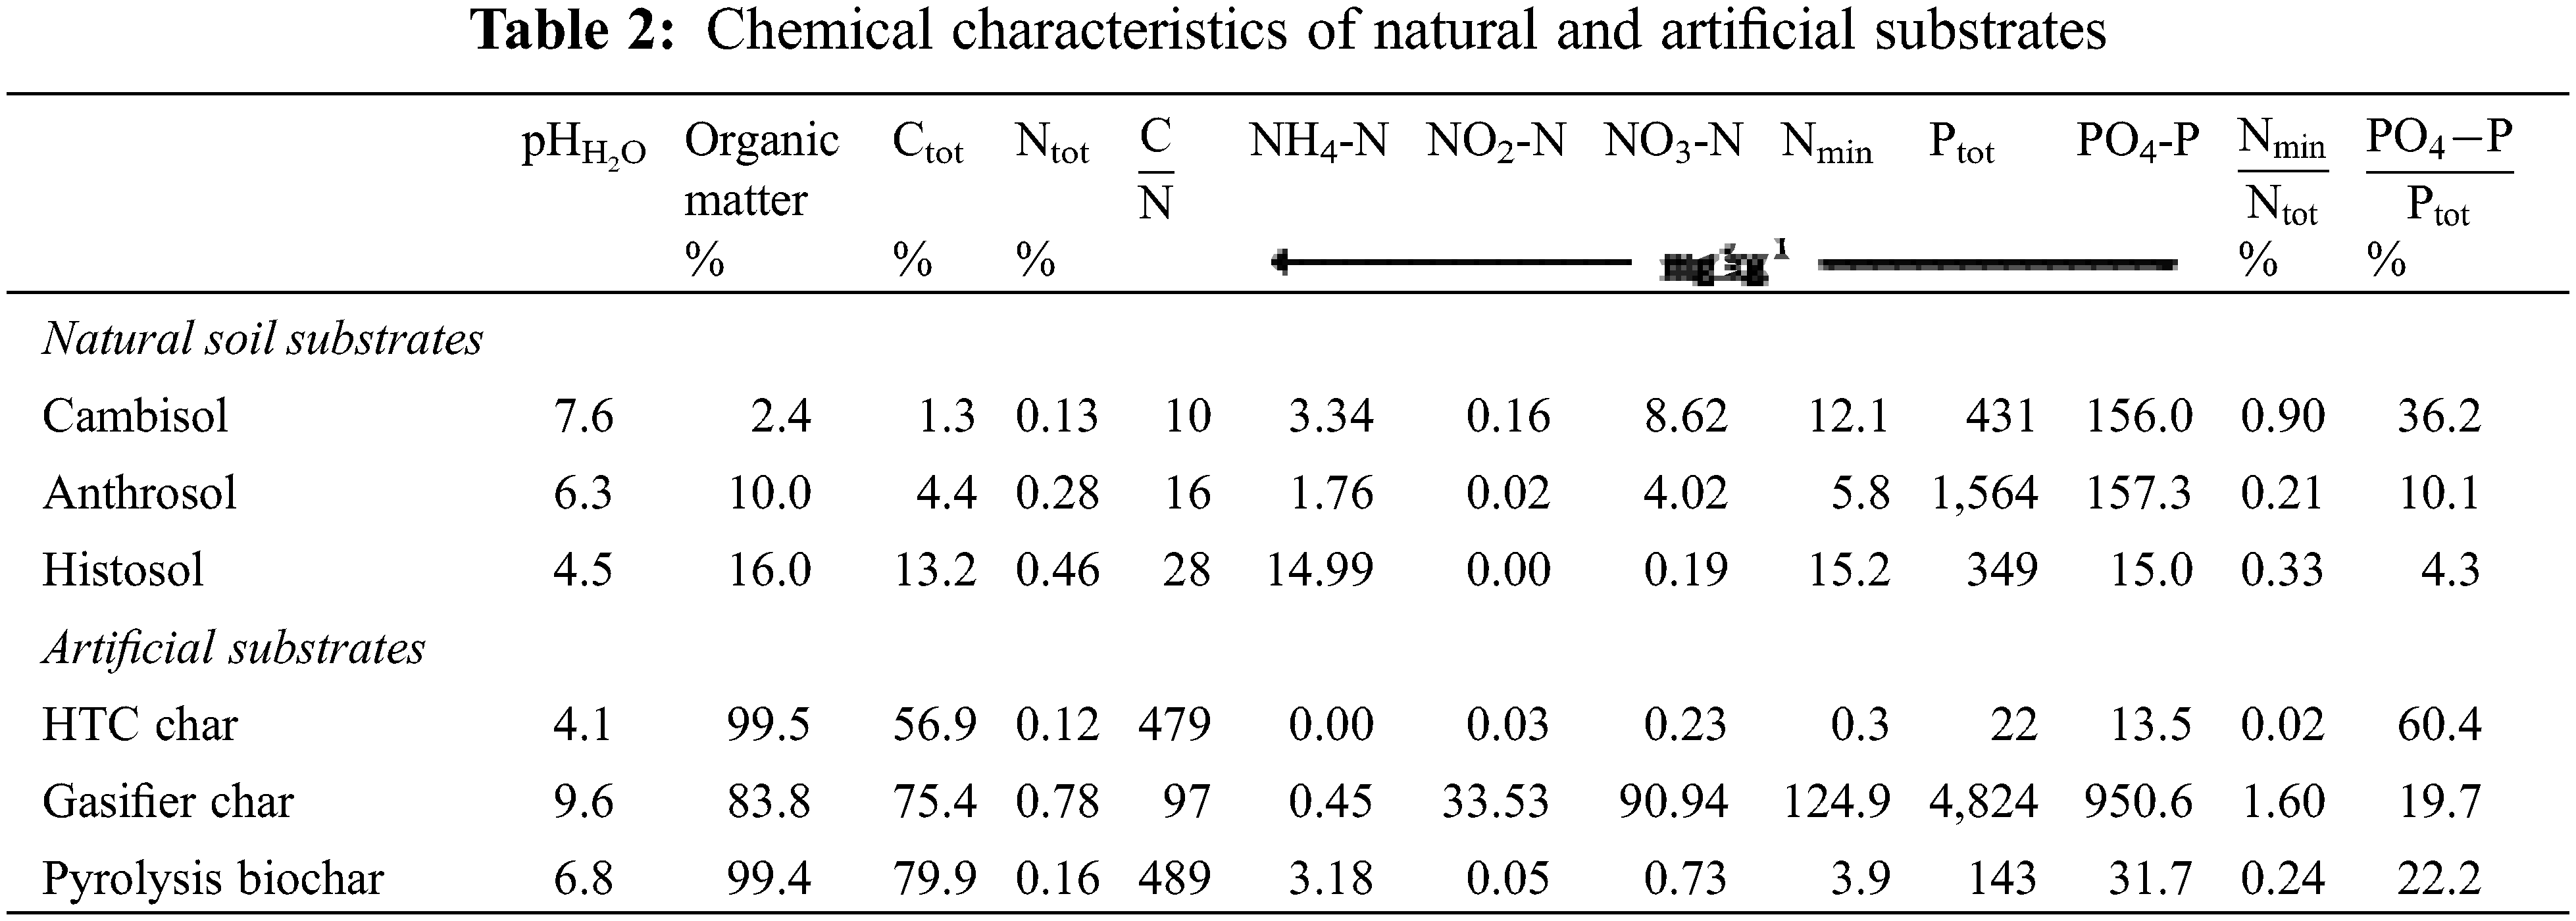
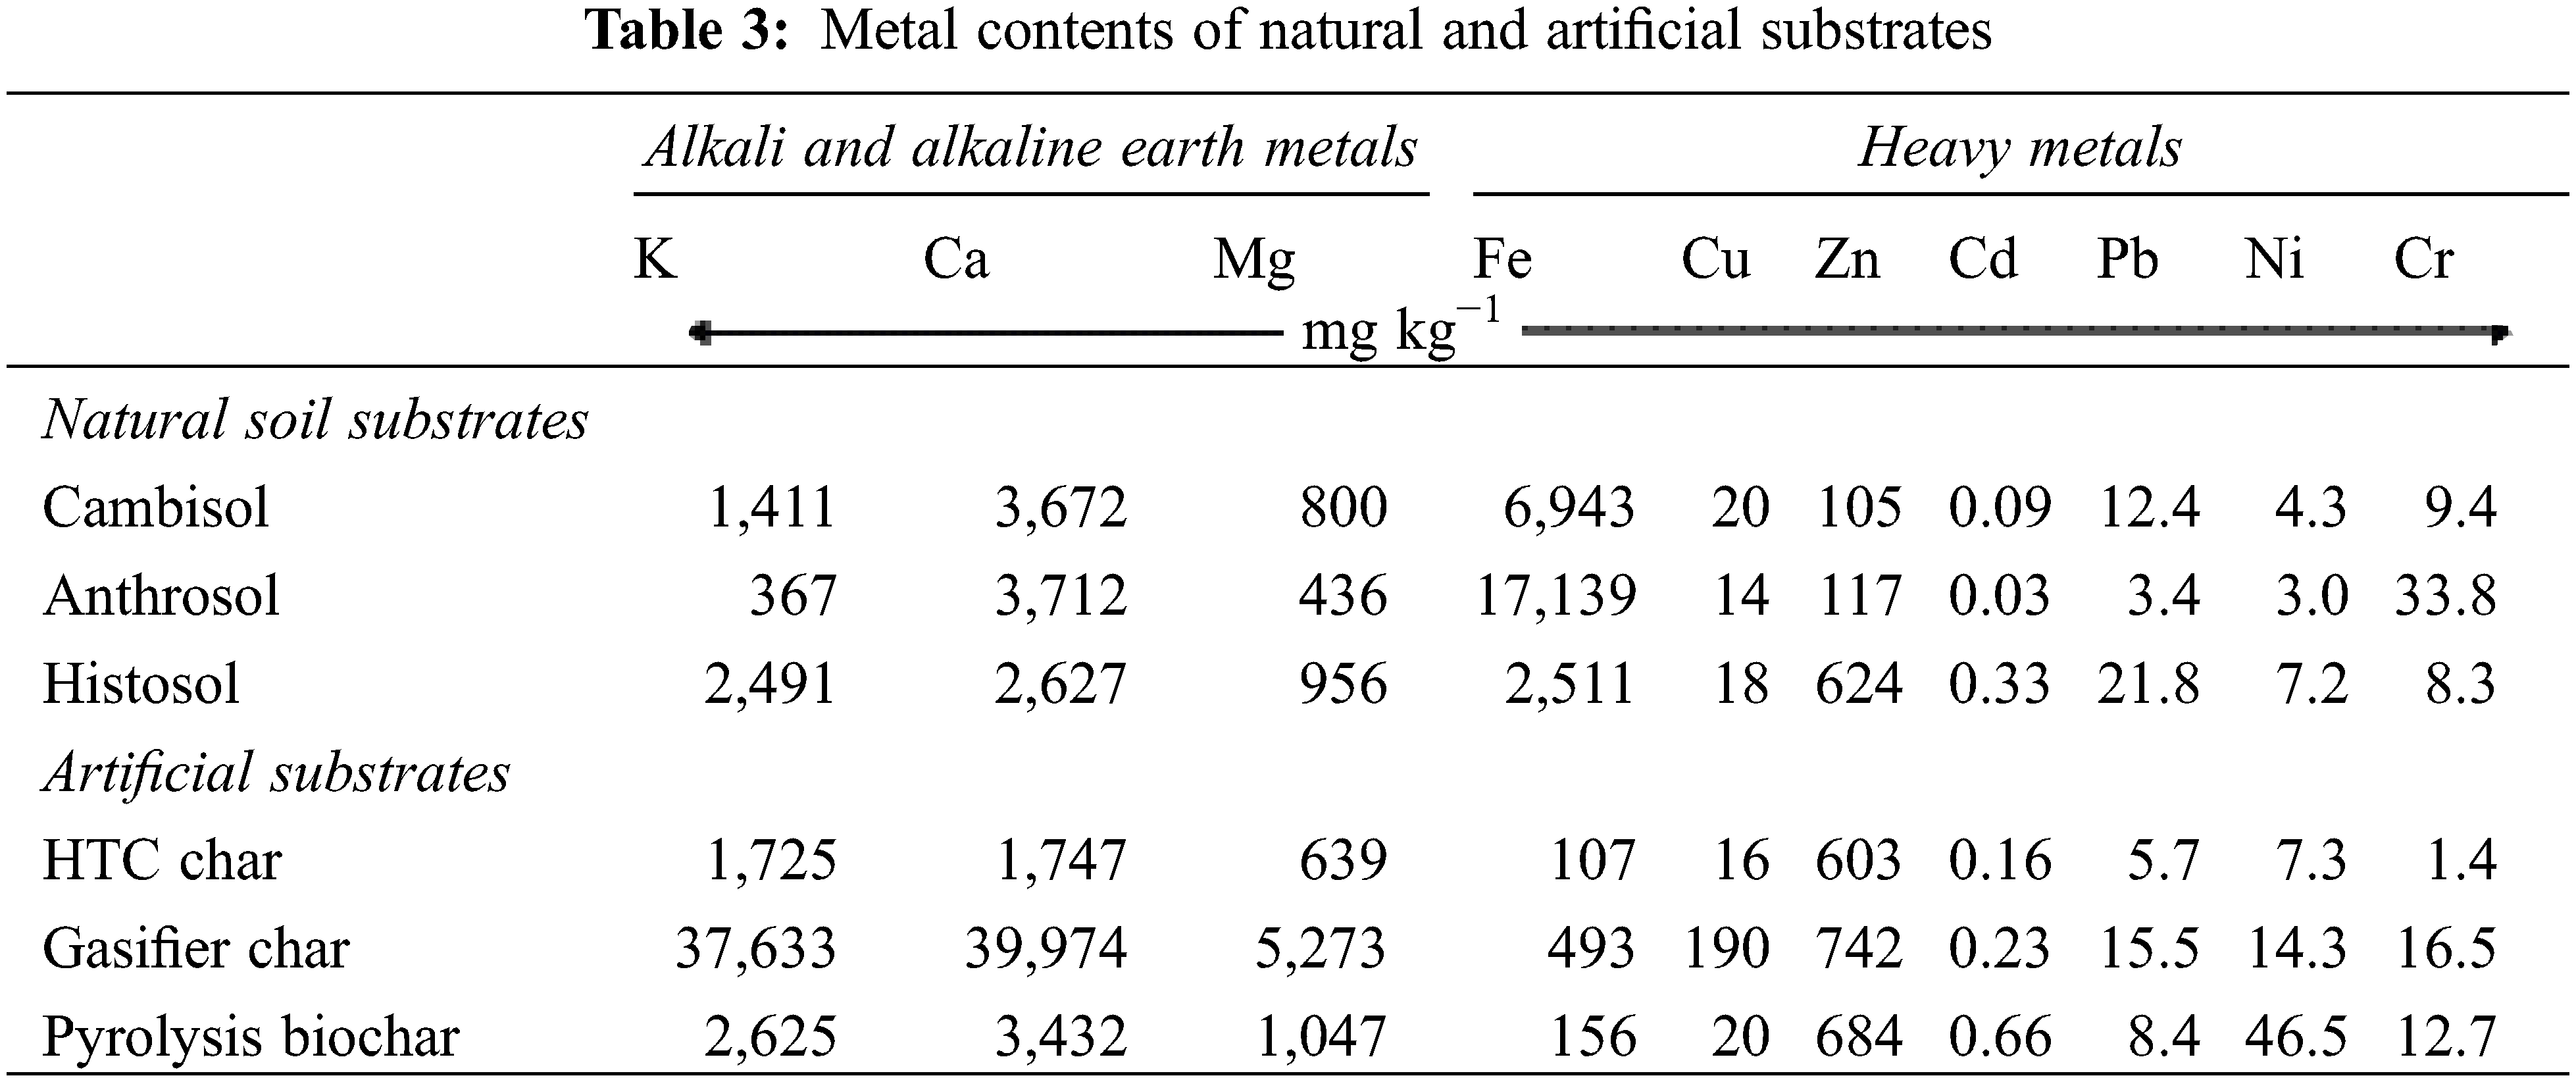
The Cambisol is characterised by a low Ctot content of 1.3% in contrast to the Anthrosol and the Histosol with up to 13.2% (Table 2). However, the chars have much higher Ctot contents, with values between 57% and 80% (Table 2). A similar pattern was found for Ntot with concentrations ranging one to two orders of magnitude lower than those for C. Thus C/N ratios of chars are considerably higher than those found in the natural soils. In contrast to N, the Ptot content of the Anthrosol is rather high compared to Cambisol and Histosol and corresponds to high contents of the potential binding partners, calcium and iron (Table 3).
The availability of N and P in the natural soil substrates is reflected by their extractable fractions ranging between 0.2% and 0.9% for nitrogen and 4% to 36% for phosphorus. The latter corresponds with the pH. Among the artificial substrates, it is obvious that the HTC char and the pyrolysis biochar consist of more than 99% OM. In contrast to these chars, gasifier char is characterised by a relative low OM and by high contents of alkali and alkaline earth metal oxides such as nitrates and phosphates, reflecting a high ash content (Tables 2 and 3). Oxides and carbonates were not measured but have been also attributed to the ash content, which is reasonable due to high calcium contents. Even more important in retaining nutrients might be the pH value, which depends on the carbonisation process used. Acid conditions with pH around 4 as found for the Histosol and the HTC char treatment seem to have reduced the P sorption.
In the natural soil substrates, iron occurs in relatively high amounts, reflecting a part of the mineral soil matrix. The tropical Anthrosol shows higher iron content than the German Cambisol and Histosol (Table 3). The other heavy metals analysed (Zn, Cd, Pb, Ni, Cr) are below the thresholds of EBC recommendations for biochar application in European soils [24].
3.2 CO2 Release from Pure Chars
In order to answer the question whether the CO2 emitted is really a microbial product of the char being mineralised or whether it results from desorption and thus a physical process, one incubation experiment was made with two chars alone (pyrolysis and HTC) without any soil amendment. Over a period of 20 days, there was an increase in CO2 in the closed bottles (Fig. 1) explained by volatilisation. Microbial activity could be excluded in the chars, which were thermochemically formed at temperatures above 200°C.
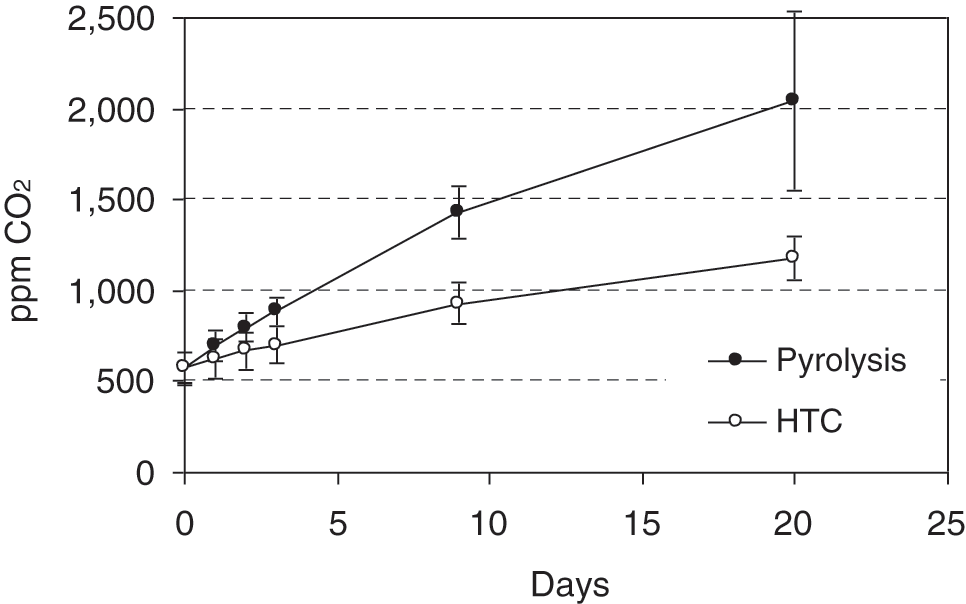
Figure 1: Release of carbon dioxide from pure char substrates
Carbon dioxide accumulation in the pyrolysis and HTC char trials became significantly different over the incubation. After 20 days, the values of CO2 from pyrolysis biochar were nearly twice as high as those for HTC char. This may be explained by their different porosity, which is higher for chars from pyrolysis compared to HTC [25]. Furthermore, the type of feedstock and the processing method may have affected the sorption of CO2 and volatile organic compounds and, subsequently, their desorption from biochars [26] and HTC chars [27]. Compared to the CO2 emitted from wet soil char mixtures (shown in Fig. 2), the amount of CO2 released abiotically from the chars accounts for only 0.7% and 1.5% of the total CO2 measured after three days in the HTC and pyrolysis mixtures, respectively.
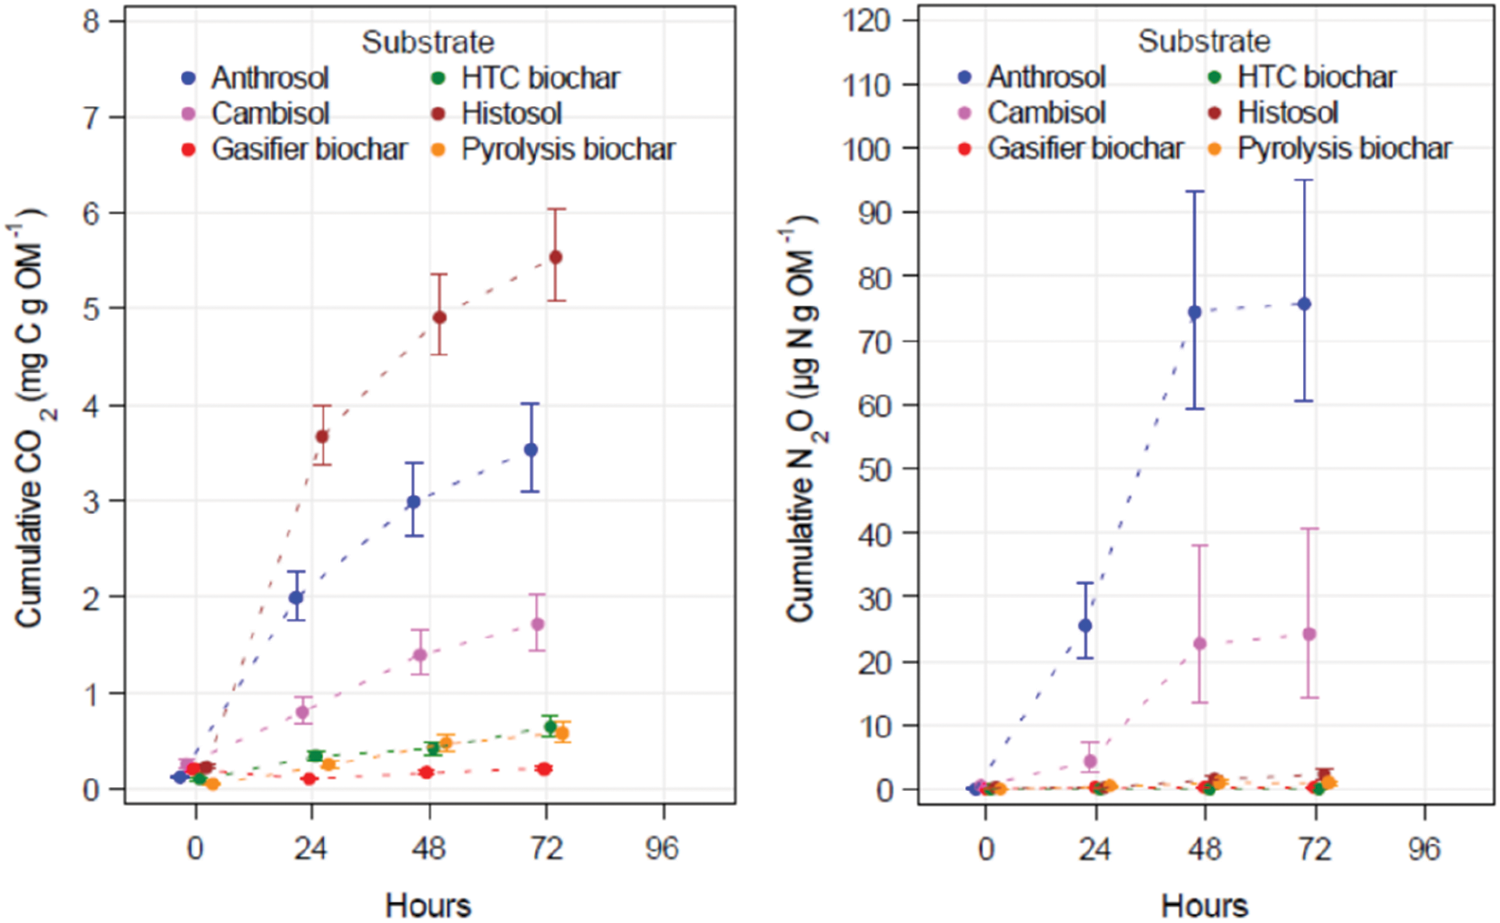
Figure 2: CO2 and N2O emission rates derived from 72 h incubation of natural and artificial substrates mixed with Cambisol. All values are related to the organic matter of the substrates (i.e., the dry ash-free weight)
3.3 Short-Term Emissions of GHG from Soil/Char Mixtures
Within 72 h, the highest CO2 release was measured for the Histosol, followed by the Anthrosol and the Cambisol (Fig. 2). This corresponds with their C content, Histosol having the highest C content (Table 2). However, the cumulative CO2 rates for the three high C content chars followed a linear pattern one order of magnitude below the values for the three natural soil substrates. In contrast to the gasifier char, the chars from HTC and pyrolysis were characterised by a slight linear increase of emitted CO2 over the 72 h of the short-term incubation.
N2O emissions from the natural soil substrates ranged between 2 and 75 μg N g OM−1, while much lower emissions were found for the artificial substrates, between 0.1 and 1.0 μg N g OM−1. After 48 h, the N2O levels seemed to reach a maximum, with little difference in the values measured after 72 h. The pyrolysis char emitted more N2O within the first 72 h than the HTC and gasifier chars. However, the difference was not significant. These results are surprising since higher N2O emission rates could have been expected for the gasifier char due to its considerably higher Ntot and Nmin contents compared to all other natural and artificial substrates (Table 2). N compounds such as NO2 and NO3 might have served as precursors for N2O formation during nitrification and denitrification. However, this could not be substantiated in our short-term incubation experiments.
3.4 Long-Term Emission of GHG from Soil/Char Mixtures
As seen in the short-term incubations, the Cambisol did not emit as much CO2 as the Anthrosol and the Histosol (Fig. 2). However, in the long-term experiment, the CO2 respiration in the Cambisol surpassed that measured in the Histosol (Fig. 3). Furthermore, the CO2 emissions from the Anthrosol were significantly lower at the end of the long-term incubation than both other natural soils. After nearly 2 years, the slower kinetics of C mineralisation in the Anthrosol produced only about 52% of the CO2 emitted by pure Cambisol. This result may be explained by increased recalcitrance due to the black C content found in anthropic soils such as Amazonian Dark Earths (see Section 4.1 [6]). The pattern of CO2 emission for the three types of char is similar but on a much lower level. The highest CO2 emission rates were observed in the HTC char. Significantly lower rates were emitted from pyrolysis char. This seems to indicate a higher portion of easily decomposable, non-aromatic C fractions in HTC char as compared to the pyrolysis char. After 639 days, all three char types emitted less than half of that CO2 emitted from the pure Cambisol.
High N2O emission rates in natural substrates were obtained at the beginning of incubation particularly in the Anthrosol (Fig. 3). Most remarkable are the low N2O emission rates of all chars mixed with the Cambisol. They were significantly reduced by one order of magnitude compared to the pure Cambisol. This was most obvious for HTC char with N2O emission rates significantly lower compared to pyrolysis char but not to gasifier char (Table 4).
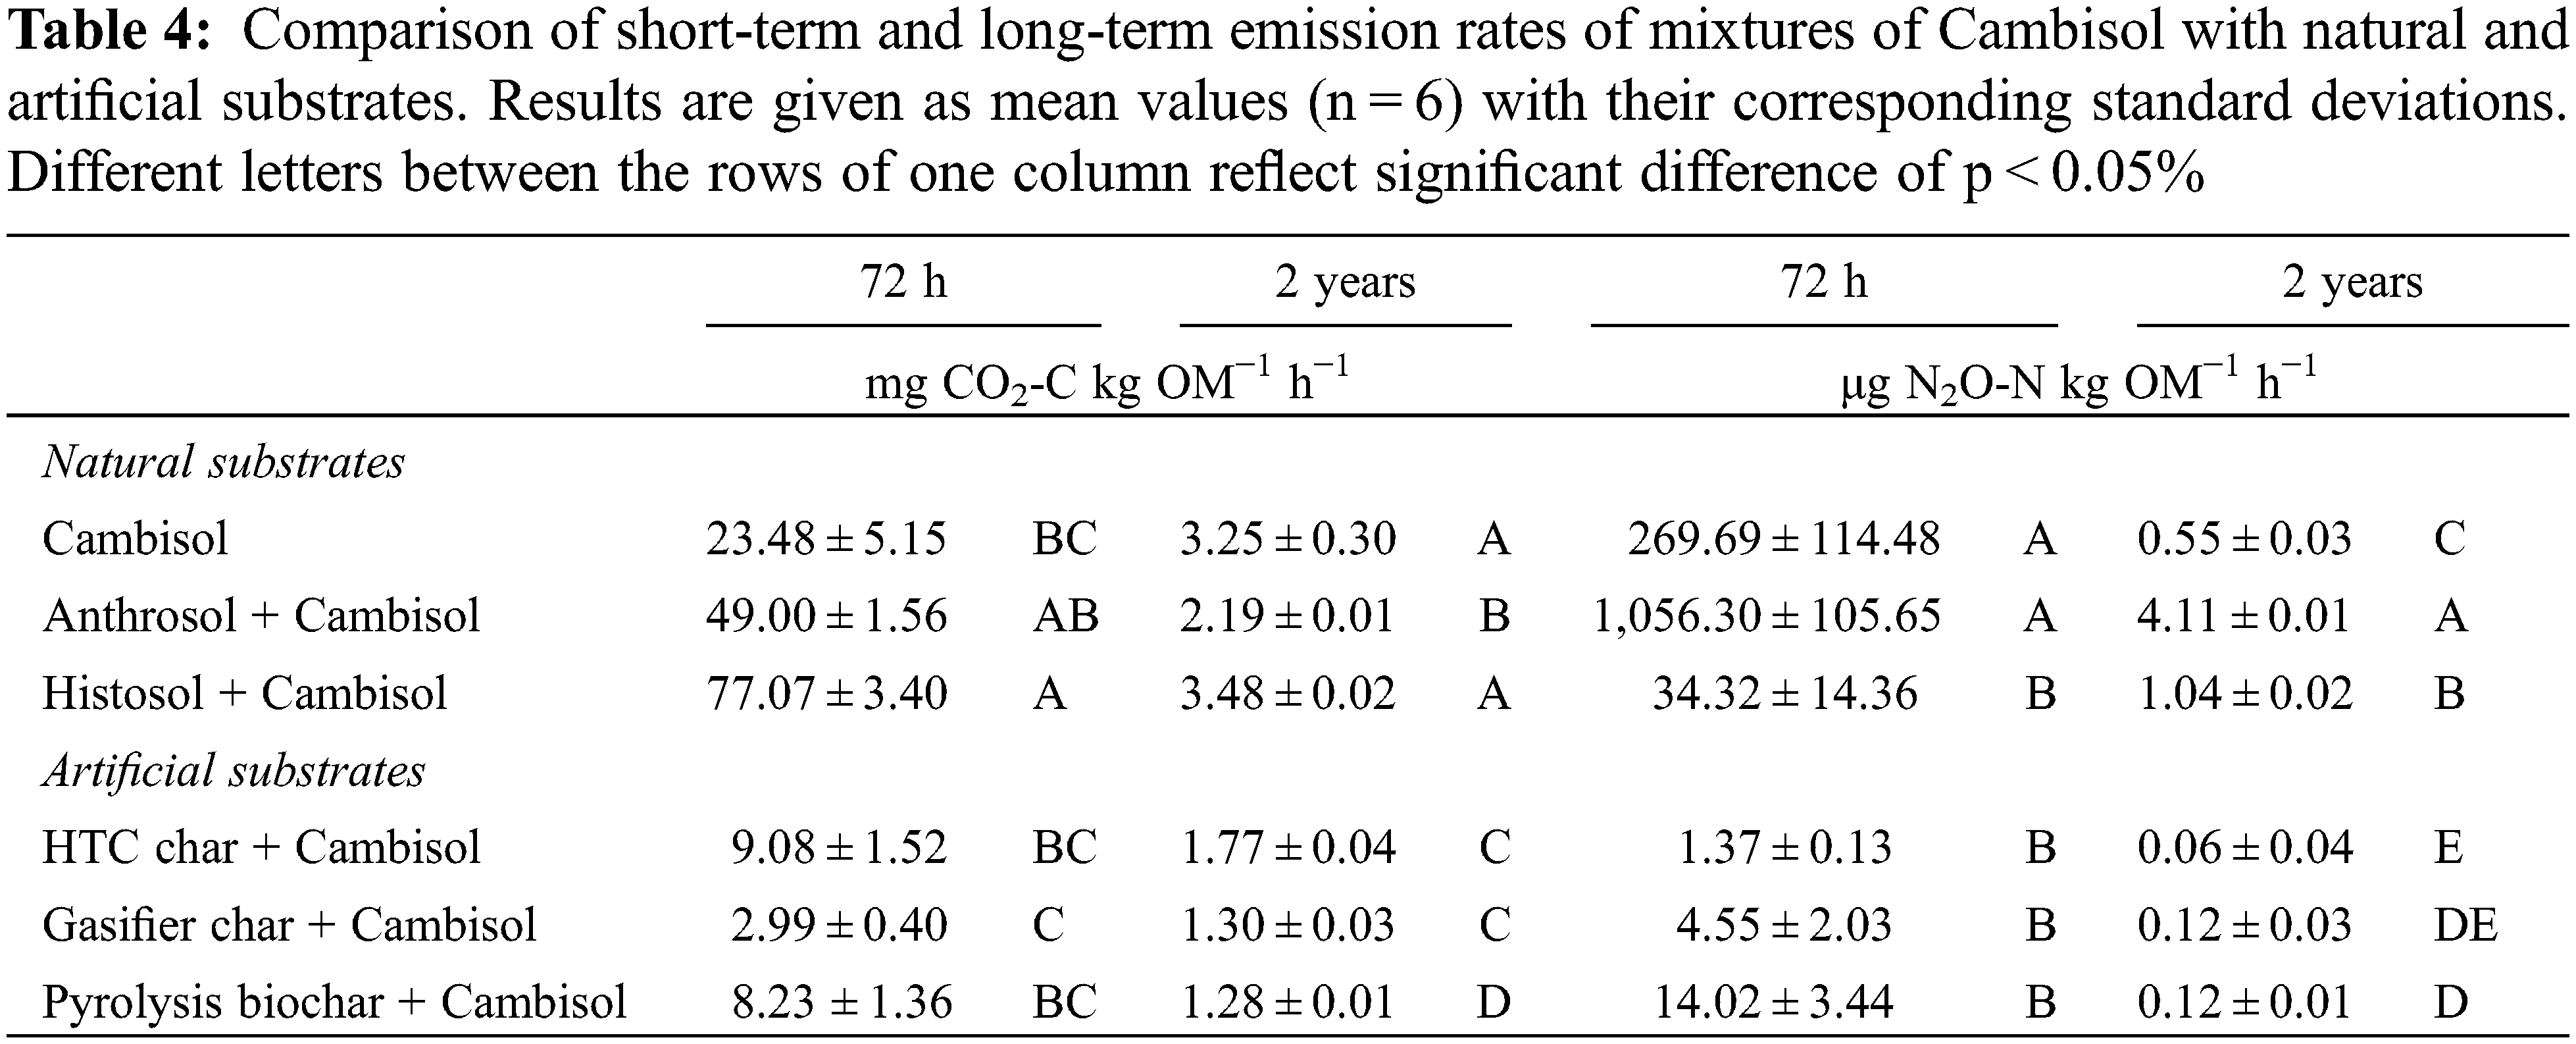
Differences between short-term and long-term emissions are in the range of one order of magnitude for CO2 (Table 4). The largest differences are most evident for the natural substrates and illustrate that emission rates to evaluate C sequestration need to be based on long-term incubations. For example, using a constant decomposition rate for the two years incubation given in Table 4, after one year the natural substrates (Cambisol, Anthrosol, Histosol) have lost 5.3%, 5.0% and 5.4%, respectively, of their initial C content and the artificial substrates (HTC char, gasifier char, pyrolysis biochar) have lost 2.9%, 1.5% and 1.5%, respectively, of the initial C content of the substrate mixture with Cambisol. Calculations based on the short-term rates would give much larger C losses.
For N2O, the differences between short and long-term emissions are much larger, up to three orders of magnitude. While the smaller differences between the short and long-term CO2 emission rates for the chars can be explained by the carbonisation of the wood, which resulted in highly condensed organic matter that is less susceptible to short-term mineralisation, the reasons for the extremely large differences between the short and long-term N2O emission rates and between the natural and artificial substrates are much harder to interpret. Some mechanisms are discussed later in Section 4.2. Since N2O has a much higher global warming potential than CO2, the potential of chars to reduce N2O emissions may play an important role in mitigating CO2 equivalents, which are burdening our atmosphere. Among the three chars, HTC char stands out since its N2O emission after two years is only half the N2O emitted by the pyrolysis char. However, the C losses from HTC char were significantly higher than those from the pyrolysis char. In order to evaluate potential reductions in GHG emissions from char application to soil, balancing CO2 equivalents and trade-offs between GHG based on long-term incubations is required.
An important strategy to mitigate the atmospheric CO2 concentration is to stabilise and enrich the organic matter stored in the soil. SOM may be stabilised by many factors such as temperature and rainfall [28]. Also the mineralogy of the soil may affect the SOM stability as found by the formation of organo-clay mineral complexes and the occlusion in micropores [29]. These natural factors control the stability of SOM but they cannot guarantee a long-term fixation of carbon due to the reversibility of carbon fixed in the soil. Recent research has found that the presence of black carbon in anthropic soils is an important factor indicating the resilience of SOM [6,30]. Therefore, the stability of soil organic compounds may be enhanced through the addition of thermochemically converted biomass. Pyrolysis is the main technique that has often been described and applied in recent years [31,32]. Budai et al. [33] reported that the half-life of biochar produced at the relatively low temperature of 370°C was 60 times higher after one year compared to the parent feedstock. At even lower temperatures between 200°C and 250°C, HTC produces a brownish char, which has been found not to be as stable as biochar. This was shown by Bamminger et al. [16] in incubations of HTC and pyrolysis chars from maize silage after 57 days. Another study with an incubation period of 248 days described the dependency of char stability on HTC process temperature, which had been produced from sugar beet pulp [34]. The mineralisation rates of organic material in the HTC chars decreased as the process temperature was increased, from 32% at 180°C to 12% at 250°C. Since extrapolation from short-term incubation to long-term decay may be problematic in cases such as chars with a heterogeneous substrate composition, we extended the incubation trial in time and obtained emission rates of CO2 considerably lower in the long-term. The period of nearly two years in our study allowed an interesting new insight. Although we also found that some C compounds from the HTC char were rapidly mineralised during the first months of the long-term incubation, after about 200 days, the course of the curve became linear and its trend did not differ much from those of pyrolysis biochar and gasifier char (Fig. 3). Therefore, we conclude that quantitative interpretations of short-term incubations of less than half a year are difficult and underestimate the half-life and, thus, the sequestration potential as in the case of the HTC char under study. Applying the emission rates from our two years incubation to the period of one year, we receive a decomposition of total carbon of between 5.0% and 5.4% for the natural substrates and 1.5%–2.9% for the three chars. This underlines the enhanced recalcitrance of chars with mineralisation rates in the same range as those of a 5 year study with rates of 0.5%–8.9% obtained for manure and plant based biochars [35]. It has to be kept in mind that long-term experiments are rather time consuming and in most studies not realistic to be performed over years and decades. Therefore, in order to approximate the actual kinetic respiration curve within limited incubation periods, bi-exponential models have been suggested, in order to reflect the heterogeneous composition of chars [36].
4.2 Reduction of N2O Emissions by Chars
In the discussion of combating climate change, increased attention is being focussed on mitigating N2O emissions from agricultural operations, its largest source [37], since the global warming potential of N2O is 298 times stronger compared to CO2 on a time scale of 100 years [38]. N2O is mainly produced as a by-product of nitrification and denitrification so that the control of fertiliser application is an important way to reduce the emission of N2O. However, not only agricultural field management, but also environmental factors such as weather conditions may affect N2O emissions [37,39]. Today each new soil improver and management method may become a new means to control and to reduce N2O emissions for different forms of land management. Thus, the ability of chars to mitigate N2O emissions makes them even more attractive than they are just due to their soil improvement effects [40].
In our study over a period of nearly two years, char substrates mixed with Cambisol showed five to nine times lower N2O emissions than the natural substrates Histosol, Anthrosol and the Cambisol alone. This observation corresponds to the meta-analysis of Cayuela et al. [41], which included 30 studies and found an overall reduction of N2O emissions of 54% after pyrolysis biochar had been applied in laboratory and field experiments. Besides biochar, the study of Schimmelpfennig et al. [42] also included the effects of HTC char on the emission of N2O. Both kinds of char were able to reduce the N2O emissions in the laboratory, but not in the field.
The mechanisms of how char application to soil reduces N2O emissions have been the subject of a few studies but they are not fully clarified yet [43,44]. In general, chars may adsorb dissolved inorganic nitrogen, which is then no longer available for nitrifiers and denitrifiers anymore. In our study, there was an accumulation of N2O in all assays within the first 48 h. After that time, almost no accumulation could be observed pointing to an ongoing N2O reduction to N2 or to exhausting concentrations of N compounds, which could have been mineralised. However, even more N compounds must have become available, since more accumulation of N2O was seen in the following long-term experiment. The reason might have been the relatively high C/N ratios, which could have offered a large spectrum of electron donors. In addition to the supply of N, electron donors are required for the degradation of oxidised N compounds such as NO3 during denitrification. The fact that the high concentrations of NO3 and NO2 in the gasifier char could not have been used as electron acceptors at the beginning of the incubation might be explained by the lack and only slow development of specialised NO3 reducing bacteria. It can be speculated that the microbial community was not adapted to the restricted supply of organic compounds. Compared to the other chars, the highest N2O reduction potential was obtained in our study by the HTC char in both the short-and long-term. HTC chars are assumed to form a special environment, which induces considerably stronger effects on microbial communities compared to the addition of pyrolysis char as reported by Andert et al. [45].
4.3 Overall Assessment of GHG Mitigation
Combining the long-term CO2 and N2O emission rates in Table 4, we obtained values for the emission rates of CO2 equivalents over a period of nearly two years. They range between 3.5 and 4.1 kg OM−1 h−1 for natural substrates and between 1.3 and 1.8 kg OM−1 h−1 for artificial substrates (Fig. 4). All together the char substrates in our study were able to reduce CO2 equivalents to Levels 2 to 3 times lower than in natural substrates. Gasifier and pyrolysis chars showed the best results. The benefit of HTC char is its high efficiency to eliminate N2O.
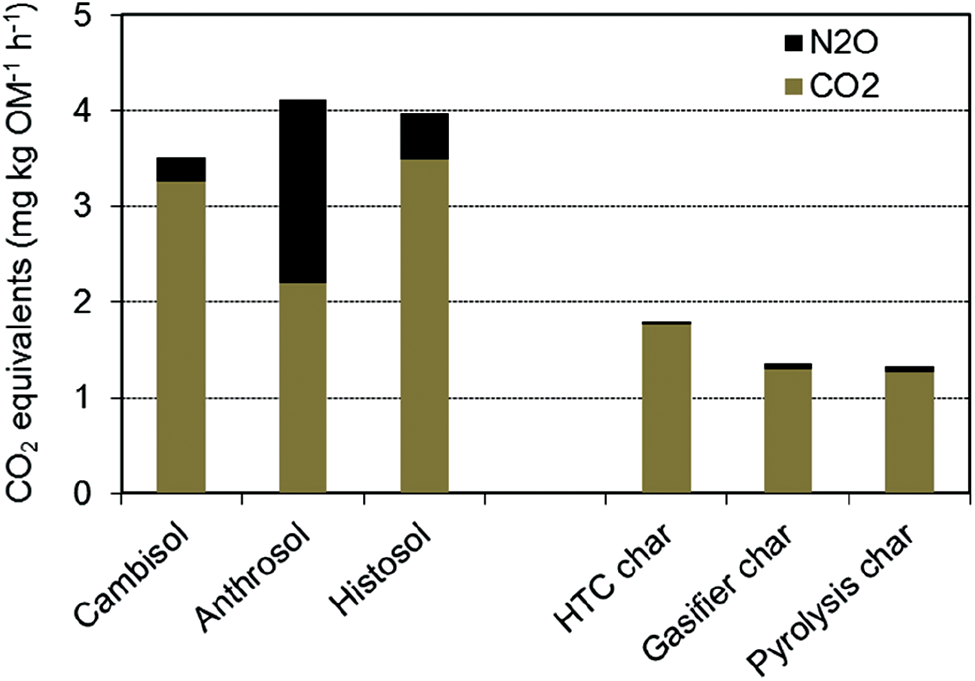
Figure 4: Emission of CO2 equivalents from Cambisol mixtures with natural and artificial substrates over a period of two years
Among all substrates tested in our study, the highest emission rates of CO2 and its equivalents were found in the Anthrosol and the Histosol representing soils rich in organic matter such as peatlands. Since peat is still widely used for horticultural production in growing media, this may have a considerable impact on the emission of GHG. As long as peat deposits occur in their natural anoxic environment, mineralisation and CO2 emission can be neglected, but a shift to oxic conditions as established in our incubation experiments stimulates the decomposition of organic compounds. If chars can replace a part of peat in growing media in the future, less CO2 would be emitted and natural ecosystems may be preserved at the same time.
In summary, chars applied to soil reduce the emission of N2O significantly. This positive effect may be counteracted by the simultaneous emission of CO2, which has to be taken into account for a complete balance of greenhouse gases. The decomposition of organic compounds results in different kinetics of CO2 emission due to different labile C pools. In order not to overestimate the most labile C fractions, incubation periods of at least 6 months are highly recommended. We conclude that the application of the chars under study to soils is a suitable way to achieve long-term C sequestration.
Acknowledgement: Giovanna Rehde, Ulrike Knuth and Markus Schleusener are highly acknowledged for their assistance with sample preparation and analyses in the laboratory.
Funding Statement: The authors received no specific funding for this study.
Conflicts of Interest: The authors declare that they have no conflicts of interest to report regarding the present study.
1. IPCC (2021). Summary for policymakers. In: Masson-Delmotte, V., Zhai, P., Pirani, A., Connors, S. L., Péan, C. et al. (Eds.). Climate change 2021: The physical science basis. Contribution of Working Group I to the Sixth Assessment Report of the Intergovernmental Panel on Climate Change. Cambridge University Press (in Press). https://www.ipcc.ch/report/ar6/wg1/downloads/report/IPCC_AR6_WGI_Citation.pdf. [Google Scholar]
2. Kutsch, W., Aubinet, M., Buchmann, N., Smith, P., Osborne, B. et al. (2010). The net biome production of full crop rotations in Europe. Agriculture Ecosystems & Environment, 139(3), 336–345. DOI 10.1016/j.agee.2010.07.016. [Google Scholar] [CrossRef]
3. Brombin, V., Mistri, E., de Feudes, M., Forti, C., Salani, G. M. et al. (2020). Soil carbon investigation in three pedoclimatic and agronomic settings of northern Italy. Sustainability, 12(24), 10539. DOI 10.3390/su122410539. [Google Scholar] [CrossRef]
4. Yang, X., Kang, K., Qiu, L., Zhao, L., Sun, R. (2020). Effects of carbonization conditions on the yield and fixed carbon content of biochar from pruned apple tree branches. Renewable Energy, 146, 1691–1699. DOI 10.1016/j.renene.2019.07.148. [Google Scholar] [CrossRef]
5. Glaser, B., Haumaier, L., Guggenberger, G., Zech, W. (2001). The “Terra preta” phenomenon: A model for sustainable agriculture in the humid tropics. Naturwissenschaften, 88(1), 37–41. DOI 10.1007/s001140000193. [Google Scholar] [CrossRef]
6. Kern, J., Giani, L., Teixeira, W., Lanza, G., Glaser, B. (2019). What can we learn from ancient fertile anthropic soil (Amazonian dark earths, shell mounds, plaggen soil) for soil carbon sequestration? Catena, 172, 104–112. DOI 10.1016/j.catena.2018.08.008. [Google Scholar] [CrossRef]
7. Glaser, B., Birk, J. J. (2012). State of the scientific knowledge on properties and genesis of anthropogenic dark earths in central amazonia (terra preta de índio). Geochimica et Cosmochimica Acta, 82, 39–51. DOI 10.1016/j.gca.2010.11.029. [Google Scholar] [CrossRef]
8. Wu, P., Ata-Ul-Karim, S. T., Singh, B. P., Wang, H. L., Wu, T. L. et al. (2019). A scientometric review of biochar research in the past 20 years (1998–2018). Biochar, 1, 23–43. DOI 10.1007/s42773-019-00002-9. [Google Scholar] [CrossRef]
9. Teixeira, W. G., de Oliveirade Marques, J. D., Verheijen, F. G. A. (2020). Water holding capacity of biochar and biochar-amended soils. In: Manyà, J. J., Gascó, G. (Org.). Biochar as a renewable-based material: With applications in agriculture, the environment and energy (1st ed,). London: World Scientific Publishing Europe. [Google Scholar]
10. Glaser, B., Lehmann, J., Zech, W. (2002). Ameliorating physical and chemical properties of highly weathered soils in the tropics with charcoal–A review. Biology Fertility and Soils, 35, 219–230. DOI 10.1007/s00374-002-0466-4. [Google Scholar] [CrossRef]
11. Yanai, Y., Toyota, K., Okazaki, M. (2007). Effects of charcoal addition on N2O emissions from soil resulting from rewetting air-dried soil in short-term laboratory experiments. Journal of Soil Science and Plant Nutrition, 53(2), 181–188. DOI 10.1111/j.1747-0765.2007.00123.x. [Google Scholar] [CrossRef]
12. Dicke, C., Lanza, G., Mumme, J., Ellerbrock, R., Kern, J. (2014). Effect of hydrothermally carbonized char application on trace Gas emissions from Two sandy soil horizons. Journal of Environmental Quality, 43(5), 1790–1798. DOI:10.2134/jeq2013.12.0513. [Google Scholar] [CrossRef]
13. Lehmann, J., Joseph, S. (2015). Biochar for environmental management. London: Earthscan Publ. [Google Scholar]
14. Lanza, G., Stang, A., Kern, J., Wirth, S., Gessler, A. (2018). Degradability of raw and post-processed chars in a two-year field experiment. The Science of the Total Environment, 628–629, 1600–1608. DOI 10.1016/j.scitotenv.2018.02.164. [Google Scholar] [CrossRef]
15. Kuzyakov, Y., Bogomolova, I., Glaser, B. (2014). Biochar stability in soil: Decomposition during eight years and transformation as assessed by compound-specific 14C analysis. Soil Biology and Biochemistry, 70, 229–236. DOI 10.1016/j.soilbio.2013.12.021. [Google Scholar] [CrossRef]
16. Bamminger, C., Marschner, B., Jüschke, E. (2014). An incubation study on the stability and biological effects of pyrogenic and hydrothermal biochar in two soils. European Journal of Soil Science, 65(1), 72–82. DOI 10.1111/ejss.12074. [Google Scholar] [CrossRef]
17. Techen, A., Helming, K., Brüggemann, N., Veldkamp, E., Reinhold-Hurek, B. et al. (2020). Soil research challenges in response to emerging agricultural soil management practices. Advances in Agronomy, 161, 179–240. DOI 10.1016/bs.agron.2020.01.002. [Google Scholar] [CrossRef]
18. Lehmann, J., Gaunt, J., Rondon, M. (2006). Bio-char sequestration in terrestrial ecosystems–A review. Mitigation and Adaptation Strategies for Global Change, 11, 403–427. DOI 10.1007/s11027-005-9006-5. [Google Scholar] [CrossRef]
19. Steinbeiss, S., Gleixner, G., Antonietti, M. (2009). Effect of biochar amendment on soil carbon balance and soil microbial activity. Soil Biology and Biochemistry, 41(6), 1301–1310. DOI 10.1016/j.soilbio.2009.03.016. [Google Scholar] [CrossRef]
20. Kuzyakov, Y., Subbotina, I., Chen, H. Q., Bogomolova, I., Xu, X. L. (2009). Black carbon decomposition and incorporation into soil microbial biomass estimated by C-14 labeling. Soil Biology and Biochemistry, 41(2), 210–219. DOI 10.1016/j.soilbio.2008.10.016. [Google Scholar] [CrossRef]
21. Olmo, M., Villar, R., Salazar, P., Alburquerque, J. A. (2016). Changes in soil nutrient availability explain biochar’s impact on wheat root development. Plant and Soil, 399, 333–343. DOI 10.1007/s11104-015-2700-5. [Google Scholar] [CrossRef]
22. Feng, L., Xu, W., Tang, G., Gu, M., Geng, Z. (2021). Biochar induced improvement in root system architecture enhances nutrient assimilation by cotton plant seedlings. BMC Plant Biology, 21, 269. DOI 10.1186/s12870-021-03026-1. [Google Scholar] [CrossRef]
23. Verband Deutscher Landwirtschaftlicher Untersuchungs- und Forschungsanstalten (2002). Band I Die Untersuchung von Böden. 4. Aufl. Gesamtwerk einschl. 3. Teillieferung. A 6.1.4.1and A 6.2.1.2. [Google Scholar]
24. EBC (2012). European biochar certificate-guidelines for a sustainable production of biochar. European Biochar Foundation (EBCArbaz, Switzerland. http://european-biochar.org. [Google Scholar]
25. Fuertes, A. B., Camps Arbestain, M., Sevilla, M., Maciá-Agulló, J. A., Fiol, S. et al. (2010). Chemical and structural properties of carbonaceous products obtained by pyrolysis and hydrothermal carbonisation of corn stover. Australian Journal of Soil Research, 48(7), 618–626. DOI 10.1071/SR10010. [Google Scholar] [CrossRef]
26. Spokas, K. A., Novak, J. M., Stewart, C. E., Cantrell, K. B., Uchimiya, M. et al. (2011). Qualitative analysis of volatile organic compounds on biochar. Chemosphere, 85(5), 869–882. DOI 10.1016/j.chemosphere.2011.06.108. [Google Scholar] [CrossRef]
27. Becker, R., Dorgerloh, U., Helmis, M., Mumme, J., Diakite, M. et al. (2013). Hydrothermally carbonized plant materials: Patterns of volatile organic compounds detected by gas chromatography. Bioresource Technology, 130, 621–628. DOI 10.1016/j.biortech.2012.12.102. [Google Scholar] [CrossRef]
28. Angst, G., Mueller, K. E., Eissenstat, D. M., Trumbore, S., Freeman, K. H. et al. (2019). Soil organic carbon stability in forests: Distinct effects of tree species identity and traits. Global Change Biology, 25(4), 1529–1546. DOI 10.1111/gcb.14548. [Google Scholar] [CrossRef]
29. Poirier, V., Basile-Doelsch, I., Balesdent, J., Borschneck, D., Whalen, J. K. et al. (2020). Organo-mineral interactions Are more important for organic matter retention in subsoil than topsoil. Soil Systems, 4(1), 4. DOI:10.3390/soilsystems4010004. [Google Scholar] [CrossRef]
30. Glaser, B., Balashov, E., Haumaier, L., Guggenberger, G., Zech, W. (2000). Black carbon in density fractions of anthropogenic soils of the Brazilian Amazon region. Organic Geochemistry, 31(7–8), 669–678. DOI 10.1016/S0146-6380(00)00044-9. [Google Scholar] [CrossRef]
31. Lehmann, J. (2007). A handful carbon. Nature, 447, 143–144. DOI 10.1038/447143a. [Google Scholar] [CrossRef]
32. Crombie, K., Mašek, O., Sohi, S. P., Brownsort, P., Cross, A. (2013). The effect of pyrolysis conditions on biochar stability as determined by three methods. Global Change Biology Bioenergy, 5(2), 122–131. DOI 10.1111/gcbb.12030. [Google Scholar] [CrossRef]
33. Budai, A., Rasse, D. P., Lagomarsino, A., Lerch, T. Z., Paruch, L. (2016). Biochar persistence, priming and microbial responses to pyrolysis temperature series. Biology and Fertility of Soils, 52, 749–761. DOI 10.1007/s00374-016-1116-6. [Google Scholar] [CrossRef]
34. Gajic, A., Ramke, H. G., Hendricks, A., Koch, H. J. (2012). Microcosm study on the decomposability of hydrochars in a cambisol. Biomass & Bioenergy, 47, 250–259. DOI 10.1016/j.biombioe.2012.09.036. [Google Scholar] [CrossRef]
35. Singh, B. P., Cowie, A. L., Smernik, R. J. (2012). Biochar carbon stability in a clayey soil as a function of feedstock and pyrolysis temperature. Environmental Science & Technology, 46(21), 11770–11778. DOI 10.1021/es302545. [Google Scholar] [CrossRef]
36. Lanza, G., Wirth, S., Gessler, A., Kern, J. (2015). Short-term response of soil CO2 respiration to addition of biochars: Impact of fermentation post-processing and mineral nitrogen. Pedosphere, 25(5), 761–769. DOI 10.1016/S1002-0160(15)30057-6. [Google Scholar] [CrossRef]
37. Hellebrand, H. J., Scholz, V., Kern, J., Kavdir, Y. (2005). N2O release during cultivation of energy crops. Agrartechnische Forschung, 11(5), E114–E124. DOI 10.15150/lt.2005.1237. [Google Scholar] [CrossRef]
38. Forster, P., Ramaswamy, V., Artaxo, P., Berntsen, T., Betts, R. et al. (2007). Changes in atmospheric constituents and in radiative forcing. In: Solomon, S., Qin, D., Manning, M., Chen, Z., Marquis, M. et al. (Eds.). Climate change 2007: The physical science basis. Contribution of Working Group I to the Fourth Assessment Report of the Intergovernmental Panel on Climate Change. Cambridge University, Cambridge, UK and New York, NY, USA. [Google Scholar]
39. Foltz, M. E., Zilles, J. L., Koloutsou-Vakakis, S. (2019). Prediction of N2O emissions under different field management practices and climate conditions. The Science of the Total Environment, 646, 872–879. DOI 10.1016/j.scitotenv.2018.07.364. [Google Scholar] [CrossRef]
40. Zhang, Q., Xiao, J., Xue, J., Zhang, L. (2020). Quantifying the effects of biochar application on greenhouse gas emissions from agricultural soils: A global meta-analysis. Sustainability, 12(8), 3436. DOI:10.3390/su12083436. [Google Scholar] [CrossRef]
41. Cayuela, M. L., van Zwieten, L., Singh, B. P., Jeffery, S., Roig, A. et al. (2013). Biochar’s role in mitigating soil nitrous oxide emissions: A review and meta-analysis. Agriculture Ecosystems & Environment, 191, 5–16. DOI 10.1016/j.agee.2013.10.009. [Google Scholar] [CrossRef]
42. Schimmelpfennig, S., Müller, C., Gruenhage, L., Koch, C., Kammann, C. (2014). Biochar, hydrochar and uncarbonized feedstock application to permanent grassland-effects on greenhouse gas emissions and plant growth. Agriculture Ecosystems & Environment, 191, 39–52. DOI 10.1016/j.agee.2014.03.027. [Google Scholar] [CrossRef]
43. Ameloot, N., Maenhout, P., de Neve, S., Sleutel, S. (2016). Biochar-induced N2O emission reductions after field incorporation in a loam soil. Geoderma, 267, 10–16. DOI 10.1016/j.geoderma.2015.12.016. [Google Scholar] [CrossRef]
44. Kammann, C., Borchard, N., Cayuela, M., Hagemann, N., Ippolito, J. et al. (2017). Biochar as a novel tool to reduce the agricultural greenhouse-gas burden–knowns, unknowns and future perspectives. Journal of Environmental Engineering and Landscape Management, 25(2), 114–139. DOI 10.3846/16486897.2017.1319375. [Google Scholar] [CrossRef]
45. Andert, J., Mumme, J. (2015). Impact of pyrolysis and hydrothermal biochar on gas-emitting activity of soil microorganisms and bacterial and archaeal community composition. Applied Soil Ecology, 96, 225–239. DOI 10.1016/j.apsoil.2015.08.019. [Google Scholar] [CrossRef]
 | This work is licensed under a Creative Commons Attribution 4.0 International License, which permits unrestricted use, distribution, and reproduction in any medium, provided the original work is properly cited. |