| Journal of Renewable Materials |
DOI: 10.32604/jrm.2022.019211
ARTICLE
Development of Magnetite/Graphene Oxide Hydrogels from Agricultural Wastes for Water Treatment
Cellulose and Paper Department, National Research Centre, Cairo, 12622, Egypt
*Corresponding Author: Samir Kamel. Email: samirki@yahoo.com
Received: 09 September 2021; Accepted: 07 December 2021
Abstract: A novel magnetic hydrogel loaded with graphene oxide (GO) was developed in this study. Firstly, GO was prepared from bagasse through a single step via oxidation in the presence of ferrocene under muffled atmospheric conditions, followed by the loading of different amounts of magnetite onto GO via co-precipitation reaction of iron onto GO sheets. Finally, the 2-acrylamido-2-methyl-1-propane sulfonic acid was grafted onto carboxymethyl cellulose in the presence of magnetite GO and N, N′-methylenebisacrylamide as crosslinker yielded hydrogel. The structure, morphological, and thermal behavior of the prepared hydrogels were investigated. In addition, the adsorption performance of Ni(II) ions from aqueous media by the prepared hydrogels was investigated as a function of temperature, time, and concentration of adsorbate in a batch system. The results demonstrated a remarkable enhancement in the adsorption process of Ni(II) (Removal efficiency = 98.82%). All isotherms were found to fit the Langmuir model best. The adsorption properties of both magnetic GO and magnetic hydrogel showed promising properties as green and cheap adsorbents.
Keywords: Magnetite graphene oxide; hydrogel; Ni(II) adsorption; kinetic models; thermodynamics
The removal of poisonous heavy metals, such as nickel, mercury, cadmium, and lead from wastewater has been recent of high significance due to their highly toxic and carcinogenic effects, which could result in damaging different human body organs [1,2]. Heavy metal ions generally discharge to the environment from metal processing industries, which in turn can release to soil and water streams to reach plants, animals, and humans [3]. The use of water contaminated with toxic heavy metals has been one of the primary reasons for human deaths due to diarrhea disease, most common in children. In addition, heavy metals can be transferred indirectly to the human body through their adsorption by the aquatic organisms of human food chains to cause high health risks [4,5]. Ni(II) salts are non-biodegradable toxic heavy metal ions that can cause dermatitis and allergic effects. Metal ions can enter the human body by either the digestive or respiratory tract [6]. The lungs can readily absorb water-soluble Ni(II) salts into the bloodstream. At the same time, poorly soluble Ni(II) substances can accumulate over time in the lungs, causing complications such as lung cancer and other respiratory tumors, bronchitis, pulmonary fibrosis, and lung scar tissue [7,8]. The World Health Organization identified the maximum allowable concentration of Ni(II) in wastewater from electroplating manufacturers as 4.1 mg L−1, while the maximum allowed quantity of Ni(II) in drinking water must be 0.1 mg L−1 [9,10]. There have been various sources of Ni(II) pollution into water streams, which are primarily from industrial processes such as forging [11], batteries manufacturing [12], metal finishes [13], mining, and electroplating [14]. There are a variety of methods that have been applied to eliminate Ni(II) from wastewater, such as filtration, reverse osmosis, ion exchange, membrane separation, flocculation, chemical coagulation and adsorption [7,15]. Amongst them, adsorption has been widely applied for water treatment due to its low cost, superficial handling of materials, the ability for energy recovery, and eco-friendly. A variety of adsorbents have been used for the removal of Ni(II) from aqueous media. For example, green algae, waste factory tea, seaweeds [16], loofa sponge-immobilized biomass of chlorella sorokiniana [17], aerobic activated sludge [18], spent animal bones [19], fly ash [20], activated carbon [21], crab shell [22], and sugar industry waste [23]. However, the low adsorption efficiency of adsorbent materials in the removal of heavy metal ions restricted their applications. Thus, exploring novel adsorbents with higher adsorption capacity has been a significant demand. In addition, the use of sustainable composites has introduced numerous advantages in terms of low cost, biodegradability, low density, and low energy consumption compared to synthetic materials [24,25].
Nanomaterials, such as graphene-based nanomaterials, demonstrate better structural properties than the conventional macroscopic analogs [26]. However, the use of pristine graphene has been limited in water treatment. Hence, the modulation of graphene into graphene nanocomposites by offering some functional groups onto graphene surfaces has been presented to increase environmental applications [27]. Graphene oxide (GO) has been employed to produce easily exposed dispersion in aqueous media [28,29]. The oxygen-containing functional groups of graphene oxide (GO) including, C-O-C, -OH, -COOH, and C=O, make it a good adsorbent candidate [15,29]. Magnetite (Fe3O4) has been reported as an efficient material for elimination of metal ions, due to its low toxicity, high adsorption ability, good biocompatibility, sustainability, and being eco-friendly [30,31]. Several methods have been reported for the synthesis of Fe3O4 nanoparticles. The co-precipitation process is the most widely used technique for preparing Fe3O4 due to its simplicity and low cost.
Furthermore, the Fe3O4 nanoparticles can prepare in significant amounts [32] and used to facilitate the separation of adsorbents from aqueous solution. The major disadvantage of the Fe3O4 nanoparticles is the agglomeration probability between the Fe3O4 nanoparticles, leading to the formation of bulky masses due to their magnetic properties, which limits their adsorption efficiency. Fe3O4 nanoparticles can be immobilized onto GO to avoid their agglomeration [33]. Modification of GO with Fe3O4 nanoparticles provides magnetite graphene oxide (MGO), which can consider as one of the most important compounds due to its high dispersibility in aqueous solutions and easy magnetic separation [34]. The adsorption efficiency of MGO can improve by gelation to increase its swelling ability, hydrophilicity by its ionic groups, and hydrogel salt tolerance by its non-ionic groups [35]. However, to the best of our knowledge, the adsorption of toxic heavy metals, particularly Ni(II), employing adsorbents derived from sugarcane bagasse, is still very limited in the literature.
Herein, we report developing novel carboxymethyl cellulose-MGO-g-poly(co-acrylamido-2-methyl-1-propane sulfonic acid) (AMPS) hydrogels as promising eco-friendly nanocomposites for the removal of Ni(II) from wastewater. The hydrogels were synthesized via graft copolymerization followed by crosslinking of AMPS and MGO to the CMC backbone. The efficiency of the produced hydrogels to adsorb Ni(II) from wastewater was explored. We explored the efficiency of the produced hydrogels to adsorb Ni(II) from wastewater. In addition, it studied the effects of temperature, the concentration of Ni(II), and adsorption time on the adsorption efficacy.
Sugarcane bagasse (SCB) was obtained from Quena Paper Industry, Egypt. SCB was air-dried and subjected to homogenization to prevent compositional differences among batches. SCB was then grinded to a mesh size of 450 μ. 2-Acrylamido-2-methyl-1-propane-sulfonic acid (AMPS) was purchased from Alfa Aesar. Ferrocene (F) was obtained from Sisco Research Lab Ltd. (SRL), India. Both N, N′-methylenebisacrylamide (MBA), and potassium persulfate (KPS; K2S2O8) were obtained from Sigma-Aldrich. Chemicals, reagents, and substrates employed in this study were of analytical grade and were used as received without any additional purification.
2.2 Synthesis of GO from SCB Wastes
GO was synthesized via oxidation of SCB by F at 300°C under muffled atmospheric conditions. A mixture of SCB (0.5 g) and F (0.1 g) was heated at 300°C for 10 min in a furnace. The generated SCB/F represented GO, and the produced black powder collected under ambient conditions with the yield of 39.20% [15].
2.3 Preparation of Magnetite Graphene Oxide (MGO)
MGO was prepared via co-precipitation of FeCl3·6H2O and FeCl2·4H2O in the presence of GO [36]. An aqueous GO (25 mg) solution in deionized water (50 mL) was ultrasonicated for 30 min. At the same time, the precursor Fe3O4 solution (100 mL) of Fe3+ and Fe2+ (with molar ratio 2:1) was pre-hydrolyzed by the dropwise addition of an aqueous solution of NaOH (1 M) under constant stirring. Once the pH of the mixture reached 4, the GO dispersion was gradually added and stirred for an additional 30 min until reaching a homogeneous mixture. NaOH was added continuously into the mixture until reaching a pH of 11–12, stirring 30 min. The precipitate MGO was magnetically separated, rinsed with deionized water and absolute ethyl alcohol, and finally dried in an oven at 60°C. For comparison, Fe3O4 also prepared under similar conditions; but in the absence of GO. Fe3O4:GO ratio is a factor which could influence the adsorption properties, so it has to be investigated to know the optimum ratio. Five different samples of MGO were prepared with varying ratios of weight between GO and Fe3O4 (Fe3O4:GO = 2:1, 4:1, 6:1, 8:1, and 10:1) which labeled as MGO2:1, MGO4:1, MGO6:1, MGO8:1, and MGO10:1, respectively [36–38].
2.4 Preparation of Carboxymethyl Cellulose (CMC)
SCB was hydrolyzed by HCl (1.5% relative to the raw material) with a liquor ratio (volume of aqueous medium relative to SCB) of 1:10 at 120°C for 2 h. The pre-hydrolyzed SCB was treated with sodium hydroxide (20% relative to SCB) at 170°C for 2 h using liquor to a material ratio of 1:7. The lignin residue of the pretreated bagasse was eliminated by bleaching using chlorous acid (HClO2). The mercerization process of cellulose was performed using NaOH (17.5%) to eliminate of the lignin traces and attain pure α-cellulose. α-cellulose reacted with monochloroacetic acid at 60°C for 2 h with stirring to attain CMC. The degree of substitution (DS) of the carboxyl substituent on carboxymethyl cellulose was evaluated using the potentiometric titration standard approach [39].
2.5 Preparation of the Hydrogel
2 g CMC (DS 0.76) was dissolved in distilled water (50 mL) by stirring at 50°C produced a homogeneous solution. The temperature was increased to 60°C and potassium persulfate (0.24 g) dissolved in distilled water (5 mL) was added. Next, the temperature was maintained at 65°C for 10 min to create free radicals on the CMC polymer chains and an aqueous suspension of GO or MGO (2 g), AMPS (4 g) neutralized with an aqueous solution of NaOH to pH 5.5, and N, N′-methylenebisacrylamide (0.48 g) were added to the solution. Finally, for 3 h, maintained the temperature was at 70°C for 3 h and pH 5.5. Next, the resultant hydrogel was rinsed with distilled water to eliminate the excessive water-soluble monomers, homopolymers, and crosslinker. Then, the hydrogel was maintained at –80°C for 3 h, followed by freeze-drying employing Christ-Alpha 1-2 LD Plus freeze-dryer. The grafting of AMPS onto CMC, CMC with GO, and CMC with MGO2:1 coded G1, G2, and G3, respectively. The grafting yield was estimated from the weight of the dried hydrogel, and yields of G1, G2, and G3 are 114.41, 72.17, and 35.79, respectively [40].
The adsorption processes of Ni(II) were carried out by adding the adsorbents (20 mg) into the Ni(II) solution (20 mL) of initial concentration (15 mg/L). Different conditions of adsorption were investigated, such as; various time intervals (15–90 min), different concentrations of Ni(II) (15, 20, 25, and 30 mg/L) for 30 min at 298 K, and different temperatures (298–328 K) for 30 min [15]. Finally, the sorbent was filtered from the solution, and Ni(II) concentration was measured by atomic absorption spectrophotometry (Perkin Elmer 3110, USA) and calculated the removal capacity percent (R%) by the following relation:
where Co is the initial Ni(II) concentration (mg/L), Ct is the remaining Ni(II) concentration after the time (t).
To achieve a control rate mechanism of the adsorption processes such as chemical reaction and mass transfer, both pseudo-first and second-order equations were utilized to model Ni(II) adsorption’s kinetics using the effect of time on the adsorption process [15].
The adsorption isotherms introduce valuable data on the distribution of adsorbed molecules among both liquid and solid phases at equilibrium (i.e., adsorption mechanism, surface properties, and affinity of adsorbent). The regression coefficient (R2) is employed to identify the best-fitting adsorption isotherm. Langmuir isotherm model is the most specific category in which every adsorption spot is equivalent and independent; i.e., the binding capability of a molecule is autonomous of neighboring occupied sites. Furthermore, the Freundlich model explains the reversible and non-ideal adsorption (i.e., an infinite source of un-reacted GO spots) and favors the representation of heterogeneous materials better than other models. Therefore, the Freundlich isotherm can be employed in developing multilayer adsorption systems with a heterogeneous distribution of adsorption sites and affinity over a heterogeneous surface [15].
2.6.3 Thermodynamic Parameters
The reaction rate can estimate from the awareness of the kinetic investigations. However, the possible reaction changing during the process needs the concise idea of thermodynamic parameters, such as entropy (ΔS; kJ mol-1), enthalpy (ΔH; kJ mol-1), and Gibbs free energy (ΔG; kJ mol-1) [41]. Changes during adsorption can estimate from the equation of Van’t Hoff [42–44]. The values of ΔS and ΔH can calculate from the intercept and slope of Van’t Hoff by plotting lnK vs. 1/T [45,46].
Fourier Transform Infrared Spectrometer (Mattson-5000) was utilized to assign the functional groups of the samples. The morphological structure was performed by using scanning electron microscopy (SEM, Quanta-250 conducted with EDAX). The particle size was established via transmission electron microscopy (TEM, JEM-1230, Japan) with magnification 600 × 103, resolution 0.2 nm, and 120 kV. While the Raman spectra were recorded at an excitation laser wavelength of 532 nm using Raman confocal WITEC Focus Innovations Alpha-300 microscope. Magnetic properties of MGO samples were assessed by vibrating sample Magnetometer Lake Shore Mode (7410; USA) at room temperature.
The crystallinity was determined by Bruker D8 Advance X-ray diffractometer (Germany) using copper (Kα) radiation (1.5406 Å) at a 40 kV voltage and a 40 mA current. Crystallinity index (Cr.I. %) and crystallite size were calculated by the following equations:
where St is the entire domain region and Sc is the crystalline domain region. λ is the wavelength of X-rays, β and θ are full widths at half maxima and Bragg’s angle of XRD peak, respectively.
For thermogravimetric analysis, the prepared polymer powders were studied on Perkin Elmer thermogravimetric analyzer. The specimen was heated to 1000°C at a 10 °C/min rate under a nitrogen atmosphere. The thermal analysis data were recorded to estimate the activation energy (Ea) of the thermal decomposition using the following equations under the Coats-Redfern approach.
where α is the fractional conversion, n is the order of degradation, E is the activation energy, R (kJ/mol.K) is the gas constant, ß (K/min) is the heating rate, A (s−1) is the frequency factor and T (K) is the temperature.
According to the above equations, the plotted relationship between 1/T and the left side of the equation using different appropriate n values should introduce a straight-line correlation. Therefore, the activation energy was determined from the slope (E/2.303R), while A was calculated employing the intercept (log AR/ßE) of Coats-Redfern equation by the most appropriate n value [29,47].
The kinetic activation parameters, including free energy change (∆G), entropy (∆S), and enthalpy (∆H) were estimated by the following equation:
where (k) and (h) are the Boltzman and Planck constants, respectively [29].
Raman spectra and ID/IG values of GO, MGO, G2, and G3 demonstrate in Fig. 1a and Table 1. Raman reveals structural changes during the hydrothermal reduction of GO to MGO. G-band monitored at 1582 cm−1 for GO was red-shifted to 1562 cm−1 for MGO, which confirms the fabrication of Fe3O4 nanoparticles on the surface of rGO and proves an effective chemical reduction [48].
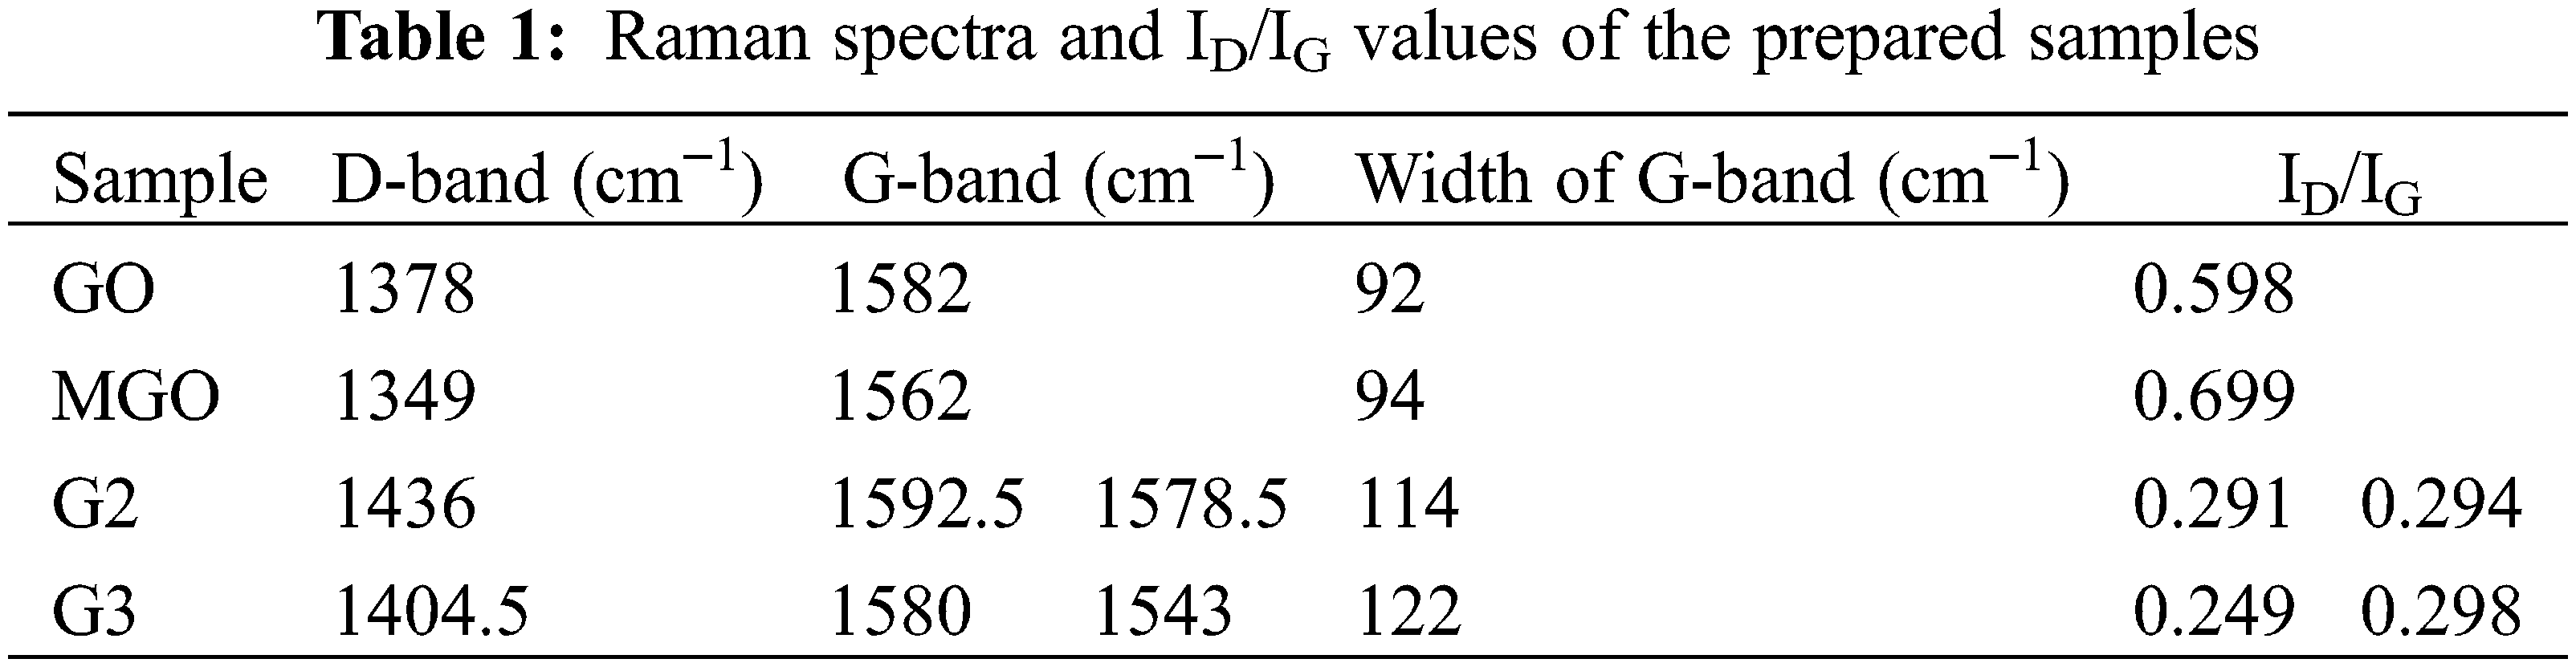
The D-band appeared due to disorders located at 1378 and 1349 cm−1 for GO and MGO, respectively [15]. Thus, the smaller ratios of the ID/IG peak intensities can attribute to lower defects/disorders [15]. The ID/IG ratio of GO is lower than that of the MGO, which does not meet our general anticipations. During the in-situ reduction process, the ID/IG ratio decreases as the number of sp3 defects decrease owing to reduction. Nonetheless, the adverse effect usually monitors. It can explain by forming small sp2 domains with a high fraction of G edges at lesser GO reduction degrees [48]. It may also indicate that the GO decorated with Fe3O4 has additional defects in the graphene structure [48,49].
Furthermore, the high intensity of the D-band as compared to the G-band of MGO proposes the presence of localized sp3 defects within sp2 clusters during the magnetization reaction of exfoliated GO [50]. Meanwhile, a small characteristic Raman peak located around 750.5 cm−1 indicates the presence of magnetite (Fe3O4) [50]. On the other side, the G-band of MGO is broader than that of GO; this ascribes to the structural defects stimulated by attaching Fe3O4 onto the surface of GO [51]. The results were confirmed by recording the hydroxyl band’s relative absorption (RA) values using FT-IR spectra and measuring the crystallinity index (Cr.I. %) using XRD spectra. The Raman spectra also showed that the splitting of the G-band was more pronounced after the grafting process (G2 and G3). Thus, the peak shift owing to heating is not fully reversible; this can contribute to amorphous carbon removal [52,53].
3.2 Fourier-Transform Infrared Spectra
Fig. 1b shows FT-IR spectra of GO and MGO with different ratios of magnetite’s. The FT-IR spectrum of GO proved the presence of oxygen-containing functional groups as carboxylic and hydroxyl functional groups upon oxidation of bagasse. The GO introduced characteristic peaks at 1716 cm−1 due to the stretching vibration modes of the carboxylic carbonyl (C=O) active group located on the edge of GO, 1469 cm−1 attributed to O-C=O of the carboxyl group, 1194 cm−1 due to C-O-C stretching vibrations, 904 cm−1 owing to C-O groups, 2991 cm−1 attributed to C-H stretching, and 1617 cm−1 due to C=C bonds [15]. The oxygen-bearing groups, such as C-O and C=O, further proved that the bagasse was oxidized to GO. The strong peak centered at 3425 cm−1 can ascribe to the hydroxyl stretching vibrations of the C-OH functional groups and water [15].
The intensity of the broadband associated with the C-OH stretching vibration was closely correlated to the oxygen content in the samples [15]. The FT-IR spectrum of MGOs differed from GO as evidenced by the dramatically decreased intensities of the characteristic absorbance peaks of oxygen-bearing functional groups (νO-H, and νC=O) [7]. The vibrational peaks at 904 and 1194 cm−1 can attribute to the symmetric and anti-symmetric stretching vibrations of C-O-C, respectively, which disappeared in MGO spectra owing to the creation of covalent bonding between the oxygen-bearing groups of GO and Fe atoms of Fe3O4 [3]. The Band around 1575–1581 cm−1 attributes to C=C stretching [39]. A new band around 574–595 cm−1 ascribes to Fe-O proving the presence of Fe3O4 [54]. The peak intensity of Fe-O increased with increasing the amount of Fe3O4. The Fe-O intensity improved of Fe-O was an indication for the iron loading into MGO [29,47]. The results indicate that Fe3O4 was successfully decorated onto the surface of GO.
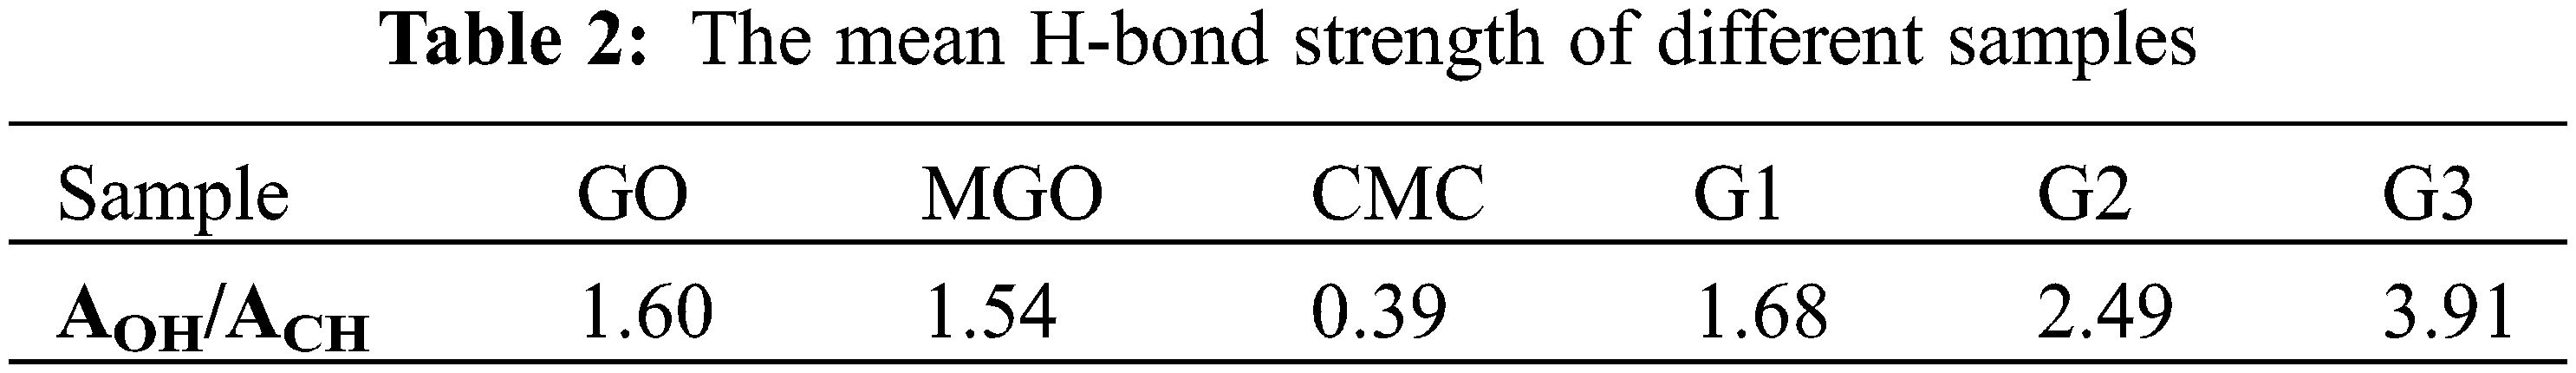
The FT-IR spectra of CMC, Fig. 1c, showed bands at 3422, 1606, and 1061 cm−1 assigned to hydroxyl, carboxylate anion (COO-), and C-O-C stretching, respectively [39]. The OH bands shifted from 3422 cm−1 in CMC to 3402, 3407, and 3409 cm−1 for G1, G2, and G3, respectively. This shift proved the stronger intermolecular H-bonding between OH groups in the grafting reaction with AMPS -NH groups [40,55]. This proved the stronger intermolecular H-bonding between OH groups in the grafting reaction with -NH groups of AMPS [40,55]. The peaks of AMPS owing to asymmetric vibration of S=O centers between 1031–1054 cm−1 in G1, G2 and G3 [40].
Characteristic absorption bands in the region between 1535–1552 cm−1 for G1, G2, and G3 were attributed to the amide bond linkage between the amide groups of poly(AMPS) and the carboxylate carbonyl of CMC, GO, and MGO in the case of G1, G2, and G3, respectively [40]. Decreasing C=O group intensity in G1, G2, and G3 compared to MGO confirmed the successful overlapping between amide and carboxylate groups [39]. A shoulder at 1631–1639 cm-1 can ascribe to free C=O groups [47]. The peak at 1617 cm−1 ascribes to C=C stretching was selected as an internal standard to determine the relative absorption (RA) values [39,56]. The RA of the hydroxyl group was monitored at 1.43, 1.01, 0.77, 0.59, 0.58, 0.47, 1.43, 1.34, and 1.30 for GO, MGO2:1, MGO4:1, MGO6:1, MGO8:1, and MGO10:1, G1, G2, and G3, respectively. The RA of the hydroxyl group confirms the high oxygen-bearing groups in GO compared to MGO, which indicates the incorporation of Fe2O3 onto GO. The mean hydrogen bond strength (AOH/ACH, as an indication of free -OH groups available for further reactions) of GO, MGO, CMC, G1, G2, and G3 are summarized in Table 2 [55].
3.3 X-ray Diffraction Analysis
XRD studied the crystalline phases and structures of the prepared samples. XRD studied the crystalline phases and structures of the prepared samples. GO displayed signals at 2θ = 9.3 and 21.8° correlated to (001) and (002) plans indicate the incomplete oxidation of SCB [54]. Weaker carbon peaks were observed in MGO2:1 due to the presence of magnetite with the ability to reduce the aggregation of GO sheets (Fe2+ ions act as a reducing agent for GO), which results in more monolayer GO (Fig. 1d). XRD pattern of MGO2:1 showed six characteristic peaks corresponding to Fe2O3 at 2θ = 30.5°, 34.3°, 43°, 47°, 53.1°, and 61.6°, which assign to their reflections including (220), (311), (400), (442), (511), and (440), respectively [47]. The variations in the crystalline constitution of CMC, G1, G2, and G3 occur due to graft copolymerization on the CMC surface. Slightly wider reflections for CMC were monitored at 2θ = 10.31, 20.13, and 22.45. The reflection at 10.31° is characteristic of the CMC amorphous patterns [39].
The crystallinity index (Cr.I.) of GO, MGO, CMC, G1 < G2, and G3 are displayed in Table 3. The Cr.I. of GO decreased when combined with magnetite, and it can attribute to the co-precipitation reaction during the synthesis process. This precipitation can diminish the crystallinity by reducing the aggregation of GO sheets [31]. The increasing crystallinity values of G1, G2, and G3 compared to GO, and MGO can attribute to the decomposition of the amorphous fractions of GO and MGO during the reaction steps [39]. The d-spacing of MGO, G1, G2, and G3 is higher than GO due to the oxygen-bearing moieties intercalating in the interlayers of graphene [35]. The calculated average crystallite size of MGO2:1 is 199.5 nm, which agrees with TEM results for the peak corresponding to the (311) plane.
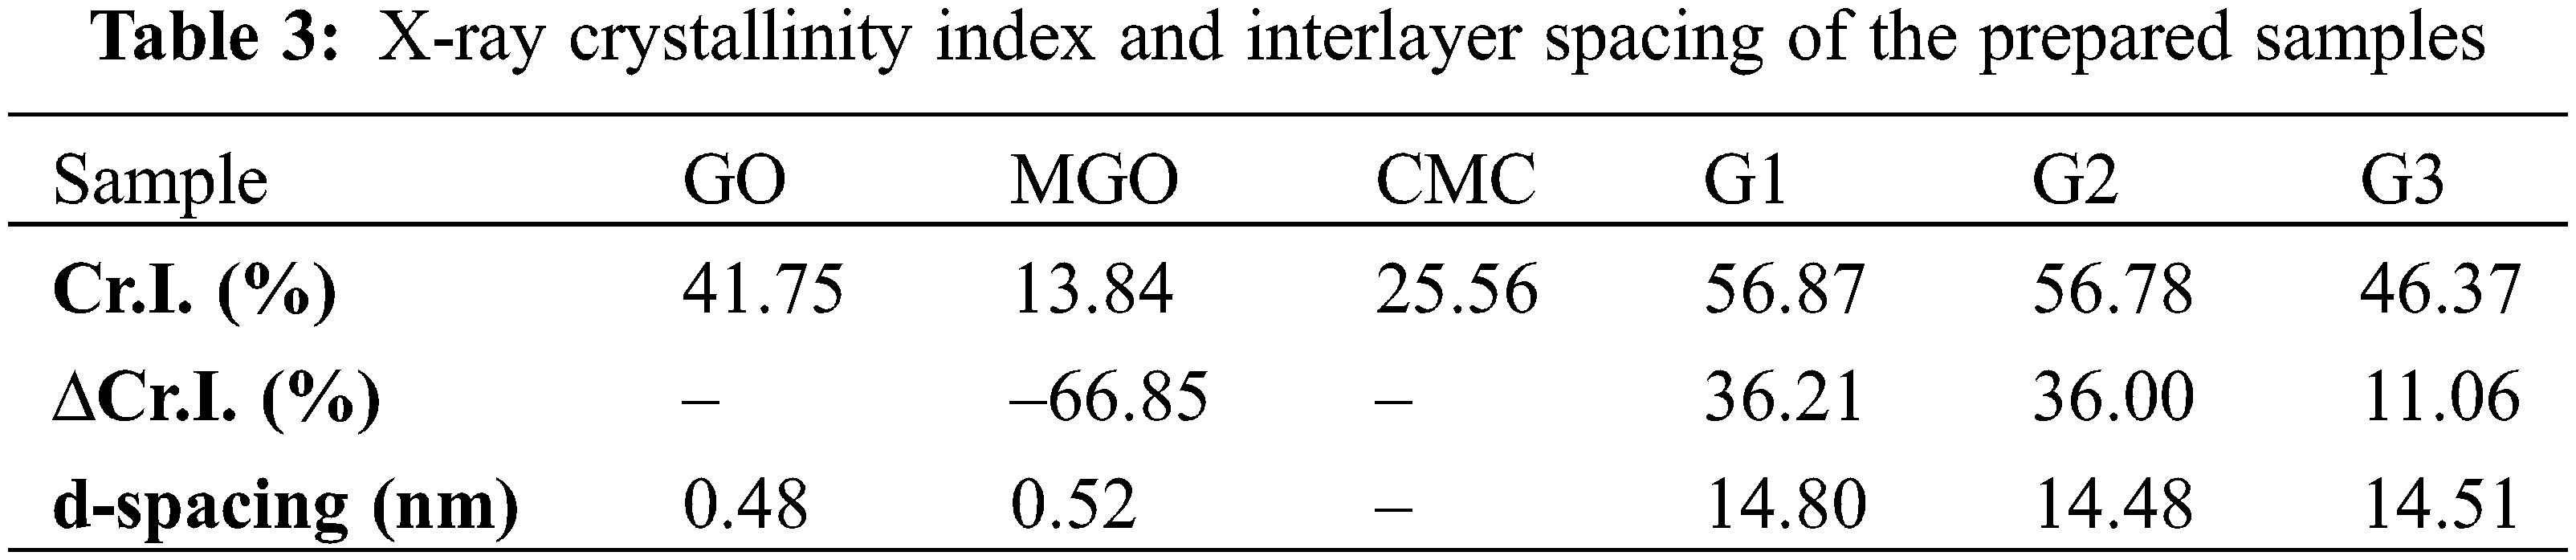
Table 4 shows the saturated magnetization (Ms, the maximum possible magnetization) and remnant magnetization (Mr, the magnetization left in NPs when the external field is taken away) of MGO. The values of Ms showed a sequence of MGO10:1 > MGO8:1 > MGO6:1 > MGO4:1 > MGO2:1 to indicate that the magnetic saturation increases with increasing Fe3O4 ratio. Magnetic susceptibility and remnant magnetization (Mr) increases directly with increasing Fe3O4 ratio (Fig. 1f).
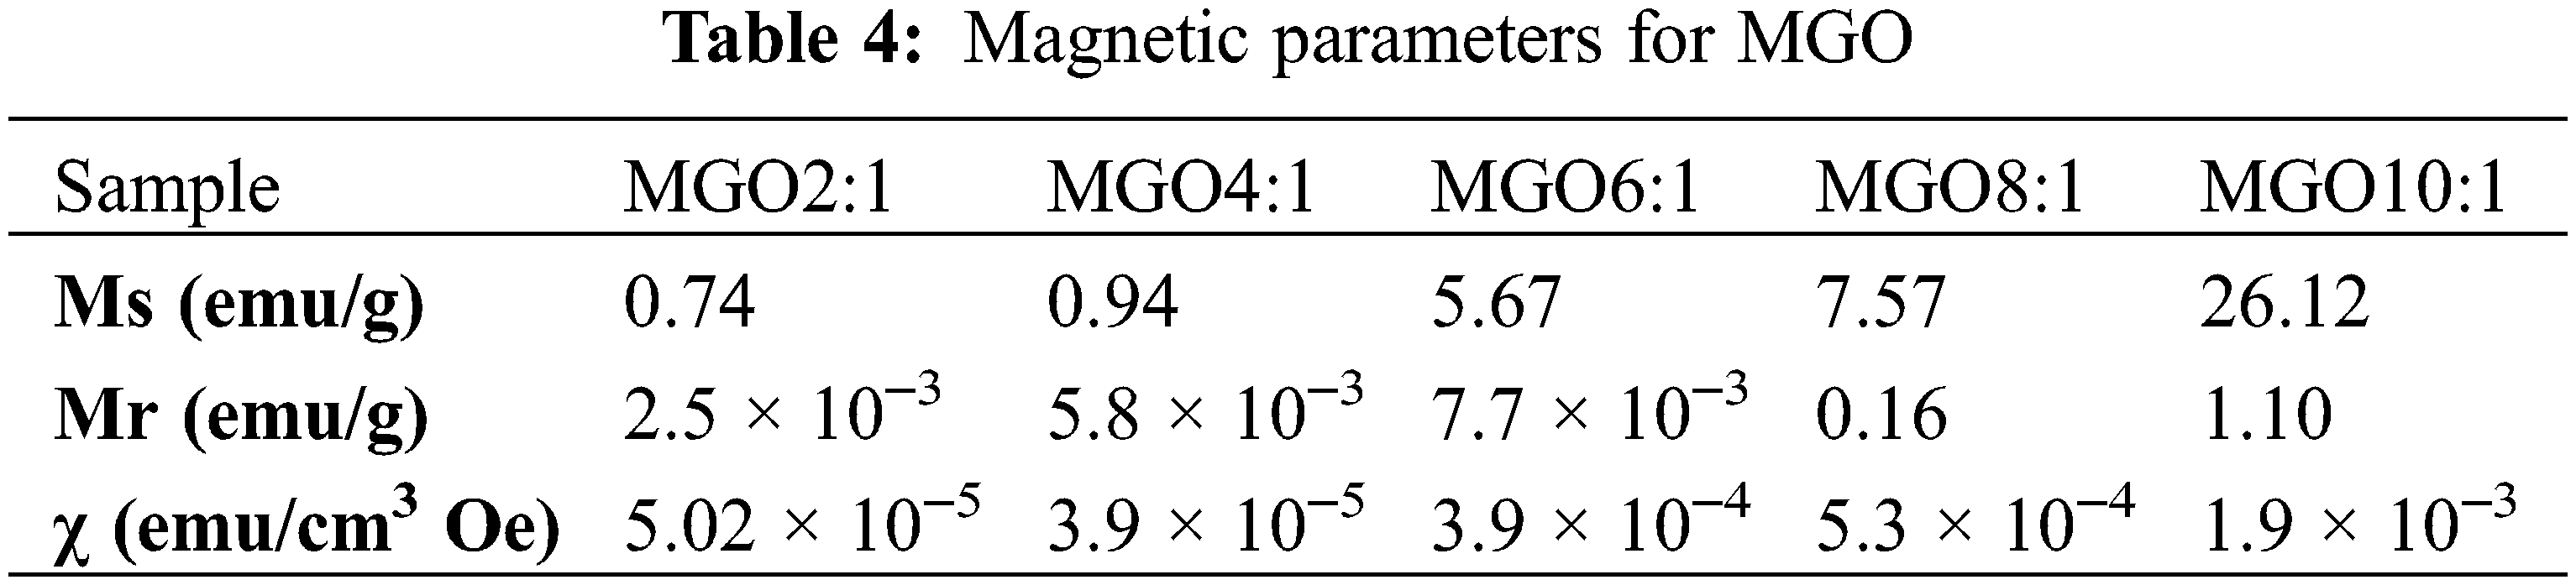
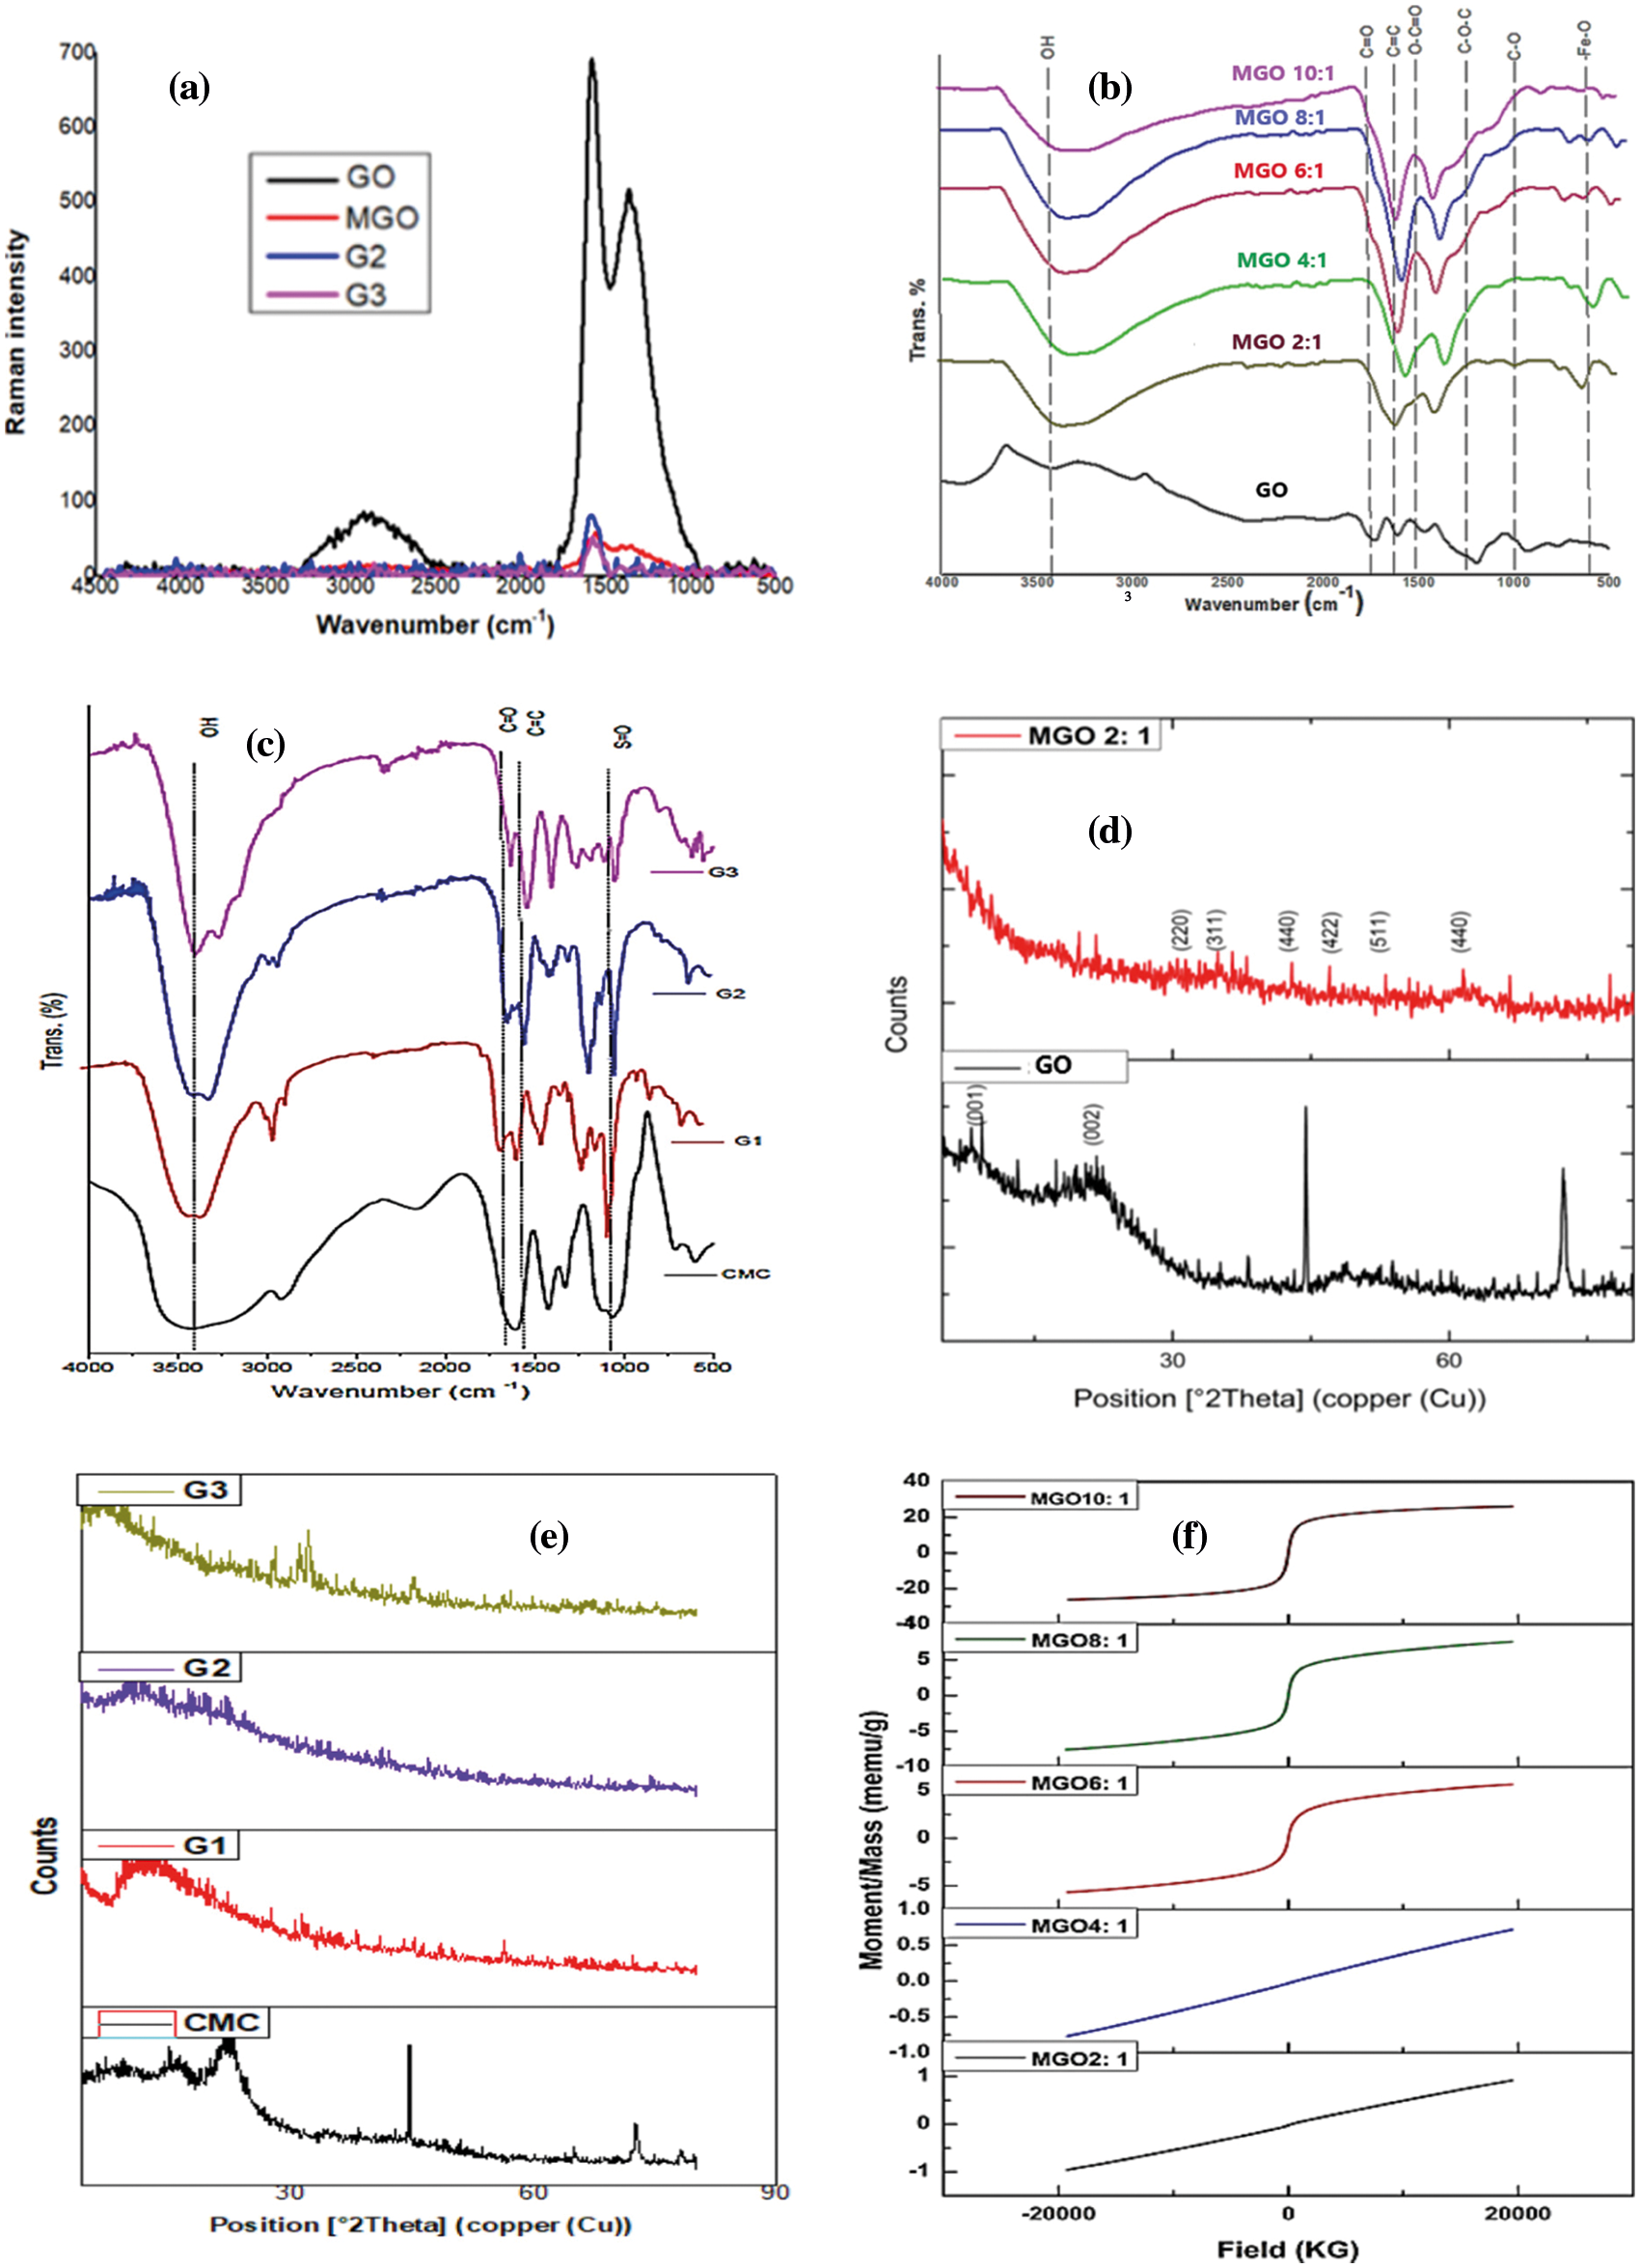
Figure 1: (a) Raman spectra of GO, MGO, G2, and G3. (b) FT-IR spectra of GO and MGO. (c) FT-IR spectra of CMC, G1, G2, and G3. (d) XRD patterns of GO and MGO. (e) XRD patterns of CMC, G1, G2, and G3. (f) The magnetic hysteresis curve of MGO nanocomposite
Fig. 2 displays the Transmission electron microscopy (TEM) images of GO and MGO; GO is sheet-like (Fig. 2a), and the Fe2O3 nanoparticles are well-dispersed onto the GO sheet (Fig. 2b). Nonetheless, it has been challenging to get monodispersed Fe2O3 nanoparticles due to their magnetism [54]. Fig. 2 shows that the hydrogel can be separated from the solution using an external magnet, and shows also the gels shape. Fig. 3 shows the scanning electron microscope (SEM) images of GO, CMC, MGO, G1, G2, and G3. The synthesized GO sheets are randomly aggregated with rounded folds. The surface of GO was relatively flat. After combination with Fe2O3, the GO acted as a growing matrix for Fe2O3 nanoparticles. The MGO has a porous surface and many holes. The Fe3O4 nanoparticles possess high surface energy, resulting in aggregation and folding of GO sheets due to the high inter-particle attraction. MGO exhibited a porous interconnected laminar architecture with a random distribution of micro-sized pores (Fig. 3G2). Finally, the surface morphology of magnetic hydrogel demonstrated the dense layer of MGO onto the hydrogel surface (Fig. 3G3). The structure is highly compact due to its high inter-particle attraction and magnetism [54].
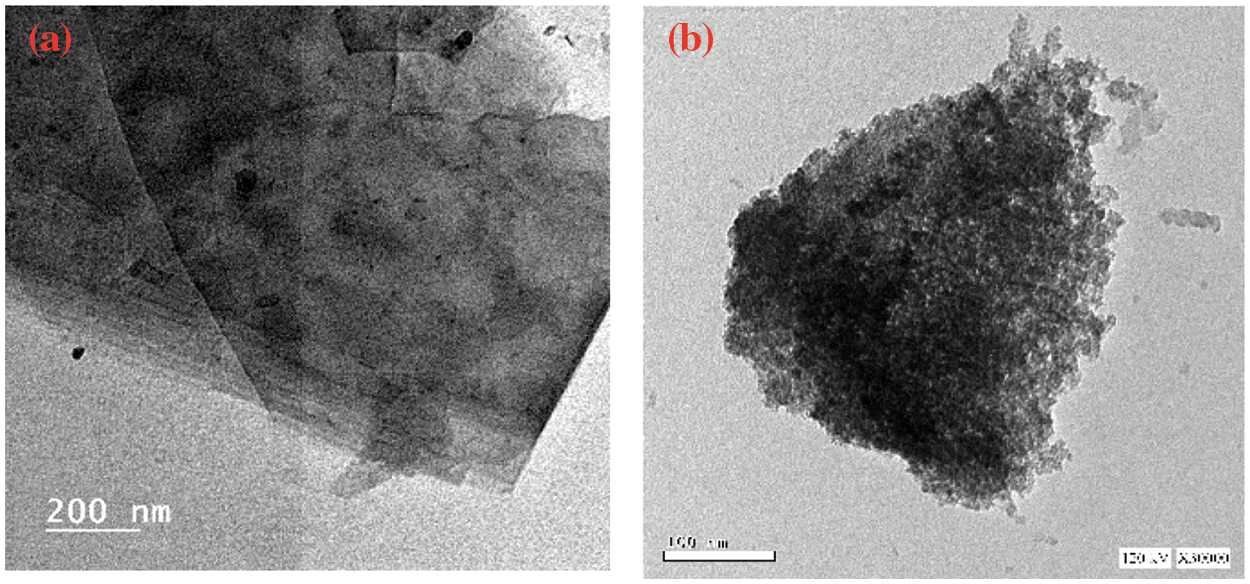
Figure 2: TEM of (a) GO and (b) MGO


Figure 3: Digital photos, SEM and EDX analysis of GO, CMC, MGO, G1, G2, and G3
The qualitative chemical composition was explored using energy-dispersive X-ray (EDX) spectral analysis. The detected iron (Fe) proved the incorporation of MGO onto the surface of GO. Additionally, the oxygen contents of MGO and hydrogel is lower than that of GO due to the incorporation of Fe2O3 and the grafting process.
TGA was performed to know the samples stability if used at elevated temperature. The TGA/DTA analysis for GO, MGO, G1, G2, and G3 are given in Figs. 4, 5 and Table 5. The decomposition curves of GO, G2, and G3 revealed three decomposition steps, while G1 revealed four decomposition steps, and the MGO decomposition curve showed two decomposition phases. The difference in thermal stability and decomposition activity is due to the chemical compositions between GO, MGO, and magnetic hydrogel [29,47]. The sudden temperature changes cause a thermal shock, and functionalities are taken out from the lattice of GO. In addition, as a critical factor for exfoliation, the evolution of gases creates pressure among two stacked layers of GO [29]. The TGA/DTA of GO, MGO, and magnetic hydrogels (G1, G2, and G3) showed a weight loss of 76.80, 62.41, 62.92, 75.64, and 77.72%, respectively, at 1000°C, which indicated a fractional existence of non-volatile contents. The thermal decomposition process of MGO can divide into two major phases; the first weight loss was in the range of 38.8–647.44°C with a maximum temperature of 84.47°C and an average weight loss of 38.02%, which is most likely attributed to the loss of moisture content. The second endothermic stage is between 647.52 and 994.3°C, with a maximum temperature of 730.16°C and an average weight loss of 24.39%. This step attributes to pyrolytic fragmentation [29,47]. Thus, the thermal decomposition of G2 and G3 displayed three main steps. The first weight loss was between 41.43–103.42 and 39.17–119.96°C with maximum temperature values at 91.07 and 83.44°C and average weight loss of 12.27 and 27.43%, respectively. This is attributed to losing moisture [29,47]. The second weight loss was between 266.05–313.7 and 345.11–419.93°C with maximum temperature values at 279.16 and 371.01°C and an average weight loss of 35.89 and 26.16% for G2 and G3, respectively. This is attributed to several coincident processes, such as dehydroxylation reaction in combination with pyrolytic degradation. To result in the generation of aromatized moieties and volatile products [29,47]. In other words, pyrolysis of the most unstable oxygen-containing groups is followed by releasing CO, CO2, and steam in the second decomposition step [29]. The third decomposition step was between 313.78–990.51 and 578.11–988.16°C with maximum temperature values at 349.37 and 618.02°C and an average weight loss of 27.48 and 24.13%. The third decomposition step was attributed to the decomposition of the residual carbonaceous to generate low molecular mass volatile products [29,47].
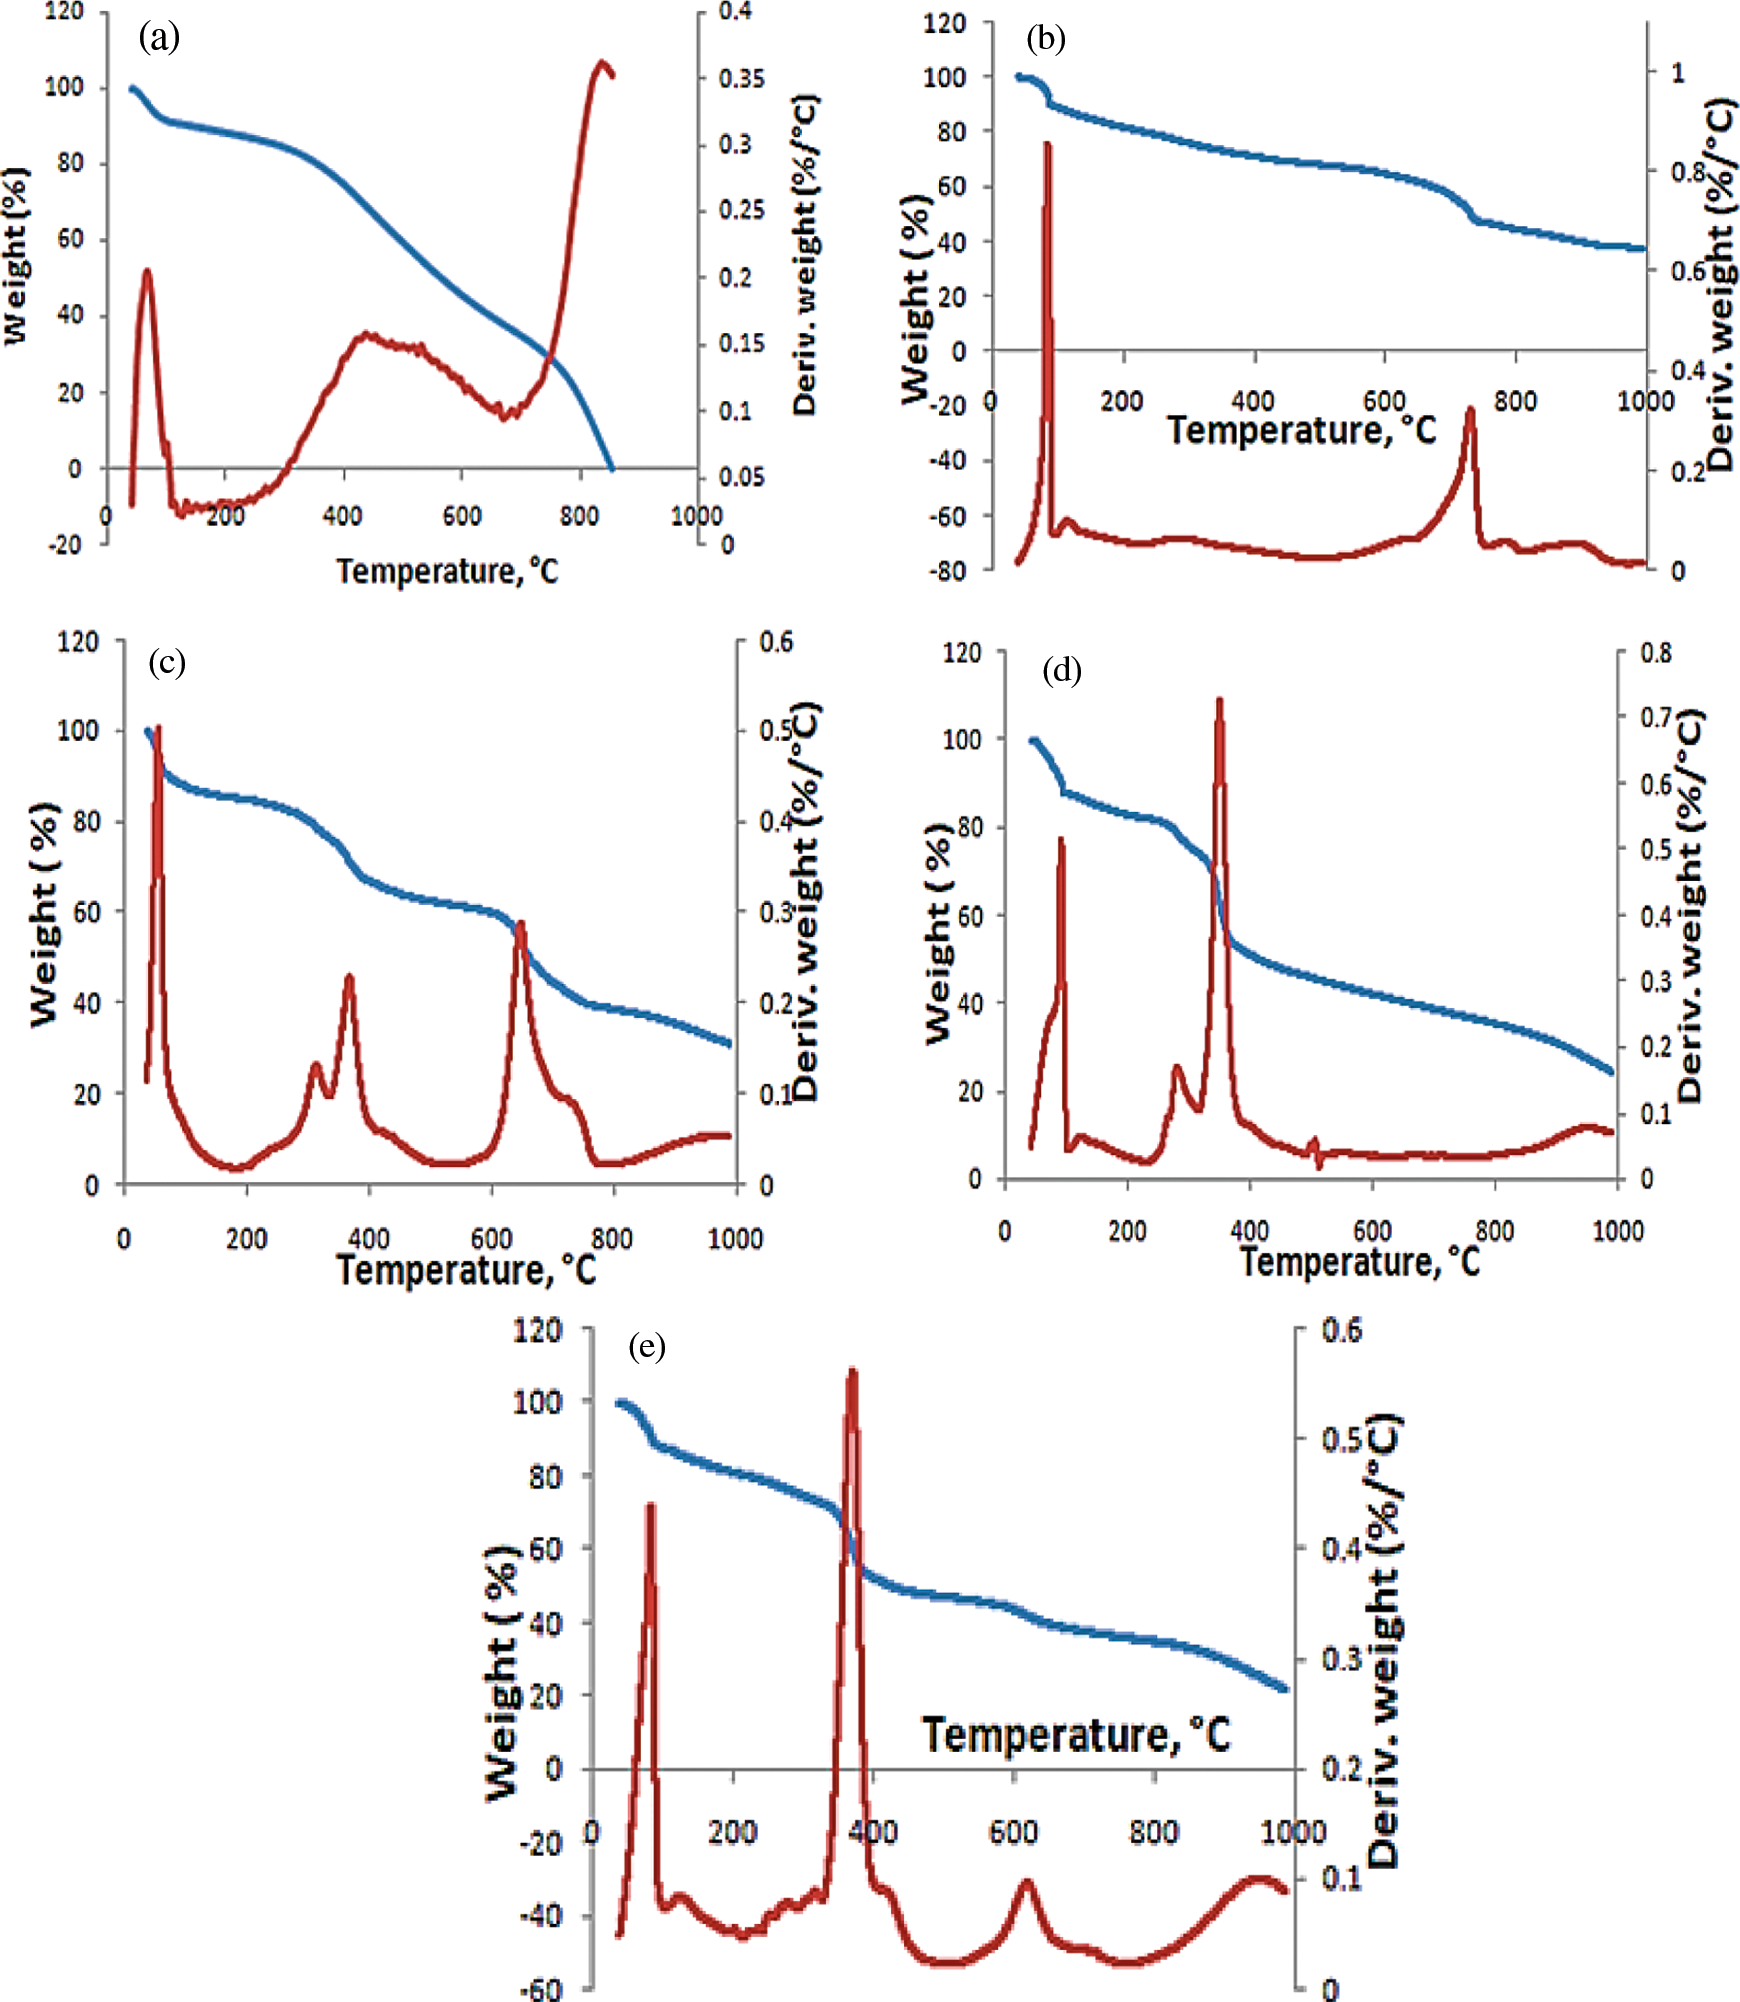
Figure 4: TGA and DTA curves of (a) GO, (b) MGO, (c) G1, (d) G2, and (e) G3
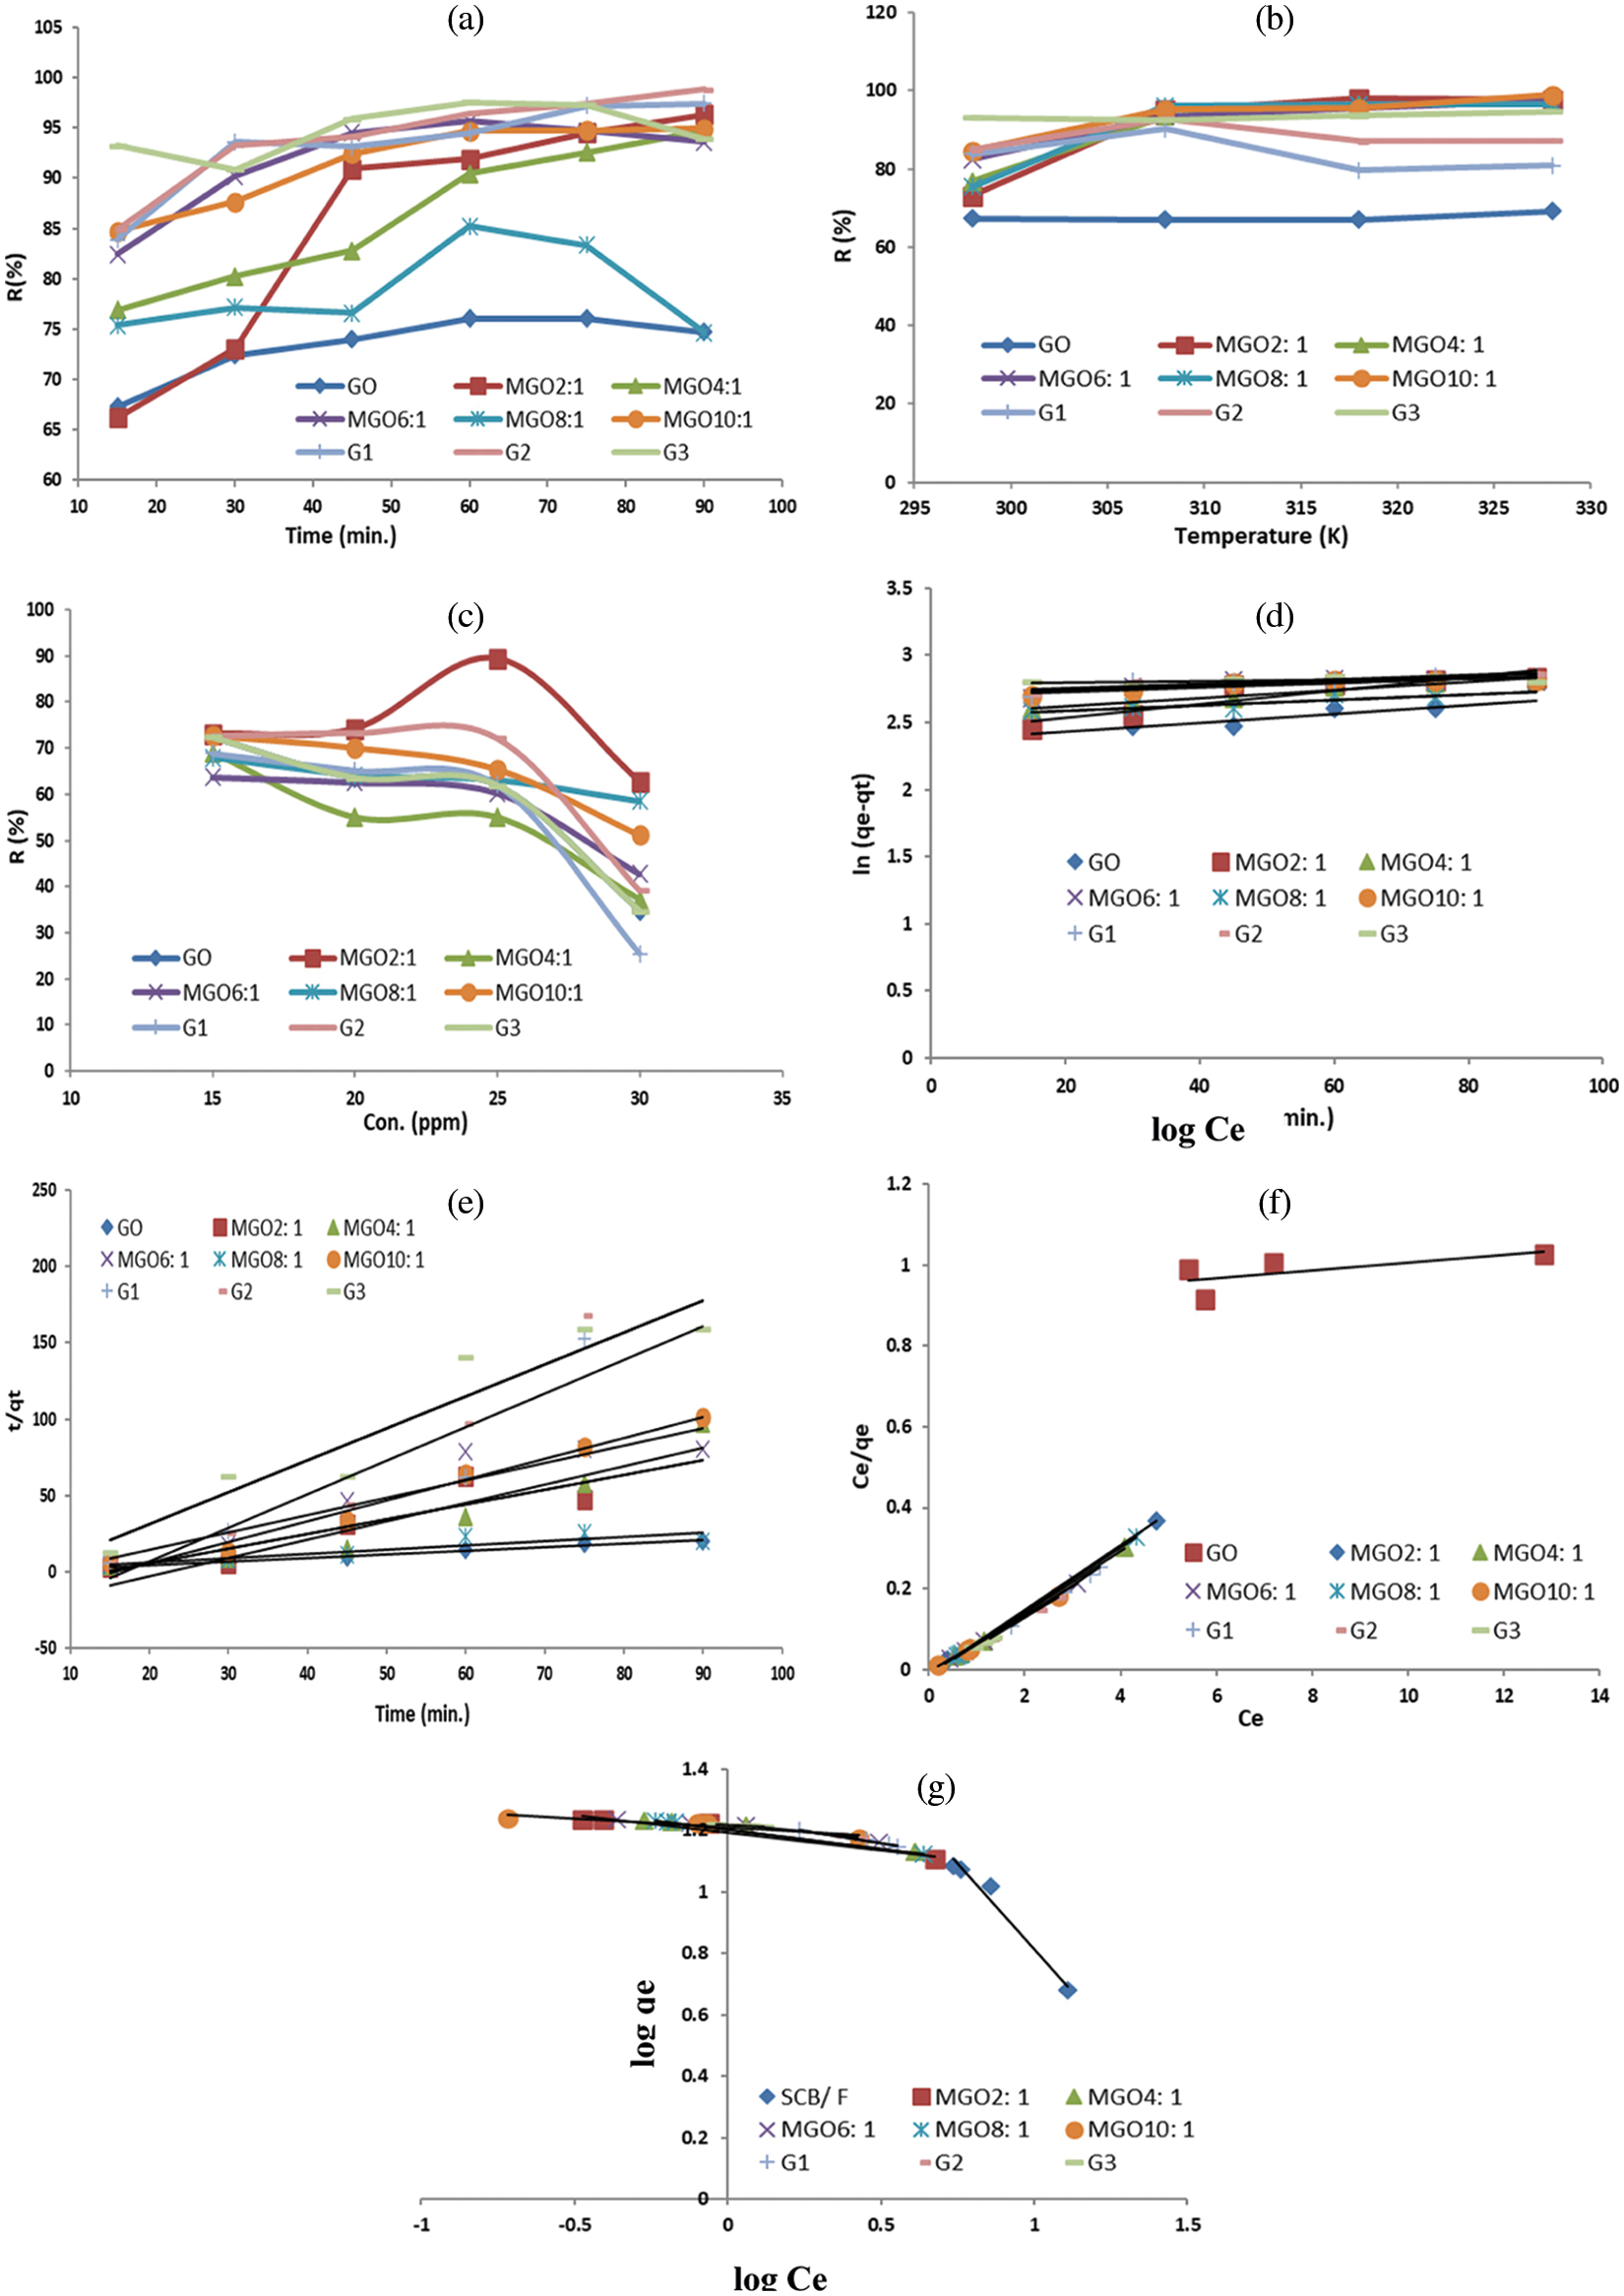
Figure 5: Effect of (a) Contact time, (b) Temperature, (c) Ni(II) initial concentration, on Ni(II) adsorption. (d) Kinetics of pseudo first order (e) Kinetics of pseudo second order, (f) Langmuir isotherms, and (g) Freundlich isotherms
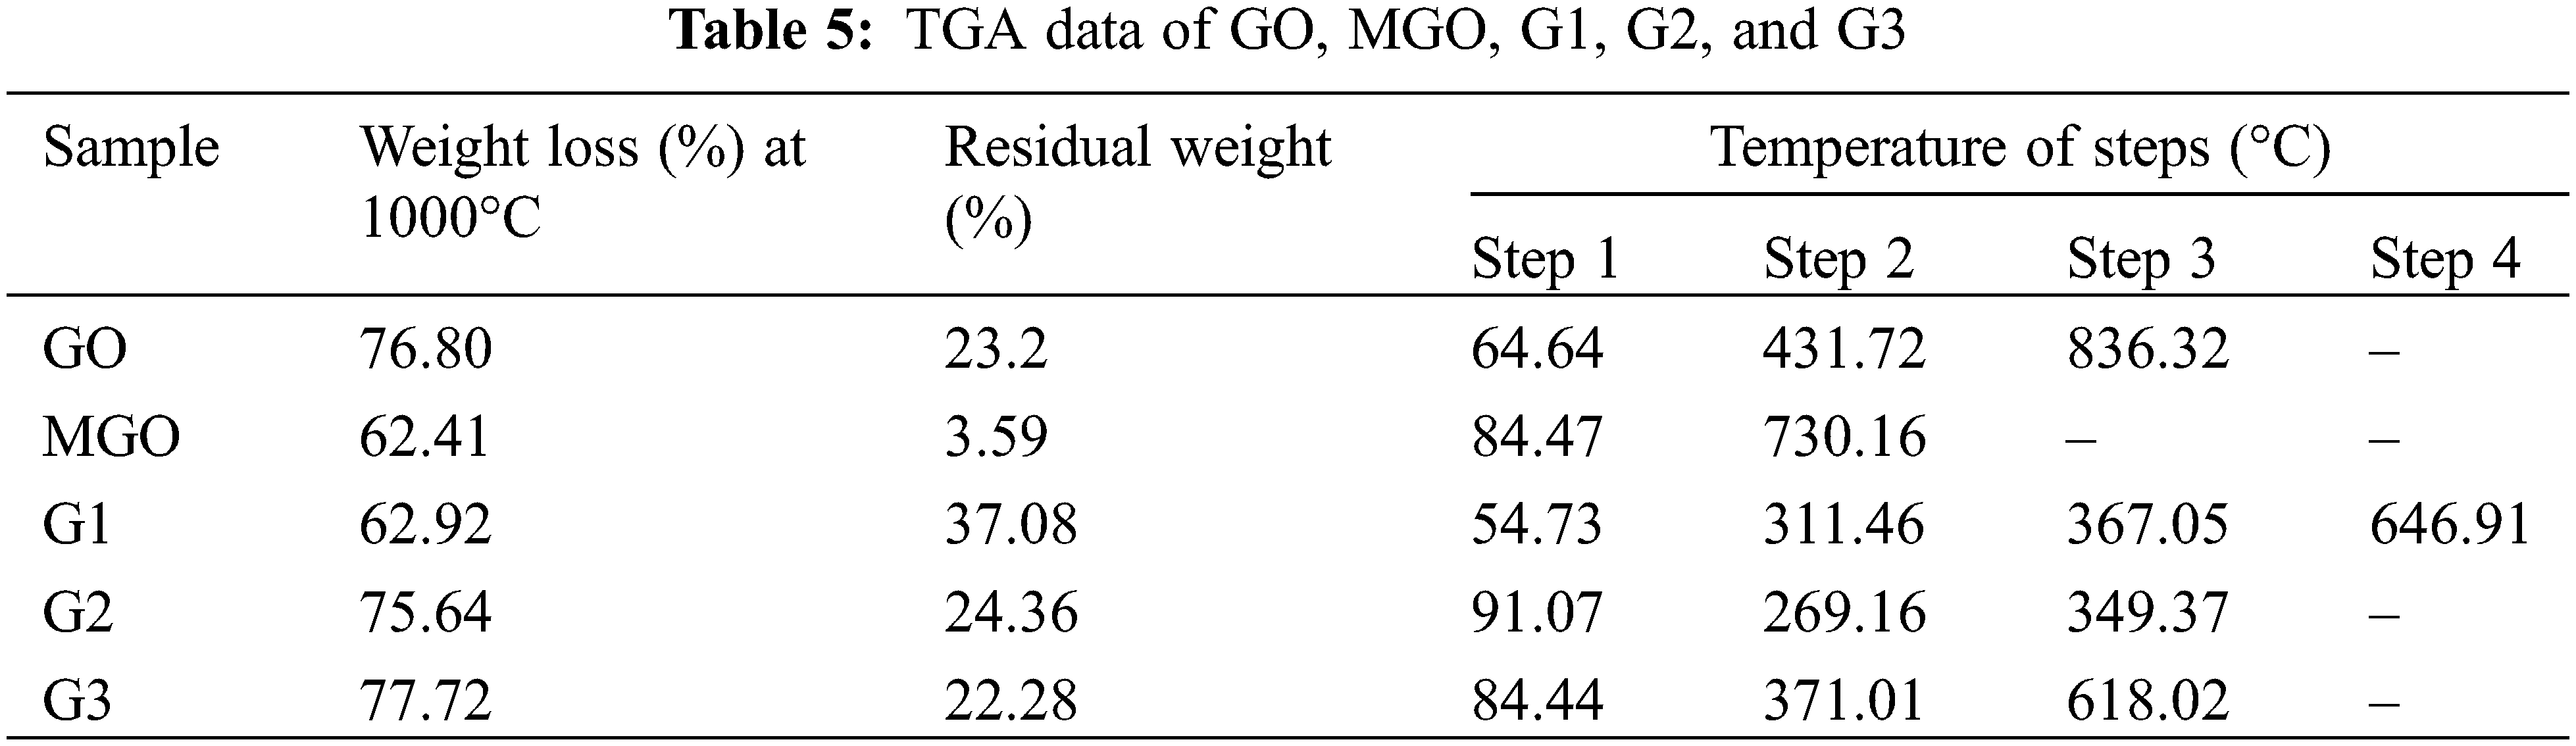
The thermal decomposition processes of G1 showed four main steps. The first weight loss was between 40.28–76.27°C with a maximum temperature of 54.73°C and an average weight loss of 10.42%, which is ascribed to the moisture loss [29,47]. Interestingly, the shape of thermogram curve changes of G1 (Fig. 4c) showed that the 2nd degradation stage splits into two phases with total. The results indicate the relatively higher thermal stability of G1 than GO. These main stages may correspond to the degradation of the new composite resulting from an interaction between CMC with GO, MGO, and AMPS [29,47]. The 3rd decomposition step was between 618.03 and 988.78°C with a maximum temperature value of 646.91°C and an average weight loss of 29.31% [29,47].
Fig. 5a shows the effect of contact time on the ability of adsorbent, which showed the highest adsorption efficiency, in removing Ni(II) by changing the time from 15 min to 90 min at 25°C. Ni(II) removal by adsorbents was rapidly increasing initially owing to more active sites, especially at the first 30 min [15]. However, the elimination rate turned out to be slower. There were no apparent increments in the adsorption rate monitored after 75, 90, 90, 60, 60, 60, 75, 90, and 75 min, which are the optimized periods for the adsorption of Ni(II) at 25°C onto the adsorbents; GO, MGO2:1, MGO4:1, MGO6:1, MGO8:1, MGO10:1, G1, G2, and G3, respectively.
The delay in adsorption time may attribute to the weakening of the driving force resulting in the decrease of the available adsorption sites. This decrease in the general adsorption sites results from releasing H+ from the oxygen-containing functional groups (e.g., COOH or OH) on the adsorbent surface to the solution, hence delaying adsorption. The differences in the adsorption capacities of Ni(II) confirmed that the adsorbents did not exhibit similar morphology. The removal efficiency of MGO2:1 is much higher than other MGO ratios. When MGO was transformed into a hydrogel, the removal efficiency was enhanced and increased in the case of G3. Figs. 5a and 5b shows a lower removal efficiency for both of individual GOs, and pure hydrogel.
In this section temperature effect on the adsorption capacity of different adsorbents was carried out at different temperatures (298 to 328 K) with an initial concentration (15 mg/L) and depended on our previous study [9] the adsorption was studied for 30 min. Upon increasing the temperature from 298 to 328 K, Ni(II) elimination by GO, MGO2:1, MGO4:1, MGO6:1, MGO8:1, MGO10:1, G1, G2, and G3 increases, suggesting that the adsorption is an endothermic process (Fig. 5b). The endothermic process can attribute to enlarging the pore size and activating the surface of the graphene oxide derivatives [15]. In addition, the diffusion rate of Ni(II) increased through the external boundary layer and across the GO derivatives’ internal pores by increasing the adsorption temperature. Thus, GO derivatives’ Ni(II) adsorption may comprise chemical and physical adsorption owing to the high elevated temperature.
3.7.3 Effect of Initial Concentration
The effect of the initial Ni(II) concentration was studied by employing different initial concentrations 15, 20, 25, and 30 mg/L, at 25°C, for 30 min (Fig. 5c). The elimination of Ni(II) increased with increasing the initial concentration. As Ni(II) ratio increases, the exchangeable sites in the adsorbent are saturated, leading to depreciation. The removal percentage of Ni(II) using MGO was increased with increasing Ni(II) concentration. This can attribute to the significant driving force delivered by the initial concentration to defeat all mass transfer resistances among solid and liquid phases.
According to R2 values presented in Table 6 and results of Figs. 5d and 5e, it is monitored that the pseudo-second-order model showed a better fit to the adsorption results compared to the pseudo-first-order model for all samples except MGO4:1. The values attained in the pseudo-first-order model are suitable for depicting Ni(II) sorption kinetics. So, the surface of adsorbents exhibited both chemisorption and physisorption adsorption of Ni(II). Furthermore, the R2 values of MGO4:1 showed that the Pseudo-first-order model presented a better fit to the adsorption results than the pseudo-second-order model. Table 6 shows that the removal efficiency of MGO2:1 is much higher than other MGO ratios. So, MGO2:1 was transformed into a G3 hydrogel. The aim of the research is to reach the highest efficiency of ion removal in conditions similar to that of polluted water (≥95%, Figs. 5a and 5b), not the highest value of mg/g. Under the studied adsorption conditions, the maximum calculated percentage of adsorption is 15–20 mg/g. Sorption capacities of different adsorbents (15–17 mg/g, Table 6) under comparable experimental condition are in agreement with previous reported results [57,58].
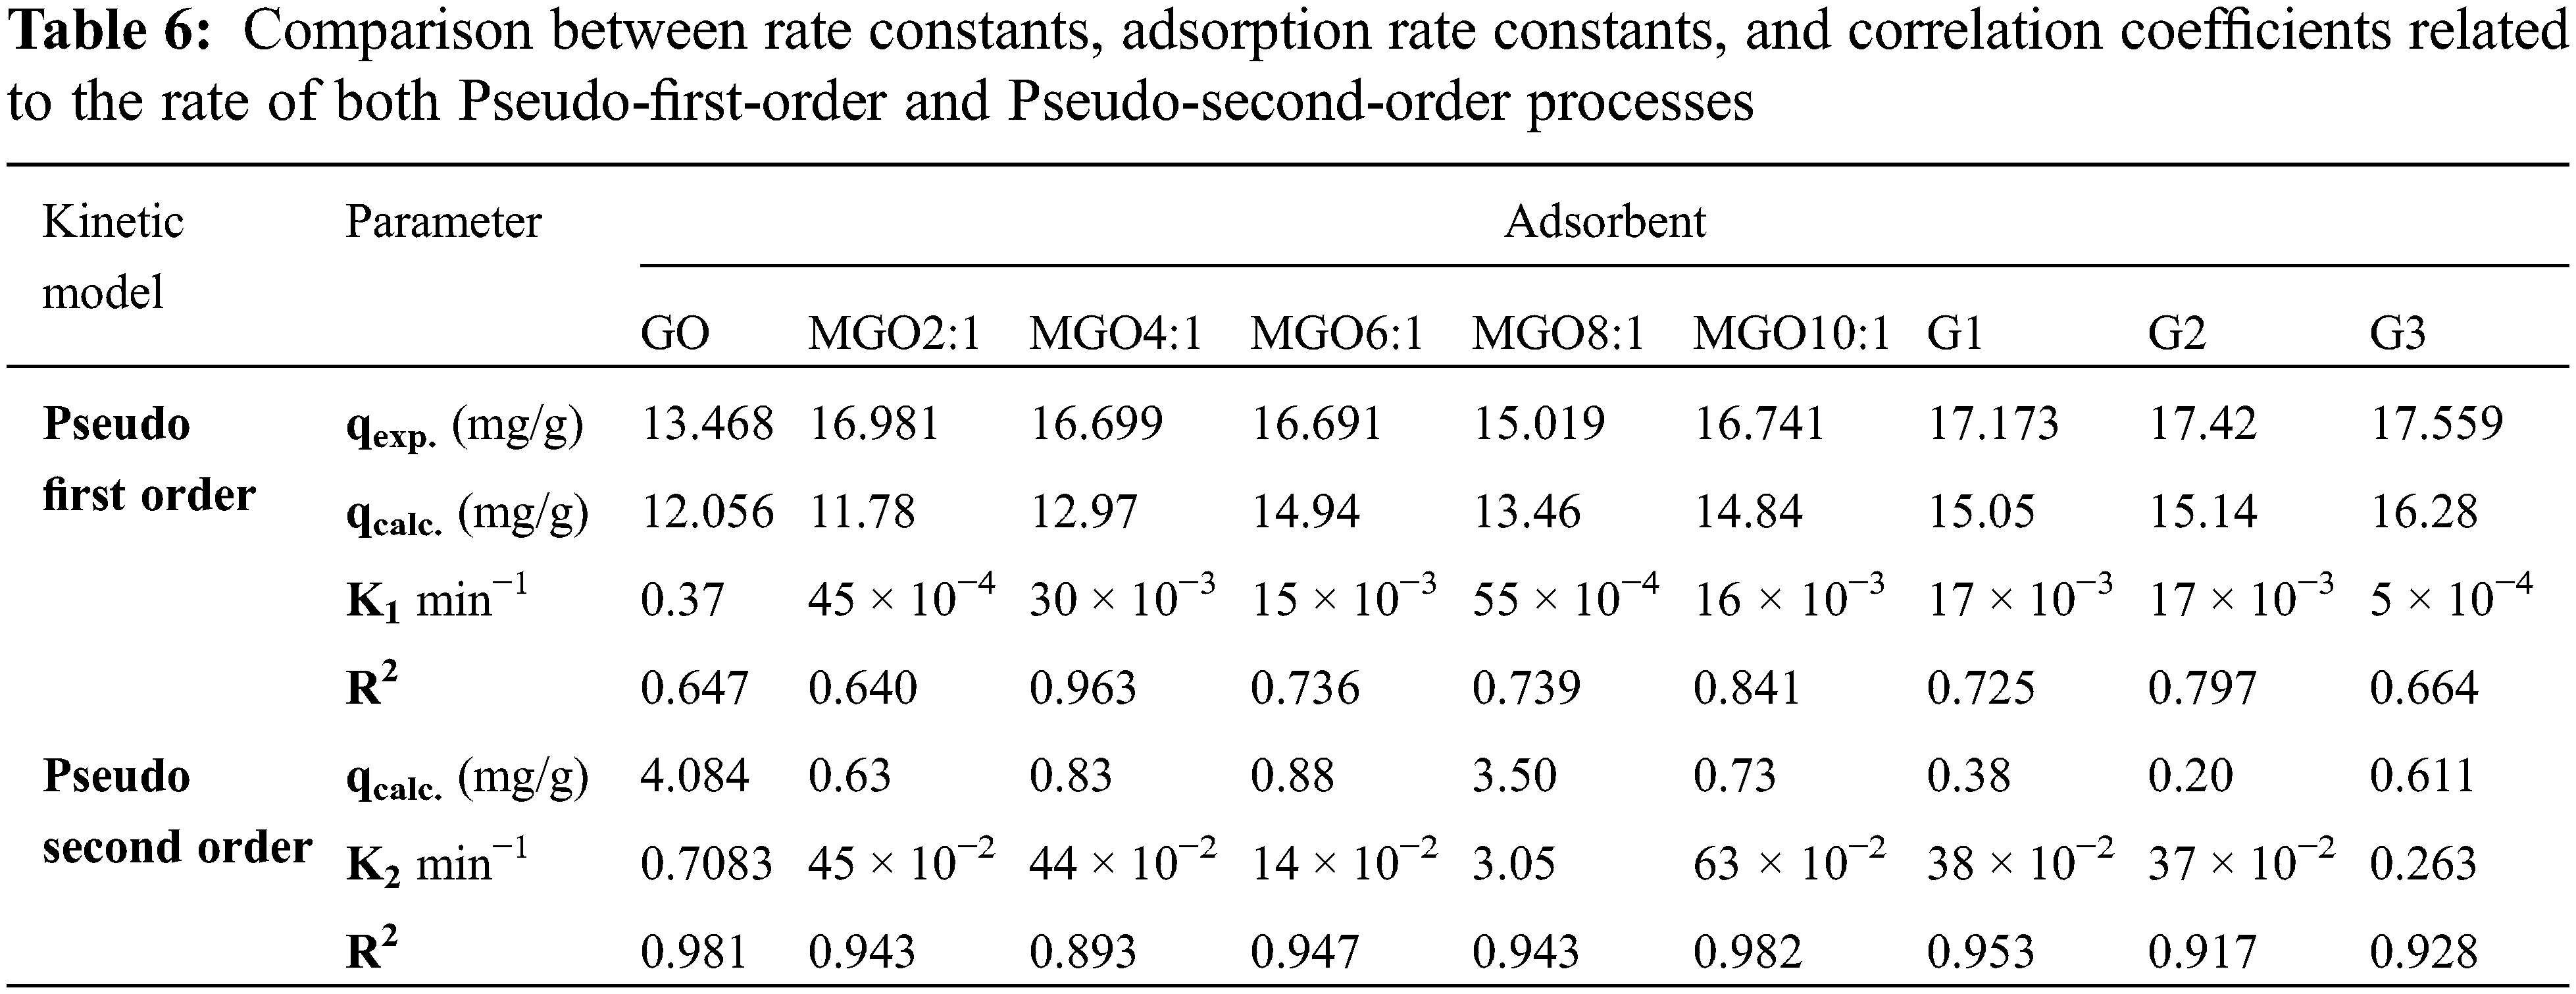
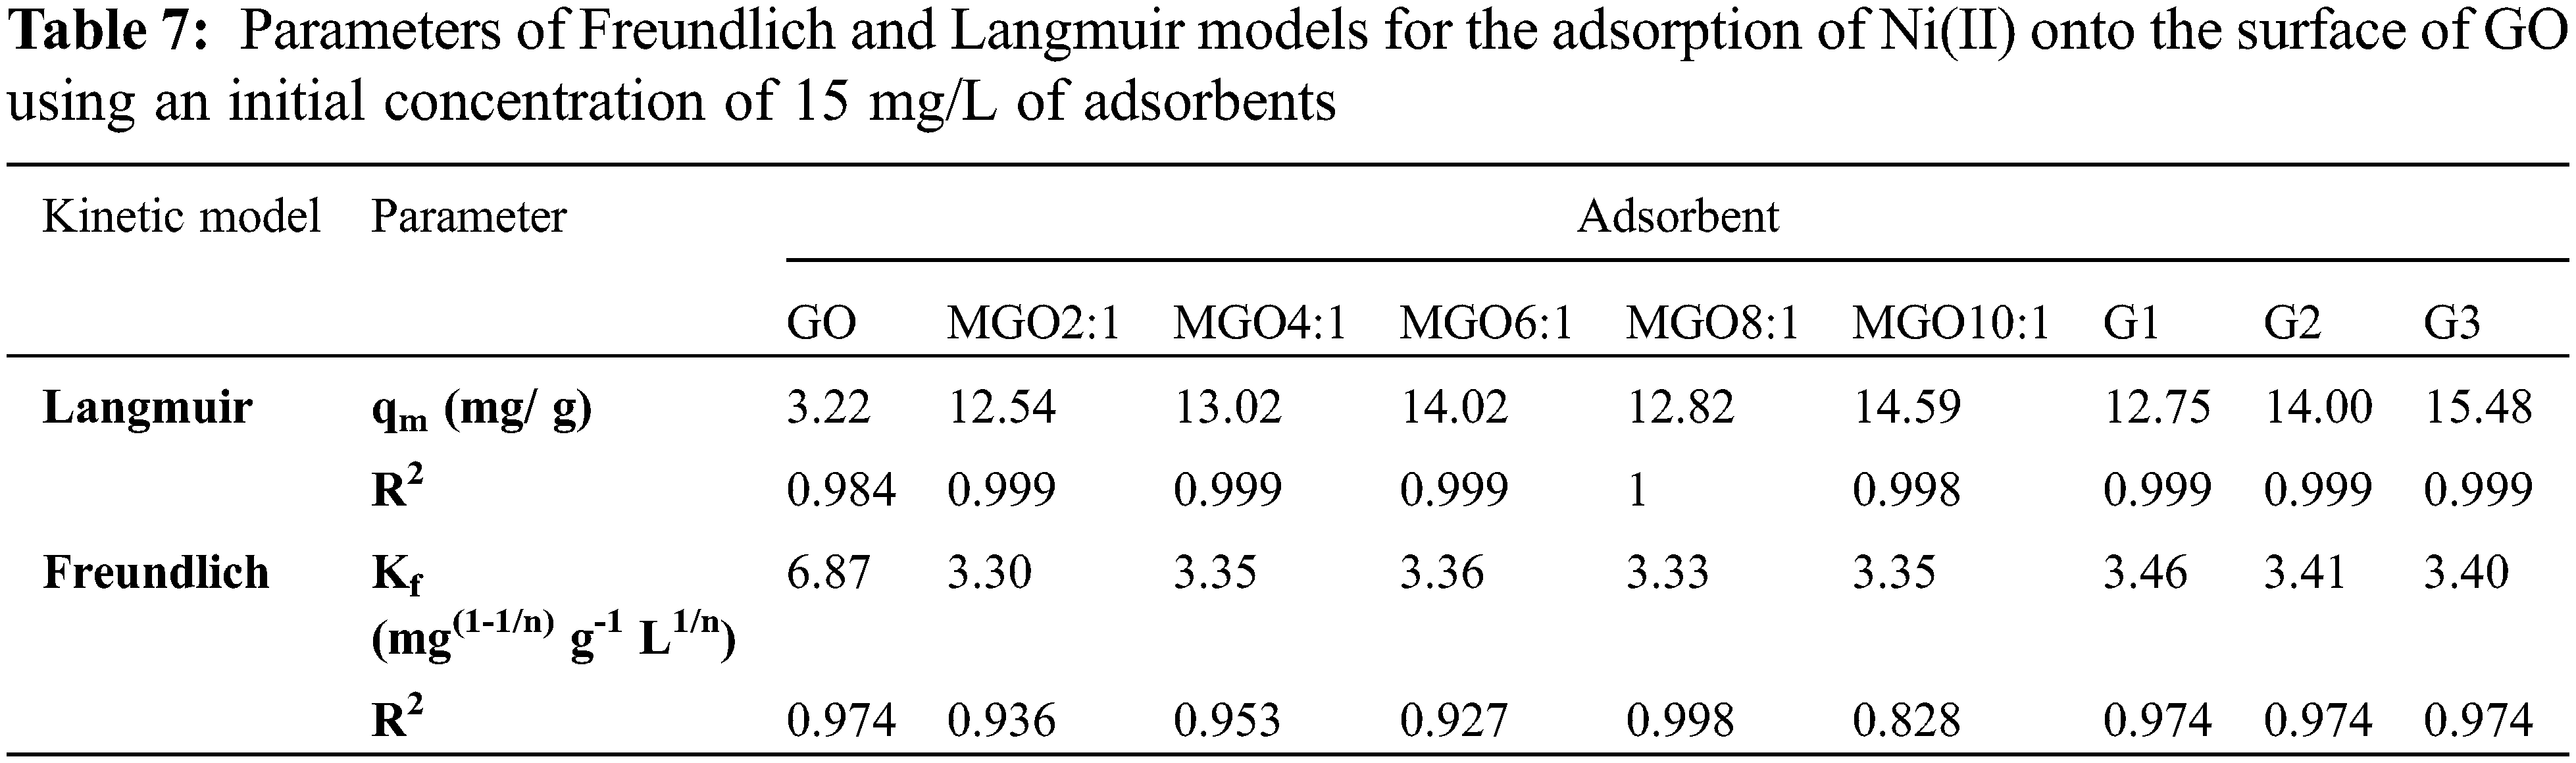
All isotherms were found to best fit the Langmuir model due to the high value of R2 (Table 7). Thus, it can conclude that GO, all MGO, G1, G2, and G3 surfaces are homogeneous, and the surface adsorption mainly occurs in a monolayer form [15]. Both Langmuir and Freundlich isotherms of Ni(II) on the hydrogel surfaces are displayed in Figs. 5f and 5g.
3.7.6 Thermodynamic Parameters
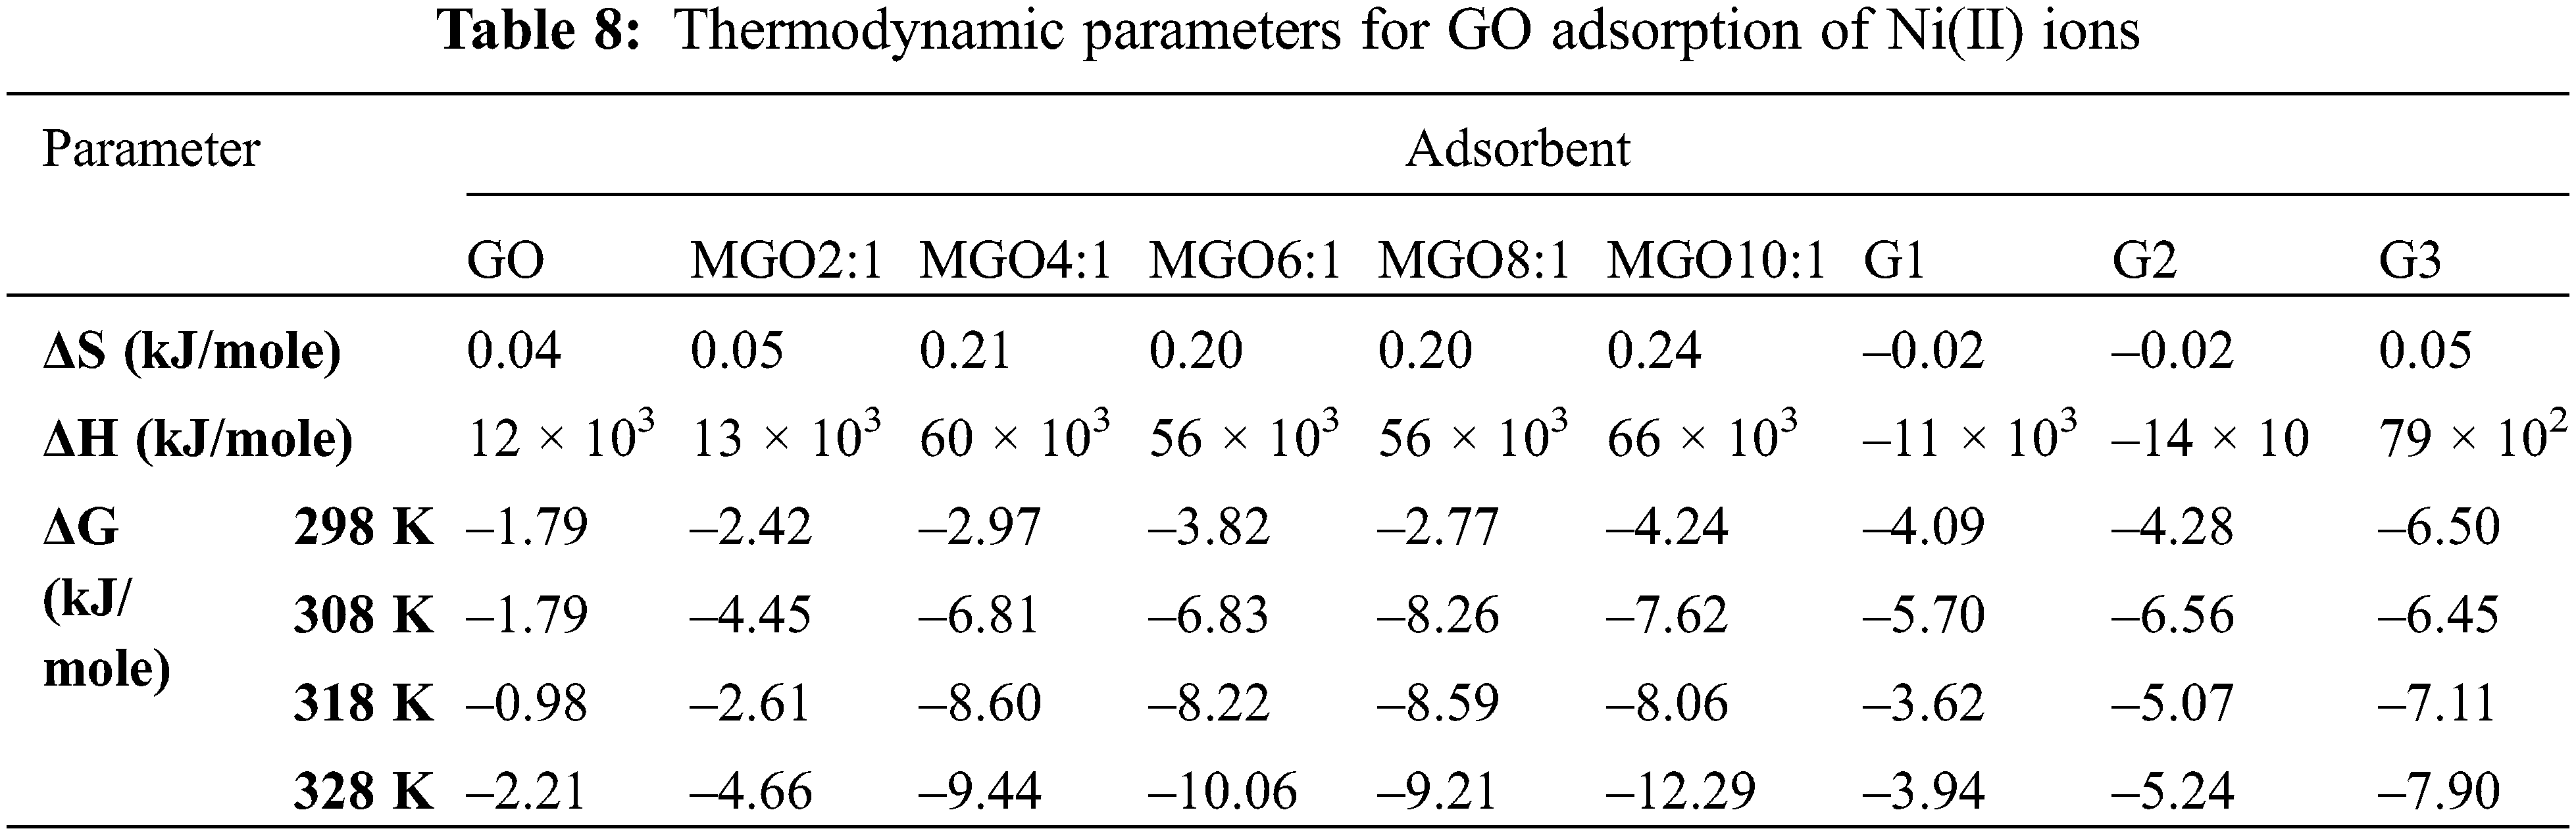
The negative value of ΔH in the case of G1 and G2 is attributed to the exothermic process. In contrast, the positive value in the case of other adsorbents is attributed to the endothermic process [41]. We noted a decrease in the ΔG° with increase in temperature which indicated more efficient adsorption at high temperature. The decrease in ΔG° values shows the feasibility of adsorption as the temperature increased. The negative ΔG° values indicate that the process is feasible and spontaneous [41,59]. In addition, increasing randomness appeared on the GO-solution boundary during Ni(II) adsorption; it can conclude that the change in solution temperature influenced GO adsorption [41]. Table 8 displays the thermodynamic parameters for the adsorption of Ni(II) onto GO derivatives.
In summary, we described the adsorption efficiency of Ni(II) from aqueous media using eco-friendly absorbent MGO hydrogels. We developed a single-step preparation of GO via ferrocene-based oxidation of sugarcane bagasse. The generated GO was utilized as a starting material to fabricate MGO via co-precipitation reaction of iron onto GO. Carboxymethyl cellulose-g-MGO-poly(co-acrylamide-2-methyl-1-propane sulfonic acid) hydrogel was synthesized. The magnetite hydrogel has higher adsorption efficiency than GO. The pseudo-second-order model introduced a better fit to the adsorption. In addition, all isotherms were best to fit the Langmuir model and had negative values of ΔG. The present findings confirm that the change highly influenced both adsorptions of adsorbents in solution temperature, concentration, and time.
Acknowledgement: The authors would like to express their gratitude to the National Research Centre, Egypt, for the financial support of the current work.
Funding Statement: The authors received no specific funding for this study.
Conflicts of Interest: The authors declare that they have no conflicts of interest to report regarding the present study.
1. Chen, X., Zhu, J. (2019). Alginate composite hydrogel bead with multilayer flake structure for dye adsorptions. Journal of Renewable Materials, 7(10), 983–996. DOI 10.32604/jrm.2019.07325. [Google Scholar] [CrossRef]
2. Ahamed, M. (2011). Toxic response of nickel nanoparticles in human lung epithelial A549 cells. Toxicology in Vitro, 25(4), 930–936. DOI 10.1016/j.tiv.2011.02.015. [Google Scholar] [CrossRef]
3. Akhtar, N., Iqbal, J., Iqbal, M. (2004). Removal and recovery of nickel(II) from aqueous solution by loofa sponge-immobilized biomass of Chlorella sorokiniana: Characterization studies. Journal of Hazardous Materials, 108(1–2), 85–94. DOI 10.1016/j.jhazmat.2004.01.002. [Google Scholar] [CrossRef]
4. Al-Senani, G. M., Al-Fawzan, F. F. (2018). Adsorption study of heavy metal ions from aqueous solution by nanoparticle of wild herbs. The Egyptian Journal of Aquatic Research, 44(3), 187–194. DOI 10.1016/j.ejar.2018.07.006. [Google Scholar] [CrossRef]
5. Amin, M. T., Alazba, A. A., Amin, M. N. (2017). Absorption behaviours of copper, lead, and arsenic in aqueous solution using date palm fibres and orange peel: Kinetics and thermodynamics. Polish Journal of Environmental Studies, 26(2), 543–557. DOI 10.15244/pjoes/66963. [Google Scholar] [CrossRef]
6. Arican, B., Gokcay, C. F., Yetis, U. (2002). Mechanistics of nickel sorption by activated sludge. Process Biochemistry, 37(11), 1307–1315. DOI 10.1016/S0032-9592(02)00015-8. [Google Scholar] [CrossRef]
7. Arulvel, S., Elayaperumal, A., Jagatheeshwaran, M. (2017). Electroless nickel-phosphorus coating on crab shell particles and its characterization. Journal of Solid State Chemistry, 248, 87–95. DOI 10.1016/j.jssc.2017.02.001. [Google Scholar] [CrossRef]
8. Badhai, P. (2016). Graphene oxide-magnetite hybrid nanoadsorbents for toxin removal in aqueous system (Ph.D. Thesis). National Institute of Technology, Rourkela, India. [Google Scholar]
9. Tohamy, H. A. S., Anis, B., Youssef, M. A., Abdallah, A. E., El-Sakhawy, M. et al. (2020). Preparation of eco-friendly graphene oxide from agricultural wastes for water treatment. Desalination and Water Treatment, 191, 250–262. DOI 10.5004/dwt.2020.25652. [Google Scholar] [CrossRef]
10. Carolin, C. F., Kumar, P. S., Saravanan, A., Joshiba, G. J., Naushad, M. (2017). Efficient techniques for the removal of toxic heavy metals from aquatic environment: A review. Journal of Environmental Chemical Engineering, 5(3), 2782–2799. DOI 10.1016/j.jece.2017.05.029. [Google Scholar] [CrossRef]
11. Chatterjee, A., Basu, J. K., Jana, A. K. (2019). Alumina-silica nano-sorbent from plant fly ash and scrap aluminium foil in removing nickel through adsorption. Powder Technology, 354(4), 792–803. DOI 10.1016/j.powtec.2019.06.035. [Google Scholar] [CrossRef]
12. Chen, D., Feng, H., Li, J. (2012). Graphene oxide: Preparation, functionalization, and electrochemical applications. Chemical Reviews, 112(11), 6027–6053. DOI 10.1021/cr300115g. [Google Scholar] [CrossRef]
13. Dabiri, S. M. H., Rezaie, A. A., Moghimi, M., Rezaie, H. (2018). Extraction of hydroxyapatite from fish bones and its application in nickel adsorption. BioNanoScience, 8(3), 823–834. DOI 10.1007/s12668-018-0547-y. [Google Scholar] [CrossRef]
14. Dong, X., Wang, Y., Jia, M., Niu, Z., Cai, J. et al. (2019). Sustainable and scalable in-situ synthesis of hydrochar-wrapped Ti3AlC2-derived nanofibers as adsorbents to remove heavy metals. Bioresource Technology, 282(14), 222–227. DOI 10.1016/j.biortech.2019.03.010. [Google Scholar] [CrossRef]
15. Tohamy, H. A. S., Kamel, S., El-Sakhawy, M. (2021). Graphene oxide functionalized by ethylene diamine tetra-acetic acid (EDTA) by a hydrothermal process as an adsorbent for nickel ions. Cellulose Chemistry and Technology, 55(3–4), 417–432. DOI 10.35812/CelluloseChemTechnol.2021.55.39. [Google Scholar] [CrossRef]
16. Elmoubarki, R., Mahjoubi, F., Tounsadi, H., Moustadraf, J., Abdennouri, M. et al. (2015). Adsorption of textile dyes on raw and decanted Moroccan clays: Kinetics, equilibrium and thermodynamics. Water Resources and Industry, 9(3), 16–29. DOI 10.1016/j.wri.2014.11.001. [Google Scholar] [CrossRef]
17. Fu, F., Wang, Q. (2011). Removal of heavy metal ions from wastewaters: A review. Journal of Environmental Management, 92(3), 407–418. DOI 10.1016/j.jenvman.2010.11.011. [Google Scholar] [CrossRef]
18. Gérente, C., Du Mesnil, P. C., Andrès, Y., Thibault, J. F., Le Cloirec, P. (2000). Removal of metal ions from aqueous solution on low cost natural polysaccharides: Sorption mechanism approach. Reactive and Functional Polymers, 46(2), 135–144. DOI 10.1016/S1381-5148(00)00047-X. [Google Scholar] [CrossRef]
19. Horsfall Jnr, M., Spiff, A. I. (2005). Effects of temperature on the sorption of Pb2+ and Cd2+ from aqueous solution by Caladium bicolor (Wild Cocoyam) biomass. Electronic Journal of Biotechnology, 8(2), 43–50. DOI 10.2225/vol8-issue2-fulltext-4. [Google Scholar] [CrossRef]
20. Hussain, M. S. (2018). Recent developments in high-speed surface modification in metal finishing industry—electrodepositing nanocrystalline nickel directly on aluminum without any pre-treatment–A review. In: Nanomaterials in Chromatography, pp. 417–434. Elsevier. [Google Scholar]
21. Iwahori, K., Watanabe, J. I., Tani, Y., Seyama, H., Miyata, N. (2014). Removal of heavy metal cations by biogenic magnetite nanoparticles produced in Fe(III)-reducing microbial enrichment cultures. Journal of Bioscience and Bioengineering, 117(3), 333–335. DOI 10.1016/j.jbiosc.2013.08.013. [Google Scholar] [CrossRef]
22. Junior, A. B. B., Dreisinger, D. B., Espinosa, D. C. (2019). A review of nickel, copper, and cobalt recovery by chelating ion exchange resins from mining processes and mining tailings. Mining, Metallurgy & Exploration, 36(1), 199–213. DOI 10.1007/s42461-018-0016-8. [Google Scholar] [CrossRef]
23. Tohamy, H. A. S., Kamel, S., El-Sakhawy, M., Youssef, M. A., Abdallah, A. E. et al. (2020). Thermal properties of graphene oxide prepared from different agricultural wastes. Egyptian Journal of Chemistry, 63(10), 3619–3629. DOI 10.21608/EJCHEM.2020.22915.2375. [Google Scholar] [CrossRef]
24. Kazemnejadi, M., Mahmoudi, B., Sharafi, Z., Nasseri, M. A., Allahresani, A. et al. (2019). Synthesis and characterization of a new poly α-amino acid Co(II)-complex supported on magnetite graphene oxide as an efficient heterogeneous magnetically recyclable catalyst for efficient free-coreductant gram-scale epoxidation of olefins with molecular oxygen. Journal of Organometallic Chemistry, 896, 59–69. DOI 10.1016/j.jorganchem.2019.05.030. [Google Scholar] [CrossRef]
25. Kamel, S., El-Sakhawy, M., Anis, B., Tohamy, H. A. S. (2019). Graphene’s Structure, Synthesis, and Characterization; A brief review. Egyptian Journal of Chemistry, 62(Special Issue), 593–608. DOI 10.21608/EJCHEM.2019.15173.1919. [Google Scholar] [CrossRef]
26. Lee, I. H., Kuan, Y. C., Chern, J. M. (2007). Equilibrium and kinetics of heavy metal ion exchange. Journal of the Chinese Institute of Chemical Engineers, 38(1), 71–84. DOI 10.1016/j.jcice.2006.11.001. [Google Scholar] [CrossRef]
27. Li, D., Müller, M. B., Gilje, S., Kaner, R. B., Wallace, G. G. (2008). Processable aqueous dispersions of graphene nanosheets. Nature Nanotechnology, 3(2), 101–105. DOI 10.1038/nnano.2007.451. [Google Scholar] [CrossRef]
28. Li, W., Erickson, E. M., Manthiram, A. (2020). High-nickel layered oxide cathodes for lithium-based automotive batteries. Nature Energy, 5(1), 26–34. DOI 10.1038/s41560-019-0513-0. [Google Scholar] [CrossRef]
29. Lingamdinne, L. P., Koduru, J. R., Choi, Y. L., Chang, Y. Y., Yang, J. K. (2016). Studies on removal of Pb(II) and Cr(III) using graphene oxide based inverse spinel nickel ferrite nano-composite as sorbent. Hydrometallurgy, 165(1), 64–72. DOI 10.1016/j.hydromet.2015.11.005. [Google Scholar] [CrossRef]
30. Liu, M., Chen, C., Hu, J., Wu, X., Wang, X. (2011). Synthesis of magnetite/graphene oxide composite and application for cobalt(II) removal. Journal of Physical Chemistry C, 115(51), 25234–25240. DOI 10.1021/jp208575m. [Google Scholar] [CrossRef]
31. Malakahmad, A., Tan, S., Yavari, S. (2016). Valorization of wasted black tea as a low-cost adsorbent for nickel and zinc removal from aqueous solution. Journal of Chemistry, 2016(1), 5680983. DOI 10.1155/2016/5680983. [Google Scholar] [CrossRef]
32. Marzbali, M. H., Esmaieli, M., Abolghasemi, H., Marzbali, M. H. (2016). Tetracycline adsorption by H3PO4-activated carbon produced from apricot nut shells: A batch study. Process Safety and Environmental Protection, 102, 700–709. DOI 10.1016/j.psep.2016.05.025. [Google Scholar] [CrossRef]
33. Masteri-Farahani, M., Ghahremani, M. (2019). Surface functionalization of graphene oxide and graphene oxide-magnetite nanocomposite with molybdenum-bidentate Schiff base complex. Journal of Physics and Chemistry of Solids, 130, 6–12. DOI 10.1016/j.jpcs.2019.02.006. [Google Scholar] [CrossRef]
34. Onsri, P., Dechtrirat, D., Nooeaid, P., Eiad-ua, A., Amornpitoksuk, P. et al. (2021). Novel magnetically interconnected micro/macroporous structure of monolithic porous carbon adsorbent derived from sodium alginate and wasted black liquor and its adsorption performance. Journal of Renewable Materials, 9(6), 1059–1074. DOI 10.32604/jrm.2021.013362. [Google Scholar] [CrossRef]
35. Cao, Z., Zhang, Y., Luo, K., Wu, Y., Gao, H. et al. (2021). Preparation and properties of polyacrylamide/sodium alginate hydrogel and the effect of Fe adsorption on its mechanical performance. Journal of Renewable Materials, 9(8), 1447–1462. DOI 10.32604/jrm.2021.015593. [Google Scholar] [CrossRef]
36. Tayyebi, A., Outokesh, M., Moradi, S., Doram, A. (2015). Synthesis and characterization of ultrasound assisted–Grapheneoxide-magnetitell hybrid, and investigation of its adsorption properties for Sr(II) and Co(II) ions. Applied Surface Science, 353, 350–362. DOI 10.1016/j.apsusc.2015.06.087. [Google Scholar] [CrossRef]
37. Zubir, N. A., Zhang, X., Yacou, C., Diniz da Costa, J. C. D. (2015). Fenton-like degradation of acid orange 7 using graphene oxide-iron oxide nanocomposite. Science of Advanced Materials, 6(7), 1382–1388. DOI 10.1166/sam.2014.1812. [Google Scholar] [CrossRef]
38. Jusin, J. W., Aziz, M., Sean, G. P., Jaafar, J. (2016). Preparation and characterization of graphene-based magnetic hybrid nanocomposite. Malaysian Journal of Analytical Sciences, 20(1), 149–156. DOI 10.17576/mjas-2016-2001-16. [Google Scholar] [CrossRef]
39. Zhou, L., Fang, S., Tang, J., Gao, L., Yang, J. (2012). Synthesis and characterization of multiwalled carbon nanotube/polyurethane composites via surface modification multiwalled carbon nanotubes using silane coupling agent. Polymer Composites, 33(11), 1866–1873. DOI 10.1002/pc.22305. [Google Scholar] [CrossRef]
40. Saha, S., Venkatesh, M., Basu, H., Pimple, M. V., Singhal, R. K. (2019). Recovery of gold using graphene oxide/calcium alginate hydrogel beadsfrom a scrap solid state detector. Journal of Environmental Chemical Engineering, 7(3), 103134. DOI 10.1016/j.jece.2019.103134. [Google Scholar] [CrossRef]
41. Teo, P. S. (2015). Feasibility of Fe3O4 nanoparticles decorated reduced graphene oxide heterostructure as photocatalyst and chemical sensors/Teo Peik See (Doctoral Thesis). University of Malaya. [Google Scholar]
42. Romero, A., Lavin-Lteoopez, M. P., Sanchez-Silva, L., Valverde, J. L., Paton-Carrero, A. (2018). Comparative study of different scalable routes to synthesize graphene oxide and reduced graphene oxide. Materials Chemistry and Physics, 203, 284–292. DOI 10.1016/j.matchemphys.2017.10.013. [Google Scholar] [CrossRef]
43. Osswald, S., Flahaut, E., Ye, H., Gogotsi, Y. (2005). Elimination of D-band in raman spectra of double-wall carbon nanotubes by oxidation. Chemical Physics Letters, 402(4–6), 422–427. DOI 10.1016/j.cplett.2004.12.066. [Google Scholar] [CrossRef]
44. Chen, Y., Pötschke, P., Pionteck, J., Voit, B., Qi, H. (2020). Multifunctional cellulose/rGO/Fe3O4 composite aerogels for electromagnetic interference shielding. ACS Applied Materials & Interfaces, 12(19), 22088–22098. DOI 10.1021/acsami.9b23052. [Google Scholar] [CrossRef]
45. Zhang, Y., Yan, K., Ji, F., Zhang, L. (2018). Enhanced removal of toxic heavy metals using swarming biohybrid adsorbents. Advanced Functional Materials, 28(52), 1806340. DOI 10.1002/adfm.201806340. [Google Scholar] [CrossRef]
46. Kaur, U. M., Kaur, M., Singh, D., Greneche, J. M. (2017). Nanocomposite of γ-Fe2O3 immobilized on graphene oxide for remediation of Ni(II) ions-kinetics, isotherm and thermodynamics studies. Processing and Application of Ceramics, 11(4), 247–257. DOI 10.2298/PAC1704247K. [Google Scholar] [CrossRef]
47. Hoan, N. T. V., Thu, N. T. A., Duc, H. V., Cuong, N. D., Khieu, D. Q. et al. (2016). Fe3O4/reduced graphene oxide nanocomposite: Synthesis and its application for toxic metal ion removal. Journal of Chemistry, 2016, 2418172. DOI 10.1155/2016/2418172. [Google Scholar] [CrossRef]
48. Yang, X., Chen, C., Li, J., Zhao, G., Ren, X. et al. (2012). Graphene oxide-iron oxide and reduced graphene oxide-iron oxide hybrid materials for the removal of organic and inorganic pollutants. RSC Advances, 2(23), 8821–8826. DOI 10.1039/C2RA20885G. [Google Scholar] [CrossRef]
49. Tran, H. V., Tran, T. L., Le, T. D., Le, T. D., Nguyen, H. M. et al. (2018). Graphene oxide enhanced adsorption capacity of chitosan/magnetite nanocomposite for Cr(VI) removal from aqueous solution. Materials Research Express, 6(2), 025018. DOI 10.1088/2053-1591/aae55c. [Google Scholar] [CrossRef]
50. El-Sakhawy, M., Salama, A., Kamel, S., Tohamy, H. A. S. (2018). Carboxymethyl cellulose esters as stabilizers for hydrophobic drugs in aqueous medium. Cellulose Chemistry and Technology, 52(9–10), 749–757. [Google Scholar]
51. Vu, H. C., Dwivedi, A. D., Le, T. T., Seo, S. H., Kim, E. J. et al. (2017). Magnetite graphene oxide encapsulated in alginate beads for enhanced adsorption of Cr(VI) and As(V) from aqueous solutions: Role of crosslinking metal cations in pH control. Chemical Engineering Journal, 307, 220–229. DOI 10.1016/j.cej.2016.08.058. [Google Scholar] [CrossRef]
52. Serag, E., El Nemr, A., El-Maghraby, A. (2017). Synthesis of highly effective novel graphene oxide-polyethylene glycol-polyvinyl alcohol nanocomposite hydrogel for copper removal. Journal of Water and Environmental Nanotechnology, 2(4), 223–234. DOI 10.22090/jwent.2017.04.001. [Google Scholar] [CrossRef]
53. Yakout, A. A., Mahmoud, M. E. (2018). Fabrication of magnetite-functionalized-graphene oxide and hexadecyltrimethyl ammonium bromide nanocomposite for efficient nanosorption of sunset yellow. Materials Science and Engineering: C, 92, 287–296. DOI 10.1016/j.msec.2018.06.060. [Google Scholar] [CrossRef]
54. Moztahida, M., Nawaz, M., Kim, J., Shahzad, A., Kim, S. et al. (2019). Reduced graphene oxide-loaded-magnetite: A Fenton-like heterogeneous catalyst for photocatalytic degradation of 2-methylisoborneol. Chemical Engineering Journal, 370, 855–865. DOI 10.1016/j.cej.2019.03.214. [Google Scholar] [CrossRef]
55. Sengupta, I., Chakraborty, S., Talukdar, M., Pal, S. K., Chakraborty, S. (2018). Thermal reduction of graphene oxide: How temperature influences purity. Journal of Materials Research, 33(23), 4113–4122. DOI 10.1557/jmr.2018.338. [Google Scholar] [CrossRef]
56. Xu, P., Zeng, G. M., Huang, D. L., Feng, C. L., Hu, S. et al. (2012). Use of iron oxide nanomaterials in wastewater treatment: A review. Science of the Total Environment, 424(1–3), 1–10. DOI 10.1016/j.scitotenv.2012.02.023. [Google Scholar] [CrossRef]
57. Al-Abbad, E., Alakhras, F., Anastopoulos, I., Das, D., Ahlam, A. A. et al. (2020). Chitosan-based materials for the removal of nickel ions from aqueous Solutions. Russian Journal of Physical Chemistry A, 94(4), 748–755. DOI 10.1134/S0036024420040032. [Google Scholar] [CrossRef]
58. Al-Abbad, E. A., Al Dwairi, R. A. (2021). Removal of nickel(II) ions from water by Jordan natural zeolite as sorbent material. Journal of Saudi Chemical Society, 25(5), 101233. DOI 10.1016/j.jscs.2021.101233. [Google Scholar] [CrossRef]
59. Sahmoune, M. N. (2019). Evaluation of thermodynamic parameters for adsorption of heavy metals by green adsorbents. Environmental Chemistry Letters, 17(2), 697–704. DOI 10.1007/s10311-018-00819-z. [Google Scholar] [CrossRef]
 | This work is licensed under a Creative Commons Attribution 4.0 International License, which permits unrestricted use, distribution, and reproduction in any medium, provided the original work is properly cited. |