| Journal of Renewable Materials |
DOI: 10.32604/jrm.2022.019602
ARTICLE
Curing Kinetics of Tannin and Lignin Biobased Adhesives Determined by DSC and ABES
1University of Ljubljana, Biotechnical Faculty, Ljubljana, 1000, Slovenia
2Université de Lorraine LERMAB-ENSTIB, Epinal, 88000, France
*Corresponding Author: Milan Šernek. Email: milan.sernek@bf.uni-lj.si
Received: 01 October 2021; Accepted: 02 December 2021
Abstract: The curing process of two biobased adhesives: pine tanninhexamine (TH) and organosolv lignin non-isocyanate polyurethane (NIPU), suitable for interior nonstructural use, were compared with commercial urea-formaldehyde (UF) adhesive. Changes in chemical structure before and after the curing process were observed with Fourier-transform infrared spectroscopy (FTIR). The process of adhesive curing was monitored with differential scanning calorimetry (DSC) and the automated bonding evaluation system (ABES). Both DSC and ABES measurements confirmed UF as the fastest and NIPU as the slowest curing adhesive observed. Taking into account the ABES results, the optimal pressing parameters for the TH adhesive would be 4 min at 175°C, for the NIPU adhesive 7 min at 200°C and for the UF 1.5 min at 100°C. Strong linear correlation was observed between mechanical and chemical curing for the UF and NIPU adhesives, whereas lower correlation was observed for the TH adhesive. At all observed adhesives, the DSC measurements were underestimating the curing process determined by ABES in the first part and overestimating it at the end. The underestimation was the most evident with the TH adhesive and the less with the UF adhesive. When comparing the uncured and cured FTIR spectra of all three types of adhesives, a drastic decrease in the characteristic band of -OH groups at 3330–3400 cm−1 and an increase in the signal intensity at 2920 cm−1 of aliphatic -CH2-groups were observed. For the UF adhesive, the C=O stretching frequency has shifted from 1632 cm−1 for uncured to three different bands at 1766, 1701, and 1655 cm−1 for cured UF. The sharp band for phenolic alcohols at 1236 cm−1 of C–O stretch and hydroxyl O–H functional group at 1009 cm−1 and at 684 cm−1 of uncured TH adhesive diminished during curing, which indicates that a cross-linking reaction occurs via -OH groups. The peak of the C=O group of urethane bridges at 1697 cm−1 for uncured NIPU shifted to lower wavenumber at 1633 cm−1 for cured NIPU.
Keywords: Biobased adhesives; curing kinetics; tannin; lignin; ABES; DSC; FTIR
Biobased adhesives derived from natural sources are gaining substantial interest due to the environmental and health concerns related to synthetic adhesives. Several biocomponents, such as tannins, technical lignins, proteins, carbohydrates, unsaturated oils and some others, can be used to produce adhesives [1,2]. Due to their phenolic origin and wide natural abundance, tannins and lignins are considered the most promising solutions among the above-listed biocomponents for the replacement of synthetic adhesives in wood panels [3]. Several attempts to prepare different tannin or/and lignin adhesive formulations have been successful on the laboratory scale; some of those also succeeded in industrial applications [2].
The use of more reactive tannins in wood adhesives started in the 1950s [4]; however, the use of less reactive and cheaper technical lignins (in comparison to tannins) started to gain remarkable attention in the 1980s [5,6]. In recent years, the most interesting research attempts have been in the preparation of lignin non-isocyanate polyurethane (NIPU) adhesives [7,8]. Our previous research investigated curing characterisation by ABES, DMA, and DEA on a tannin-hexamine adhesive [9,10] and developed a new organosolv lignin NIPU adhesive [11].
Applying these adhesives in the wood industry requires detailed insights into the mechanical characteristics of bonded joints and the establishment of adequate pressing parameters. The characterisation of the curing process of an adhesive enables the determination of the optimal pressing parameters, which is essential for the economical production of wood-based composites. Several laboratory-scaled techniques enable insight into the curing process of adhesives by measuring the differences of various adhesive parameters.
The mechanical properties of the adhesive during curing can be examined using thermomechanical analysis (TMA), dynamic mechanical analysis (DMA), torsional braid analysis (TBA), integrated pressing and testing system (IPATES), and an automated bonding evaluation system (ABES). However, TMA, DMA, and TBA measure changes of different moduli; IPATES and ABES are the only two methods that directly measure the adhesive bond strength during (or immediately after) pressing [12,13]. Since these methods monitor and explain the curing process’s mechanical aspects, the common term ‘mechanical cure’ is usually used to describe their results.
The curing process of adhesives can also be predicted/defined by measuring other parameters related to physical or chemical transitions in the adhesives by differential thermal analysis (DTA), differential scanning calorimetry (DSC), and dielectric analysis (DEA). In addition, for the justification of chemical curing results, the differences in the molecular structure of the cured and uncured adhesive can be observed using matrix-assisted laser desorption ionisation time-of-flight (MALDI-ToF), Fourier Transform Infra-Red (FTIR) spectroscopy, and Nuclear Magnetic Resonance (NMR) [11,13]. Since these methods monitor and explain mostly the chemical aspects of the curing process, the common term ‘chemical cure’ is usually used for their results.
Since there are so many different methods suitable for the curing characterisation of adhesives, the comparison between them and correlation with those methods that directly measure the shear strength of the adhesive is interesting and useful for practice.
Some comparisons between chemical and mechanical curing were performed, mostly between DSC and DMA measurements. Those studies mostly concluded that the chemical curing (DSC) starts before mechanical curing (DMA) and achieves the maximum degree of curing after the mechanical curing is already finished [14–16]. However, the curing process determined by ABES was considered to be faster than the one performed on DMA. This was related to the presence of wood veneer, which is used as an adherent when using ABES. Wood absorbs water from the adhesive and thus accelerates the mechanical curing. The presence of wood and its pH nature can also interfere with the chemical curing of the adhesives [9].
In this research, the curing process of one perspective tannin and one new lignin-based adhesive mixtures were examined with ABES and DSC methodologies. These tannin and lignin-based adhesives were investigated as part of the ERA Net project WooBAdh and represent the continuation of our previous work [9,11]. Since the ABES method directly measures the adhesive bond strength, it was used as a reference. Chemical curing determined by DSC was compared with ABES results, and a correlation between methods was made, which has not been done before. Changes in the chemical structures between cured and uncured adhesives were also observed with FTIR. In all tests performed, the commercial UF adhesive was used as a reference.
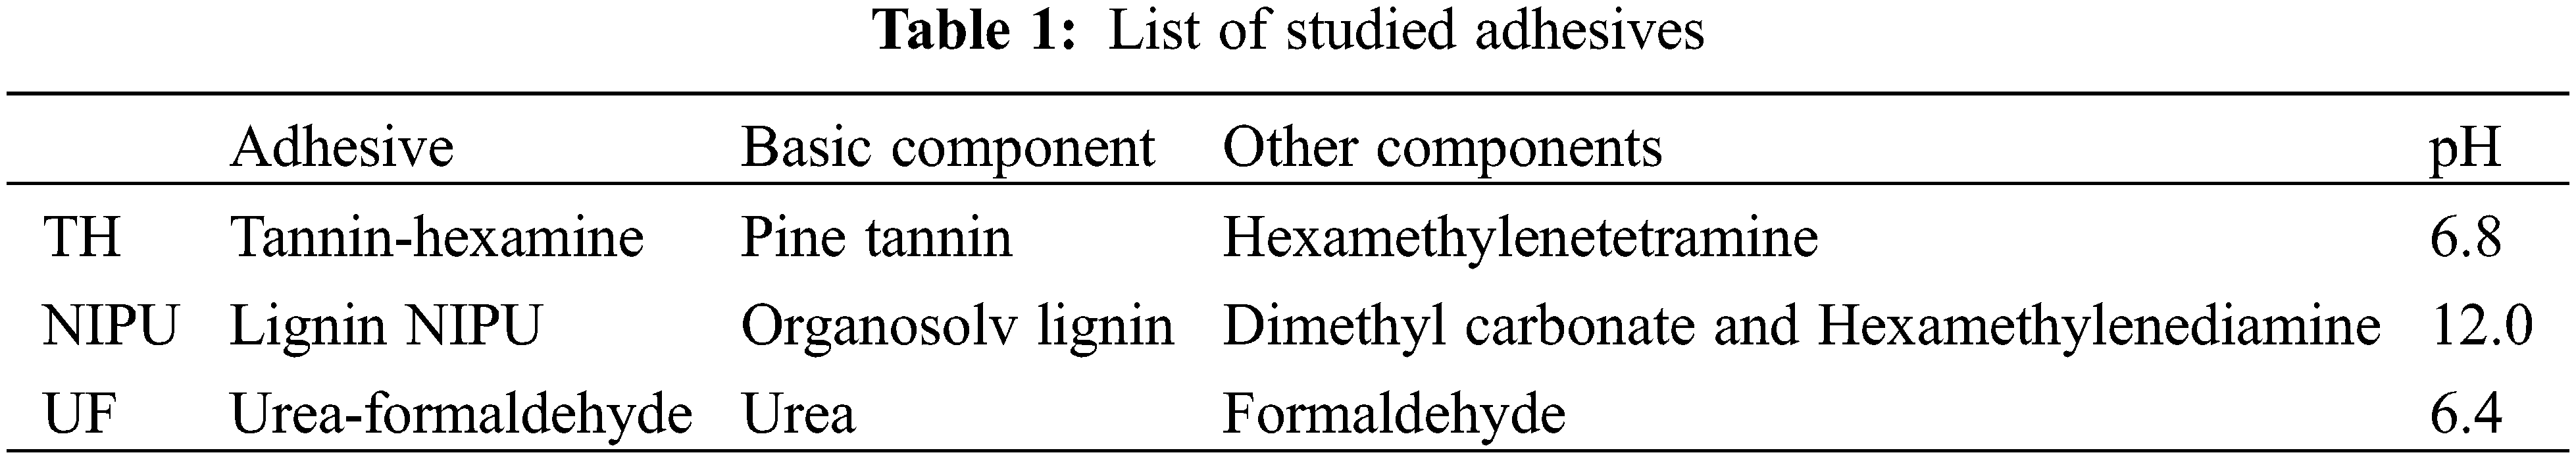
The curing process of two bio-based and one synthetic adhesive (Table 1) was observed using DSC and ABES. As a result, all three adhesives were classified into the C1 Durability class according to the EN 12765 [17] standard. This means that they are suitable for interior non-structural use.
2.1 Preparation of the Adhesives
2.1.1 Tannin-Hexamine Adhesive (TH)
The tannin-hexamine adhesive mixture was prepared according to the following steps: (1) at first, 40 weight units of pine tannin powder were dissolved in 60 weight units of distilled water. (2) The pH value was adjusted from 6.5 to 7.0 with NaOH. (3) 6 weight units of 40% water solution of hexamine were added (as 6% hexamine dry weight to the tannin dry weight). The density of the prepared adhesive was determined to 1.04 g/cm³, and solid content to 35.6%. This adhesive was presented in detail in our previous study [9].
2.1.2 Organosolv Lignin NIPU Adhesive (NIPU)
In the first stage, 25.9 weight units of organosolv lignin powder were poured into a three-necked flask equipped with a reflux condenser and thermometer. Then 17.5 weight units of dimethyl carbonate and 21.6 weight units of distilled water were added and continuously stirred with a magnetic stirrer for 40 min at 50°C, then cooled to room temperature. After that, a total of 35.1 weight units hexamethylenediamine was added to the mixture and continuously stirred with a magnetic stirrer for 120 min at 90°C. Next, the resin was cooled to room temperature and ready to use. The pH value of the prepared adhesive was determined to be 12.0, and the solid content to 46%. This adhesive was presented in detail in our previous study [11].
Commercial urea-formaldehyde adhesive (W-leim plus 3000, Dynea, Lillestrøm, Norway) was tested as a reference; 59 weight units of urea-formaldehyde powder were mixed in 41 weight units of distilled water. The density of the prepared adhesive was determined to 1.183 g/cm³, pH value to 6.4, and solid content to 53.7%.
2.2 Thermal Analysis of the Adhesive with DSC
A differential scanning calorimeter measures the heat flow that occurs in a sample when heated, cooled, or held at a constant temperature. DSC detects and evaluates endothermic and exothermic effects on examined material. The curing process of the adhesive can be detected as an exothermal peak of a DSC curve. When performing experiments at three or more different heating temperatures, the model-free kinetics software can calculate the conversion curves, which correspond to the curing process of the tested adhesive in isothermal conditions.
The measurements were performed on a Mettler Toledo HP DSC 1 device in 40 μL aluminium crucibles with pierced and sealed lids. The atmosphere at the testing chamber was purged with technical grade nitrogen gas (N2) with a flow rate of 50 ml/min. Tests for NIPU adhesive were performed at normal pressure (1 bar), nitrogen-rich atmosphere. However, high pressure (50 bar) nitrogen-rich (N2) atmosphere was used to move the water evaporation point to a higher temperature for UF and TH adhesive to avoid the overlapping between the endothermic signal of the water evaporation and the exothermic signal of the chemical reaction of polycondensation or auto-condensation during curing. The sample masses for the DSC measurements were between 5 and 15 mg. The weighing was conducted on a Mettler Toledo XS 205 balance.
The advanced model free kinetic (AMFK) approach enabled expressing the degree of chemical cure determined by DSC for any isothermal conditions. Since the studied adhesives cure at different temperatures, three representative temperatures were chosen for each adhesive: 75°C, 100°C, and 125°C for UF resin, 125°C, 150°C, and 175°C for TH adhesive and 175°C, 200°C, and 225°C for NIPU adhesive.
The degree of chemical cure, calculated from DSC data (α(t)DSC) was determined using Eq. (1):
where ΔH(t) represents the amount of enthalpy dissipated from the reaction in time t, and ΔHT is stated as the total enthalpy of the reaction [18].
2.3 Spectroscopic Analysis of the Adhesive with FTIR
FT-IR spectra of uncured and cured TH, NIPU, and UF adhesives were collected with an FT-IR spectrometer (Spectrum Two, UATR Two), manufactured by PerkinElmer, in the wavenumber range between 4000 and 650 cm−1, at a resolution of 4 cm−1 in ATR technique. Samples of cured TH, NIPU and UF adhesives for FT-IR spectra were taken from aluminium crucibles after the DSC measurements were performed.
2.4 Determination of the Adhesive Bond Strength Development with ABES
Adhesive bond strength development was evaluated with ABES (Adhesive Evaluation Systems Inc., Oregon, USA) in accordance with the ASTM D7998-19 [19] standard. ABES is a combination of a small hot press and tensile-testing machine, which enables the determination of the adhesive bond strength immediately after the desired pressing time or regime (e.g., subsequent cooling).
Beech (Fagus sylvatica L.) veneers, 0.84 mm thick, were bonded in the hot press of ABES at selected temperatures and for different pressing times. The geometry of the bonded area of the veneer lap joints was 5 mm × 20 mm (100 mm²). The mass of the tested adhesive was approximately 20 mg.
Different press times between 10 and 600 s (10 to 12 per one observed temperature) were chosen to determine the bond shear strength development over time.
After the opening of the hot press, the adhesive bond was cooled with compressed air for 5 s. The actual temperature transition to the bond line was observed with a K-type thermocouple for each of the tested temperatures.
The last step was the shear strength test of the adhesive bond. The lap joint was pulled until rupture occurred (approximately 11 s after the hot press opening). The maximum achieved force was compared with the bonded area, and the resulting shear strength (σt) was expressed in N/mm².
Each of the tested sequences with ABES was modelled to a three-parametric logistic function (Eq. (2)) with non-linear regression [12].
where f(t) is the shear strength of the adhesive bond, t is the time from the onset of pressing (s), β determines the upper asymptote of shear strength, κ determines the slope of the curve, and γ determines the time when maximum growth occurs.
The degree of cure was also estimated for ABES measurements, following Eq. (3):
where σmax is the maximum shear strength of all observed temperatures per adhesive, and σt is the shear strength during cure.
3.1 Curing Kinetics Determined by DSC and AMFK
DSC measurements of the heat flow were carried out with different heating rates ranging from 2 °C/min to 20 °C/min. The AMFK approach used the measured DSC data curves to recalculate the activation energy and conversion curves (degree of cure) for chosen isothermal conditions. In Figs. 1–3, the measured DSC curves are presented on the left side, and modelled conversion curves are on the right side of the figures.

Figure 1: DSC heat flow measurements at different heating rates, performed at 50 bar nitrogen-rich atmosphere (left), and conversion curves (degree of cure) for TH adhesive at 125°C, 150°C and 175°C (right)

Figure 2: DSC heat flow measurements at different heating rates, performed at 1 bar nitrogen-rich atmosphere (left), and conversion curves (degree of cure) for NIPU adhesive at 175°C, 200°C and 225°C (right)

Figure 3: DSC heat flow measurements at different heating rates, performed at 50 bar nitrogen-rich atmosphere (left), and conversion curves (degree of cure) for UF adhesive at 75°C, 100°C, 125°C (right)
Due to different curing temperatures, not all tested adhesives could be tested at the same pressure. That is why the strong endothermic peak of water evaporation can be observed only with the NIPU adhesive (tested at 1 bar). With the TH and UF adhesives, the evaporation point of water was shifted outside the observed interval to 264°C with 50 bar pressure. At all performed measurements, the exothermic peak, which represents the curing process of the adhesive, was observed at higher temperatures with the increasing heating rate. This allowed AMFK to model the curing rate properly.
The UF adhesive exhibited one strong exothermic signal at around 80°C, whereas the TH adhesive had two exothermic signals at 100°C and 140°C. The NIPU adhesive showed one exothermic signal at around 200°C. This means that the UF adhesive needs a lower temperature for curing than TH, whereas NIPU needs the highest temperature for curing among the studied adhesives. Two exothermic signals of TH adhesive probably belong to two different chemical curing reactions that are presented in TH. The AMFK enables the determination of the time needed for a chosen adhesive to achieve a certain degree of cure at the selected temperature. The curing of the UF adhesive was determined to be the fastest, and the curing of the NIPU adhesive was the slowest. These differences are shown in Fig. 4, where the AMFK results of all the adhesives are represented.

Figure 4: Comparison of adhesives curing performance at 175°C
3.2 FTIR Analysis of the Characteristic Peaks of Adhesives
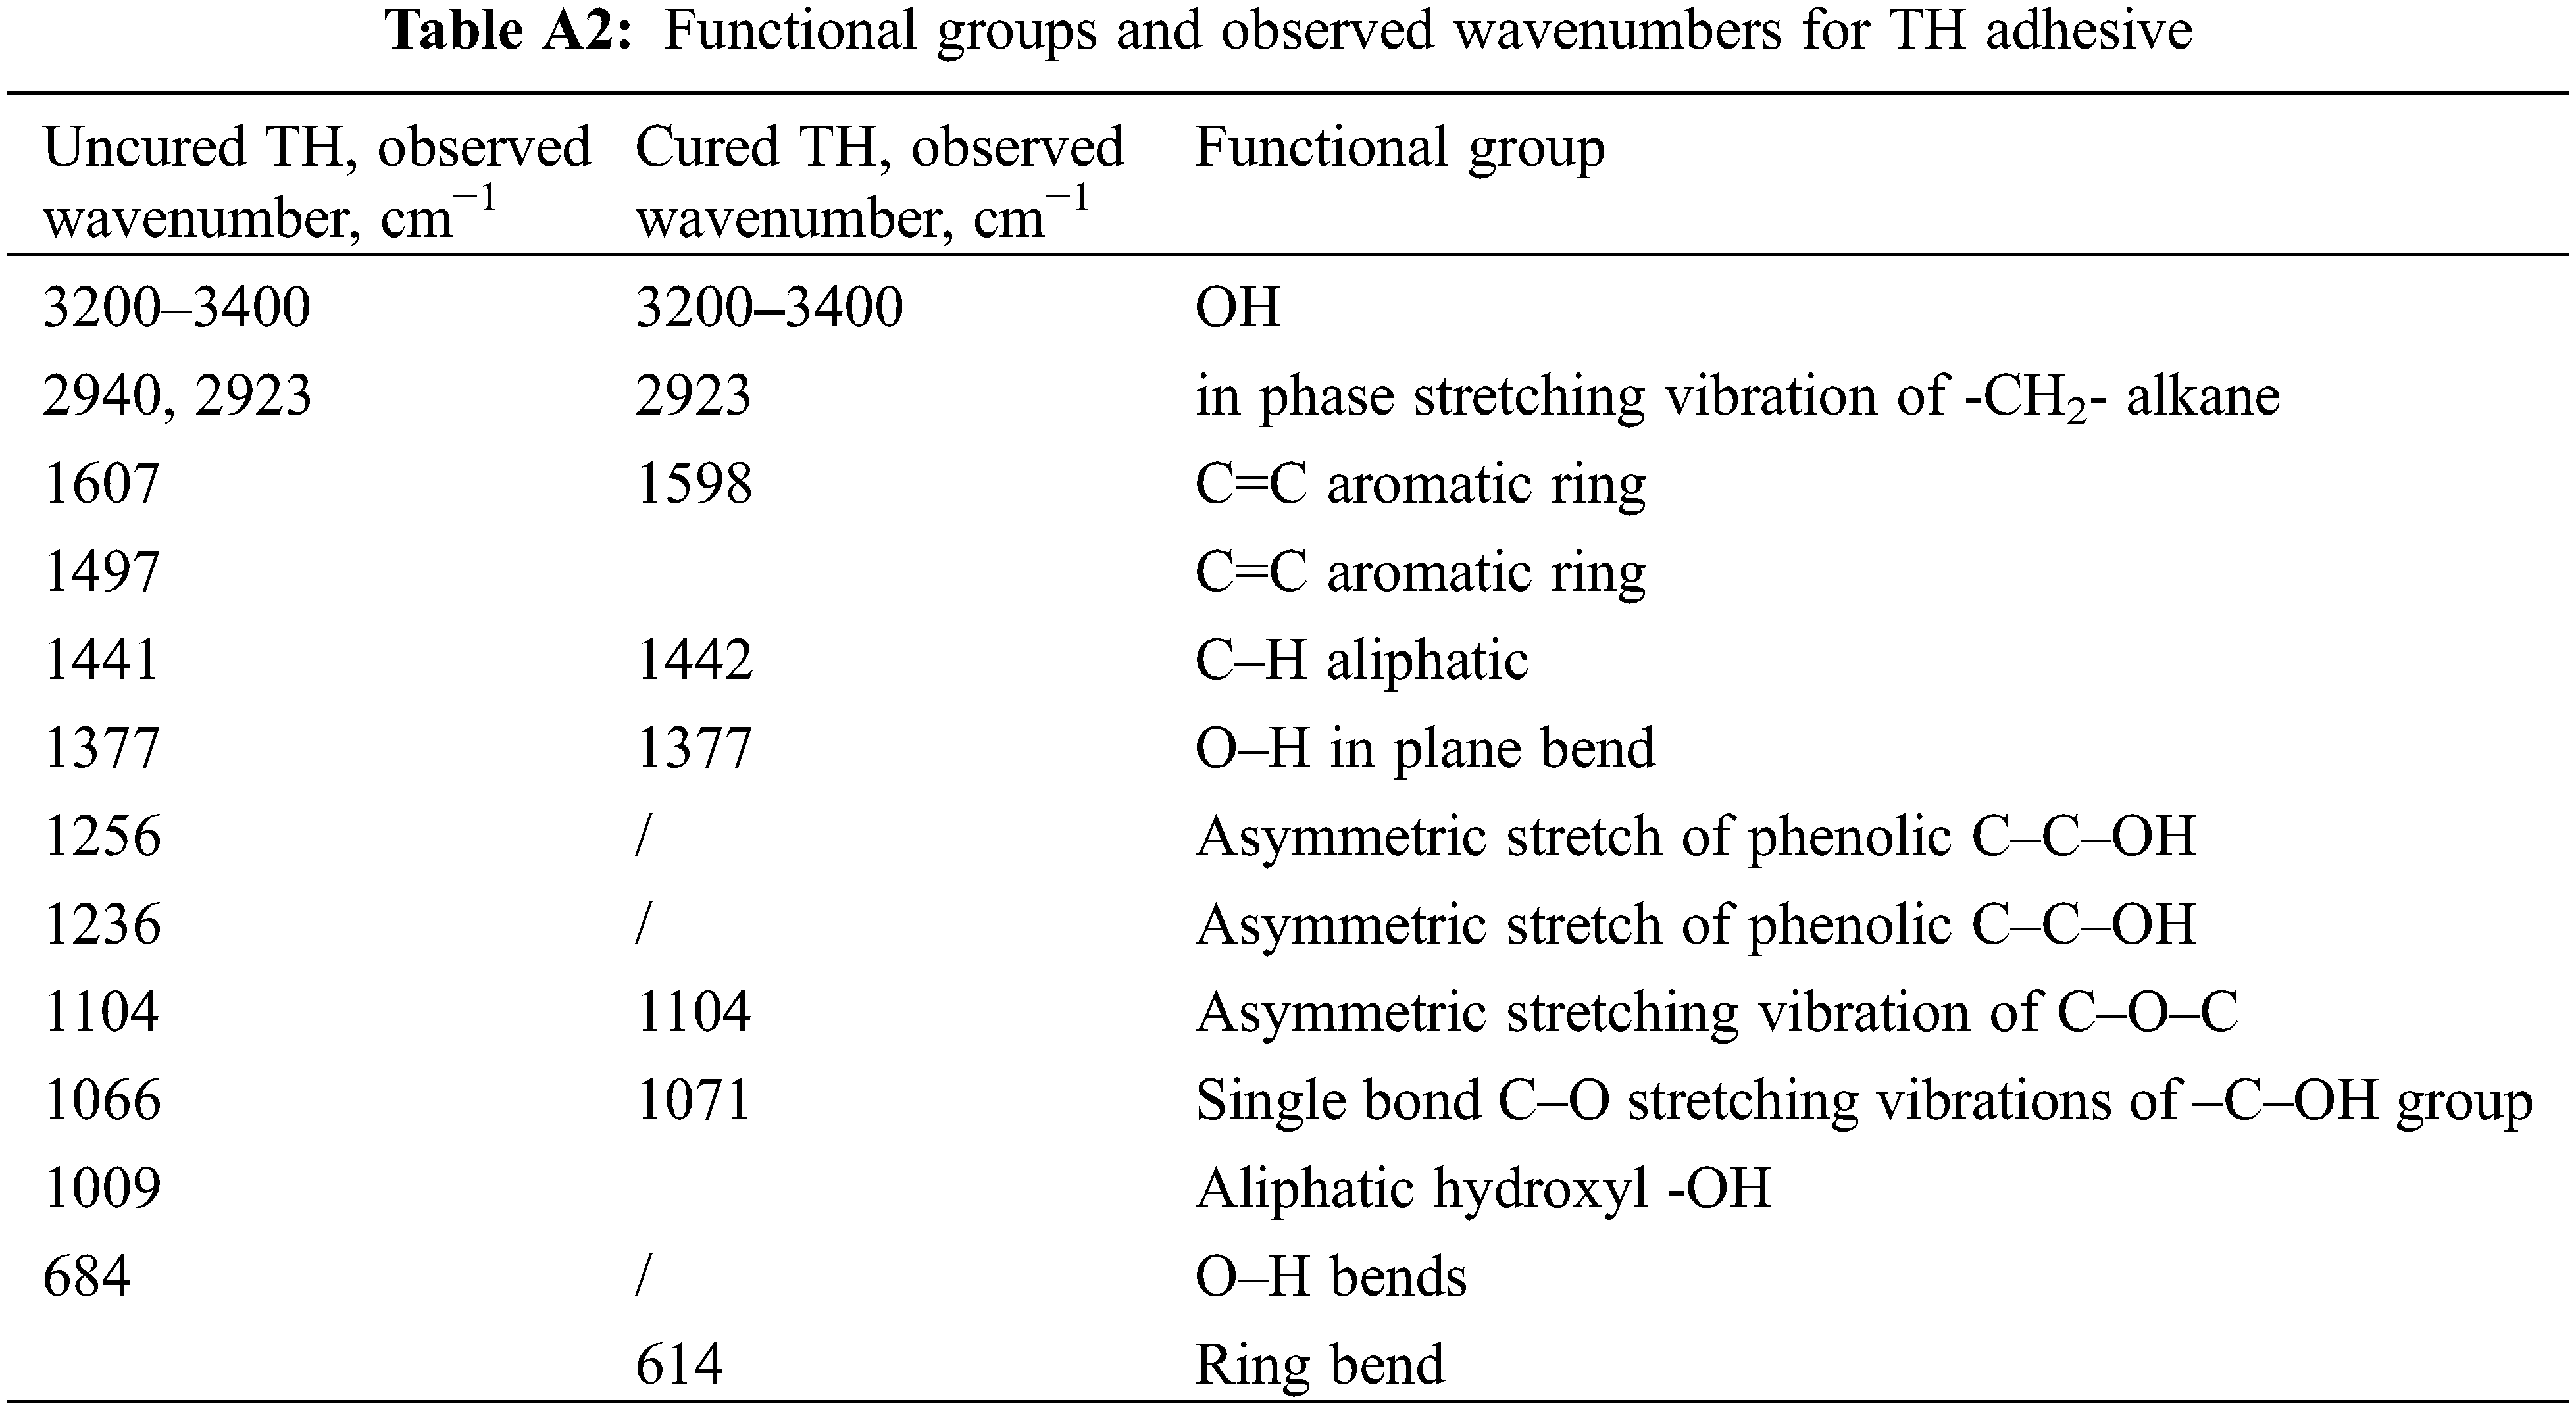
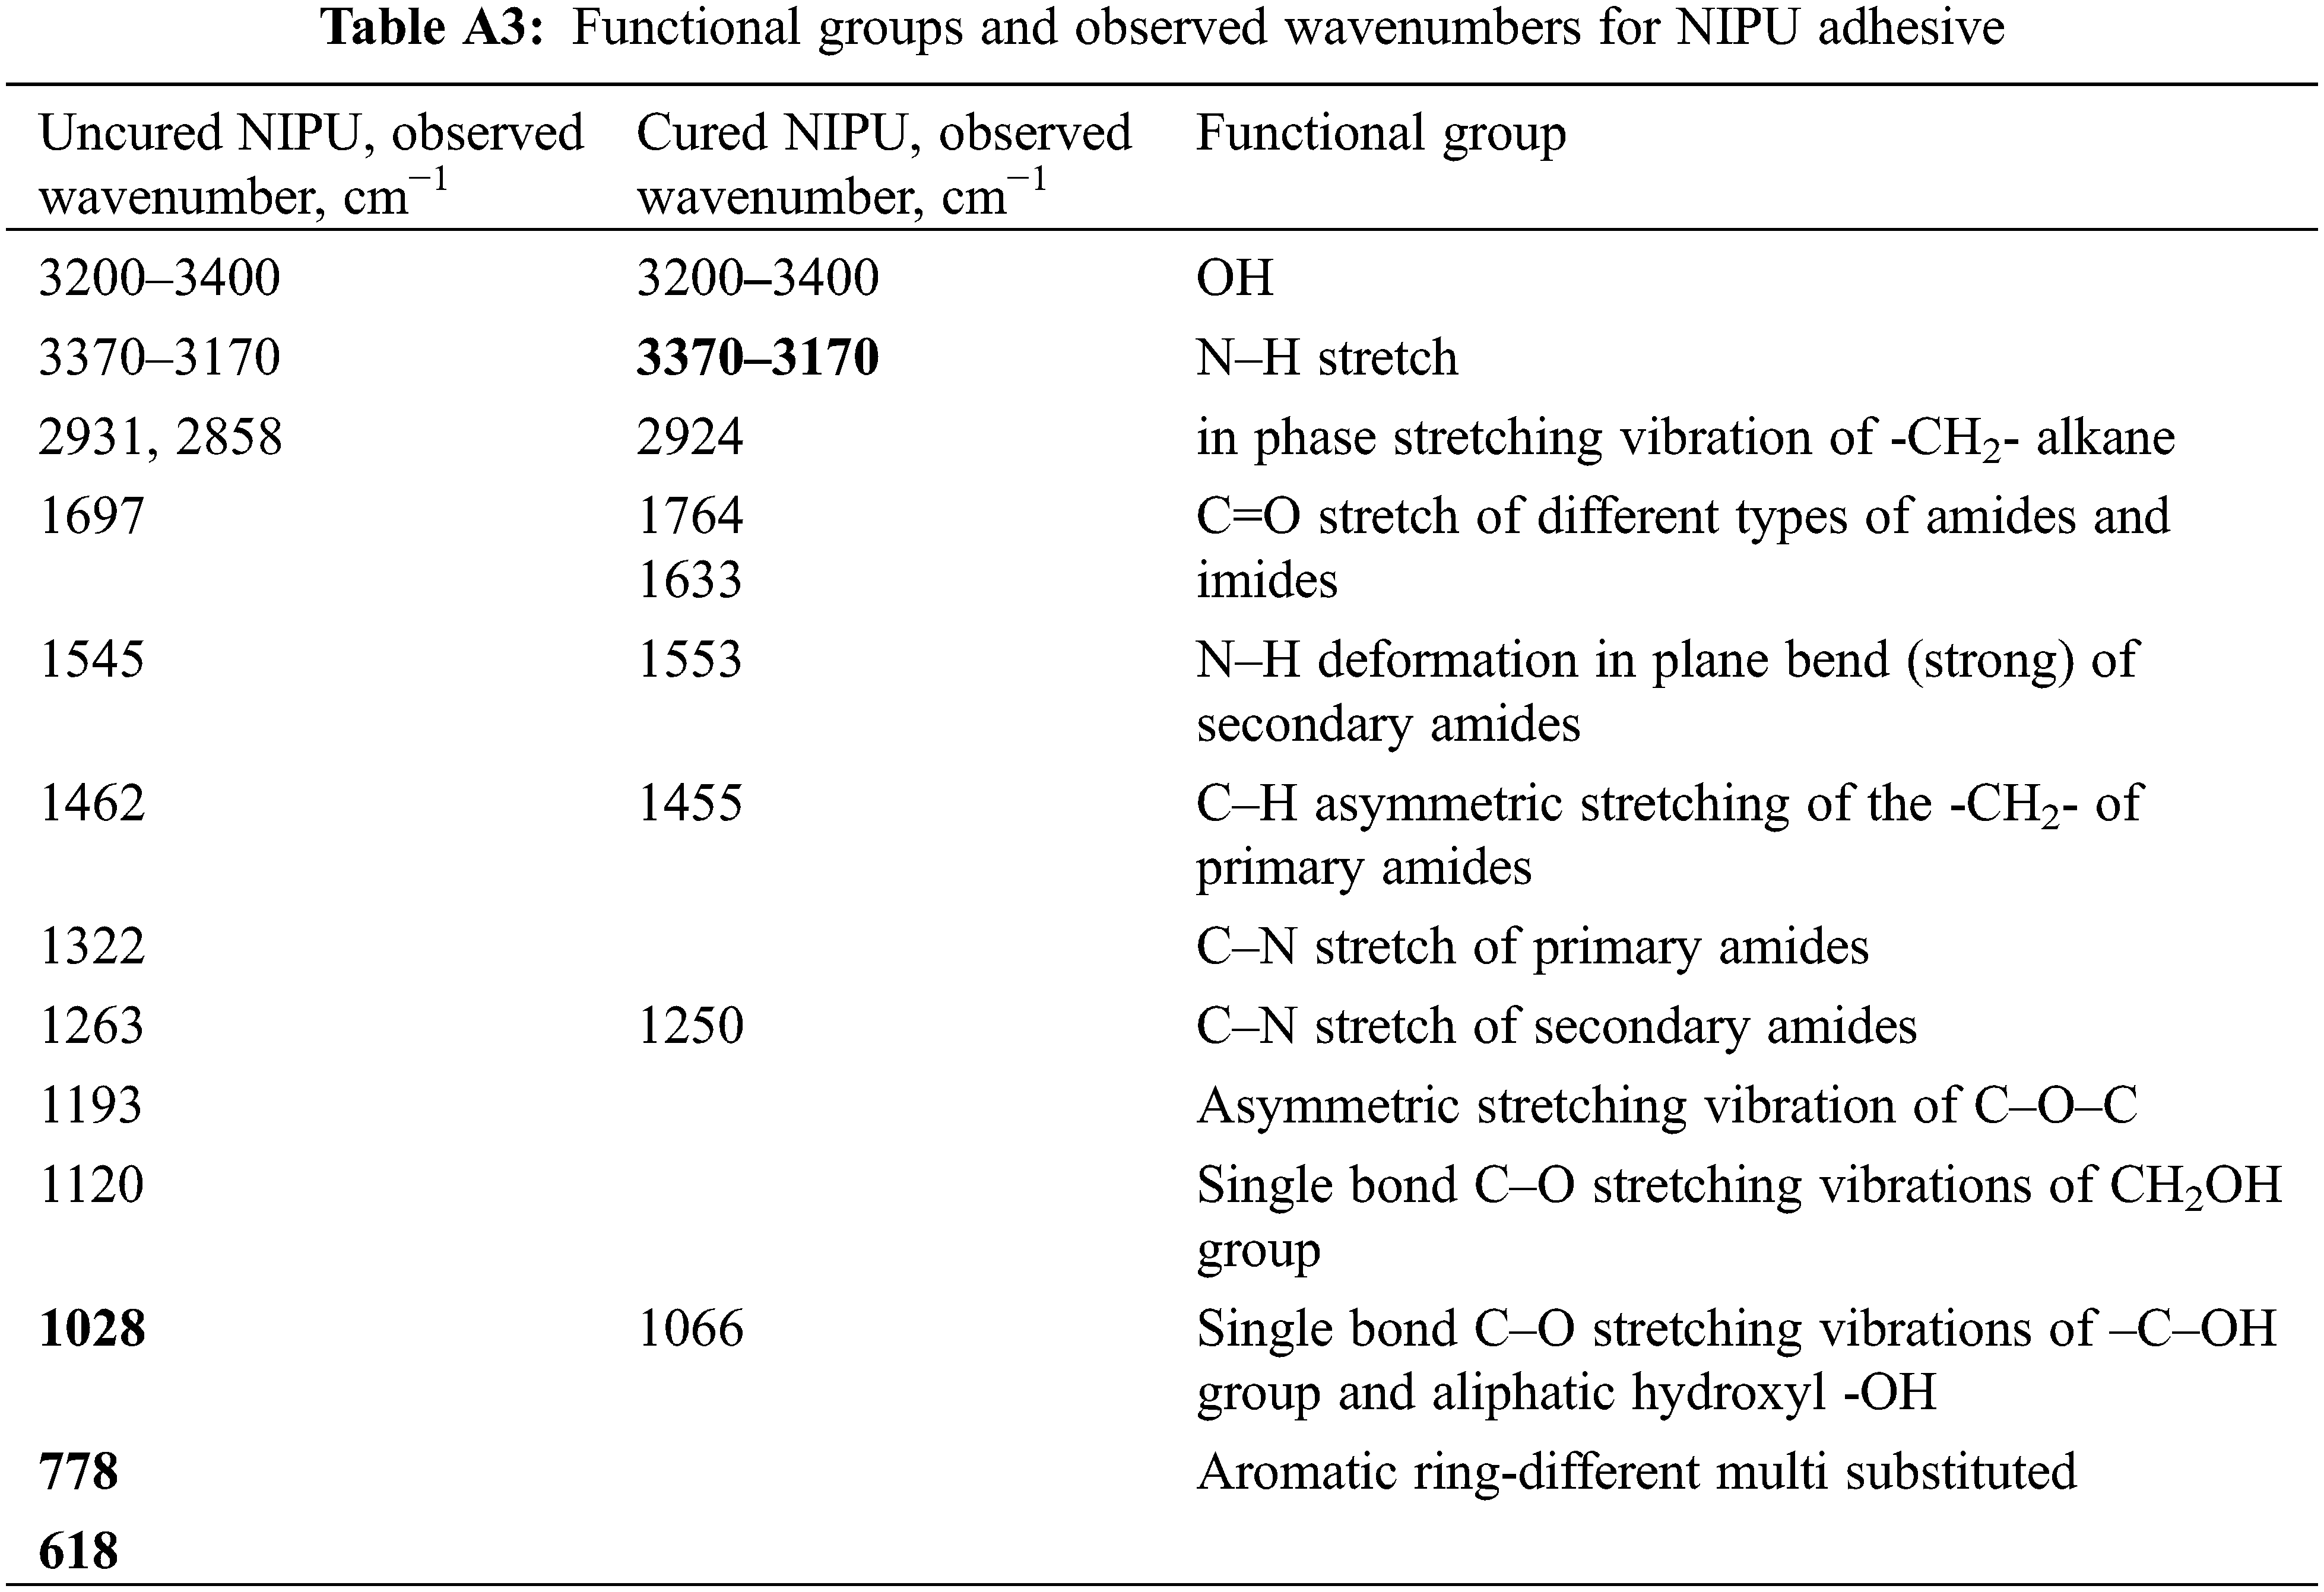
In Figs. 5–7, the FTIR spectra of uncured and cured UF, TH, and NIPU adhesives are shown, respectively. The assignment of characteristic absorption bands was done on the basis of relevant literature [11,20]. When comparing the uncured and cured FTIR spectra of all three types of adhesives, a drastic decrease in the characteristic band of -OH groups at 3330–3400 cm−1 is seen. This is attributed to the evaporation of water during the cross-linking process and a consequence of condensation reactions between the hydroxymethyl groups or between the hydroxymethyl group and the NH2 group. Due to the decrease in the signal of the -OH group and the mentioned reactions, which lead to the formation of methylene and methylene ether bridges, the signal intensity at 2920 cm−1, which belongs to the aliphatic -CH2- group, increases. However, in the area of the fingerprint, the individual adhesives differ more from each other, so we interpreted them individually.

Figure 5: FT-IR spectra of UF adhesive uncured (black line) and cured (red dotted)

Figure 6: FT-IR spectra of TH adhesive uncured (black line) and cured (red dotted)

Figure 7: FT-IR spectra of NIPU adhesive uncured (black line) and cured (red dotted)
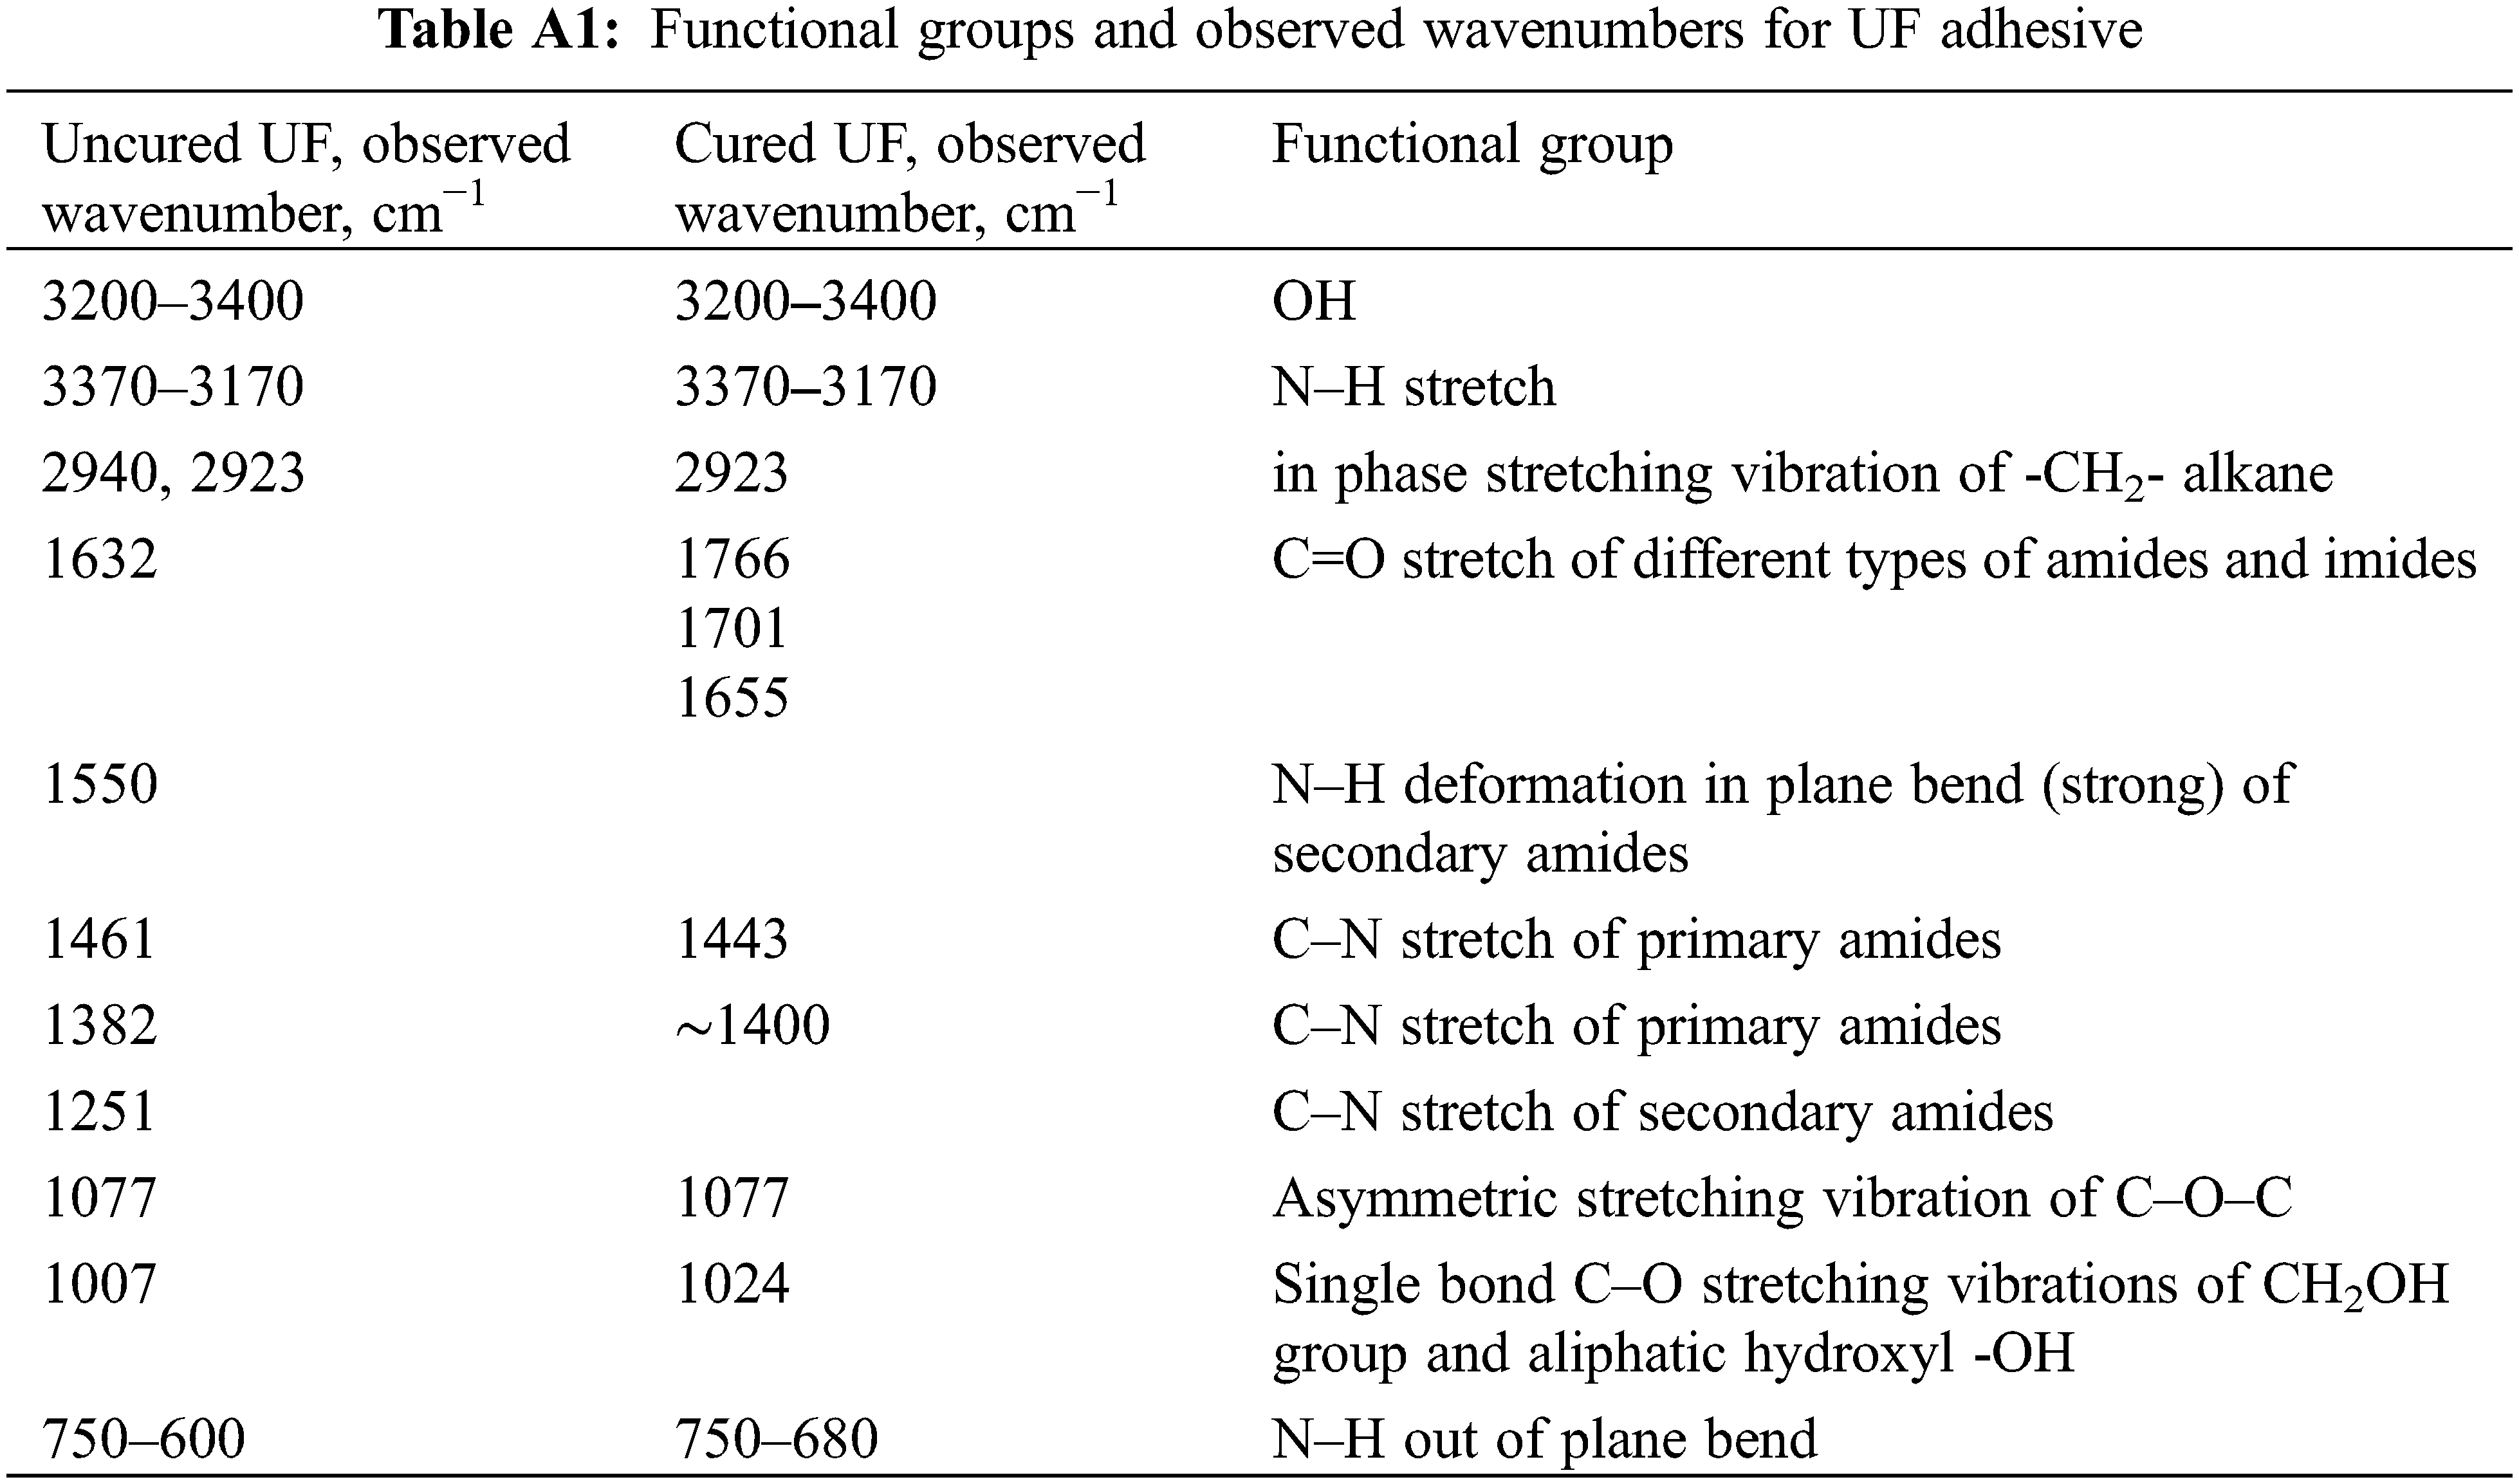
For the uncured UF adhesive, the stretching frequency of C=O amide group appears at 1633 and at 1550 cm−1. These two peaks belong to NH–CO amide group. The N–H stretching and deformation frequencies at around 3400 and 1600 cm−1 overlapped with the -OH and C=O stretching frequencies, respectively. The C–N stretching frequency appears at 1462 cm−1.
The FTIR spectrum of the cured UF adhesive has wider bands due to the formation of complex cross-linked amide structures. The C=O stretching frequency has shifted from 1632 cm−1 to three different bands at 1766, 1701, and 1655 cm−1. A sharp decrease of the N–H and C–N bands of secondary amid at 1550 and 1251 cm−1 was observed as a result of the cured reaction. The C–N stretching frequency of primary amide has shifted from 1462 to 1443 cm−1 and from 1382 to ∼1400 cm−1. This indicates that the UF adhesive forms a three-dimensional cross-linked structure.
For the uncured TH adhesive (Fig. 6), the sharp bands for phenolic alcohols are characteristic at 1236 cm−1 of C–O asymmetric stretch, at 1009 cm−1 and at 684 cm−1 bending of the hydroxyl O–H functional group. In the case of a cross-linked TH adhesive, these sharp bands are not detected, which indicates that a cross-linking reaction occurs via OH groups.
The FTIR spectra of NIPU adhesive measured with the ATR technique vary from FTIR spectra of NIPU adhesive measured with the KBr tablet, as expected [11]. Two peaks of the C=O group at 1697 cm−1 and at 1544 cm−1 for uncured NIPU and at 1633 cm−1 and at 1553 cm−1 for cured NIPU belong to NH–CO urethane bridges. The peak at 1250 cm−1 confirms the presence of the urethane linkages [11]. This latter peak can also belong to an amide, indicating a urethane linkage but is also superposed, masking a carbonate signal, confirmed by the small shoulder peak at 1744 cm−1 in the FTIR spectrum of the cured NIPU. The rest of the peaks are assigned as follows: the much larger peaks at 2930 and 2857 cm−1 and the peak at 1462 cm−1 for uncured NIPU and at 2924, and the peak at 1454 cm−1 for the cured NIPU to the asymmetric stretching of the –CH2- chain belonging to the diamine used to prepare the NIPU resin [11]. The peak at 1066 cm−1 and the broad peak at 3330–3400 cm−1 of cured NIPU belongs to the hydrogen-bonded stretching of aliphatic alcohols.
3.3 Modelling of Adhesive Bond Strength Development
Prior to performing the shear strength measurements with the ABES, the temperature transition to the bond line was measured for each of the studied pressing temperatures. Temperature transition measurements showed that ± 5°C isothermal conditions in the bond line were reached in the first 30 s after the closure of the ABES hot press.
Adhesive bond strength development (i.e., shear strength as a function of pressing time) was determined with ABES at three pressing temperatures for each of the tested adhesives. A three-parametric logistic function was fitted to the obtained data. Measured data and modelled functions are presented in Figs. 8–10 and function parameters in Table 2.

Figure 8: Development of the shear strength of the TH adhesive bond

Figure 9: Development of the shear strength of the NIPU adhesive bond

Figure 10: Development of the shear strength of the UF adhesive bond
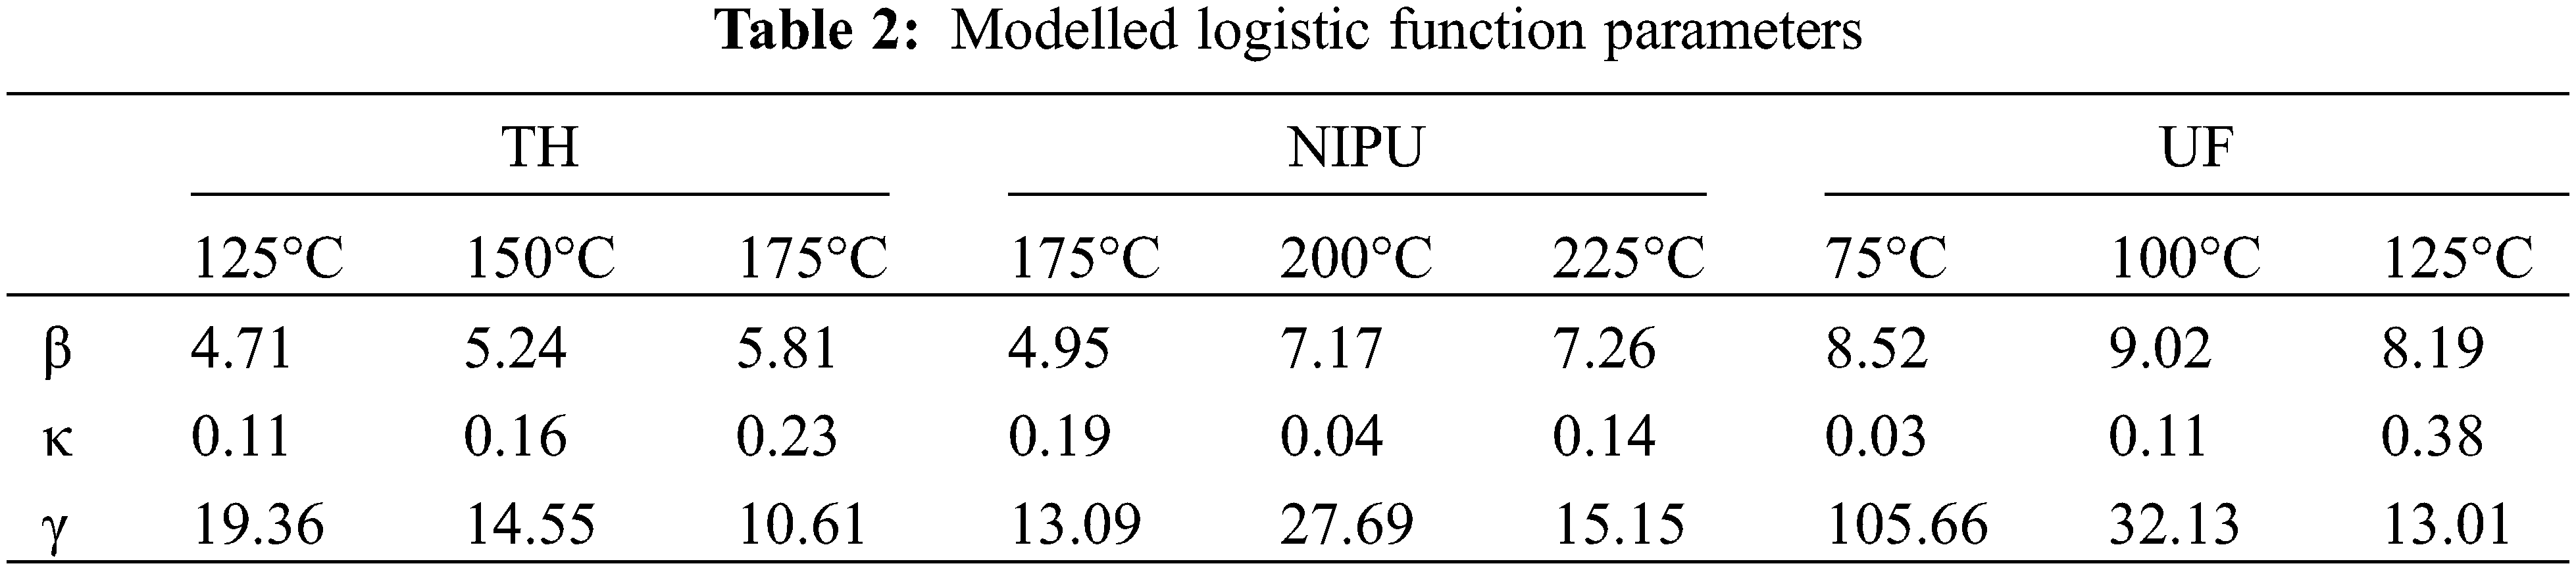
ABES results confirmed that the UF was the fastest and NIPU the slowest curing adhesive among the observed ones. By taking the presented results into account, optimal pressing parameters for TH adhesive would be 4 min at 175°C, for NIPU adhesive 7 min at 200°C, and for UF 1.5 min at 100°C.
The proposed three parametric logistic functions might be too rigid for describing the curing process in detail but useful for comparing the observed adhesives. The coefficients listed in Table 2 have the following meaning: β–coefficient determines the upper asymptote of the shear strength. As expected, higher pressing temperatures mostly resulted in a higher upper asymptote. NIPU and UF adhesives had a higher upper asymptote than TH adhesive. The κ–coefficient determines the slope of the curve. As expected, higher pressing temperatures mostly resulted in a higher slope of the curve. Since the upper asymptotes are quite different between the observed adhesives, the κ–coefficients can hardly be compared between different adhesives. The γ–coefficient determines the time when the maximum growth occurs. As expected, higher pressing temperatures mostly resulted in shorter times when the maximum growth occurred.
3.4 Correlation between Results Obtained by DSC and ABES
The degree of cure derived from ABES measurements and the degree of cure obtained by AMFK from DSC data were compared at the same time scale and plotted on the same graph. Correlation between results obtained by two methods shows how the mechanical cure determined by ABES can be predicted with the chemical cure determined by DSC (Figs. 11–13).

Figure 11: Correlation between the degrees of cure obtained by DSC and ABES for TH adhesive at 125°C, 150°C and 175°C

Figure 12: Correlation between the degrees of cure obtained by DSC and ABES for NIPU adhesive for 175°C, 200°C and 225°C (for 225°C temperature times longer than 200 s were not taken into account)

Figure 13: Correlation between the degrees of cure obtained by DSC and ABES for UF adhesive for 75°C, 100°C and 125°C
The correlation between the mechanical and chemical aspects of adhesive curing was high for UF and NIPU adhesives (R2 ≈ 0.90). A strong linear fit was observed between mechanical and chemical aspects at those two adhesives. A lower correlation was observed for TH adhesive (R2 0.68). The lower correlation could be due to the more complex curing behaviour observed for DSC (two exothermic peaks). Since the three observed adhesives cure differently, no general conclusions can be made. With the TH adhesive, the chemical cure underestimated the mechanical curing process in the first part and overestimated it at the end of the curing process. With the NIPU adhesive, the chemical cure was underestimating the mechanical curing process up to the end. With the UF adhesive, the chemical cure had similar behaviour to the mechanical curing process through the entire curing process. A comparison with other similar research studies is presented in Table 3.
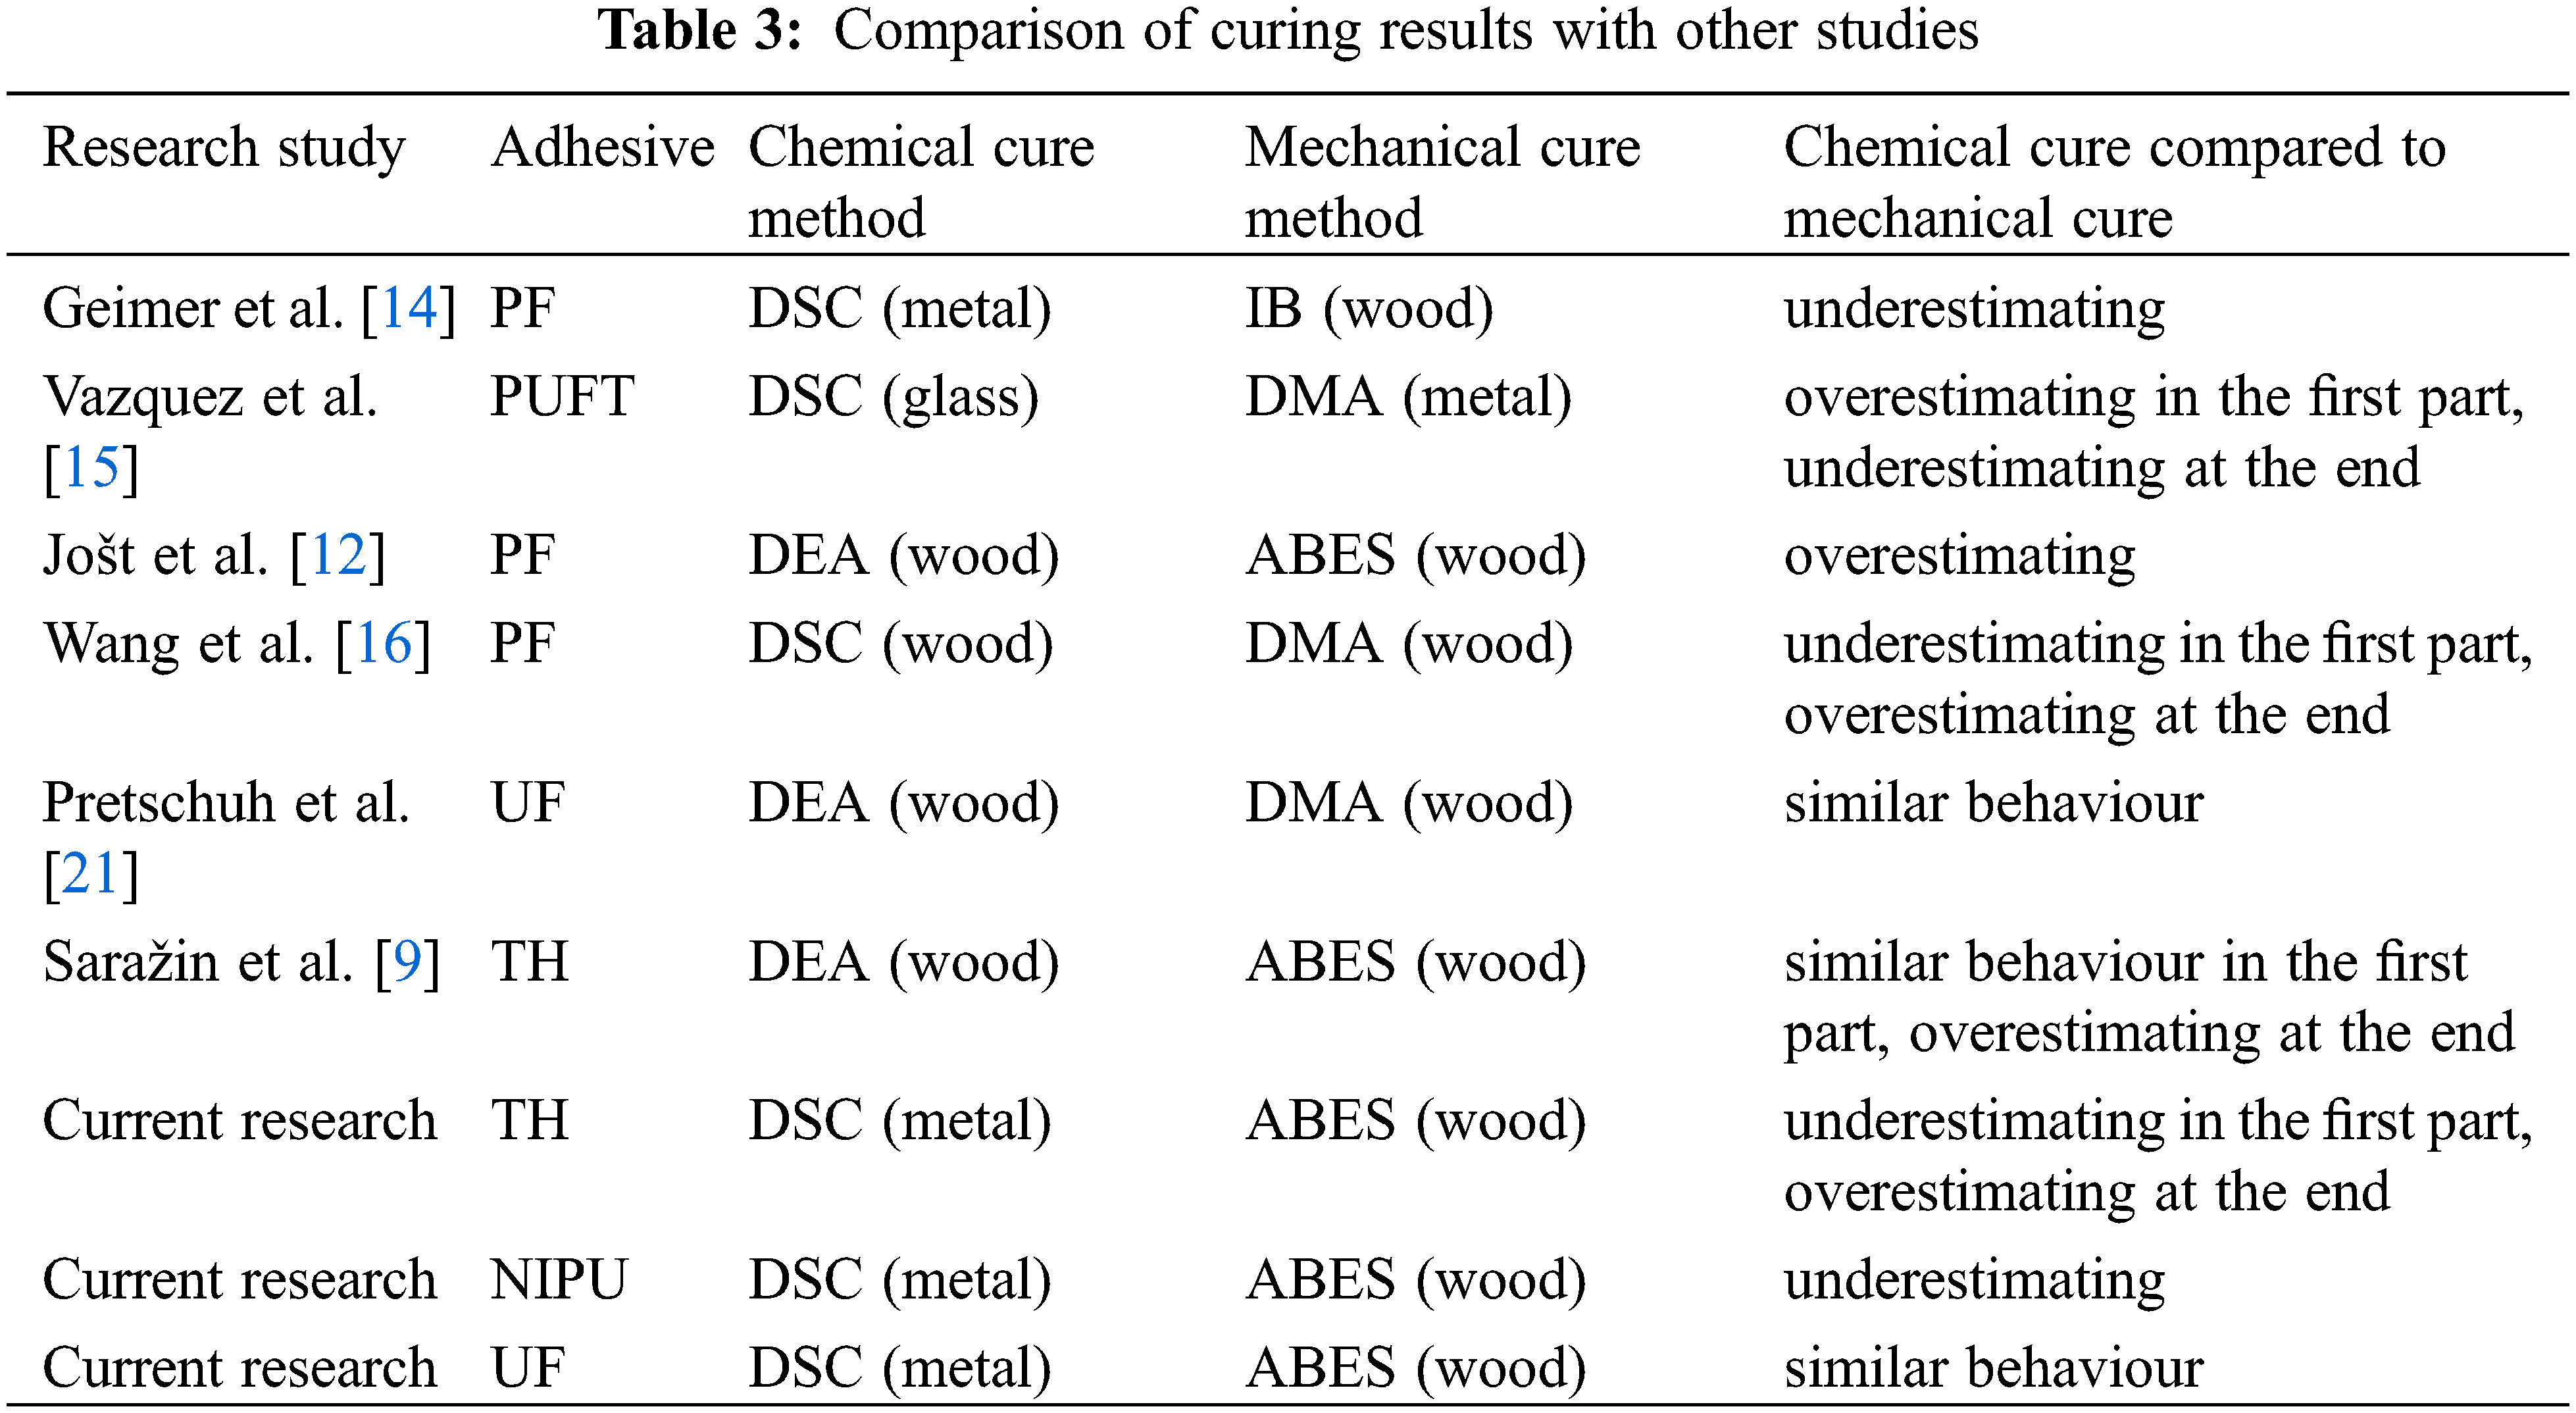
Different study approaches and different adhesives led to a different relationship between chemical and mechanical curing. Both studies of UF adhesive ([21] and Current research) found similar behaviour between chemical and mechanical curing. Both studies of the TH adhesive ([11] and Current research) found that in the first part of the curing process, the chemical cure was at least slightly underestimating the mechanical curing process; however, in the last part, the chemical cure was overestimating it. Other similar research was performed mostly on PF adhesives, and the conclusions are not consistent.
In summary, no general rules about the correlation between particular curing characterisation methods can be made to apply to all groups of studied adhesives. Each adhesive and each combination of curing characterisation methods of interest must be evaluated separately.
The curing process of two biobased (TH and NIPU) adhesives, suitable for interior non-structural use, were compared with commercial UF adhesive.
Both DSC and ABES results confirmed UF as the fastest and NIPU as the slowest curing adhesive among the observed ones. Taking into account the ABES results, the optimal pressing parameters for TH adhesive would be 4 min at 175°C, for NIPU adhesive 7 min at 200°C, and for UF 1.5 min at 100°C.
The FTIR spectra of the cured UF, TH, and NIPU adhesives had wider bands due to the formation of complex cross-linked structures in comparison with sharp signals in the FTIR spectra of uncured UF, TH, and NIPU adhesives. Due to the formation of methylene and methylene ether bridges, the decrease in the signal of the -OH group and increase of the aliphatic -CH2- group was detected. All three adhesives form three-dimensional cross-linked structures.
A strong linear correlation was observed between mechanical and chemical cures for UF and NIPU adhesive (R2 ≈ 0.90). A lower correlation was observed at TH adhesive (R2 0.68). It was determined that no general correlation between chemical and mechanical curing aspects can be made for all studied adhesives.
Acknowledgement: Special thanks go to Gregor Matija Černe and Toni Šauperl for help with ABES measurements.
Funding Statement: This research was financed by the ERA-CoBioTech project WooBAdh (Environmentally-friendly bioadhesives from renewable resources) and by the Slovenian Ministry of Education. Science and Sport and the Slovenian Research Agency within the framework of the program P4-0015.
Conflicts of Interest: The authors declare that they have no conflicts of interest to report regarding the present study.
1. Pizzi, A. (2006). Recent developments in eco-efficient bio-based adhesives for wood bonding: Opportunities and issues. Journal of Adhesion Science and Technology, 20(8), 829–846. DOI 10.1163/156856106777638635. [Google Scholar] [CrossRef]
2. Pizzi, A. (2016). Wood products and green chemistry. Annals of Forest Science, 73, 185–203. DOI 10.1007/s13595-014-0448-3. [Google Scholar] [CrossRef]
3. Saražin, J., Schmiedl, D., Pizzi, A., Šernek, M. (2020). Bio-based adhesive mixtures of pine tannin and different types of lignins. BioResources, 15(4), 9401–9412. DOI 10.15376/biores.15.4.9401-9412. [Google Scholar] [CrossRef]
4. Pizzi, A. (1978). Wattle-base adhesives for exterior grade particleboards. Forest Products Journal, 28(12), 42–47. [Google Scholar]
5. Gardner, D. J., Sellers, T. (1986). Formulation of a lignin-based plywood adhesive from steam-exploded mixed hardwood lignin. Forest Products Journal, 36(5), 61–67. [Google Scholar]
6. Krzysik, A., Young, R. A. (1986). A lignin adhesive system for flakeboard production. Forest Products Journal, 36(11/12), 39–44. [Google Scholar]
7. Thébault, M., Pizzi, A., Santiago-Medina, F. J., Al-Marzouki, F. M., Abdalla, S. (2017). Isocyanate-free polyurethanes by coreaction of condensed tannins with aminated tannins. Journal of Renewable Materials, 5(1), 21–29. DOI 10.7569/JRM.2016.634116. [Google Scholar] [CrossRef]
8. Santiago-Medina, F. J., Basso, M. C., Pizzi, A., Delmotte, L. (2018). Polyurethanes from kraft lignin without using isocyanates. Journal of Renewable Materials, 6(4), 413–425. DOI 10.7569/JRM.2017.634172. [Google Scholar] [CrossRef]
9. Saražin, J., Šega, B., Šernek, M. (2021a). Curing characterization of tannin-hexamine adhesive by automated bonding evaluation system, dielectric analysis, and dynamic mechanical analysis. BioResources, 16(3), 6174–6185. DOI 10.15376/biores. [Google Scholar] [CrossRef]
10. Pizzi, A., Stracke, P., Trosa, A. (1997). Industrial tannin/hexamine low-emission exterior particleboards. Holz als Roh-und Werkstoff, 55, 168. DOI 10.1007/BF02990538. [Google Scholar] [CrossRef]
11. Saražin, J., Pizzi, A., Amirou, S., Schmiedl, D., Šernek, M. (2021b). Organosolv lignin for non-isocyanate based polyurethanes (NIPU) as wood adhesive. Journal of Renewable Materials, 9(5), 881–907. DOI 10.32604/jrm.2021.015047. [Google Scholar] [CrossRef]
12. Jošt, M., Šernek, M. (2009). Shear strength development of the phenol-formaldehyde adhesive bond during cure. Wood Science Technology, 43, 153–166. DOI 10.1007/s00226-008-0217-2. [Google Scholar] [CrossRef]
13. Šernek, M., Dunky, M. (2010). Adhesive bond strength development. In: Thoemen, H., Irle, M., Sernek, M. (Eds.Wood-based panels: An introduction for specialists, pp. 203–224. London: Brunel University Press. [Google Scholar]
14. Geimer, R. L., Christiansen, A. W. (1996). Critical variables in the rapid cure and bonding of phenolic resins. Forest Products Journal, 46(11/12), 67–27. [Google Scholar]
15. Vazquez, G., Lopez-Suevos, F., Gonzalez-Alvarez, J., Antorrena, G. (2005). Curing process of phenol-urea-formaldehyde-tannin (PUFT) adhesives: Kinetic studies by DSC and DMA. Journal of Thermal Analysis and Calorimetry, 82, 143–149. DOI 10.1007/s10973-005-0855-7. [Google Scholar] [CrossRef]
16. Wang, J., Laborie, M. P. G., Wolcott, M. P. (2011). Correlation of mechanical and chemical cure development for phenol–formaldehyde resin bonded wood joints. Thermochimica Acta, 513(1–2), 20–25. DOI 10.1016/j.tca.2010.11.001. [Google Scholar] [CrossRef]
17. EN 12765 (2016). Classification of thermosetting wood adhesives for non-structural applications. European Committee for Standardization, Brussels, Belgium. [Google Scholar]
18. Čop, M., Gospodarič, B., Kamppainen, K., Giovando, S., Laborie, M. P. et al. (2015). Characterization of the curing process of mixed pine and spruce tannin-based foams by different methods. European Polymer Journal, 69, 29–37. DOI 10.1016/j.eurpolymj.2015.05.020. [Google Scholar] [CrossRef]
19. ASTM D7998–19 (2019). Standard test method for measuring the effect of temperature on the cohesive strength development of adhesives using lap shear bonds under tensile loading, ASTM International: West Conshohocken, PA. DOI 10.1520/D7998-19. [Google Scholar] [CrossRef]
20. Poljanšek, I., Krajnc, M. (2005). Characterization of phenol-formaldehyde prepolymer resins by in line FT-IR spectroscopy. Acta Chimica Slovenica, 52(3), 238–244. [Google Scholar]
21. Pretschuh, C., Müller, U., Wuzella, G., Dorner, F., Eckmann, R. (2012). Dielectric analysis as curing control for aminoplast resins—correlation with DMA. European Journal of Wood Products, 70, 749–753. DOI 10.1007/s00107-012-0612-0. [Google Scholar] [CrossRef]
Appendix A
 | This work is licensed under a Creative Commons Attribution 4.0 International License, which permits unrestricted use, distribution, and reproduction in any medium, provided the original work is properly cited. |