| Journal of Renewable Materials |
DOI: 10.32604/jrm.2022.019649
ARTICLE
Dust Deposition’s Effect on Solar Photovoltaic Module Performance: An Experimental Study in India’s Tropical Region
Department of Electrical and Electronics Engineering, R.M.K. Engineering College, Chennai, India
*Corresponding Author: K. R. Chairma Lakshmi. Email: chermalakshmi@gmail.com
Received: 06 October 2021; Accepted: 07 December 2021
Abstract: A solar PV panel works with maximum efficiency only when it is operated around its optimum operating point or maximum power point. Unfortunately, the performance of the solar cell is affected by several factors like sun direction, solar irradiance, dust accumulation, module temperature, as well as the load on the system. Dust deposition is one of the most prominent factors that influence the performance of solar panels. Because the solar panel is exposed to the atmosphere, dust will accumulate on its surface, reducing the quantity of sunlight reaching the solar cell and diminishing output. In the proposed work, a detailed investigation of the performance of solar PV modules is carried out under the tropical climatic condition of Chennai, India, where the presence of dust particles is very high. The data corresponding to four different dust samples of various densities at four solar irradiation levels of 220, 525, 702, and 905 W/m2 are collected, and performance analysis is carried out. Based on the analysis carried out, the maximum power loss is found to be 73.51%, 66.29%, 65.46%, and 61.42%, for coal, sand, brick powder, and chalk dust respectively. Hence, it can be said that coal dust contributes to the maximum power loss among all four dust samples. Due to heat dissipation produced by dust deposition, the performance of solar PV modules is degraded as the temperature rose.
Keywords: Solar photovoltaic power generation system; dust effect; electrical efficiency loss; dust samples; surface contamination
Nomenclature
| G | Solar irradiance in W/m2 |
| A | Solar panel surface area in m2 |
| Im | Solar panel output current in Amps |
| Vm | Solar panel output voltage in Volts |
| Pm | Solar panel output power in Watts |
| ηloss | Solar PV module performance efficiency loss |
| η | Solar PV module performance efficiency |
| ηclean | Solar PV module performance efficiency under the clean condition |
| ηdust | Solar PV module performance efficiency under the dusted condition |
| Voc | Open Circuit Voltage in Volts |
| Isc | Short Circuit Current in Amps |
| α | Temperature coefficient of Current (Isc) in %/°C |
| ß | Temperature coefficient of Voltage (Voc) in %/°C |
| γ | Temperature coefficient of Power (Pm) in %/°C |
| Tmod | Solar PV module backside temperature in °C |
Energy is necessary for economic growth and development. Society requires more electricity as a result of fast development and the desire to increase the economy. Renewable energy is attracting more attention from researchers because of the nonpolluting energy source in abundance range, increasing fossil fuel prices, and paying attention to increasing global climate change [1]. Around 80% of the world’s energy consumption is satisfied from fossil fuel sources such as coal and natural gas which significantly increase global warming [2]. Among all renewable energy resources, solar energy plays a significant role to satisfy the power deployment of the complete world. Solar energy is the most abundant and limitless renewable resource. The solar power dissipated as heat energy in one minute is sufficient to meet the energy requirements of the earth for one year. In a single day, the sun can deliver energy more than that of the earth’s essential consumption for 27 years. In terms of total electricity consumption, India is in the fifth position in comparison with other countries. India receives approximately nearer to 5,000 trillion kWh per year energy from the sun because it is close to the equator. India receives clear and full solar energy around 300 clear sunny days in a year. Solar PV modules have been utilized in recent years to try to make better use of this abundant energy source. Despite this, the electrical efficiency (energy conversion efficiency) of the solar PV module is just 15%–20%. The efficiency of solar PV power generation system is adversely affected by various reasons like solar cell materials, panel atomic structure, panel bandgap energy, irradiance effect, temperature effect, incident angle effect, shadow effect, crack in the panel, shunt resistance, maintenance, and cleaning cycle, load mismatching effect, cable loss, spectral mismatch loss, etc.
In order to improve the solar cell conversion efficiency, Today, there are many solar technologies that use new materials that go beyond traditional modules based on silicon wafers like Perovskite (MAPbI3-xClx)/GeTe [3], GaInP/GaAs//Si triple-junction cell [4], GaInP/GaAs/Si (mech. Stack) [5,6], Graded bulk heterojunction (GBHJ) organic solar cell [7], FASnI3-based solar cells [8], Perovskite formamidinium tin iodide (HC(NH2)2SnI3–FASnI3) solar cell [9], Graded bulk heterojunction (GBHJ) organic solar cell (OSC) [10], Monolithic perovskite/SHJ tandem cells [11–13] and solar cell with SnO2:F/Zn1-xMgxO/CdTe/CdSixTey/Si/ZnTe:Mo/Au structure [14]. Significant time and money have been dedicated to improving the solar cell conversion efficiency from 10% to 40%. Similarly, a lot of researchers trying to enhance the efficiency by reducing mismatch loss [15], mechanical failure loss [16], irradiance effect, incident angle effect, temperature effect and load effect, etc. By using different MPPT strategies like BPSO fuzzy P&O controller [17], Modified-Perturb & Observe (MP&O) [18], Adaptive fixed duty cycle algorithm [19], ANFIS MPPT approach [20], GMPPT algorithm [21], FL based MPPT algorithm [22] and FOPI controller [23,24], the impact of load effect in the solar panel is addressed. The efficiency of a solar PV power generation system depends on the types of solar panels, installation factors, environmental conditions, and regular maintenance. When installing a solar PV module, there are several considerations such as the appropriateness of the installation location and the amount of solar radiation falling on-site, direction, and incline of solar radiation that the installation location receives. These considerations are made to ensure that the sun’s rays are stronger and perpendicular to the photosensitive surface of the solar PV system. Solar tracking systems are used to achieve maximum absorption of solar radiation and compensate for fluctuations at different times of the year. In reference [25], a high concentrator photovoltaic system was designed using Multiple primary Fresnel lenses with a 5800× geometrical concentration ratio which improves the optical efficiency up to 75%. In [26,27], a two-axis solar tracking system developed and improved the irradiation gain from 17.2% to 31.1% over the fixed panel. In Reference [28,29], the researchers proposed numerical models to assess solar energy irradiation (global diffuse and direct solar radiation) on a monthly, seasonal, and annual basis, especially on tilted surfaces. Another solar tracking system was developed with a single-axis tracking technique which improves the energy extraction of the solar panel up to 40% compared to the fixed panel [30]. A solar cell converts less than 20% of sun irradiance into electricity remaining transfer as thermal loss or heat which elevates the temperature of the solar module significantly. The performance of solar cells is improved by using a cooling system. In [31], the author posits that a phase change material with a lower melting temperature (near ambient) may keep the PV at a lower temperature, but that it would require more PCM to cool the PV. In [32–34], the cooling system with various types of the heat sink is investigated. By applying anti-reflection coating [35–37], reflection loss, as well as Temperature of the solar panel, can also reduce [38] which increases the efficiency up to 14%. Even though all the effects or losses are avoided by appropriate techniques, few externalities may be showstoppers for technology deployment. The influence of dust or dirt particles sedimentation on exposed surfaces is one such externality that is rarely considered while deploying and operating most solar photovoltaic systems. Dust inherently affects the intended function at the light interaction, reducing power production and efficiency dramatically or leading the system down completely. The issue of dust has only recently risen to prominence as a consequence of increasing interest and deployment in areas of the world [39]. Dust is defined as a particle with a diameter of less than 500 μm. The morphological structure, content, and deposition of dust are influenced by the characteristics of the area. The particle size and surface density of dust accumulated on PV modules have a significant impact on their performance [40]. There have been studies on the effect of dust on solar PV performance, even though much of the study is only relevant for a specific location like Kathmandu [41], China [42], California [43], Qatar [44], India [45], Atacama Desert [46], Kuwait [47] and Pakistan [48]. In general, statistical details are absent on the impacts of soil dust deposition for a selected area in India that may be used to design and size PV modules effectively. Due to the lack of awareness of the dust effect, solar PV systems may be improperly maintained, resulting in energy loss.
The objectives of this research are to investigate the performance degradation of solar PV module output power influenced by dust deposition, in an experimental setup. To fulfill the objectives, calculated the impact of dust in test location under real-time conditions. The research provides relevant information that may help users in better system maintenance and enhanced power output.
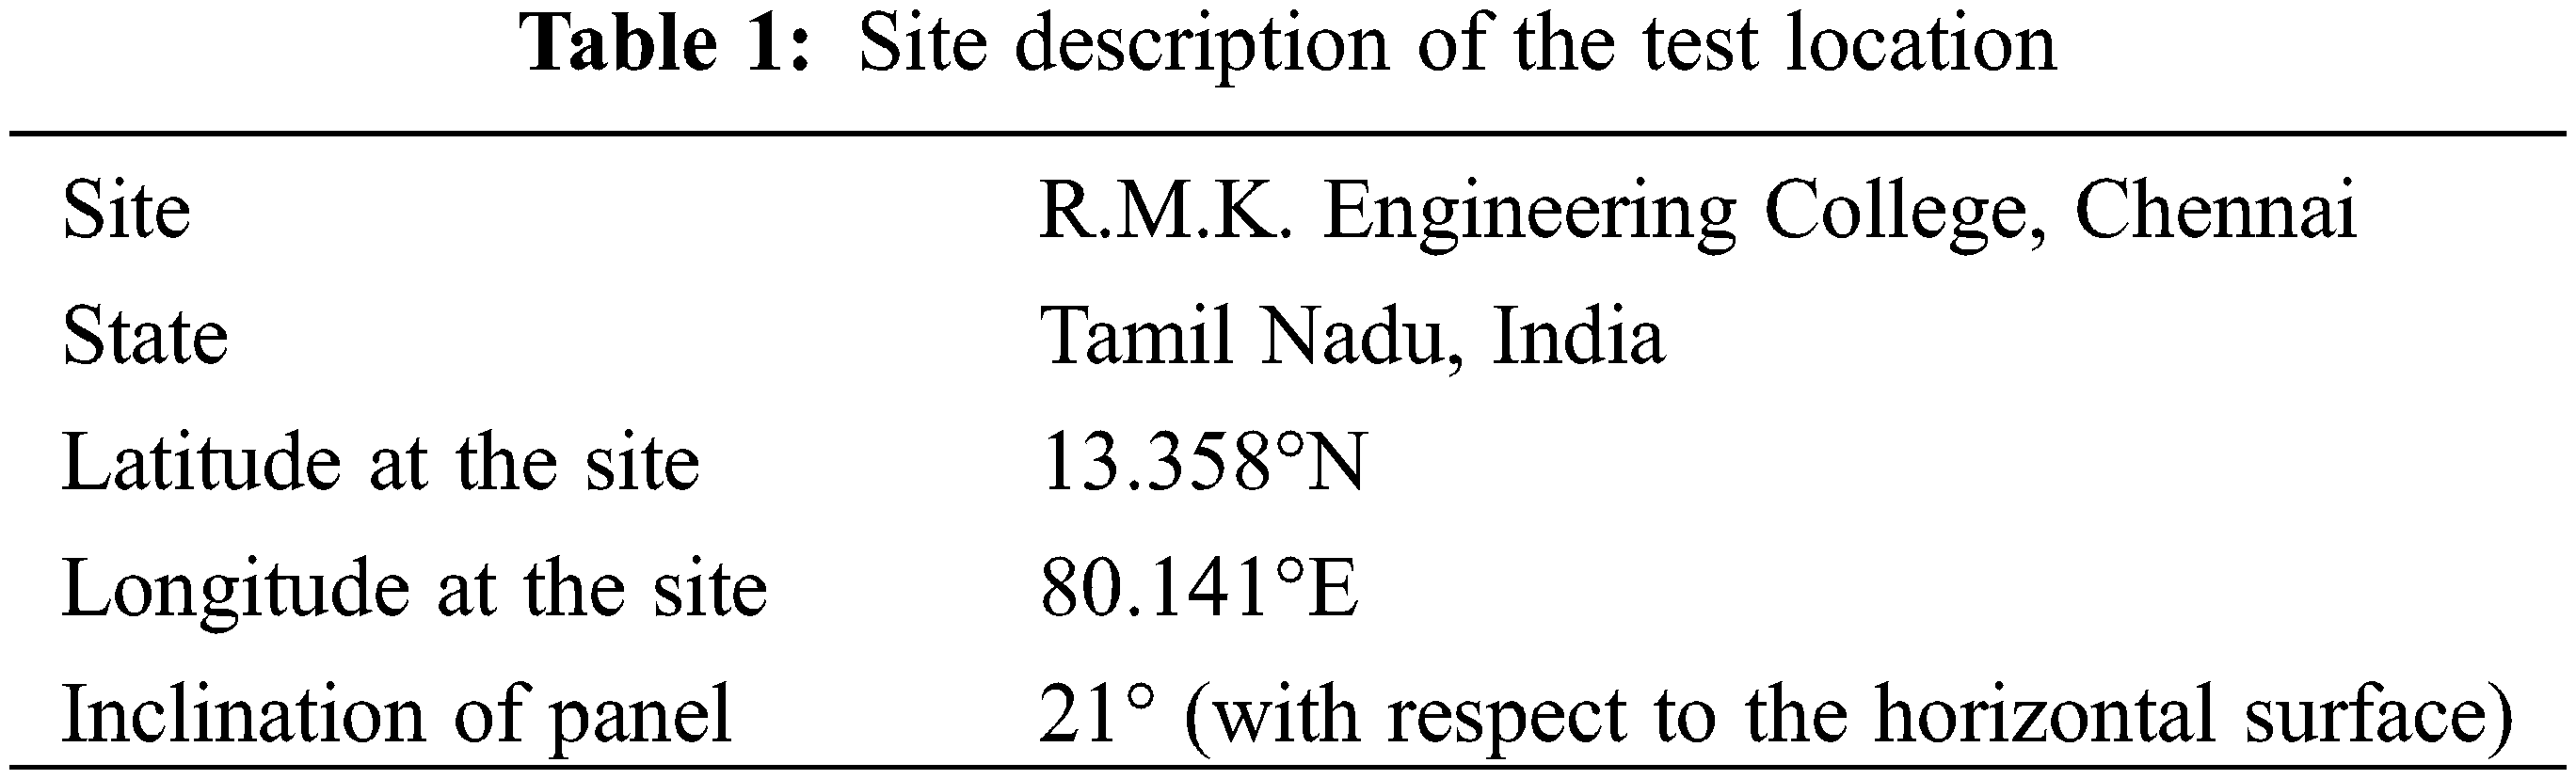
2.1 Description of the Test Site
The experimental work is conducted in an outdoor environment at R.M.K. Engineering College and the details are given in Table 1. Chennai is India’s fourth-largest city, covering 1189 square kilometers (Latitude: 13.0836939°N, Longitude: 80.270186°E). Chennai has a tropical climate with both wet and dry seasons which is located on the thermal equator and is also the coastline, preventing dramatic seasonal temperature variations. The weather is hot and humid most of the year. The average annual temperature in Chennai is 27.9°C | 82.1°F. Rainfall is 1014 mm | 39.9 inches per year. February is the driest month, with only 9 mm | 0.4 inches of rain. The month of November has the most precipitation, with an average of 228 mm | 9.0 inches. The month of May is the hottest of the year. In May, the average temperature is 31.3°C | 88.4°F.
An experimental setup, consisting of the following equipment, is established to achieve the results for the analysis of dust falling on the solar PV module.
(1) Two similar 100 W polycrystalline PV modules
(2) Multimeter (MASTECH, MAS830L)
(3) Resistive load of 10 Ω
(4) Solar irradiation meter (SM-206)
(5) Dust samples
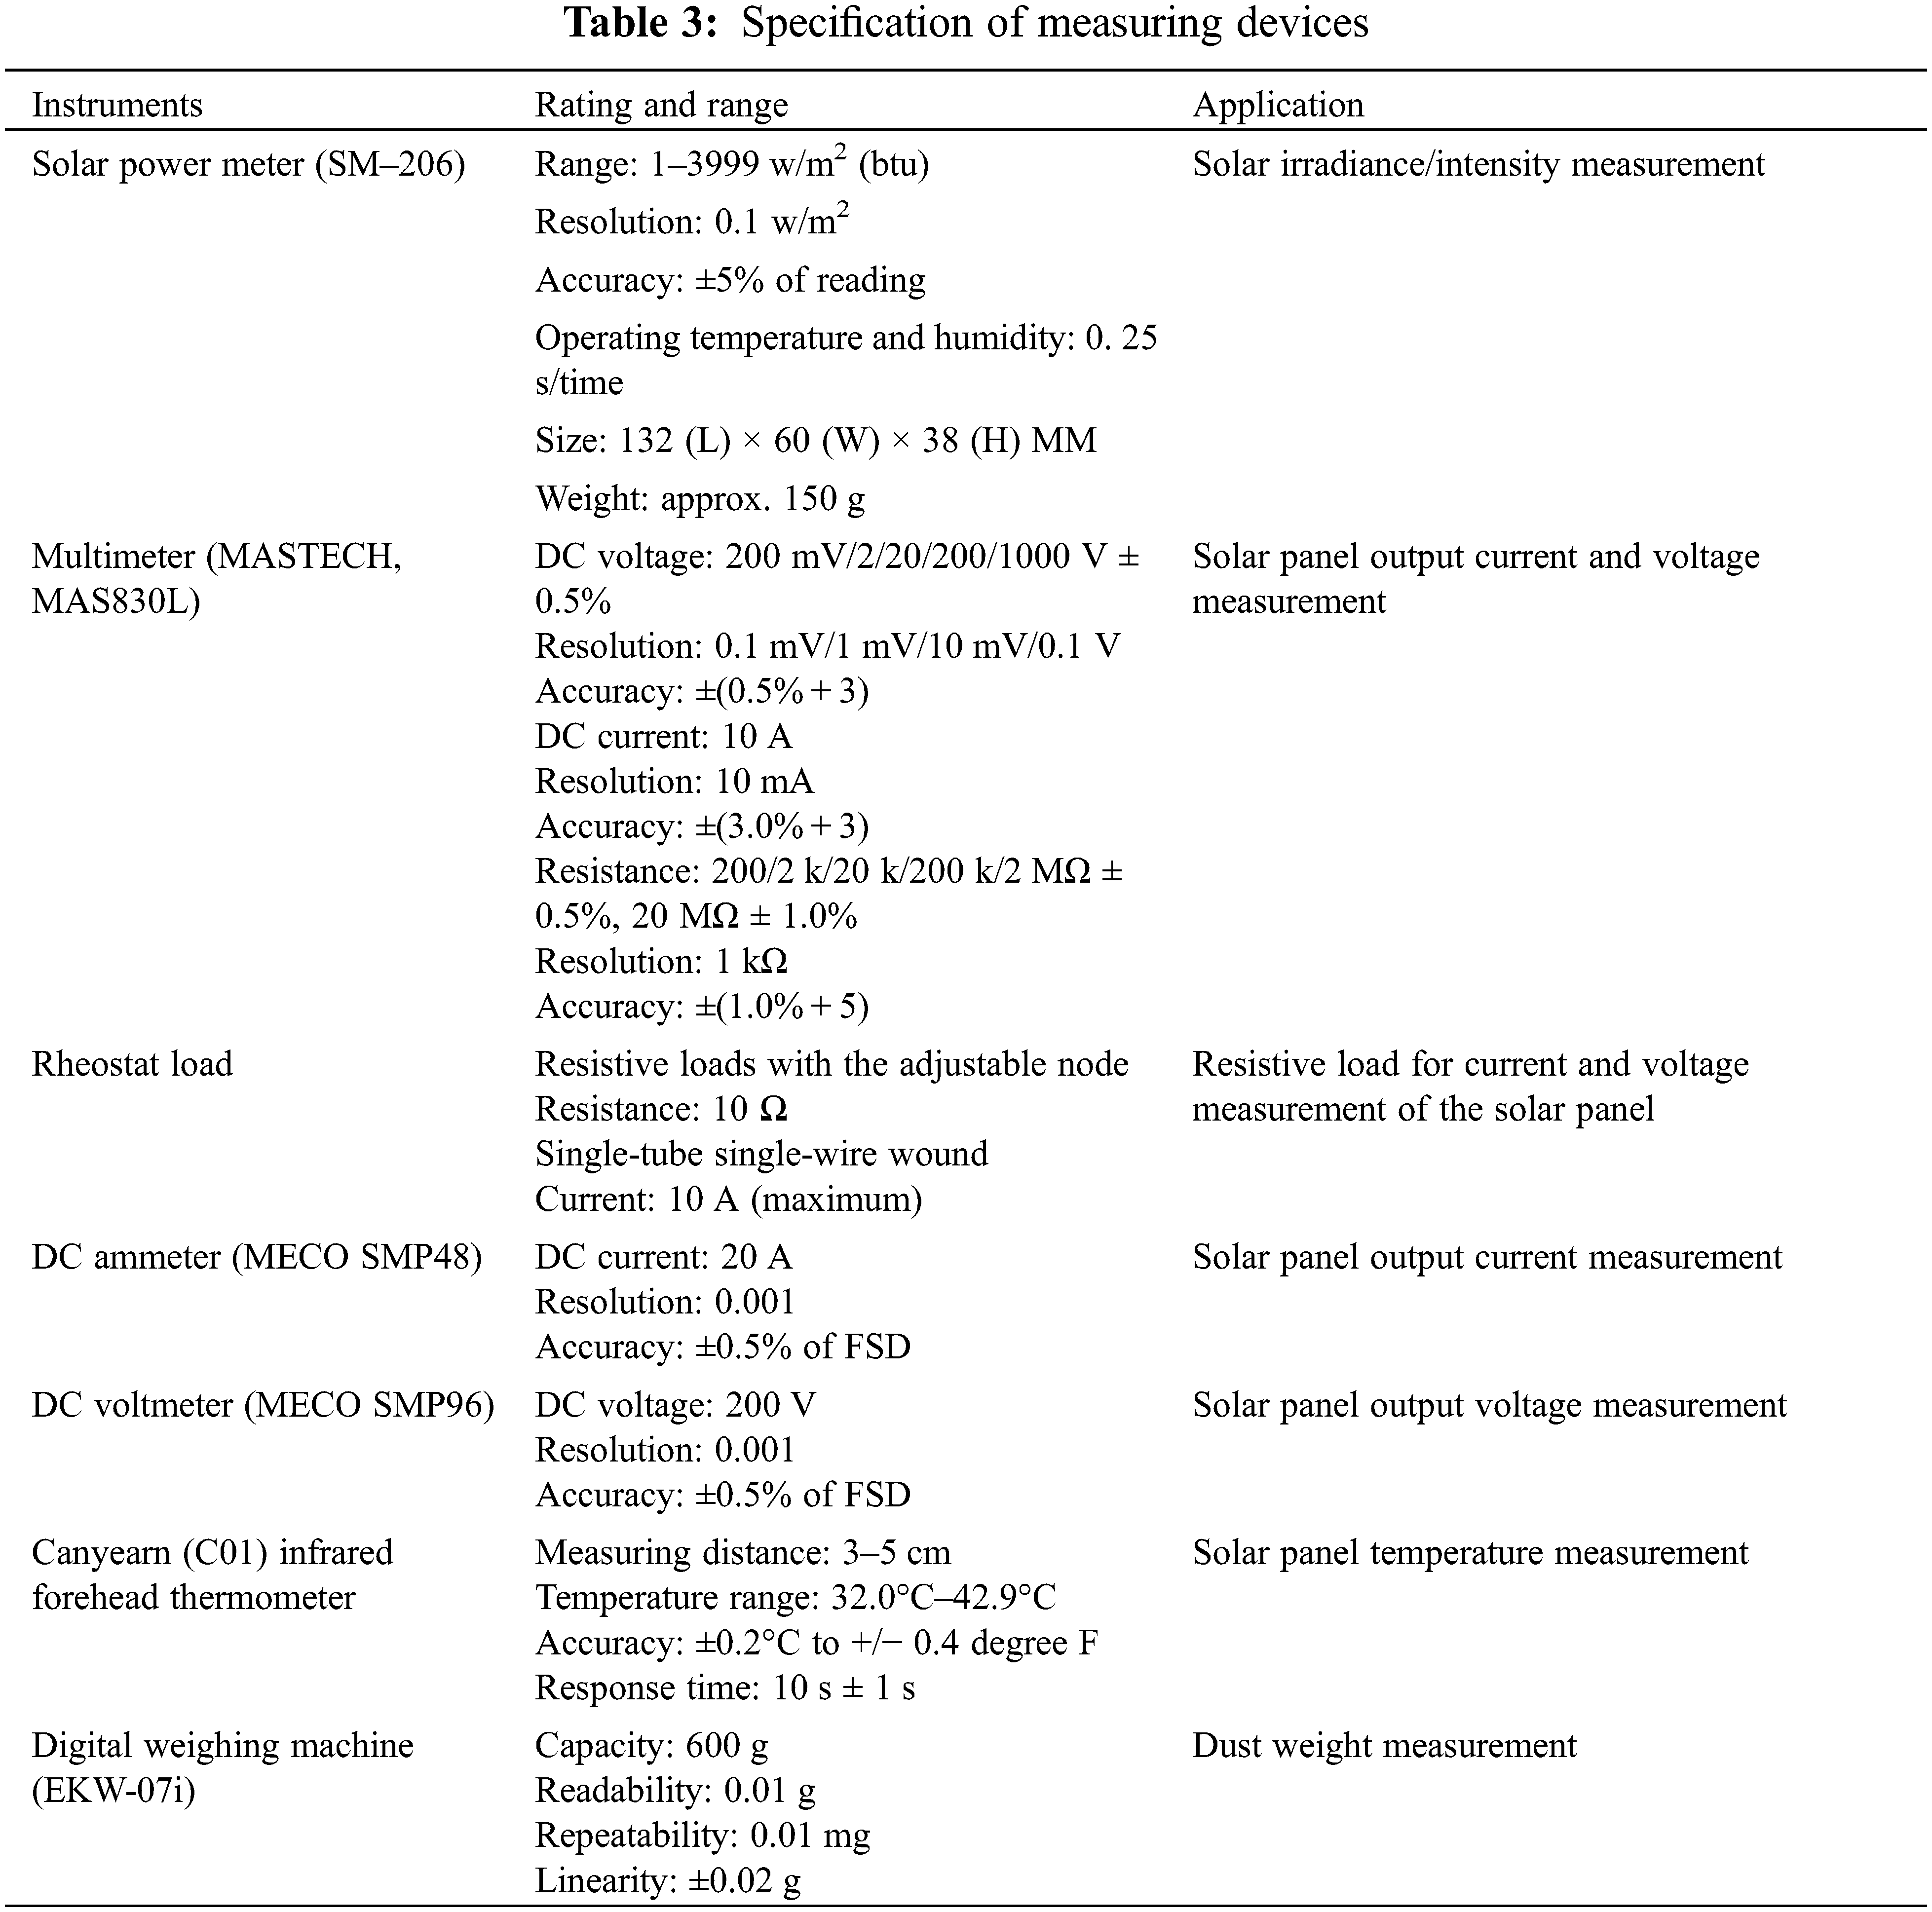
The outdoor test unit is mounted on top of the building. Therefore, the solar photovoltaic system is exposed to real atmospheric conditions. The major performance parameters, like solar irradiance (G in W/m2), ambient temperature (Tamp in °C), solar module backside temperature (Tmod in °C), solar panel output current (Im in Amps), solar panel output voltage (Vm in Volts), solar panel output power (Pm in Watts), open-circuit voltage (Voc in Volts), short circuit current (Isc in Amps) and efficiency (ƞ in %), are monitored by using various instruments mentioned above. Tables 2 and 3 summarize the specifications of the solar PV module and measuring devices utilized in the current investigation. The accessories and equipment involved for experimental measurements are illustrated in Fig. 1 where A represents a Clean solar panel, B represents Dusted solar panel. Output current and voltage from the solar panel measured by Digital ammeter and Digital voltmeter are represented as C and D label. The variable resistive load is represented as E, Solar meter is represented as F, Weighting machine, used for measuring the weight of the dust, is represented as G, a multimeter is represented as H.
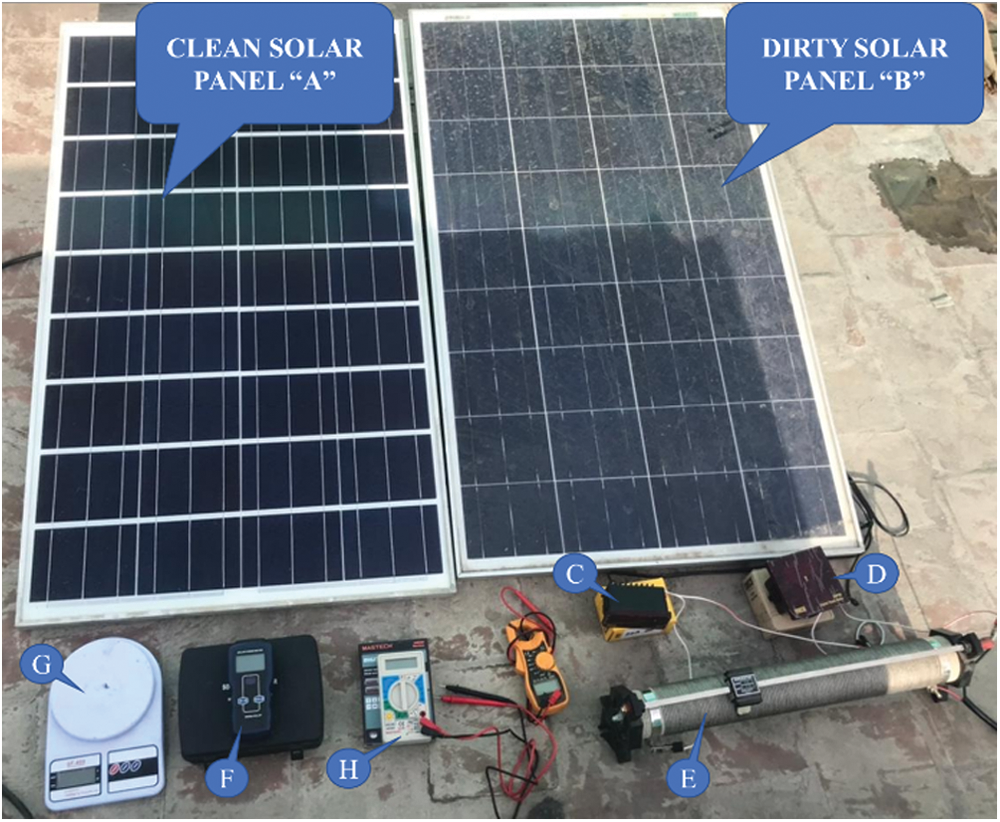
Figure 1: Experimentational setup

In the current investigation, dust samples were collected from a variety of locations, including industrial estates, agricultural land, and others. The brick powder is frequently found on building sites, whereas coal powder is mostly found in coal-fired power plants, and chalk powder and sand are two basic kinds of dust found in schools, playgrounds, and other locations. The dust samples taken for experiments are shown in Fig. 2a. Using a scanning electron microscope image, all the dust samples are tested, and the size and bonding density of the dust is obtained which is shown in Fig. 2b. After the dust samples were processed and weighed, a dust sample of various weights is evenly scattered on the solar photovoltaic modules using a vibrator and shaken for 5 min at 60 shakes per minute to ensure that dust particles are evenly distributed on the PV module. The panel was then left for half an hour to settle dust particles. The particle size distribution of collected dust has a significant direct impact on solar cell output performance deterioration. Reflection, refraction, and absorption of incoming light on the solar photovoltaic module are all affected by the size of the deposited dust particles on the solar panel. The deposition of fine dust particles degrades solar PV module performance more than bigger dust particles. Fine dust particles have a larger specific surface area and are more equally dispersed than bigger dust particles when compared on the account of the same mass of dust. Small molecules have a smoother surface than large dust particles, minimizing the spaces between them through which light can penetrate. SEM images of various dust samples inferred that the Particle Size of coal is small compared with all other dust samples. So, it covers more surface areas of the solar panel compared with other dust samples. Hence, coal samples much more reduce the penetration of light intensity on the solar panel compared to all other dust samples. Data on dust samples of various densities with changes in solar PV module output power loss at different solar irradiance are obtained and analyzed.
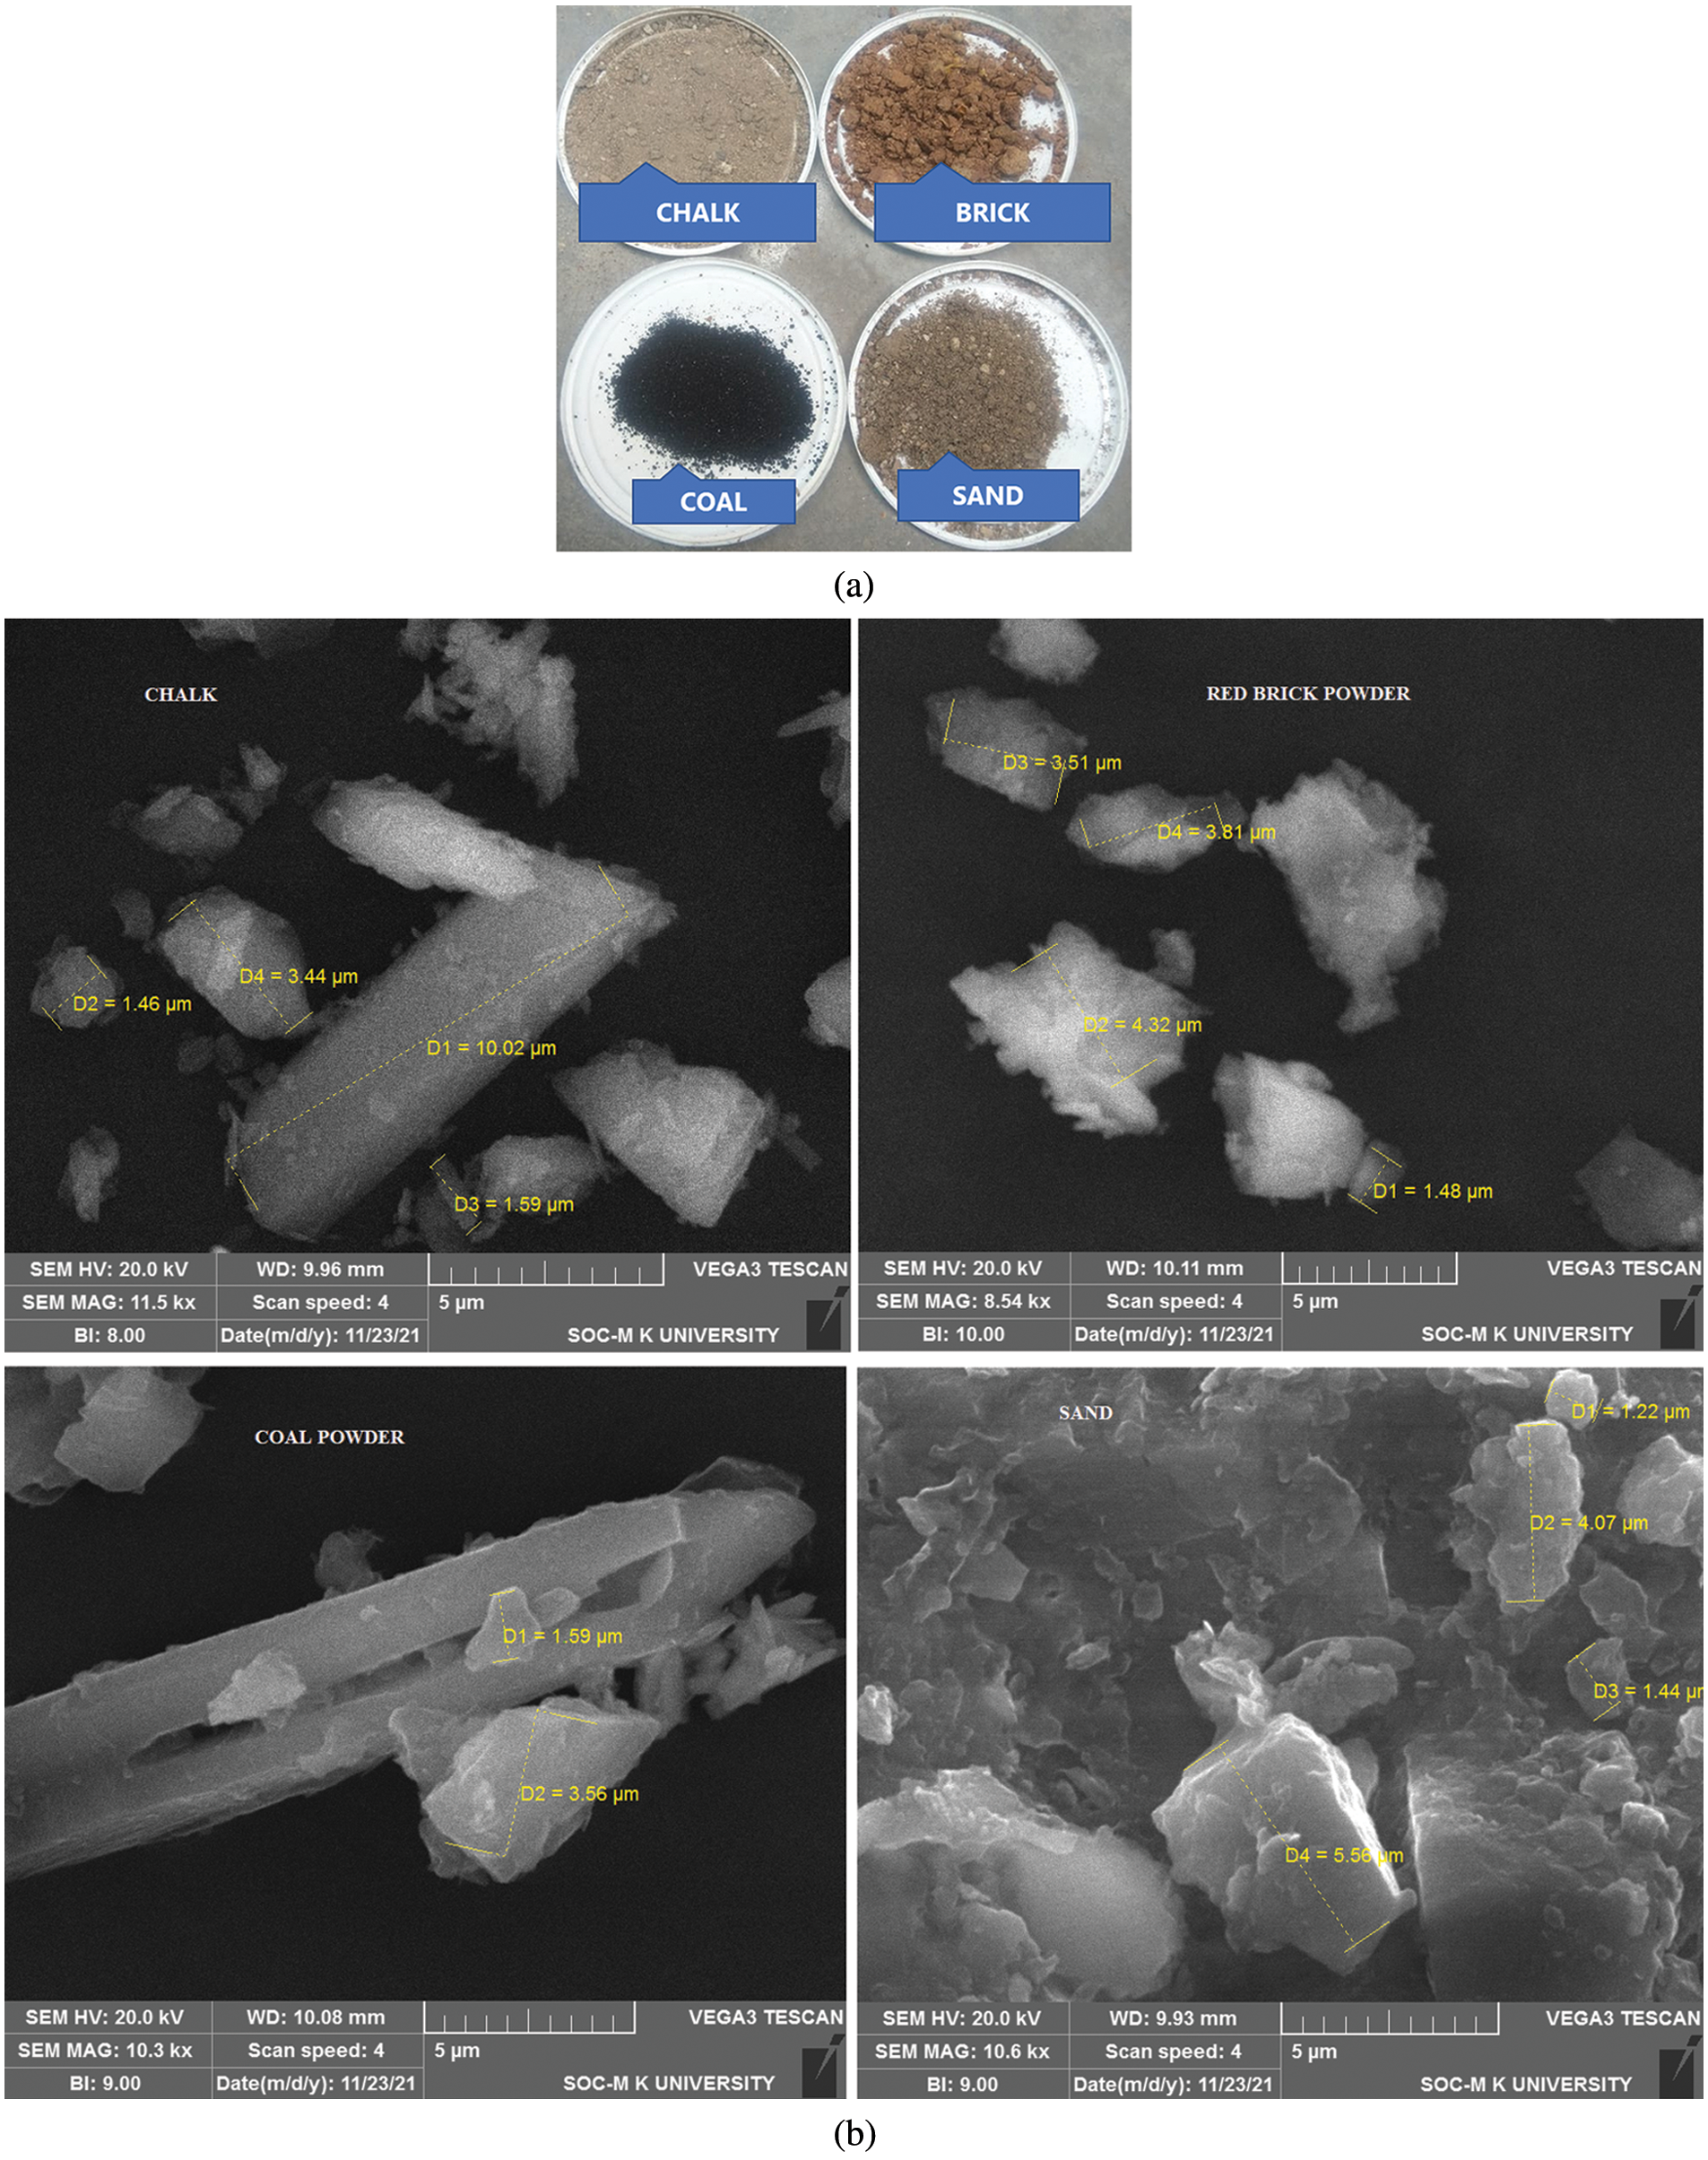
Figure 2: (a) Dust samples for current study (b) SEM images for chalk, red brick powder, coal powder, and sand
2.4 Data Processing and Measurements
For all four dust samples, the experiment is conducted under different solar irradiances on the same solar panel mentioned as B in Fig. 1. At real-time conditions, instantaneous voltage and current are measured for the clean panel and dirty panel mentioned as Labels A and B respectively in Fig. 1. The efficiency of the module is influenced by various factors, including the solar panel’s design, maintenance, temperature, solar irradiance (G), etc., the following equations are used for calculating the efficiency:
where G is the solar irradiance in W/m2, A is the solar panel surface area in m2, Im is solar panel output current in Amps, Vm is solar panel output voltage in Volts, Pm is solar panel output power in Watts. Solar PV module performance efficiency loss ηloss can be calculated by using Eq. (3).
The weight of the glass plate is measured before dust deposition (Mcleaned) and after dust deposition (Msoiled). The glass plate’s area (A) is also measured. The following formula is used to compute the soil gravimetric density (SGD):
Results obtained from the experimental setup are analysis described in this section. The first portion explains the impacts of changes in weather conditions on the performance of the solar panel. In the second section, the impact of temperature and solar irradiance on the performance of solar PV modules is examined. The third and final part deals with the performance analysis of the PV module with dust deposition is explained.
3.1 Variation of Climatic Conditions at the Test Site
The performance of solar photovoltaic systems is affected by the most important environmental factors such as solar irradiance and ambient temperature. Solar irradiance is defined as the amount of energy emitted by the sun per unit area. The amount of solar irradiance varies depending on the weather and the sun’s position in the sky. Because of the variations in the sun’s altitude, the position of the sun varies throughout the day [49]. Figs. 3 and 4 show the daily average solar irradiance at the test site and global solar irradiance profile at the test location for every month respectively. The solar irradiance ranges from 4 to 8 KW/m2/day received at the test site for more than 300 clear sunny days in a year are shown in Figs. 4 and 5. Solar irradiance available throughout the year with the number of days of occurrence is shown in Fig. 5.
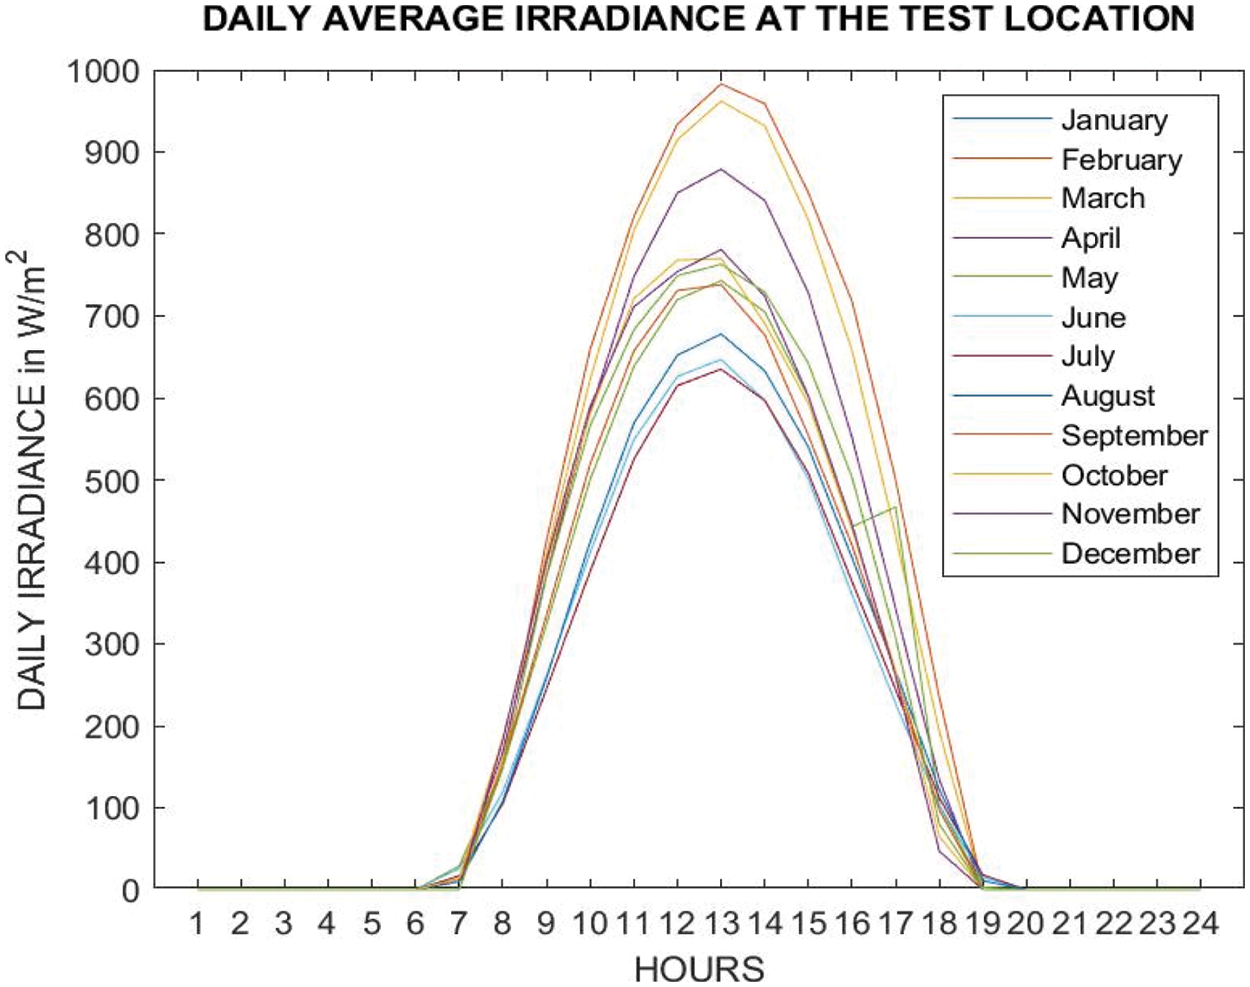
Figure 3: Daily average solar irradiance profile at the test site
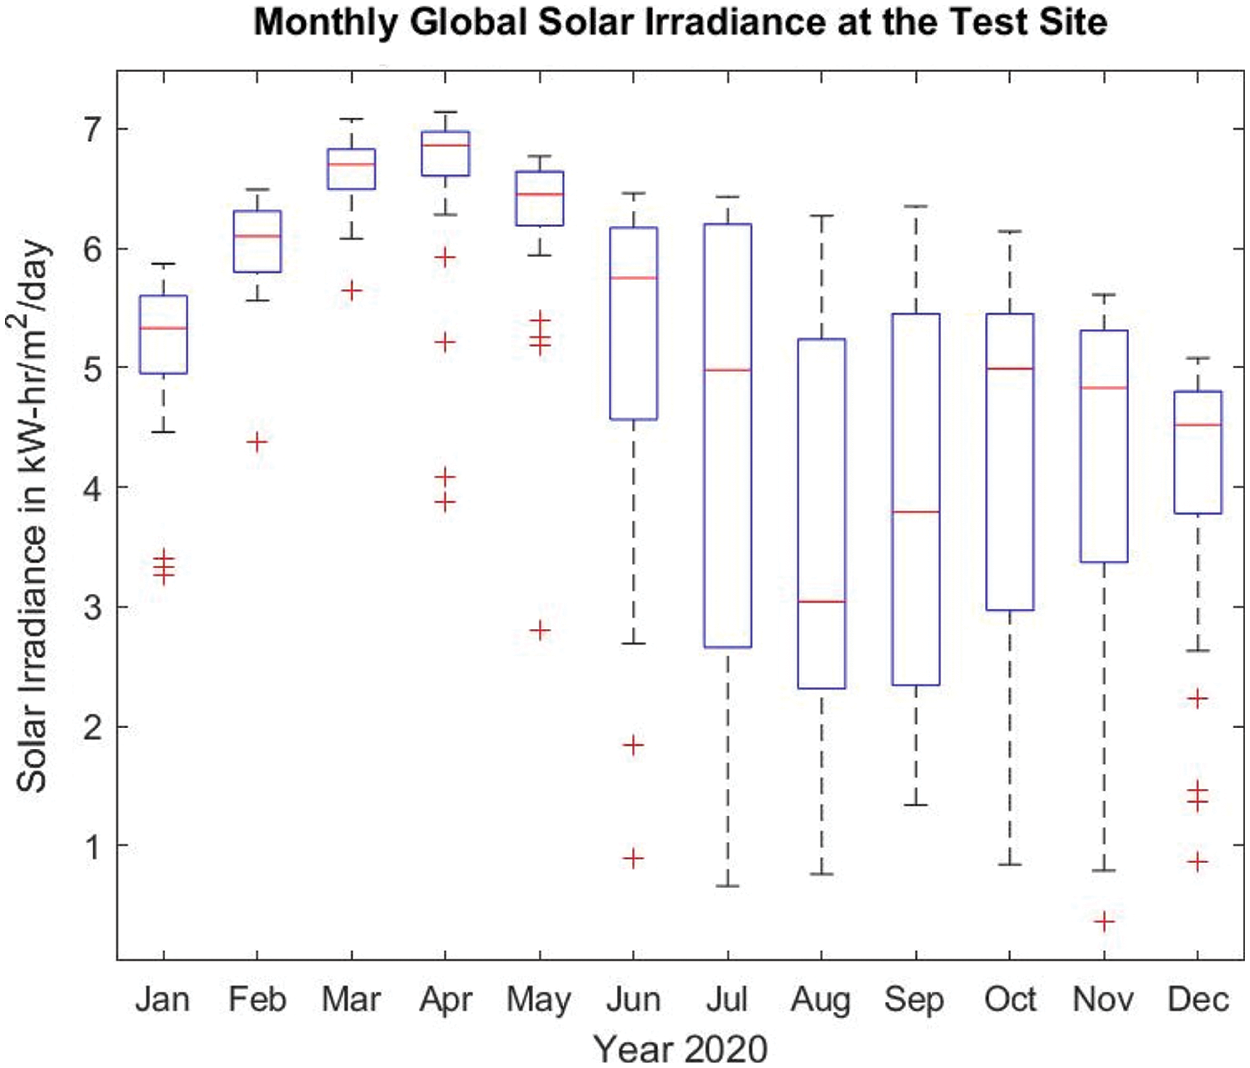
Figure 4: Monthly global solar irradiance profile at the test site

Figure 5: Frequency of solar irradiance available at the test site
Fig. 6 shows the monthly ambient temperature profile, especially in the months of April and May with an average monthly temperature of approximately 28.51°C. Fig. 7 shows the monthly relative humidity at the test location. Relative humidity ranges from humid in the wintertime with means above 78% to dryer summer months with around relative humidity of 55%–60% at the test site.

Figure 6: The ambient temperature profile at test location in month wise

Figure 7: Monthly relative humidity at the test location
3.2 Solar PV Power and Efficiency Loss Due to Solar Irradiance Effect and Temperature Effect
The efficiency losses on the clean and dirty solar PV module owing to irradiance and temperature were examined in this investigation. At various solar irradiances, the influence of solar irradiance and temperature on Pm and efficiency yield is investigated which is tabulated in Tables 4 and 5 respectively. Based on the results obtained, it is noted that the higher the solar irradiance, the higher the Pm and module efficiency for both clean and dirty panel conditions. From the investigation, it is observed that both Pm and ƞ are reduced as the temperature rose for both clean and dirty panel conditions. I–V and P–V curves of clean solar PV panel and dirty solar PV panel under irradiance effect and temperature effect are shown in Figs. 8–11, respectively. From Figs. 12 and 13, it is clear that under clear panel conditions, at solar irradiance G = 1160 W/m2 and solar module temperature Tmod = 30.1°C, the output power Pm = 94.19 W with the efficiency of 10.283%. under dirty condition, Panel “B” generate the output power Pm = 41.14 W at solar irradiance G = 1160 W/m2 and solar module temperature Tmod = 31.1°C. Due to dust accumulation, the solar panel module temperature increase by 2°C to 5°C based on the density of dust accumulation on it. Each degree of temperature rise reduces power by 1.3–1.8 W and efficiency by −0.3 percent.

Figure 8: P–V and I–V characteristics of clean solar panel under solar irradiance effect

Figure 9: I–V and P–V characteristics of dirty solar panel under solar irradiance effect

Figure 10: P–V and I–V characteristics of clean solar panel under temperature effect

Figure 11: P–V and I–V characteristics of dirty solar panel under temperature effect
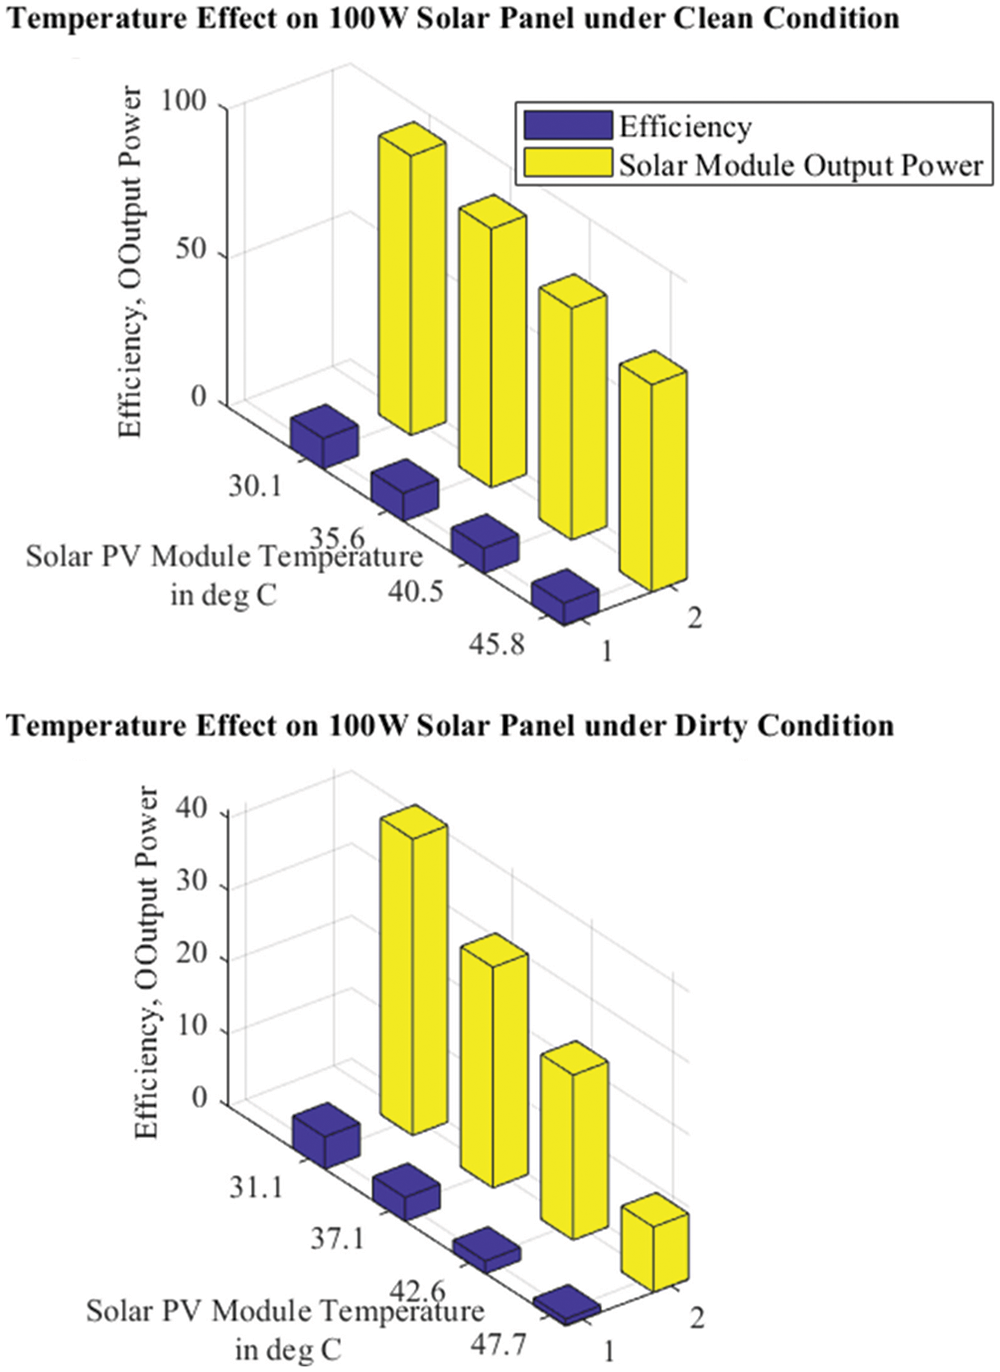
Figure 12: Temperature effect on solar panel

Figure 13: Solar irradiance effect on solar panel


3.3 Impact of Dust on Solar PV Module Performance
The experimental analysis is carried out at four different solar irradiances 220, 525, 702, and 905 W/m2 conditions under clear skies, and the clean solar PV module’s performance is compared with dirty solar panel’s performance under the same solar irradiance and atmospheric condition. Dust of each category is applied on the dirty solar PV module (labeled as “B” in Fig. 1) uniformly using a vibrator. The output voltage and current of the solar PV module are measured three times for the same dust quantity and atmospheric condition and the average values of the output voltage and output current are used for further calculations. The results of a comparative investigation of clean panel and dirty panel under four different dust samples with the various gravimetric density of 13, 26, 39, and 52 g/m2 at four different solar irradiance levels of 220, 525, 702, and 905 W/m2 are summarized in Tables 6–8. Table 6 summarizes the performance of the clean solar PV panel under solar irradiances 220, 525, 702, and 905 W/m2 condition. Table 7 represents the performance of Dirty solar PV panels with various densities of Coal and Sand dust samples under solar irradiances 220, 525, 702, and 905 W/m2 conditions. Table 8 represents the performance of Dirty solar PV panel with various densities of Chalk and Brick dust samples under solar irradiances 220, 525, 702, and 905 W/m2 conditions. In Tables 7 and 8, the efficiency loss ƞloss is calculated by using Eq. (3).


Data summarized in Tables 7 and 8 indicate that under solar irradiance G = 220 W/m2, maximum efficiency loss of 52.30%, 31.93%, 21.02%, and 28.99% occur for 13 g/m2 of different dust samples like coal, sand, chalk, and brick powder applied on solar panel respectively.
Similarly for G = 525 W/m2 condition, maximum efficiency loss of 33.68%, 27.14%, 20.93%, and 23.77% occur for 26 g/m2 of different dust samples like coal, sand, chalk, and brick powder applied on solar panel, respectively. Among all solar irradiance and different dusted conditions, Coal dust samples provide more impact on solar panel efficiency due to their high absorptivity, small particle size, and high bonding density.
Throughout the world, the types of dust or pollution vary. The type and concentration of dust deposition on the solar panel are strongly linked to the location or surrounding environment. Pollutants present in urban and highly populated areas, such as automobile emissions, construction particulates, airborne particles from coal-fired power plants, fertilizer, windblown soil, and plant matter may be found in agricultural areas, whereas sand particles predominate in deserts. From the current investigation, it can observe that even though the same solar irradiance, environmental condition maintains in the solar panel due to the accumulation of different dust affecting the efficiency of the solar panels. Dust cleaning is necessary to improve the efficiency of the solar panel.
Fig. 14 shows the power vs. Density response of different dust conditions on solar PV modules in the current study. Performance efficiency loss of Solar PV panels under different dust conditions brick, chalk, coal, and sand are shown in Figs. 15–18, respectively.

Figure 14: Power vs. density response under different dust samples

Figure 15: Performance efficiency loss of solar panel for the brick dust sample

Figure 16: Performance efficiency loss of solar panel for the chalk dust sample

Figure 17: Performance efficiency loss of solar panel for the coal dust sample

Figure 18: Performance efficiency loss of solar panel for the sand dust sample
The impact of dust deposition is investigated with various solar irradiances of 220, 525, 702, and 905 W/m2 under various densities of dust samples in an outdoor experimental investigation of the 100 W solar PV module performance. The maximum efficiency loss of the solar PV module is found to be 73.51%, 66.29%, 65.46%, and 61.42%, respectively, for coal, sand, brick powder, and chalk dust; thus, coal dust is the most impacting dust sample among the four due to its maximum absorptivity and thus minimum transmissivity. It is also observed that the performance of the solar PV modules degraded when the temperature rose due to heat loss induced by dust accumulation. The ratio of maximum solar PV output power for the dirty module to the clean module is in the range of 26.49% to 90.44% for all dust types tested under different solar irradiances. Dust deposition reduces current output, resulting in a massive loss of electrical power and, as a result, a significant economic loss for photovoltaic electricity in large-scale solar power plants. From the results, it is recommended to choose an appropriate dust cleaning method based on dust sample deposition to improve the efficiency of the solar panel.
Funding Statement: The authors received no specific funding for this study.
Conflicts of Interest: The authors declare that they have no conflicts of interest to report regarding the present study.
1. Kirmani, S., Jamil, M., Akhtar, I. (2018). Economic feasibility of hybrid energy generation with reduced carbon emission. IET Renewable Power Generation, 12(8), 934–942. DOI 10.1049/iet-rpg.2017.0288. [Google Scholar] [CrossRef]
2. Joseph, B., Pogrebnaya, T., Kichonge, B. (2019). Semitransparent building-integrated photovoltaic: Review on energy performance, challenges, and future potential. International Journal of Photoenergy, 2019, 1–17. DOI 10.1155/2019/5214150. [Google Scholar] [CrossRef]
3. Mousa, M., Saeed, A., Amer, F. Z., Mubarak, R. I. (2021). Simulation of optimized high-current tandem solar-cells with efficiency beyond 41%. IEEE Access, 9, 49724–49737. DOI 10.1109/ACCESS.2021.3069281. [Google Scholar] [CrossRef]
4. Cariou, R., Benick, J., Beutel, P., Razek, N., Fl, C. et al. (2017). Monolithic two-terminal III–V//Si triple-junction. IEEE Journal of Photovoltaics, 7(1), 367–373. DOI 10.1109/JPHOTOV.2016.2629840. [Google Scholar] [CrossRef]
5. Baba, M., Makita, K., Mizuno, H., Takato, H., Sugaya, T. et al. (2018). Effect of series resistances on conversion efficiency of GaAs/Si tandem solar cells with areal current-matching technique. IEEE Journal of Photovoltaics, 8(2), 654–660. DOI 10.1109/JPHOTOV.2018.2790700M. [Google Scholar] [CrossRef]
6. Green, M. A., Dunlop, E. D., Levi, D. H., Hohl-Ebinger, J., Yoshita, M. et al. (2019). Solar cell efficiency tables (version 54). Progress in Photovoltaics: Research and Applications, 27(7), 565–575. DOI 10.1002/pip.3171. [Google Scholar] [CrossRef]
7. Houimi, A., Gündo, Y. (2021). Determination of photovoltaic parameters of CIGS hetero junction solar cells produced by PLD technique, using SCAPS simulation program. Vacuum, 192, 1–9. DOI 10.1016/j.vacuum.2021.110451. [Google Scholar] [CrossRef]
8. Abdelaziz, S., Zekry, A., Shaker, A., Abouelatta, M. (2020). Investigating the performance of formamidinium tin-based perovskite solar cell by SCAPS device simulation. Optical Materials, 101, 109738. DOI 10.1016/j.optmat.2020.109738. [Google Scholar] [CrossRef]
9. Kumar, M., Raj, A., Kumar, A., Anshul, A. (2020). An optimized lead-free formamidinium Sn-based perovskite solar cell design for high power conversion efficiency by SCAPS simulation. Optical Materials, 108, 110213. DOI 10.1016/j.optmat.2020.110213. [Google Scholar] [CrossRef]
10. Abdelaziz, W., Zekry, A., Shaker, A., Abouelatta, M. (2020). Numerical study of organic graded bulk heterojunction solar cell using SCAPS simulation. Solar Energy, 211, 375–382. DOI 10.1016/j.solener.2020.09.068. [Google Scholar] [CrossRef]
11. Sahli, F., Kamino, B. A., Werner, J., Bräuninger, M., Paviet-Salomon, B. et al. (2018). Improved optics in monolithic perovskite/Silicon tandem solar cells with a nanocrystalline silicon recombination junction. Advanced Energy Materials, 8(6), 1–8. DOI 10.1002/aenm.201701609. [Google Scholar] [CrossRef]
12. Wu, Y., Yan, D., Peng, J., Duong, T., Wan, Y. et al. (2017). Monolithic perovskite/silicon-homojunction tandem solar cell with over 22% efficiency. Energy and Environmental Science, 10(11), 2472–2479. DOI 10.1039/c7ee02288c. [Google Scholar] [CrossRef]
13. Bush, K. A., Palmstrom, A. F., Yu, Z. J., Boccard, M., Cheacharoen, R. et al. (2017). 23.6%–Efficient monolithic perovskite/Silicon tandem solar cells with improved stability. Nature Energy, 2(4), 1–7. DOI 10.1038/nenergy.2017.9. [Google Scholar] [CrossRef]
14. Zhou, B., Yin, X., Zhang, J., Zeng, G., Li, B. et al. (2020). Numerical simulation of an innovative high efficiency solar cell with CdTe/Si composite absorption layer. Optical Materials, 110, 110505. DOI 10.1016/j.optmat.2020.110505. [Google Scholar] [CrossRef]
15. Lappalainen, K., Valkealahti, S. (2017). Photovoltaic mismatch losses caused by moving clouds. Solar Energy, 158, 455–461. DOI 10.1016/j.solener.2017.10.001. [Google Scholar] [CrossRef]
16. Cheng, T., Al-Soeidat, M., Lu, D. D., Agelidis, V. G. (2019). Experimental study of PV strings affected by cracks. The Journal of Engineering, 2019(18), 5124–5128. DOI 10.1049/joe.2018.9320. [Google Scholar] [CrossRef]
17. Dabra, V., Paliwal, K. K., Sharma, P., Kumar, N. (2017). Optimization of photovoltaic power system: A comparative study. Protection and Control of Modern Power Systems, 2(1), 1–11. DOI 10.1186/s41601-017-0036-2. [Google Scholar] [CrossRef]
18. Bhukya, M. N., Kota, V. R. (2019). A quick and effective MPPT scheme for solar power generation during dynamic weather and partial shaded conditions. Engineering Science and Technology, an International Journal, 22(3), 869–884. DOI 10.1016/j.jestch.2019.01.015. [Google Scholar] [CrossRef]
19. Srikumar, K., Saibabu, C. (2020). A system and novel methodology to track maximum power from photo voltaic system: A comparative and experimental analysis. Journal of King Saud University–Engineering Sciences, 32(7), 442–458. DOI 10.1016/j.jksues.2018.02.006. [Google Scholar] [CrossRef]
20. Shabaan, S., Abu El-Sebah, M. I., Bekhit, P. (2018). Maximum power point tracking for photovoltaic solar pump based on ANFIS tuning system. Journal of Electrical Systems and Information Technology, 5(1), 11–22. DOI 10.1016/j.jesit.2018.02.002. [Google Scholar] [CrossRef]
21. Aquib, M., Jain, S., Agarwal, V. (2020). A time-based global maximum power point tracking technique for PV system. IEEE Transactions on Power Electronics, 35(1), 393–402. DOI 10.1109/TPEL.2019.2915774. [Google Scholar] [CrossRef]
22. Al-Majidi, S. D., Abbod, M. F., Al-Raweshidy, H. S. (2018). A novel maximum power point tracking technique based on fuzzy logic for photovoltaic systems. International Journal of Hydrogen Energy, 43(31), 14158–14171. DOI 10.1016/j.ijhydene.2018.06.002. [Google Scholar] [CrossRef]
23. Husain, M. A., Tariq, A., Hameed, S., Arif, M. S. B., Jain, A. (2017). Comparative assessment of maximum power point tracking procedures for photovoltaic systems. Green Energy and Environment, 2(1), 5–17. DOI 10.1016/j.gee.2016.11.001. [Google Scholar] [CrossRef]
24. Ebrahim, M. A., Osama, A., Kotb, K. M., Bendary, F. (2019). Whale inspired algorithm based MPPT controllers for grid-connected solar photovoltaic system. Energy Procedia, 162, 77–86. DOI 10.1016/j.egypro.2019.04.009. [Google Scholar] [CrossRef]
25. Shanks, K., Ferrer-Rodriguez, J. P., Fernàndez, E. F., Almonacid, F., Pérez-Higueras, P. et al. (2018). A >3000 suns high concentrator photovoltaic design based on multiple fresnel lens primaries focusing to one central solar cell. Solar Energy, 169, 457–467. DOI 10.1016/j.solener.2018.05.016. [Google Scholar] [CrossRef]
26. Hoffmann, F. M., Molz, R. F., Kothe, J. V., Nara, E. O. B., Tedesco, L. P. C. (2018). Monthly profile analysis based on a two-axis solar tracker proposal for photovoltaic panels. Renewable Energy, 115, 750–759. DOI 10.1016/j.renene.2017.08.079. [Google Scholar] [CrossRef]
27. Aziz, S., Hassan, S. (2017). On improving the efficiency of a solar panel tracking system. Procedia Manufacturing, 7, 218–224. DOI 10.1016/j.promfg.2016.12.053. [Google Scholar] [CrossRef]
28. Ben Othman, A., Belkilani, K., Besbes, M. (2018). Global solar radiation on tilted surfaces in Tunisia: Measurement, estimation and gained energy assessments. Energy Reports, 4, 101–109. DOI 10.1016/j.egyr.2017.10.003. [Google Scholar] [CrossRef]
29. Nfaoui, M., El-Hami, K. (2018). Extracting the maximum energy from solar panels. Energy Reports, 4, 536–545. DOI 10.1016/j.egyr.2018.05.002. [Google Scholar] [CrossRef]
30. Ghassoul, M. (2018). Single axis automatic tracking system based on PILOT scheme to control the solar panel to optimize solar energy extraction. Energy Reports, 4, 520–527. DOI 10.1016/j.egyr.2018.07.001. [Google Scholar] [CrossRef]
31. Khanna, S., Reddy, K. S., Mallick, T. K. (2018). Optimization of solar photovoltaic system integrated with phase change material. Solar Energy, 163, 591–599. DOI 10.1016/j.solener.2018.01.002. [Google Scholar] [CrossRef]
32. Idoko, L., Anaya-Lara, O., McDonald, A. (2018). Enhancing PV modules efficiency and power output using multi-concept cooling technique. Energy Reports, 4, 357–369. DOI 10.1016/j.egyr.2018.05.004. [Google Scholar] [CrossRef]
33. Popovici, C. G., Hudişteanu, S. V., Mateescu, T. D., Cherecheş, N. C. (2016). Efficiency improvement of photovoltaic panels by using Air cooled heat sinks. Energy Procedia, 85, 425–432. DOI 10.1016/j.egypro.2015.12.223. [Google Scholar] [CrossRef]
34. Soliman, A. M. A., Hassan, H., Ookawara, S. (2019). An experimental study of the performance of the solar cell with heat sink cooling system. Energy Procedia, 162, 127–135. DOI 10.1016/j.egypro.2019.04.014. [Google Scholar] [CrossRef]
35. Arabatzis, I., Todorova, N., Fasaki, I., Tsesmeli, C., Peppas, A. et al. (2018). Photocatalytic, self-cleaning, antireflective coating for photovoltaic panels: Characterization and monitoring in real conditions. Solar Energy, 159(11), 251–259. DOI 10.1016/j.solener.2017.10.088. [Google Scholar] [CrossRef]
36. Lee, Y., Gong, D., Balaji, N., Lee, Y. J., Yi, J. (2012). Stability of SINx/SINx double stack antireflection coating for single crystalline silicon solar cells. Nanoscale Research Letters, 7, 2–7. DOI 10.1186/1556-276X-7-50. [Google Scholar] [CrossRef]
37. Jalaly, S., Vahdani, M., Shahabadi, M., Mohamad Sadeghi, G. M. (2019). Design, fabrication, and measurement of a polymer-based anti-reflection coating for improved performance of a solar panel under a specific incident angle. Solar Energy Materials and Solar Cells, 189, 175–180. DOI 10.1016/j.solmat.2018.10.001. [Google Scholar] [CrossRef]
38. Rajvikram, M., Leoponraj, S. (2018). A method to attain power optimality and efficiency in solar panel. Beni-Suef University Journal of Basic and Applied Sciences, 7(4), 705–708. DOI 10.1016/j.bjbas.2018.08.004. [Google Scholar] [CrossRef]
39. Jamali, M. I., Bhutto, G. M., Saand, A. S., Koondhar, M. A. (2020). Dust deposition effect on solar photovoltaic modules performance: A review. Journal of Applied and Emerging Sciences, 10, 117–125. DOI 10.36785/buitems.jaes.407. [Google Scholar] [CrossRef]
40. Paudyal, B. R., Shakya, S. R. (2016). Dust accumulation effects on efficiency of solar PV modules for off grid purpose: A case study of Kathmandu. Solar Energy, 135, 103–110. DOI 10.1016/j.solener.2016.05.046. [Google Scholar] [CrossRef]
41. Tanesab, J., Parlevliet, D., Whale, J., Urmee, T. (2019). The effect of dust with different morphologies on the performance degradation of photovoltaic modules. Sustainable Energy Technologies and Assessments, 31, 347–354. DOI 10.1016/j.seta.2018.12.024. [Google Scholar] [CrossRef]
42. Pan, A., Lu, H., Zhang, L. Z. (2019). Experimental investigation of dust deposition reduction on solar cell covering glass by different self-cleaning coatings. Energy, 181, 645–653. DOI 10.1016/j.energy.2019.05.223. [Google Scholar] [CrossRef]
43. Caron, J. R., Littmann, B. (2013). Direct monitoring of energy lost due to soiling on first solar modules in california. IEEE Journal of Photovoltaics, 3(1), 336–340. DOI 10.1109/JPHOTOV.2012.2216859. [Google Scholar] [CrossRef]
44. Ilse, K., Figgis, B., Khan, M. Z., Naumann, V., Hagendorf, C. (2019). Dew as a detrimental influencing factor for soiling of PV modules. IEEE Journal of Photovoltaics, 9(1), 287–294. DOI 10.1109/JPHOTOV.2018.2882649. [Google Scholar] [CrossRef]
45. Rao, A., Pillai, R., Mani, M., Ramamurthy, P. (2014). Influence of dust deposition on photovoltaic panel performance. Energy Procedia, 54, 690–700. DOI 10.1016/j.egypro.2014.07.310. [Google Scholar] [CrossRef]
46. Ilse, K. K., Rabanal, J., Schönleber, L., Khan, M. Z., Naumann, V. et al. (2018). Comparing indoor and outdoor soiling experiments for different glass coatings and microstructural analysis of particle caking processes. IEEE Journal of Photovoltaics, 8(1), 203–209. DOI 10.1109/JPHOTOV.2017.2775439. [Google Scholar] [CrossRef]
47. Adouane, M., Al-Qattan, A., Alabdulrazzaq, B., Fakhraldeen, A. (2020). Comparative performance evaluation of different photovoltaic modules technologies under Kuwait harsh climatic conditions. Energy Reports, 6, 2689–2696. DOI 10.1016/j.egyr.2020.09.034. [Google Scholar] [CrossRef]
48. Ali, H. M., Zafar, M. A., Bashir, M. A., Nasir, M. A., Ali, M. et al. (2017). Effect of dust deposition on the performance of photovoltaic modules of Taxila, Pakistan. Thermal Science, 21(2), 915–923. DOI 10.2298/TSCI140515046A. [Google Scholar] [CrossRef]
49. Fouad, M. M., Shihata, L. A., Morgan, E. I. (2017). An integrated review of factors in fl uencing the performance of photovoltaic panels. Renewable and Sustainable Energy Reviews, 80, 1499–1511. DOI 10.1016/j.rser.2017.05.141. [Google Scholar] [CrossRef]
 | This work is licensed under a Creative Commons Attribution 4.0 International License, which permits unrestricted use, distribution, and reproduction in any medium, provided the original work is properly cited. |