| Journal of Renewable Materials |
DOI: 10.32604/jrm.2022.019793
ARTICLE
Synthesis and Characterization of Hydrogels Based on Potato Starch/Poly(vinyl Alcohol)/N,N′-Methylenebisacrylamide
Faculty of Chemistry and Chemical Engineering, National University of San Marcos, Lima, 15081, Peru
*Corresponding Author: Diego David Pinzón-Moreno. Email: diegodpinzon@gmail.com
Received: 15 October 2021; Accepted: 19 November 2021
Abstract: Several hydrogels were synthesized by free-radical polymerization in an aqueous medium based on potato starch (PS), poly(vinyl alcohol) (PVA), and N,N′-Methylenebisacrylamide (MBAm), being possible to study these hydrogels as a function of the proportion of components incorporated. In this way, the products generated from the synthesis were characterized by swelling and deswelling kinetics, the first swelling being verified with Schott and statistical models, allowing to contrast the proximity between the experimental and theoretical behavior. Additionally, water retention in soil (R%), spectroscopy (FTIR), morphological (SEM), and thermal (TGA and DSC) analysis allowing to know the intrinsic characteristics of the material, increasing in general terms the knowledge of this type of material. In this context, it was possible to verify the characteristics and effectiveness of the synthesis and crosslinking of the main components. The experimental results obtained show that the synthesized hydrogels present representative swellings consistent with kinetic and statistical models, optimal thermal stability depending on the amount of crosslinker, and excellent water retention in environments such as soil, presenting it as an excellent alternative to be used in agro-industrial applications in an eco-friendly way.
Keywords: Hydrogel; potato starch; polyvinyl alcohol; N,N′-Methylenebisacrylamide; kinetic swelling and deswelling; water retention; thermal characterization; morphology characterization
In recent years, hydrogels have been presented as a highly innovative material used for many practical purposes due to their well-known hydrophilic qualities. This hydrophilic capacity allows the retention and storage of liquids of different kinds, providing options that no other previously studied material had been able to offer. Currently, different types of hydrogels that have allowed their use in areas such as medicine, pharmacy, electronics, agriculture, purification, separation, and segregation of substances, applied biotechnology, among other areas of innovation and development, reasons for which their research related to the properties and applications still on a rise [1–5].
In this sense, PVA arouses interest in biotechnological areas due to its properties and characteristics such as its low degree of toxicity, biocompatibility, stability, economy, and can also be produced via non-petroleum routes; reasons for which the development of hydrogels based on PVA is attractive for noble purposes. In addition, another essential characteristic of this material is in the development of new materials such as composites, since PVA as a matrix favors the dispersity of colloids [6], allowing cost/benefit balances more in line with specific needs and friendly to the environment. The literature records various works on PVA-based hydrogels in conjunction with several types of natural or synthetic aggregates that allow obtaining materials with high development and application potential [1–2,7–10].
The use of aggregates of the natural origin (cellulose, saccharide, starch, etc.) have broad advantages because they are easy to acquire in multiple agro-industries, are environmentally friendly, are cheap, and allow optimization of some properties of polymer blends and hydrogels [11]. Among these renewable sources, starches are presented as a source of food and biomass present throughout the world and constant production during practically the entire period of the year [12]. These types of carbohydrates are found in significant amounts in many cereals, tubers, and roots kinds and are relatively easy to obtain [12–14].
Starch is constituted of two defined fractions, amylose and amylopectin, the latter being insoluble in water and with higher proportions in starch. This proportion varies according to the botanical source and its conditions [12,15], however, starch is mainly made up of amylose (20%–30%) and amylopectin (70%–80%) [16]. Among the main properties of interest of starch in the field of absorbent materials is the capacity for gelling/gelatinization, porosity, reversible absorption, swelling, and non-toxicity, attractive characteristics when formulating hydrogels of different types [13,16–20].
On the other hand, an alternative for the development of chemically stable hydrogels is found in the integration of reagents known as crosslinking agents that, through their action, allow the union of different polymeric chains, generating a porosity that in turn allows the retention of water, liquids or chemicals solutions. A crosslinker with a high potential for the development of hydrogels is MBAm, which has two reactive sites with the potential to interact with different polymer chains [1–5].
In this context, this work presents a complete study related to the synthesis and characterization of hydrogels based on PS, PVA, and MBAm as a crosslinking agent allowing the obtaining of absorbent materials. The characterization of the hydrogels was carried out employing experimental and theoretical analysis of the swelling kinetics, statistical study of the swelling performance, spectroscopic analysis of FTIR, morphological characterization utilizing SEM, and thermal analysis of the polymer through DSC and TGA, these characterizations allowed to determine fundamental properties for the best application of this kind of polymer.
Potato starch (PS) was obtained from HiMedia Laboratories, LLC, poly(vinyl alcohol) (PVA) from KHBoddin GmbH, the N,N′-Methylenebisacrylamide (MBAm), and Potassium persulfate (KPS) was purchase from Central Drug House (P) Ltd-CDH. All materials were of analytical grade and used without further purification. On the other hand, distilled water was used for the hydrogel preparation and swelling measurements.
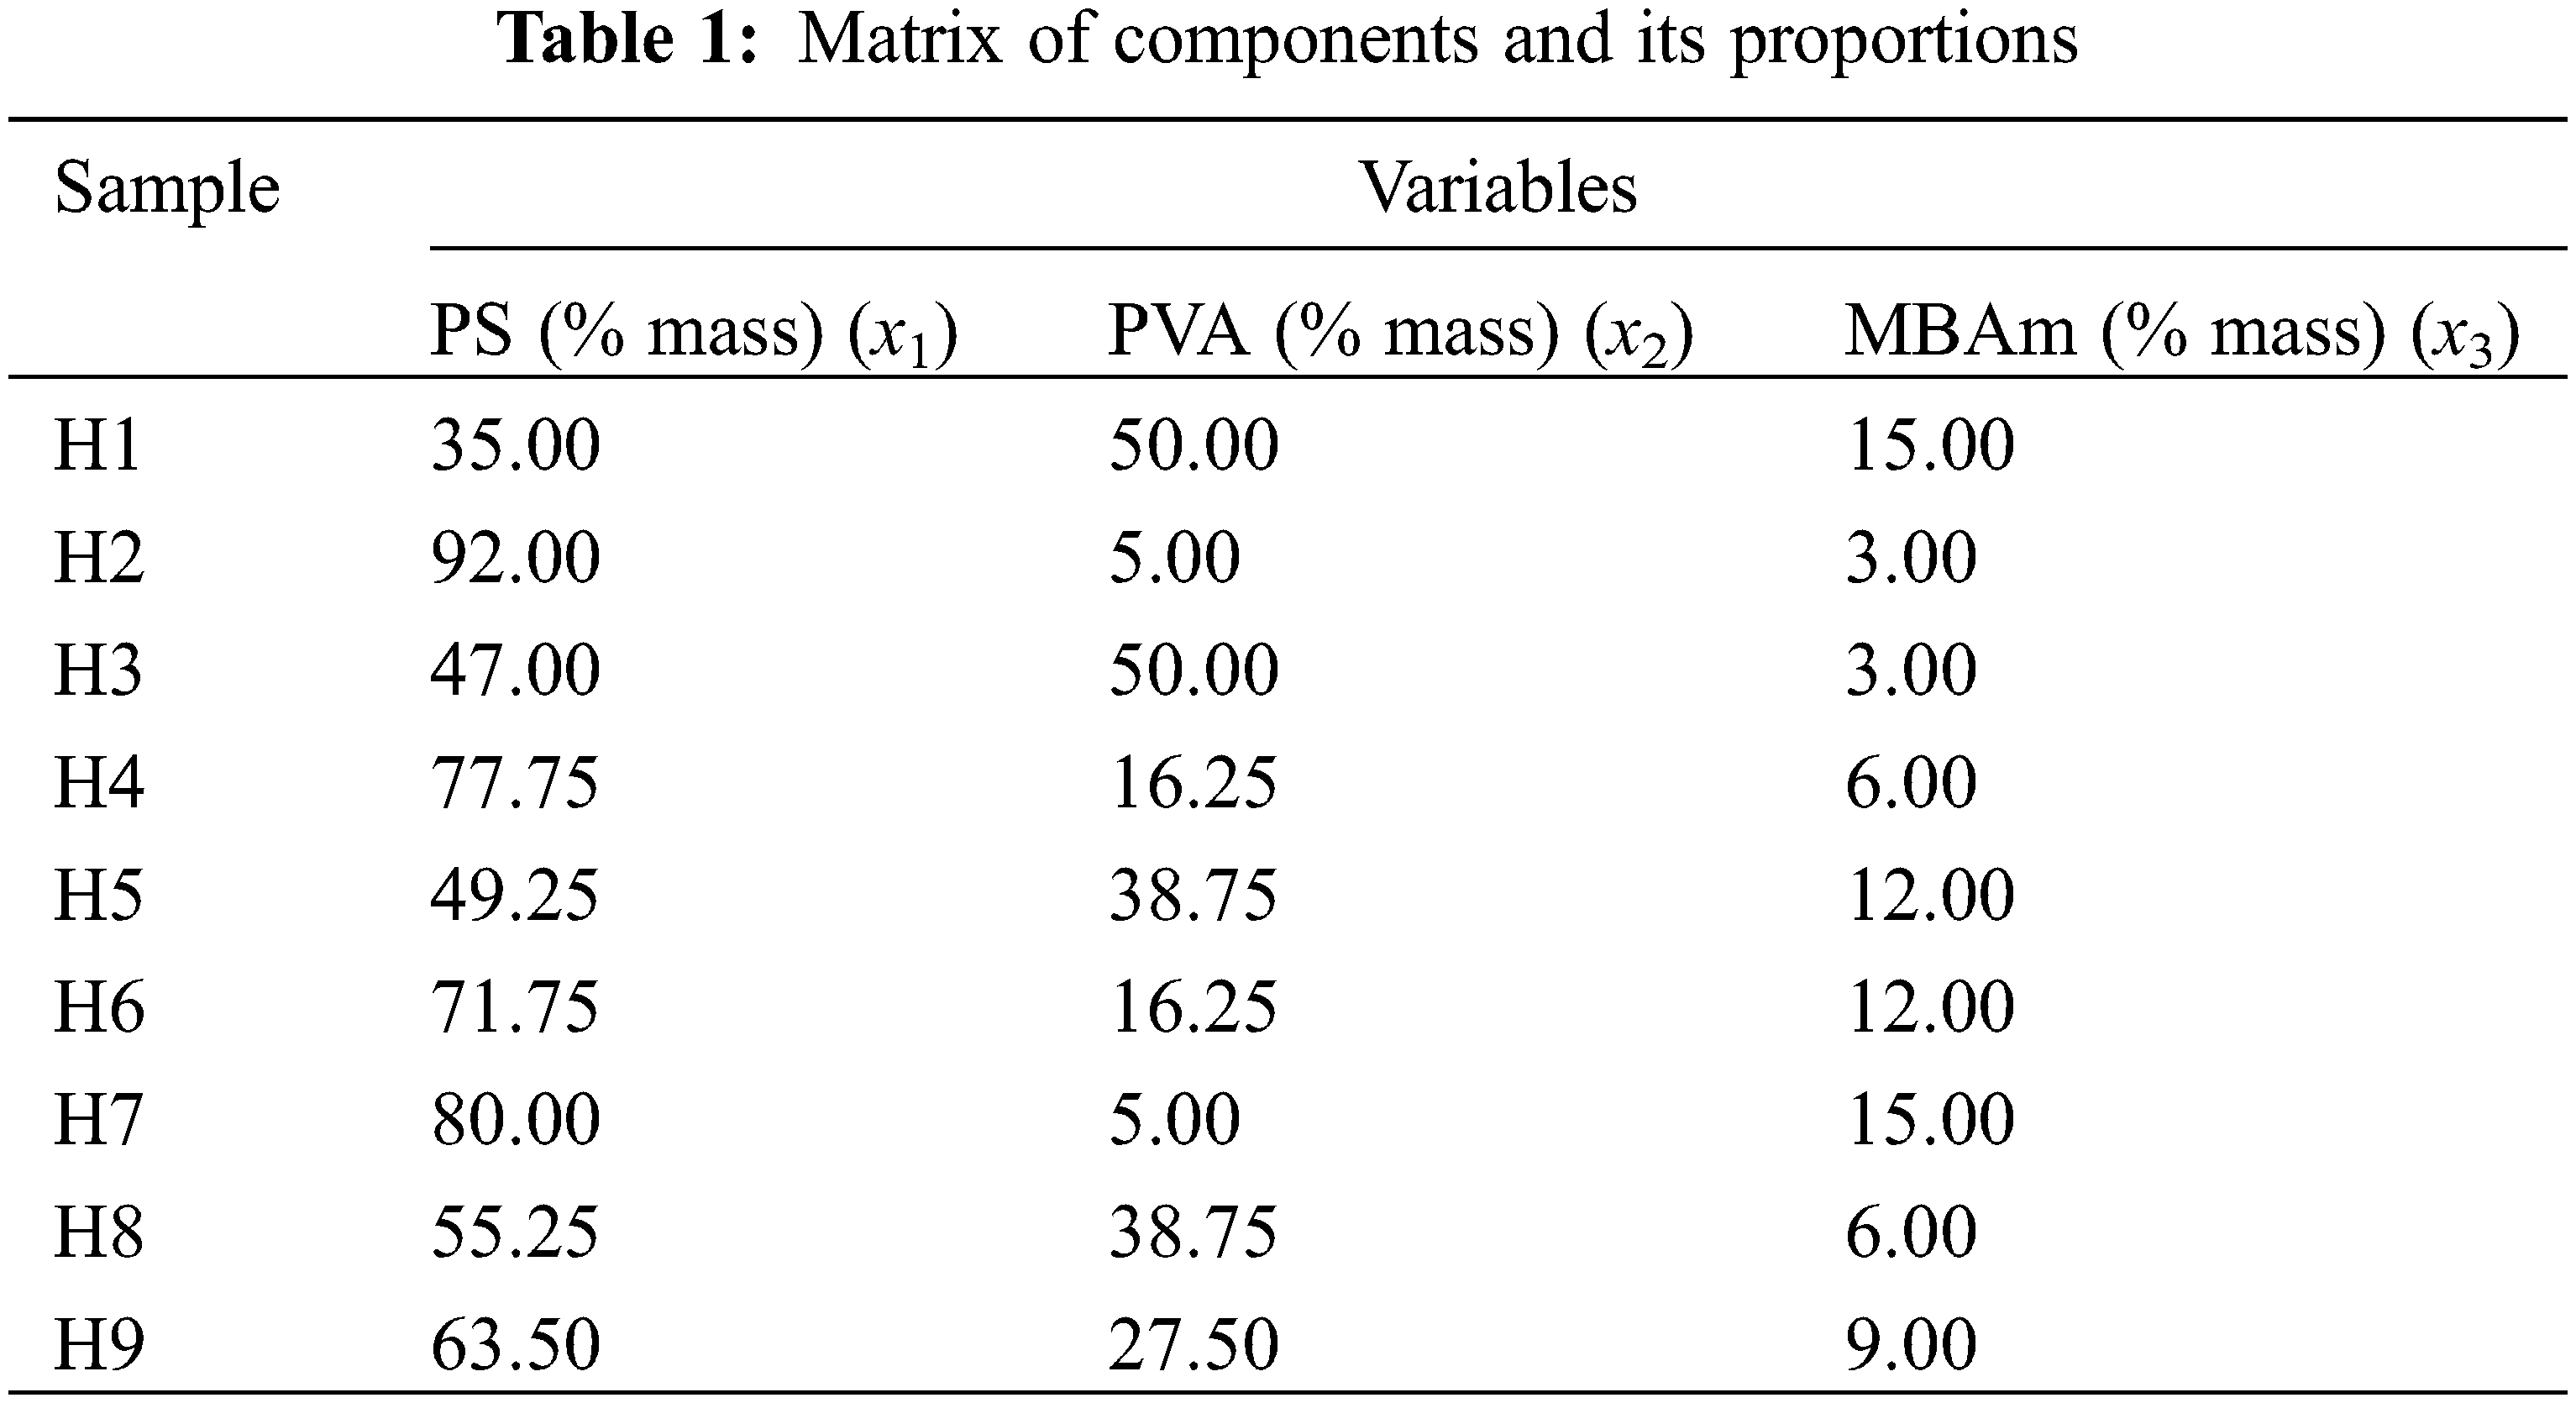
The amounts of reagents mentioned in Table 1 were pre-diluted in 40 ml of distilled water; likewise, 1.5 g of KPS was diluted in the same amount of water for all the syntheses. The solutions were incorporated into a continuous stirred-tank reactor (CSTR) operated in mode batch with a capacity of 500 ml, with temperature, stirring, and atmosphere controlled, keeping the conditions of 70°C, 700 rpm, and nitrogen gas (N2) atmosphere constant throughout the reaction, respectively. The order of adding the solutions to the reactor started with the PS solution followed by the PVA, KPS and ending with the MBAm. Furthermore, the reagent addition was performed with equal time spans of 15 min and the synthesis time lasted 3 h from the last addition of the MBAm solution. After this period the product was removed from the reactor, washed in a 50/50 solution of ethanol/distilled water, dried, ground, and sieved.
Cyclic swelling and deswelling kinetic curves were obtained by periodically measuring the masses of the hydrogel immersed in water using the tea bag methodology at room temperature and subsequently calculated employing Eq. (1).
where md and ms represent the weights of the dried hydrogel and the hydrogel swelling to a defined time, respectively. Once the different kinetic curves were obtained, such data was verified and compared utilizing pseudo-second-order swelling kinetics mathematical model, obtaining theoretical swelling parameters.
Based on the swelling results, the influence of the components in the synthesized hydrogel was analyzed. To this goal the study of the statistical relevance of components was continued, where ternary diagrams were constructed as a function of the components of PS, PVA, and MBAm as a function of equilibrium swelling in response, determining interesting regions for the production of this kind of hydrogel.
Later, three hydrogels with the best performance concerning swelling were selected (ref.: H1, H3, and H5) to be tested in terms of water retention in a soil and hydrogel system. For the development of this retention test, the soil was dried until the constant mass at 40°C and the hydrogel was swollen until equilibrium for 48 h, the water user with the characteristics listed in Table 2. Then, the previously filtered swollen hydrogels were incorporated into a cultivable soil from Jayllihuaya region, the Puno city-Peru, whose characteristics of said soil can be observed in Table 3, and the arrangement used for the evaluation of said water retention test can be seen in Fig. 1. Finally, an excess of water was incorporated until the beginning of the dripping of the container, guaranteeing the saturation of the entire system (soil/hydrogel), at which time the mass of the system was recorded throughout the drying period, carried out under constant conditions at 40°C until reaching a constant mass. Soil water retention (R) was evaluated by Eq. (2), where Mr represents the mass recorded periodically until a stable mass is obtained and Mw is the absorbance sample of saturated water and soil.
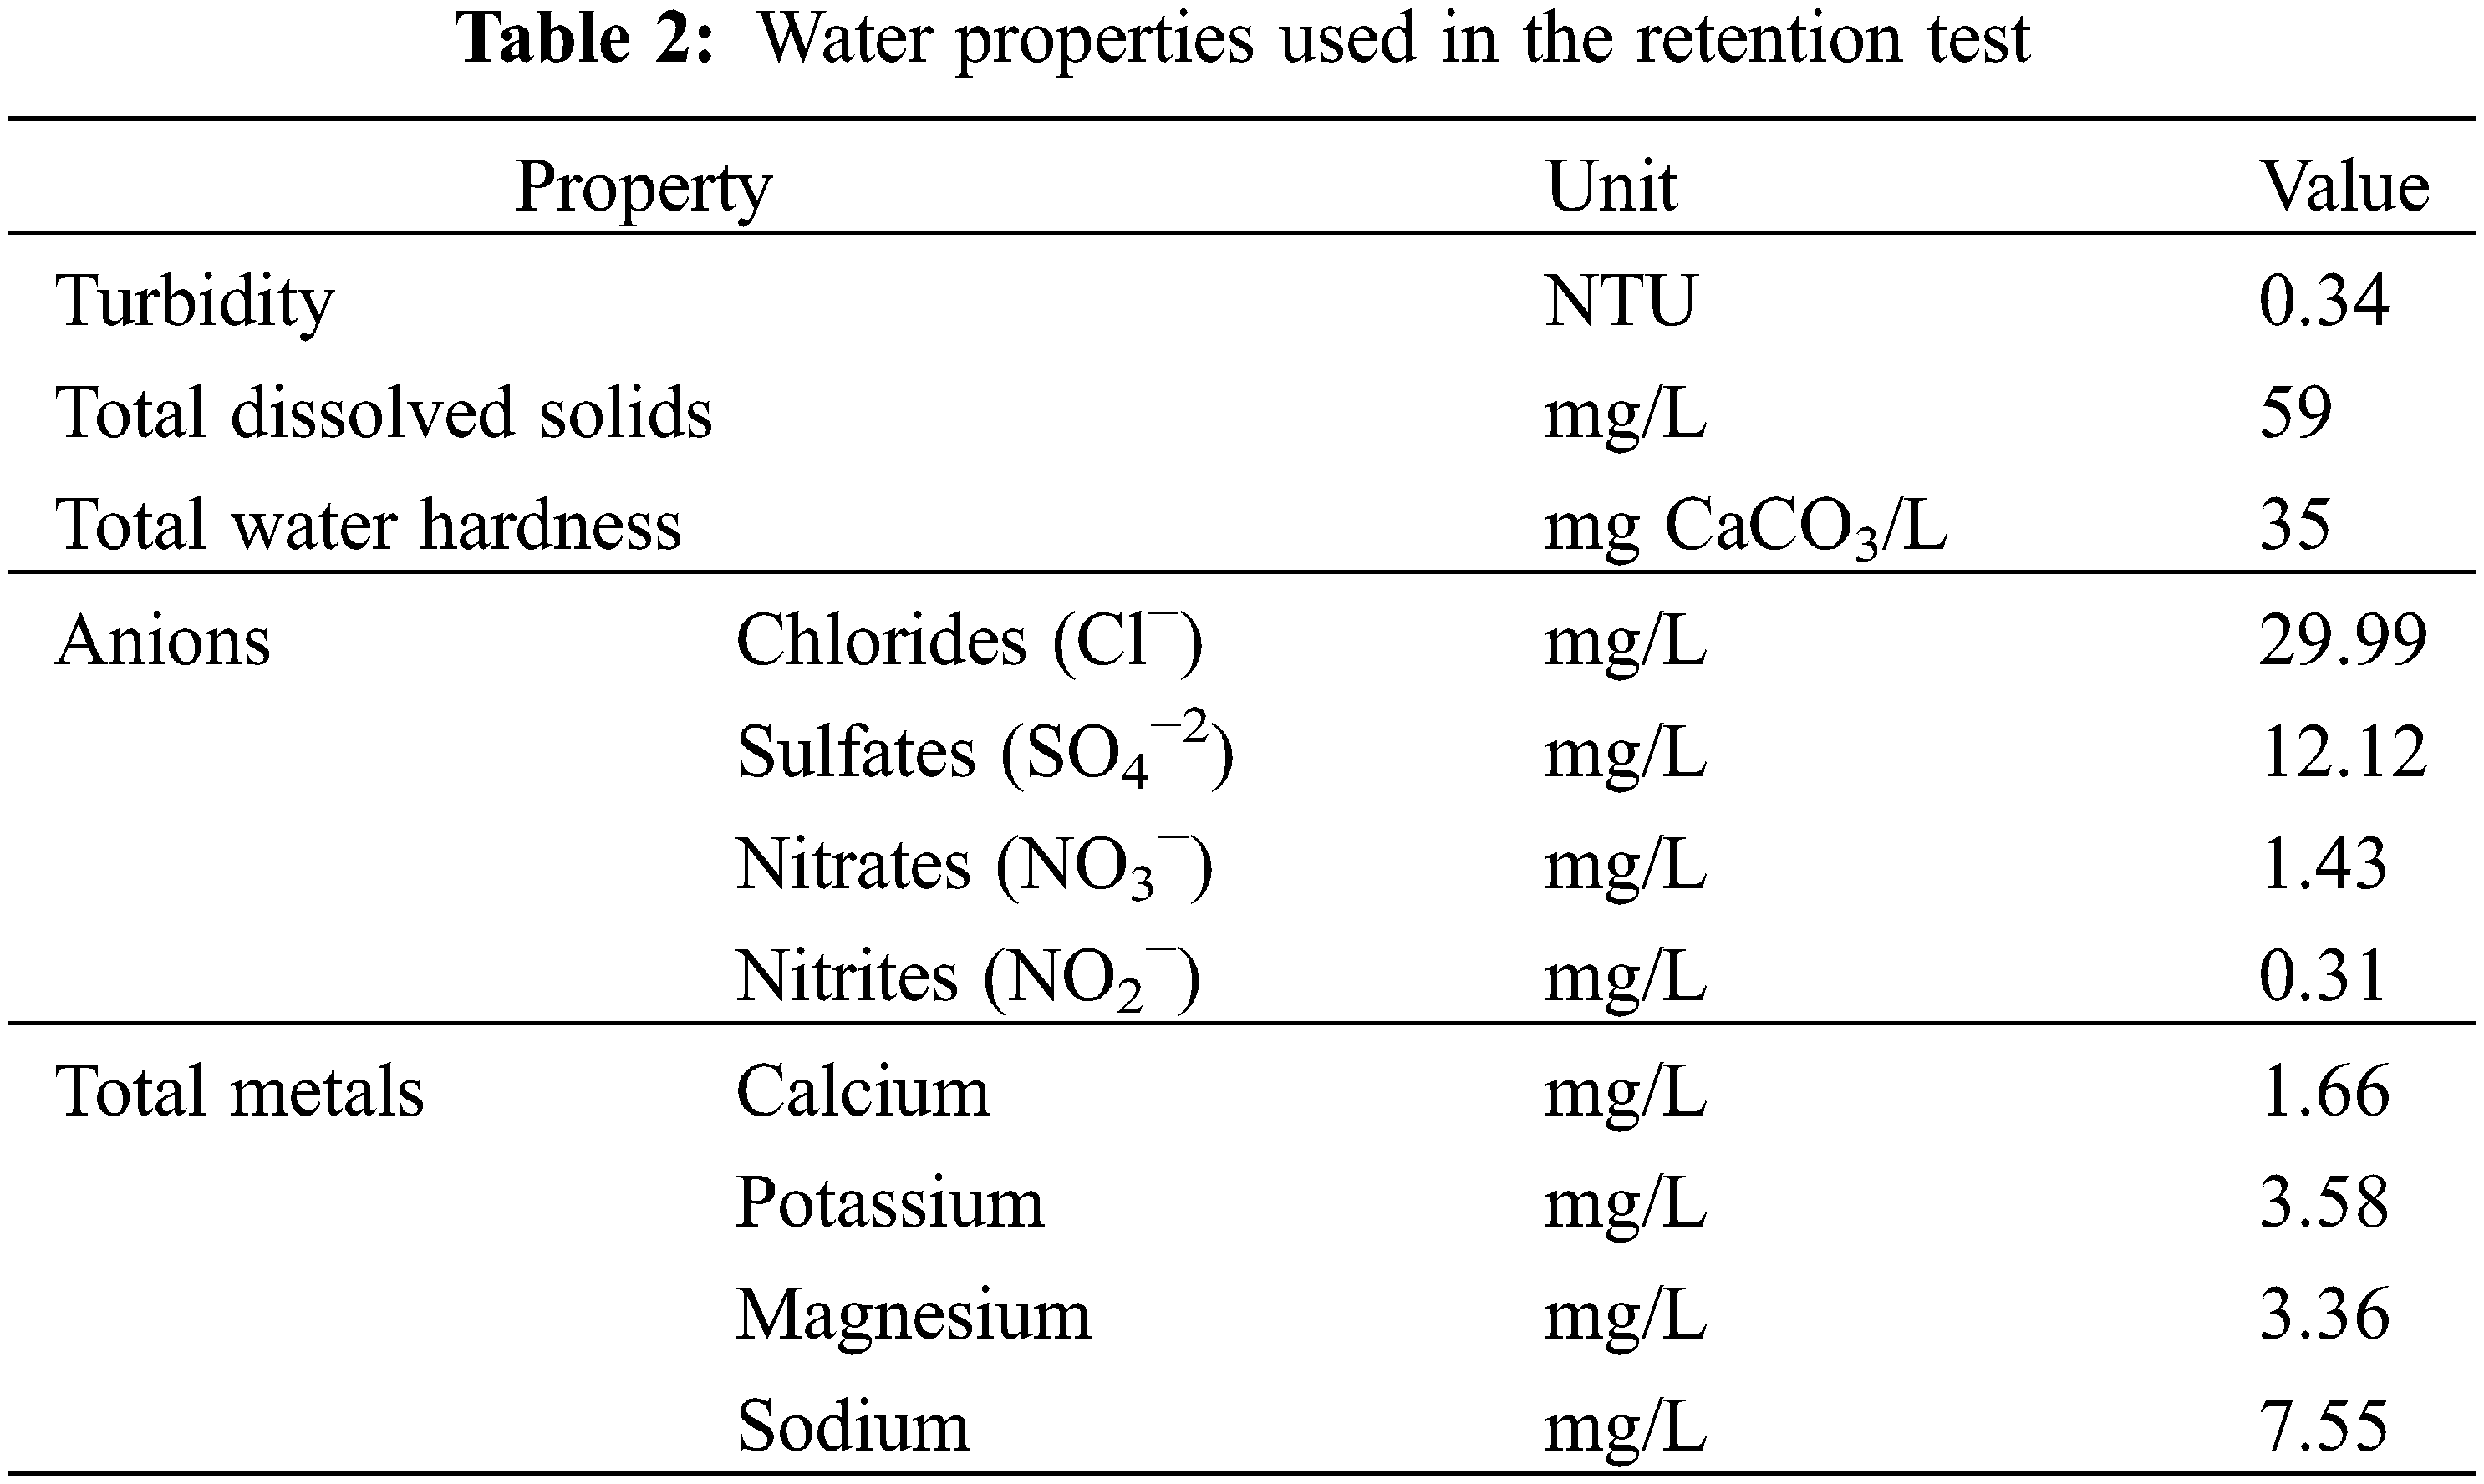
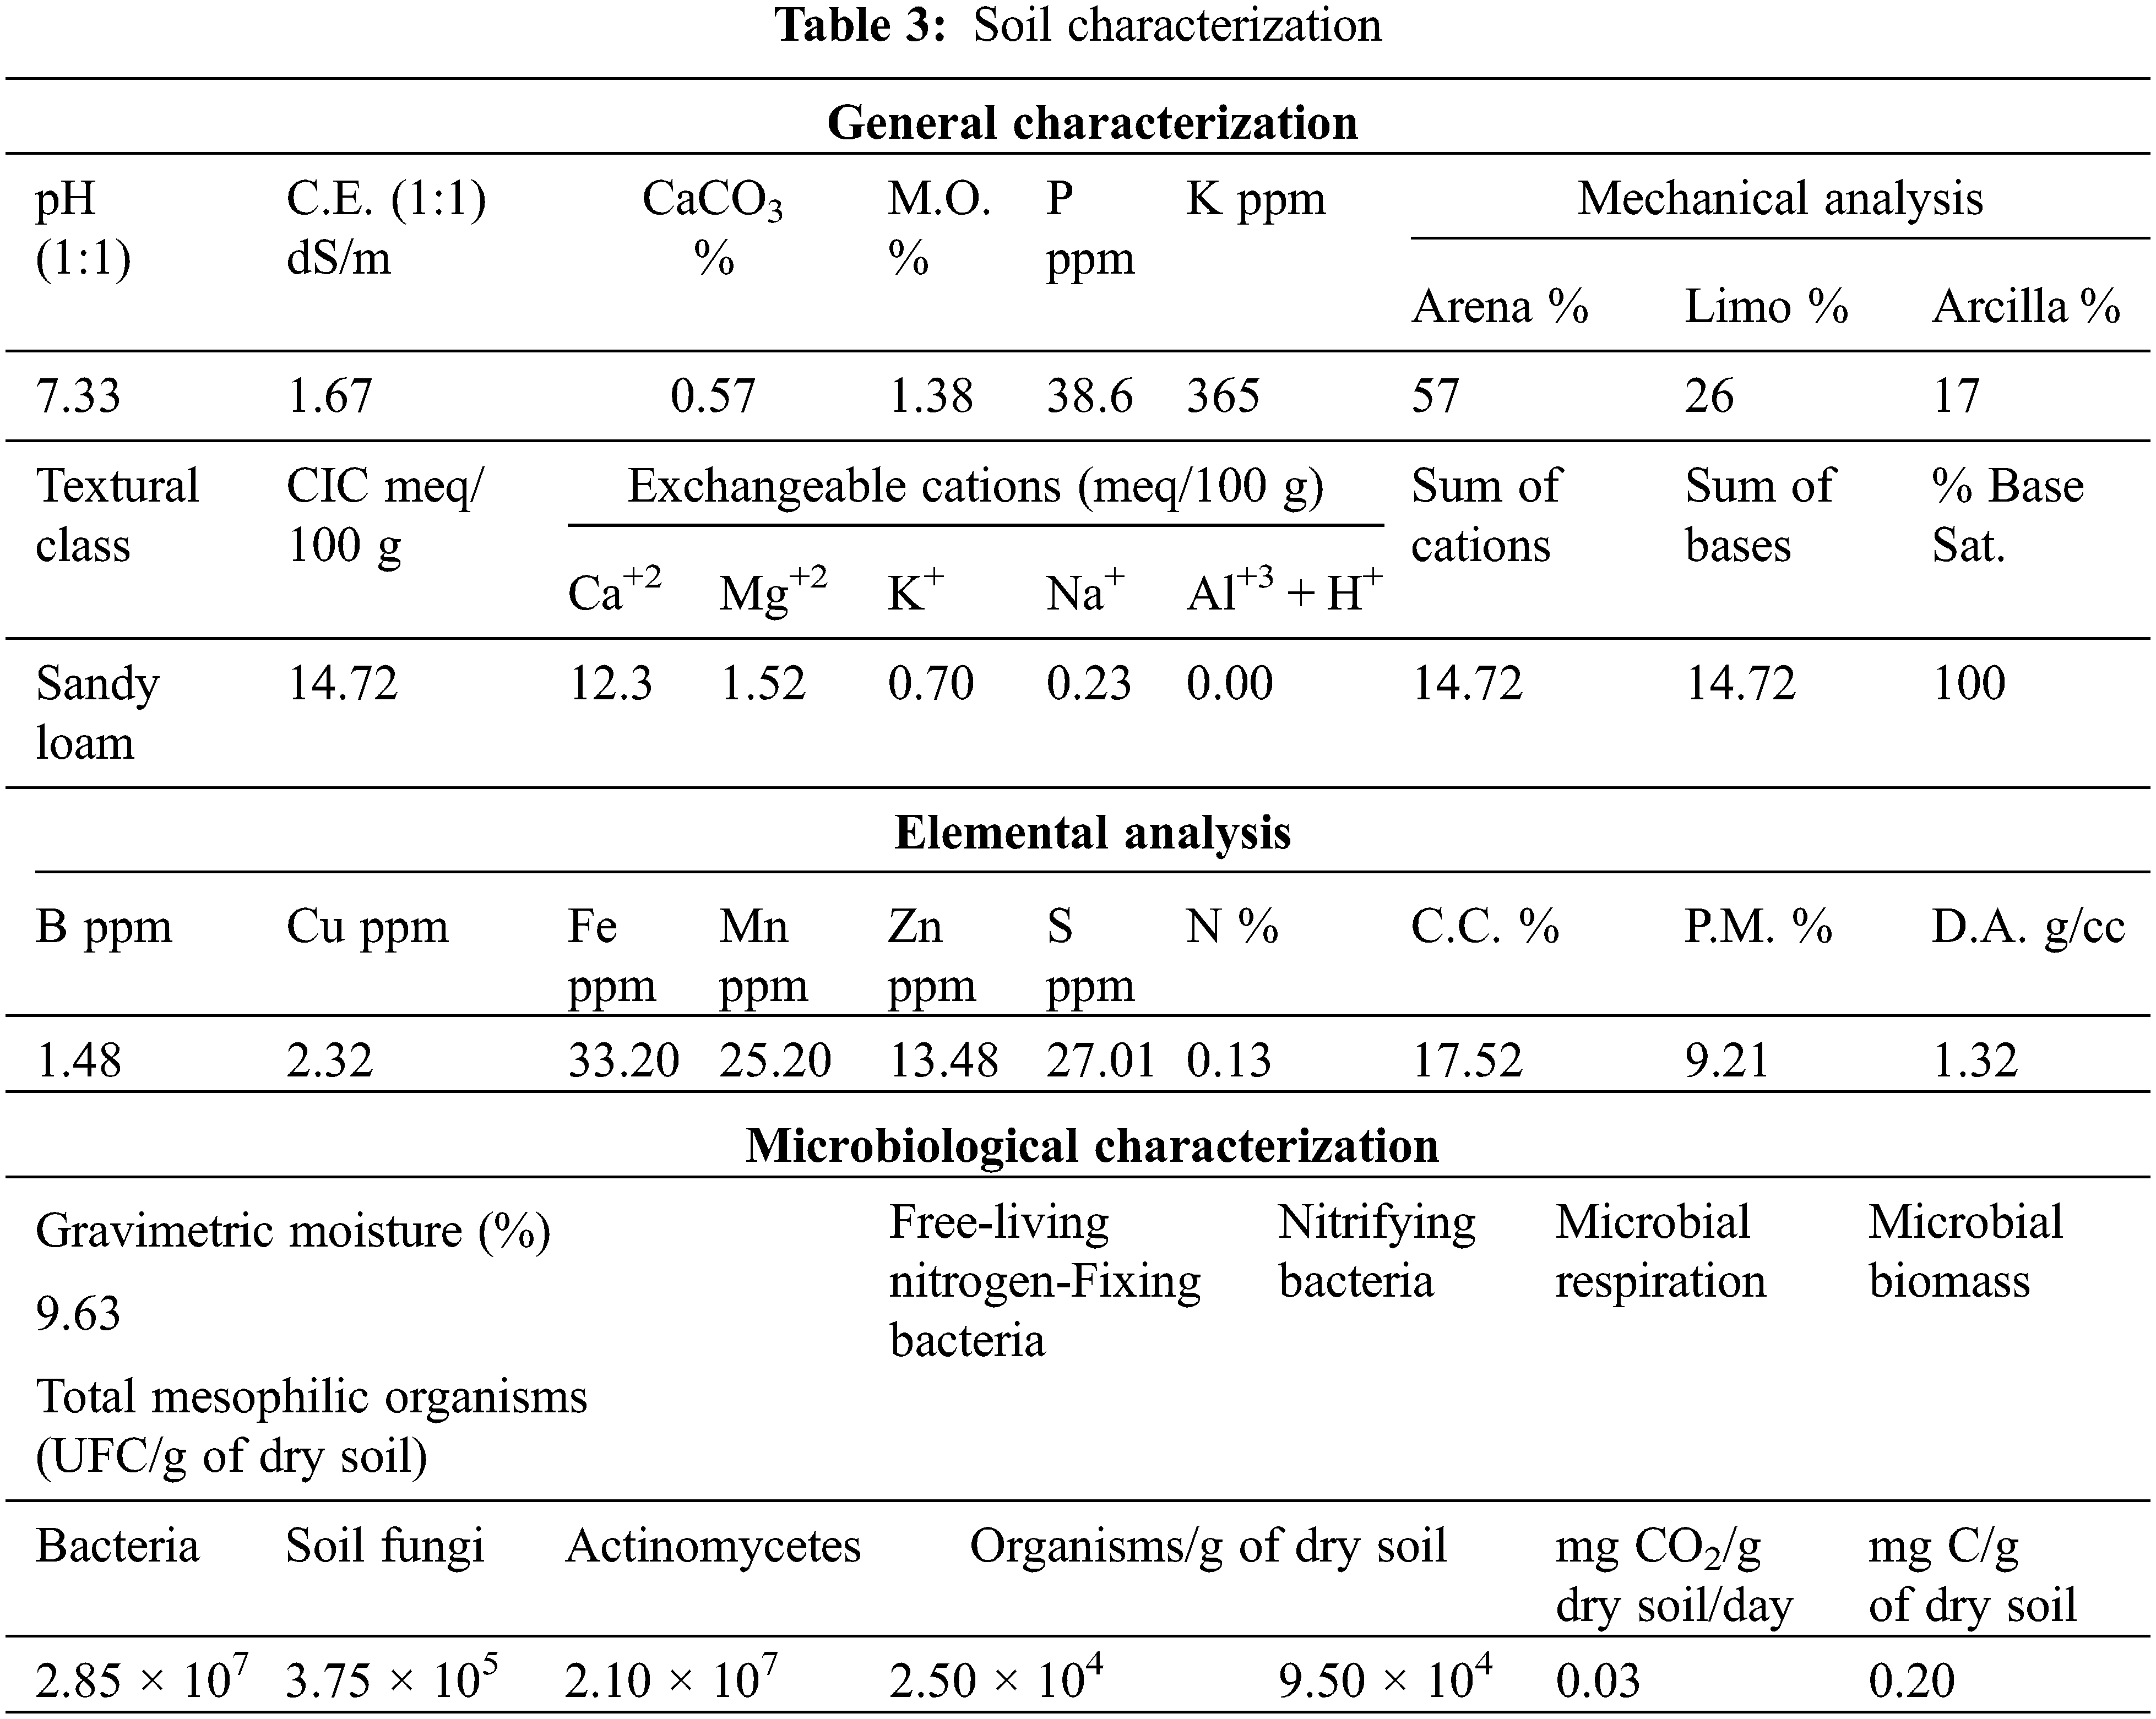
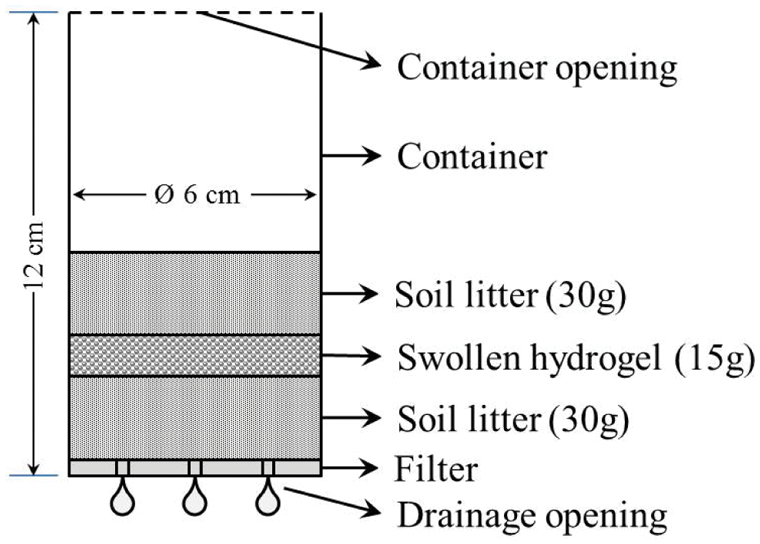
Figure 1: System for the evaluation of retention test
Further, the hydrogels were characterized employing Fourier transform infrared spectroscopy–attenuated total reflectance (FTIR–ATR) in a Shimadzu IRTracer–100 spectrometer with the Pike MIRacle single reflection horizontal ATR accessory equipped with a ZnSe ATR crystal in transmittance mode. The wavenumber range from 300 to 4500 cm−1 at 64 scans and resolution at 4 cm−1 was used for the analysis. Also, they were thermally characterized by Thermogravimetric Analysis (TGA) and Differential Scanning Calorimetry (DSC), these analyses were carried out in a TA Instruments TGA 550 and DSC 2500, respectively. TGA was carried out from room temperature to 600°C under a heating rate at 10 °C/min using nitrogen flow at 100 mL/min as protective gas. For DSC was used nitrogen flow at 100 mL/min as purge and protective, and the analysis temperatures setup were defined between −50°C to 250°C at a heating and cooling rate of 20 °C/min, the cooling stage was reached using liquid nitrogen. And finally, Scanning Electron Microscopy (SEM) analyses were also carried out in FE-SEM, Hitachi Regulus 8230, Hitachi High-Tech Co. equipment, employing a secondary electron signal and voltage at 3.0 kV.
The synthesis and subsequent processes allowed to obtain a series of hydrogels based on PS, PVA, and MBAm that have a gelatinous, yellowish, and soft texture in their wet state; already in their dry state the hydrogels turn pale and rigid. In Fig. 2 it is possible to observe some hydrogels obtained.
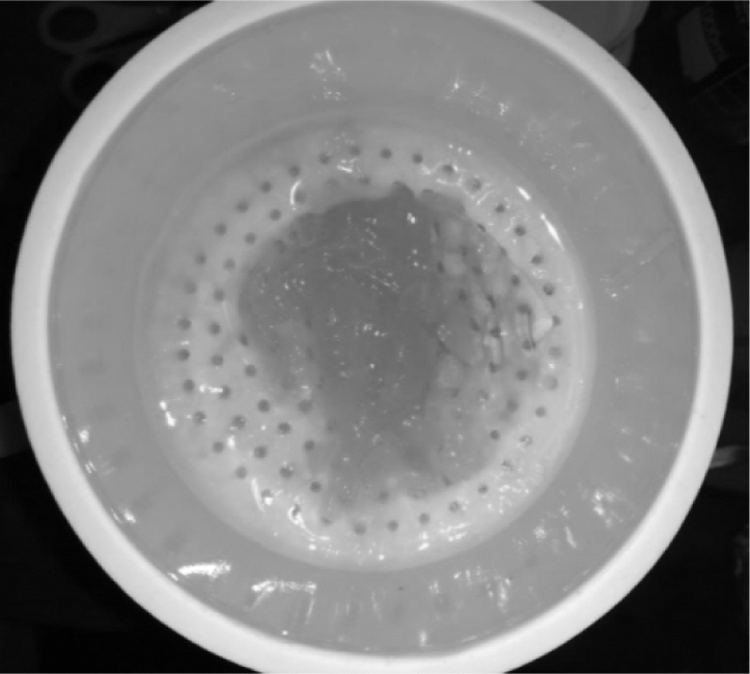
Figure 2: Hydrogel in the wash process
3.1 Swelling and Deswelling Test
Fig. 3 shows the results obtained regarding the kinetic curves of two consecutive swellings process of the hydrogels. As expected in a first swelling (Fig. 3A) the behavior describes a logarithmic function adjusting asymptotically to a value that represents an experimental equilibrium swelling (Wt1) that depends on the composition of each hydrogel. Already in the second swelling curves (Fig. 3B), some transformations in the ideal swelling behavior are observed, partially moving away from a logarithmic function, however, a degree of swelling is presented that stabilizes asymptotically at an equilibrium value (Wt2). Additionally, note that changes in the absolute value of swelling are observed between the two types of the curve (Figs. 3A and 3B), where in the second swelling cycle it reaches lower degrees of swelling. These changes are due to irreversible transformations generated by possible breaks in the cross-linked bridges between PVA and PS caused by the hydration cycle of the material.
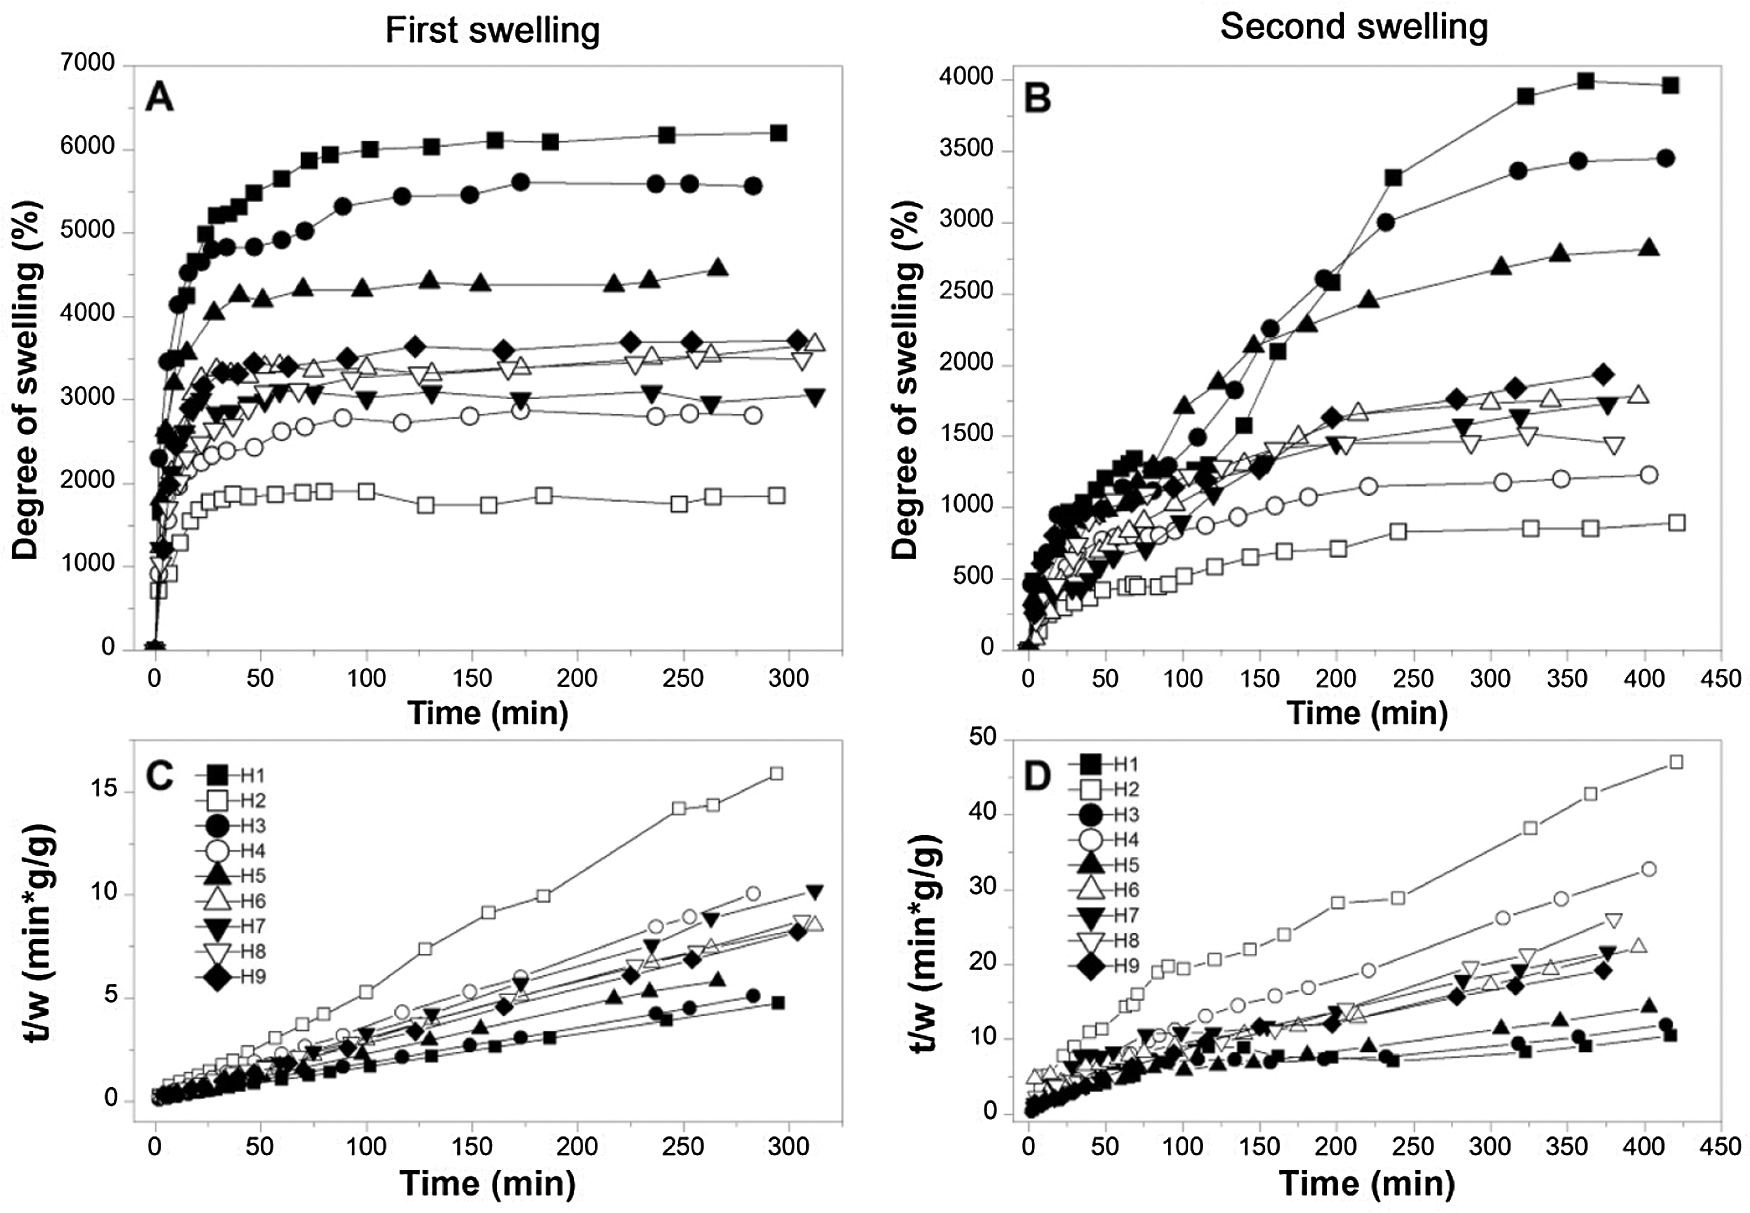
Figure 3: Kinetic information. (A) and (B) curves swelling kinetics of first and second swelling, and (C) and (D) curves of kinetic relations of hydrogels of first and second swelling
Likewise, Figs. 3C and 3D shows the swelling kinetic relations (t/w) referring to the swelling data, where w is the swelling at a given time t. In Fig. 3C it can be seen that the plotted function of the t/w relationship has a behavior very close to linearity, characteristic that is verified with the correlation coefficient R2 which expresses a very high linear correlation for all hydrogels (see Table 4). This high correlation decreases slightly after the first swelling as observed in Fig. 3D, where it is observed that the correlation loses affinity, obtaining in some cases moderate correlations caused by the disruptions generated by hydration. The quantitative and qualitative assessments of the correlation coefficients can be examined in Table 4.
The experimental swelling data were evaluated by the Schott’s pseudo-second-order swelling kinetics mathematical model to evaluate the swelling kinetics of the hydrogels, the model initially formulated by Eq. (3):
Indicating that:
where A is the intercept with the vertical axis and B is the linear slope of the line t/w obtained through the linear least-squares fit of the experimental data, see Eqs. (4) and (5). In this context, such constants allow us to determine the values of Ks and W∞ and the Eq. (3) can be rewritten as:
where Ks represents the swelling rate constant and W∞ is the swelling in theoretical equilibrium. It is possible to verify that the experimental and theoretical values of first swelling are significantly close without greater variations, on the other hand, the model loses significance in the second swelling, see Table 4. For the case of the first swelling W∞, some hydrogels (H1, H3, H4, H7, H8, and H9) are close to a higher value due to a asymptotical trend of increasing swelling of the hydrogel. Otherwise, other hydrogels (H2, H5, and H6) approach values lower than the experimental value; this trend is due to slight variations that oscillate around the equilibrium experimental swelling value, oscillations that were registered at the moment of mass reading. For the second swelling, an approximation of W∞ to values greater than the experimental Wt2 is observed, an expected result given that all curves are constantly increasing swelling throughout the data collection record. In addition to that, greater differences are observed between the theoretical and experimental swellings, indicating a lower adjustment of the model for swelling after the initial one. The results obtained from the swelling curves adjusted to the Schott model can be seen in Table 4.
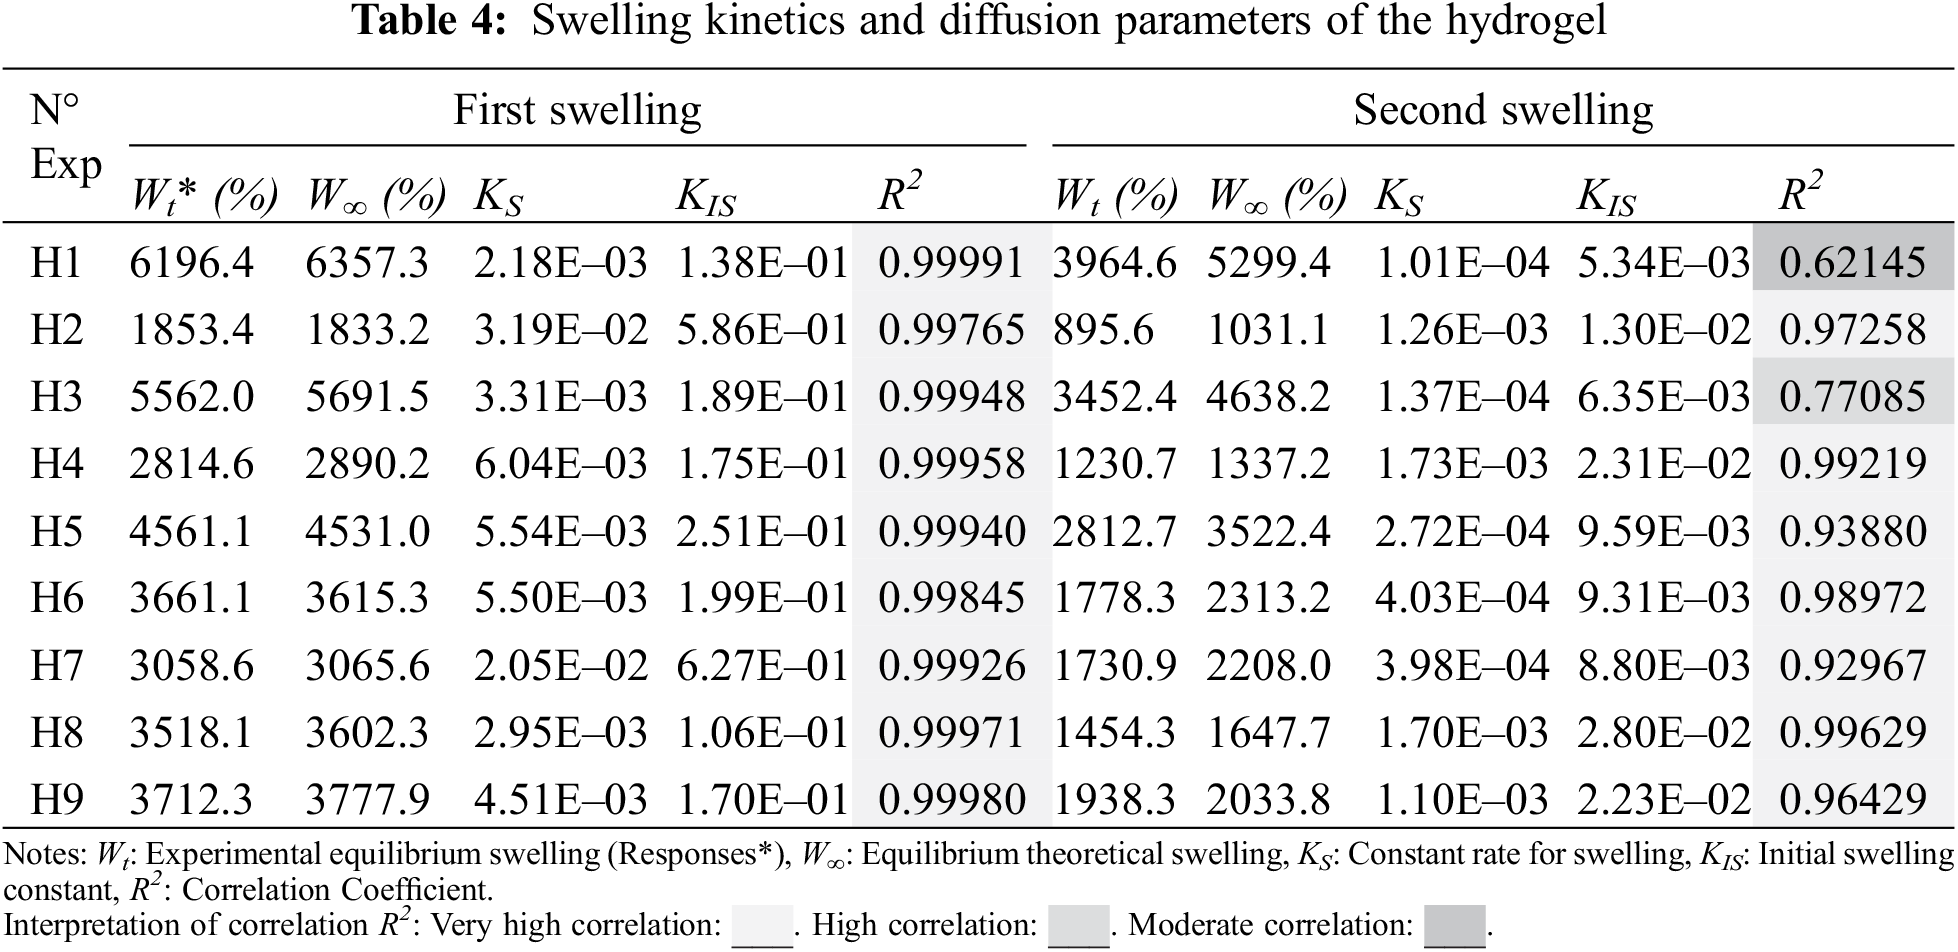
Fig. 4 shows the kinetic deswelling curves of the hydrogels, this test was carried out at a constant temperature of 40°C, simulating a drastic ambient temperature, these tests were carried out sequentially after the first swelling tests. On the other hand, as expected, the materials show reductions in their mass throughout the evaluated period until reaching an equilibrium mass, these deswelling curves it can be seen that the mass loss presents a partially sinusoidal behavior with an asymptotic end of the function (Figs. 4A and 4B). This partially sinusoidal behavior suggests the existence of a loss of critical mass which was evaluated by calculating the first derivative of the function of the deswelling curve (Figs. 4C and 4D). The composition of the different hydrogels analyzed determines the critical mass loss time, however, critical loss ranges occur in periods between 205 and 285 min for most of the hydrogels for the two deswelling cycles. It should be noted that the variation in drying temperature would vary the behavior of critical mass loss, displacing it positively or negatively in the exposure time.
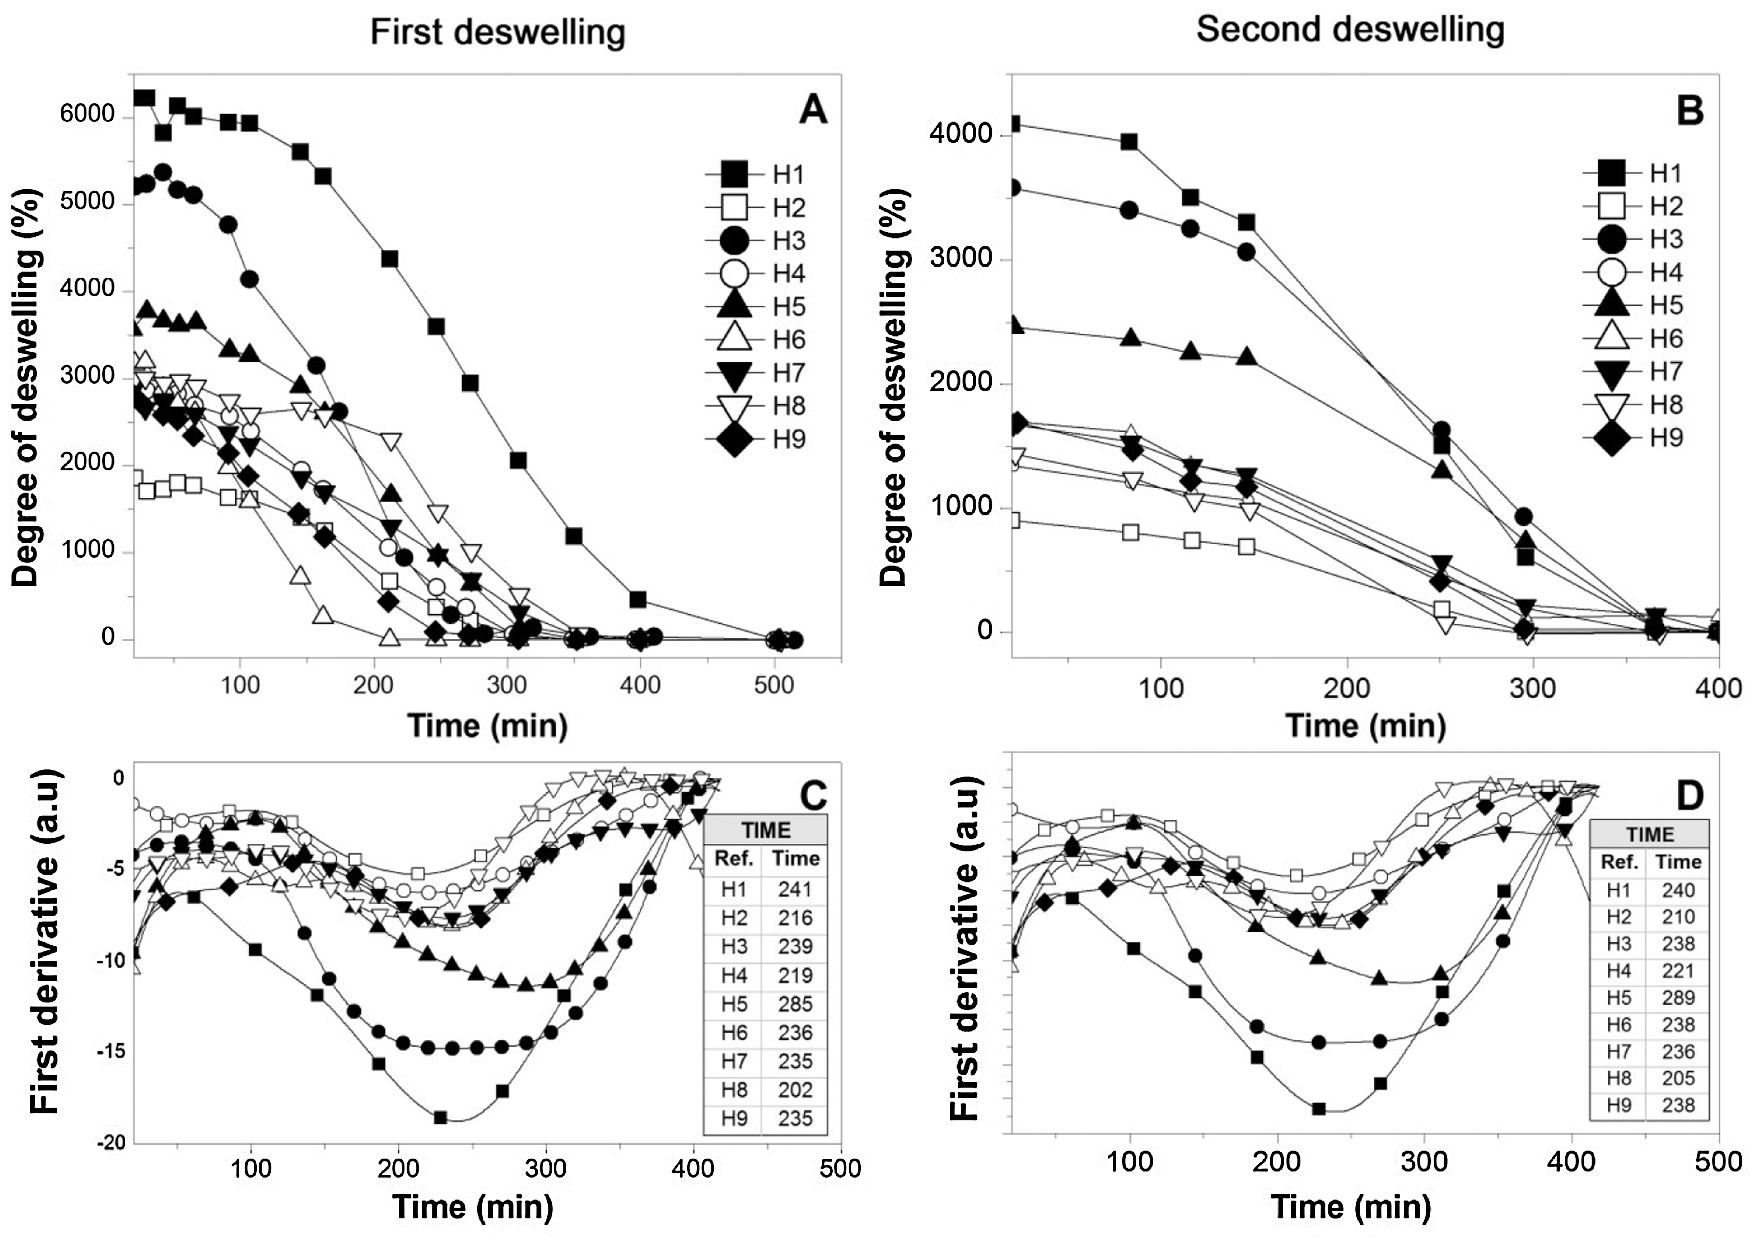
Figure 4: Deswelling kinetic curves. (A) and (B) Curves deswelling kinetics of first and second swelling process, and (C) and (D) First derivative of the function of the deswelling curves
Table 4 shows the experimental results of swelling used for the statistical study. Nine random runs were performed to reduce the errors of the systematic trends in the variables. The data obtained were evaluated by the analysis of variance (ANOVA) to adjust the response model by the least-squares method and to evaluate its adequate fit. The significance of the model was evaluated using the probability value (p-value); at a 95% confidence level, knowing that p-value lower than 0.065 indicates significant effects. The p-value coefficients greater than 0.065 were not significant for the model, so they were not considered in the regression model.
The statistical significance and the proposed adequacy of the developed equation, as well as the effects of the individual terms and their interactions, were analyzed by ANOVA method as summarized in Table 5. The fit of the model was evaluated using the probability value (p-value), and the coefficients of determination (R2 and Radj2). Based on the parameters in Table 5, the cubic regression model with determined coefficients is given by Eq. (7):
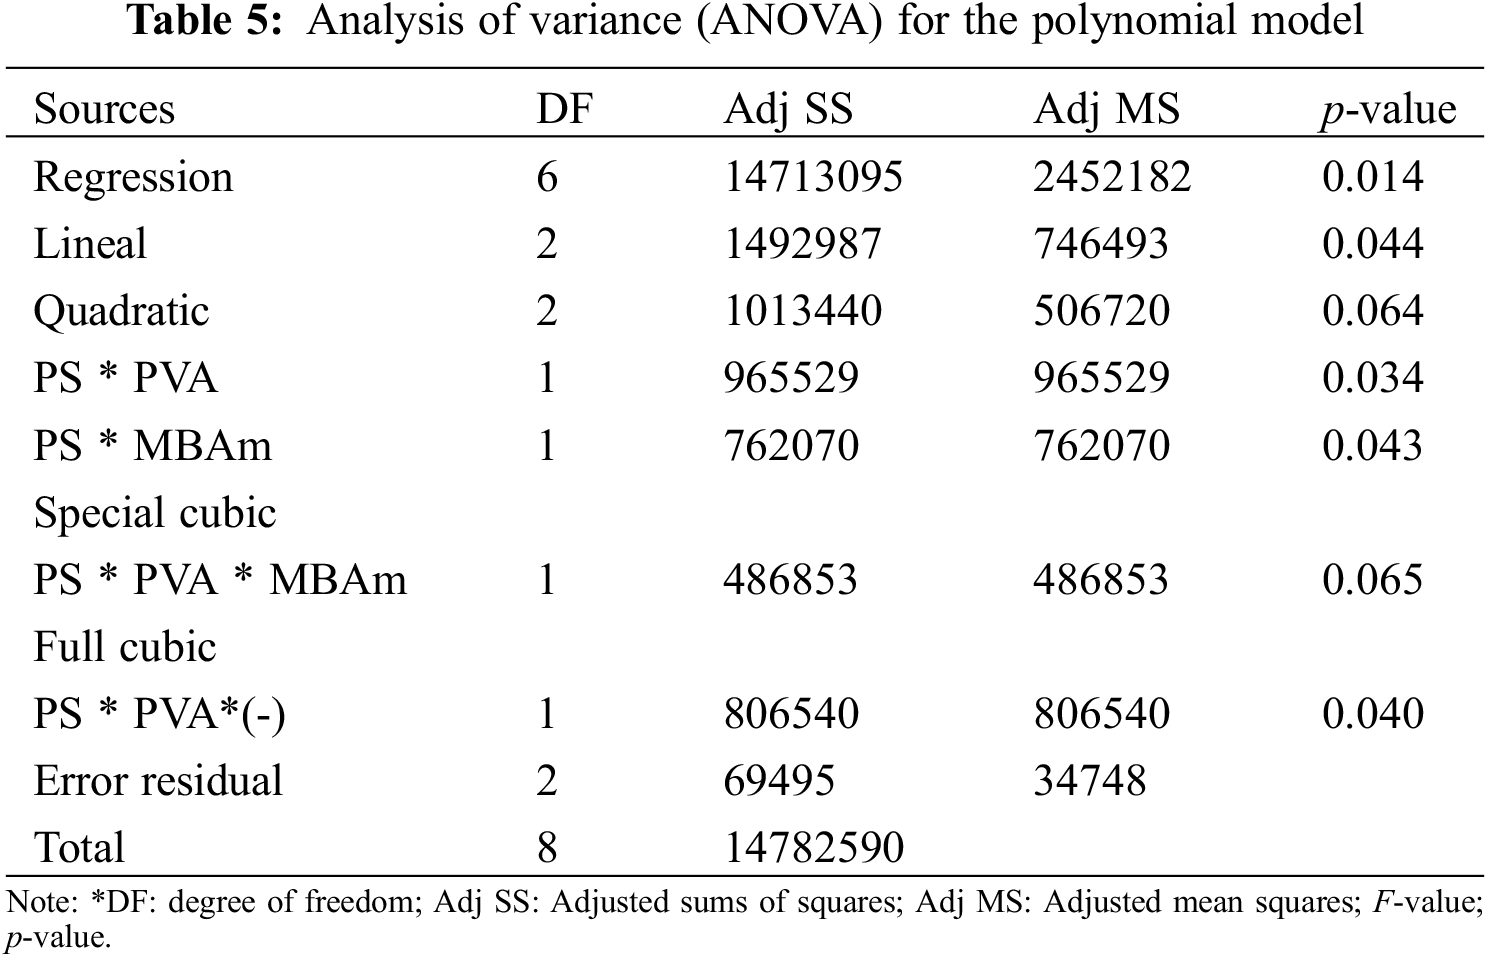
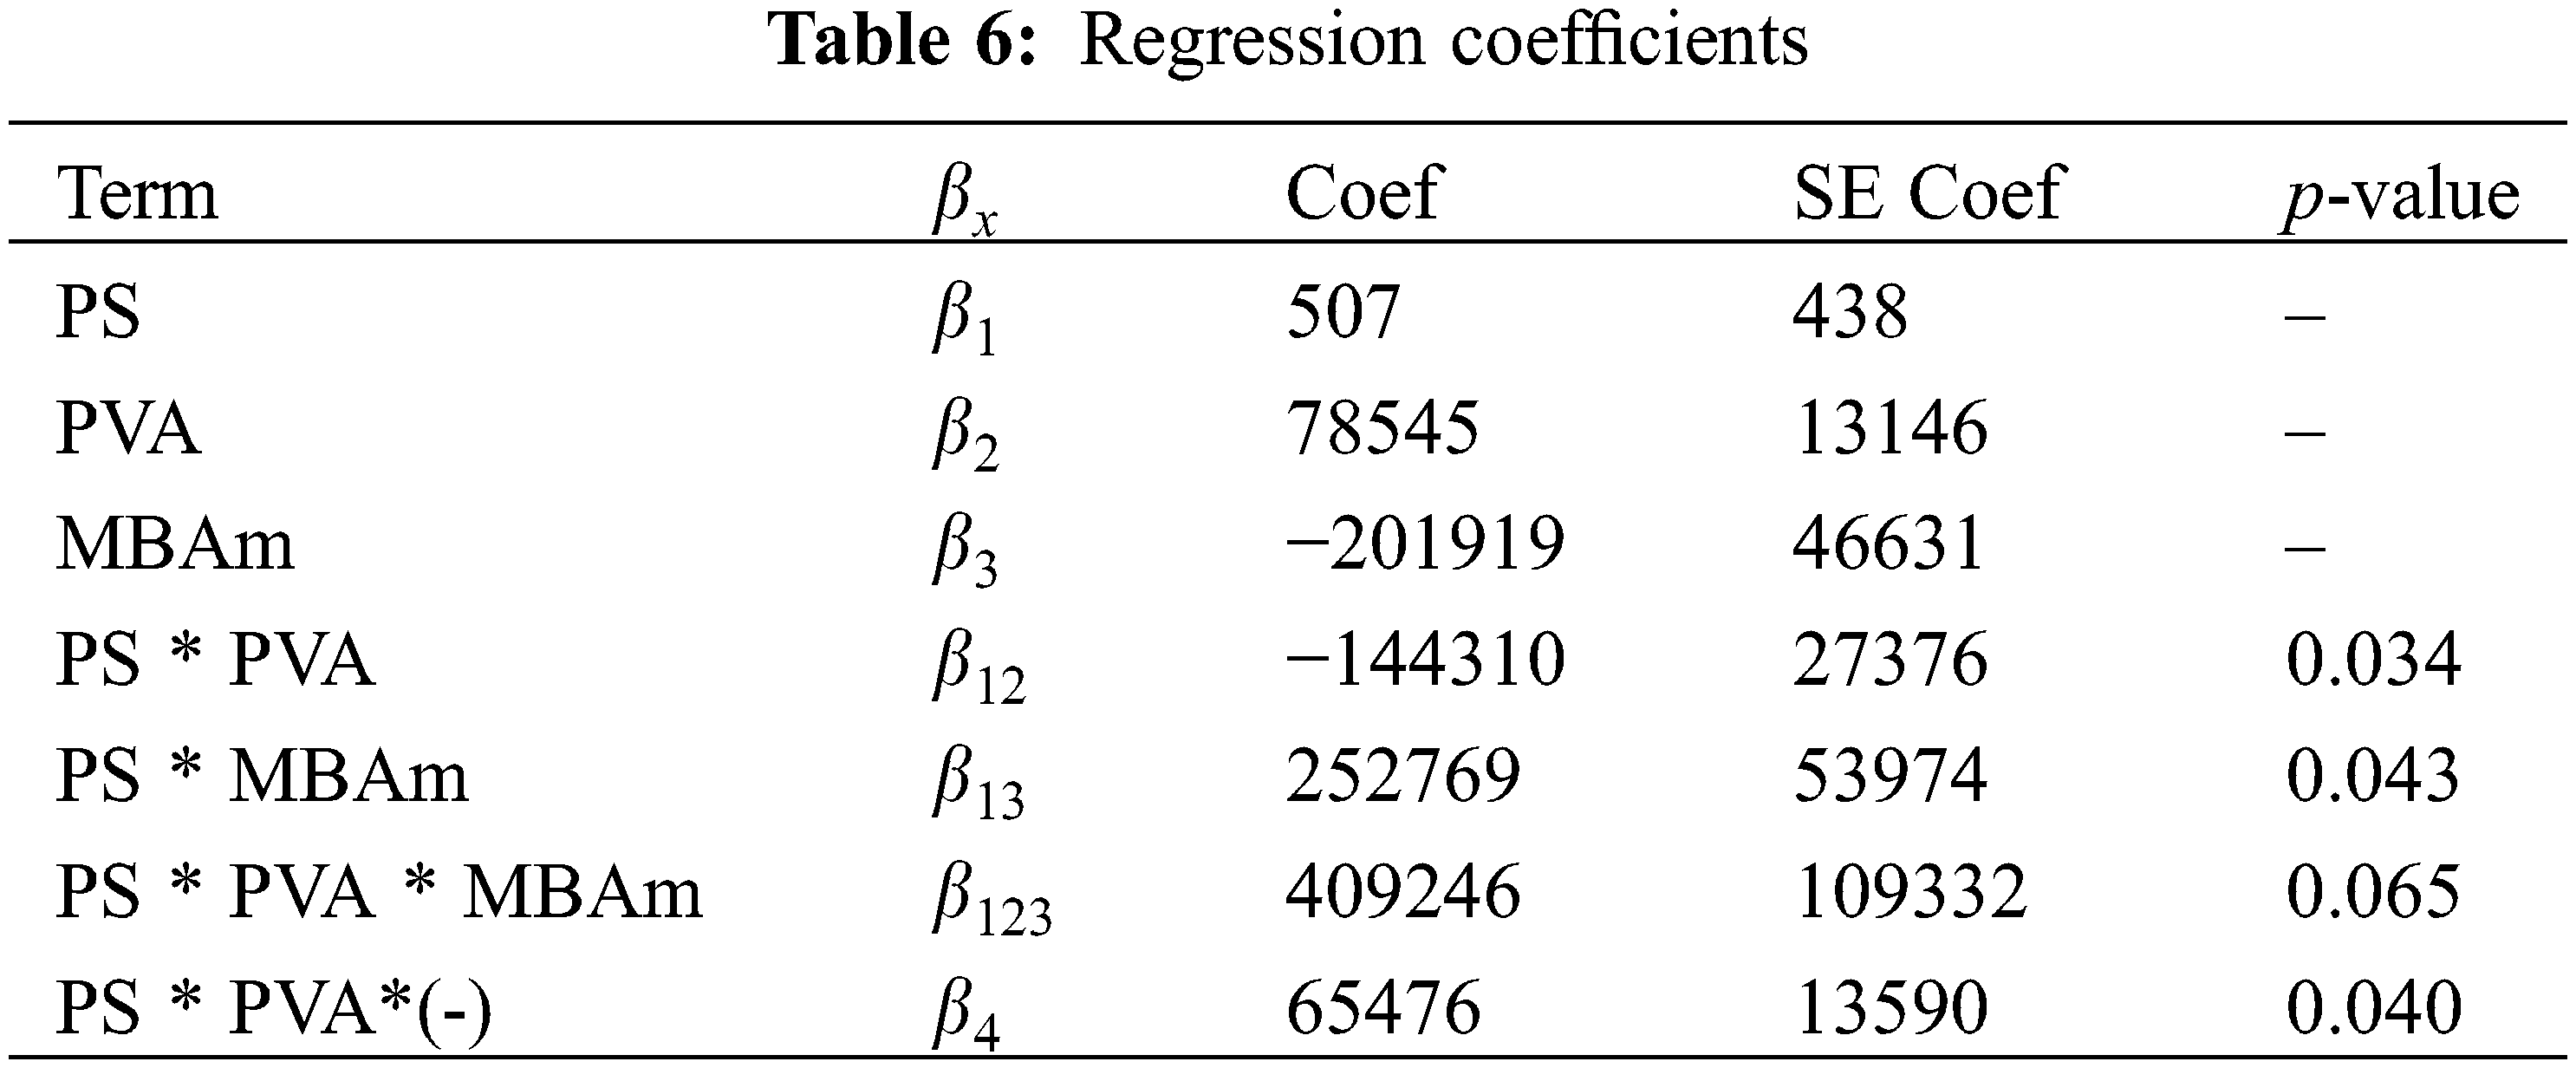
The data of the model (Table 5) show that the p-values, less than or equal to 0.065, indicates that the predictive cubic model was significant concerning the experimental data selected from the swelling kinetic curves. The significance and adequacy of the models were also verified by determining the coefficients of R2 and Radj2 (R2 = 99.53% and Radj2 = 98.12%), showing a high degree of prediction when compared with experimental data. These values suggest that the model fits ~98% of the variability of the experimental data on average and a percentage less than 2% of the variation in the content of PS, PVA, and MBAm that could not be adjusted by the developed model. These values (R2 and Radj2) therefore show a high significance of the model and a correlation between the predicted and observed values based on the proposed relevance analysis, this concordance can be observed in parallel in the results obtained in the residual graphs (Fig. 5A). Likewise, it is observed that the absolute values of SE-Coef are lower than Coef, in addition to that, the p-values are reduced indicating that each term studied is statistically significant, see Table 6.
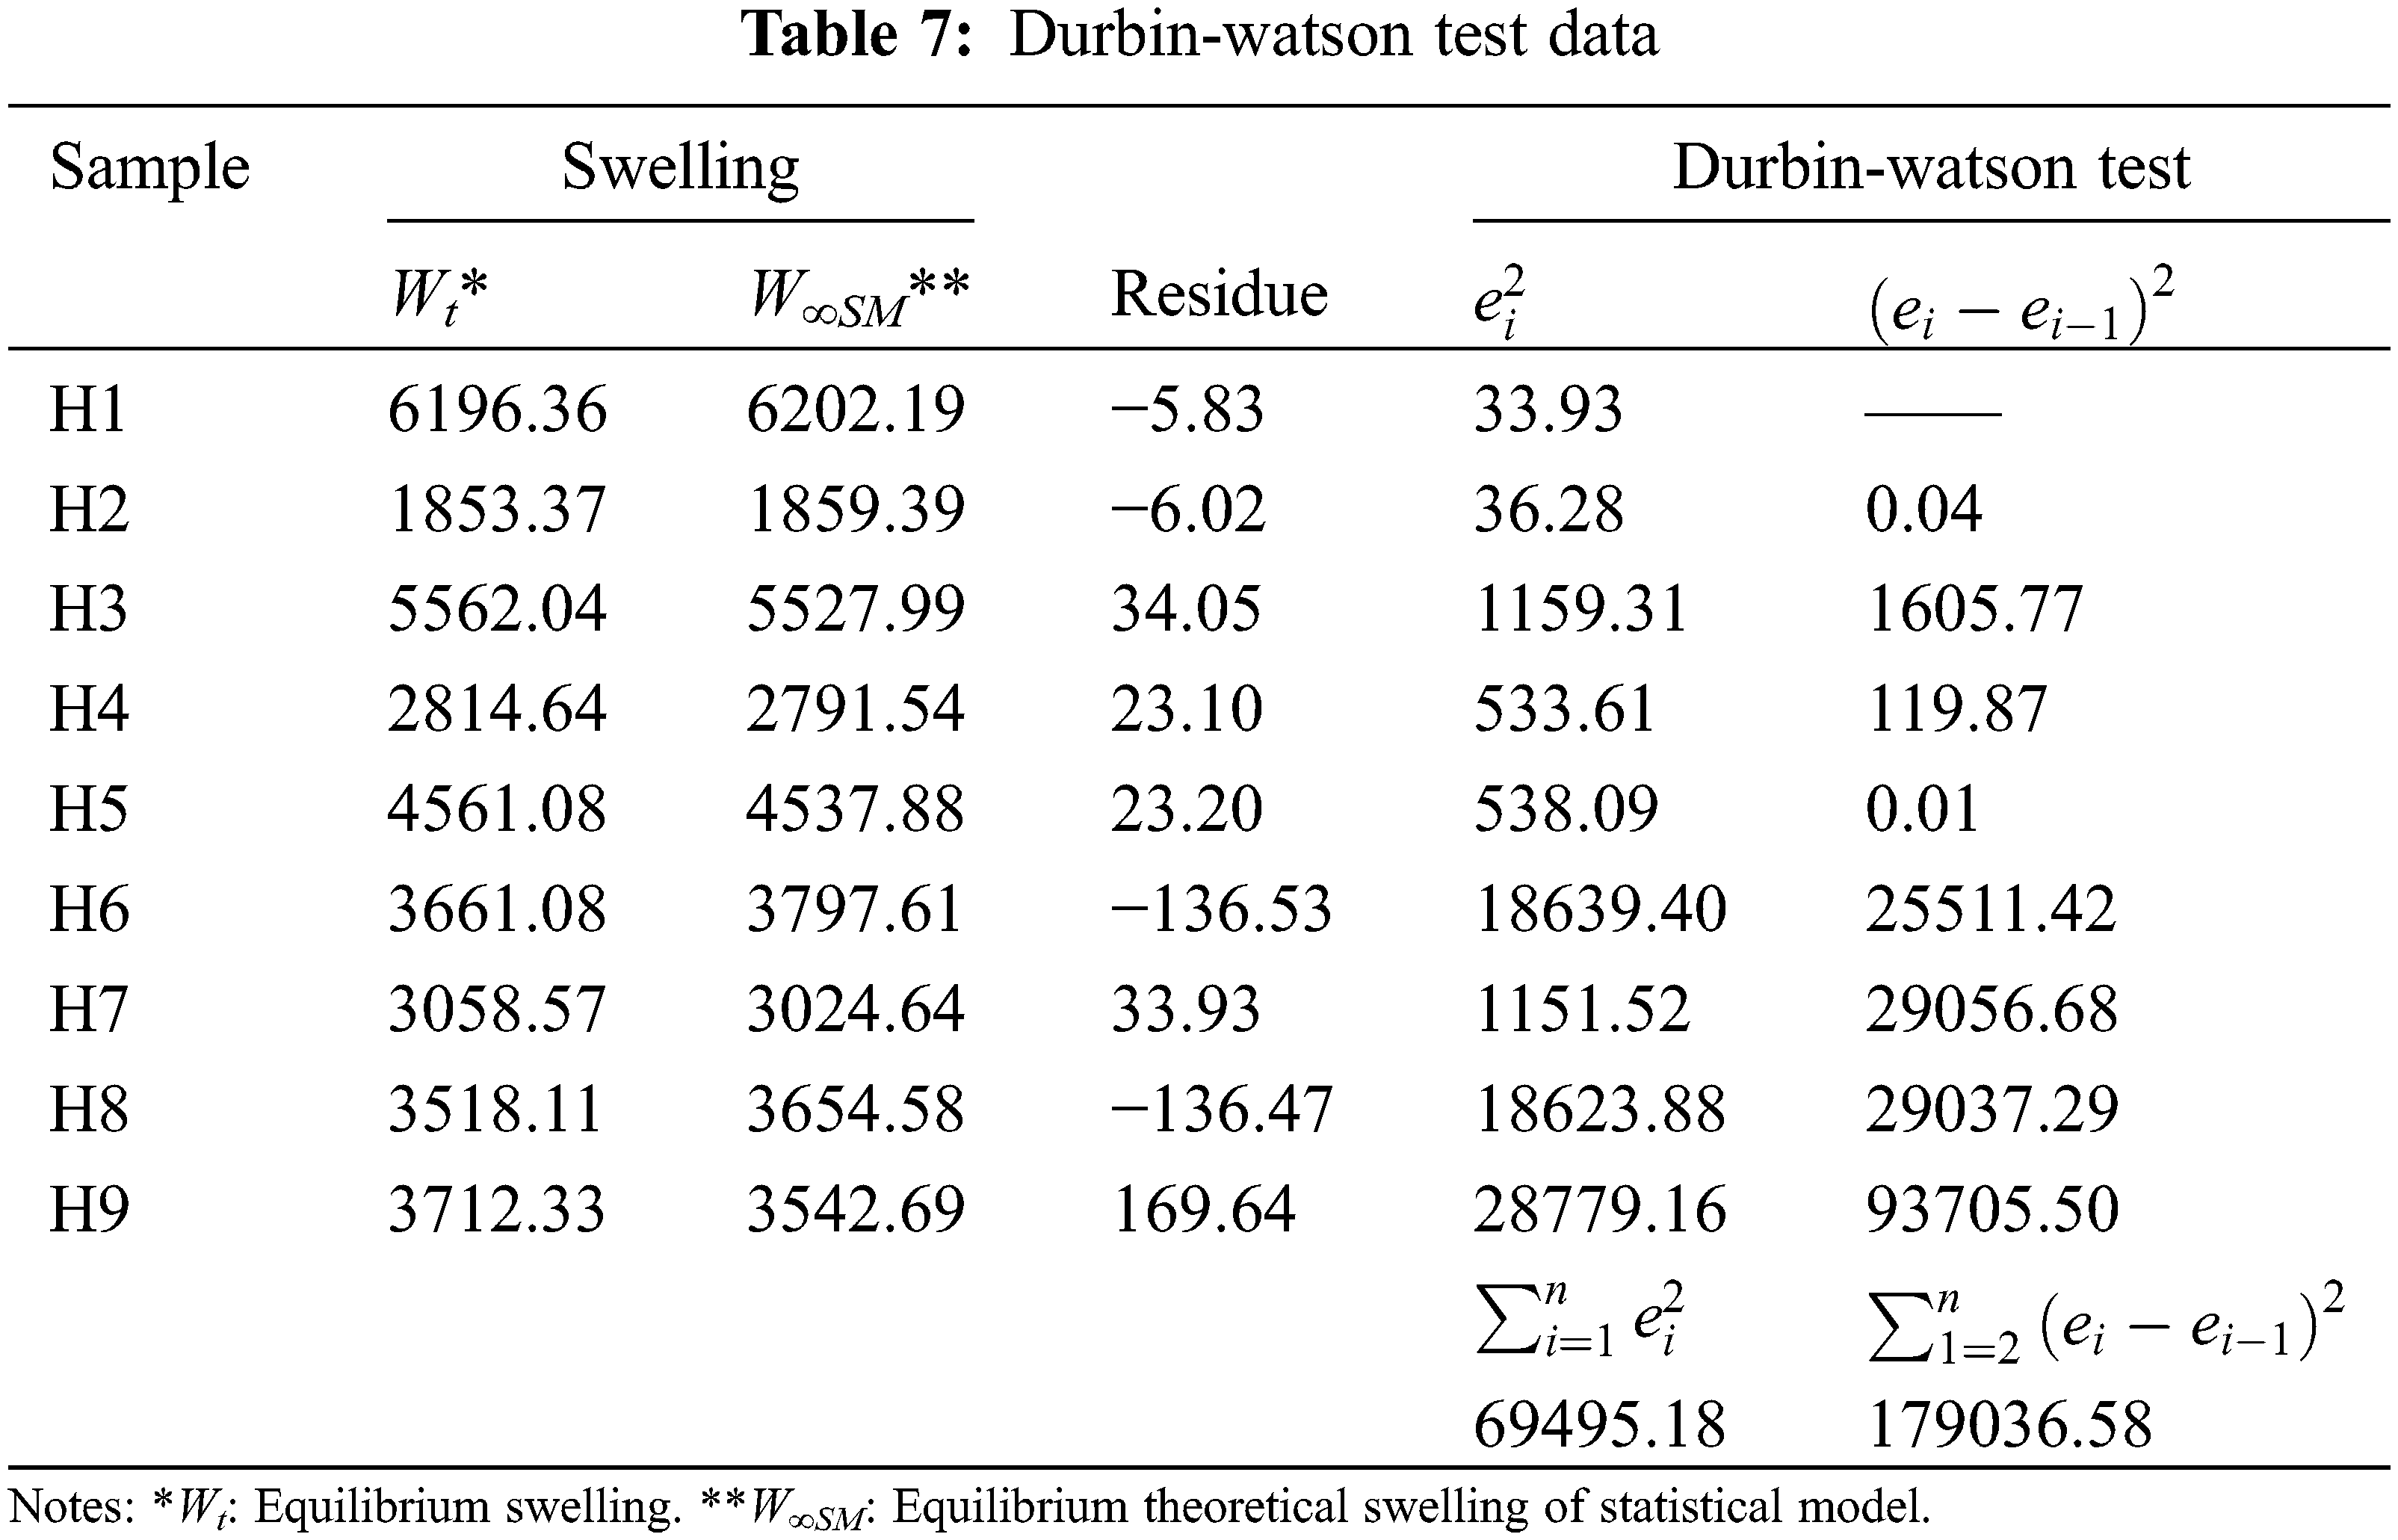
The Anderson Darling statistical test was developed, which generated a p-value of ~0.064, a value slightly above the usual value of the significance level; this result suggests that the residues describe a predominantly normal distribution, see Fig. 5A3. On the other hand, the independence of the results was established through the Durbin-Watson test, the data and results related to this test can be seen in Table 7 and Eq. (8). In this context, the Durbin-Watson result generated in the test (~2.58) is in an accepted band that indicates that the data are approximately independent or without appreciable correlation.
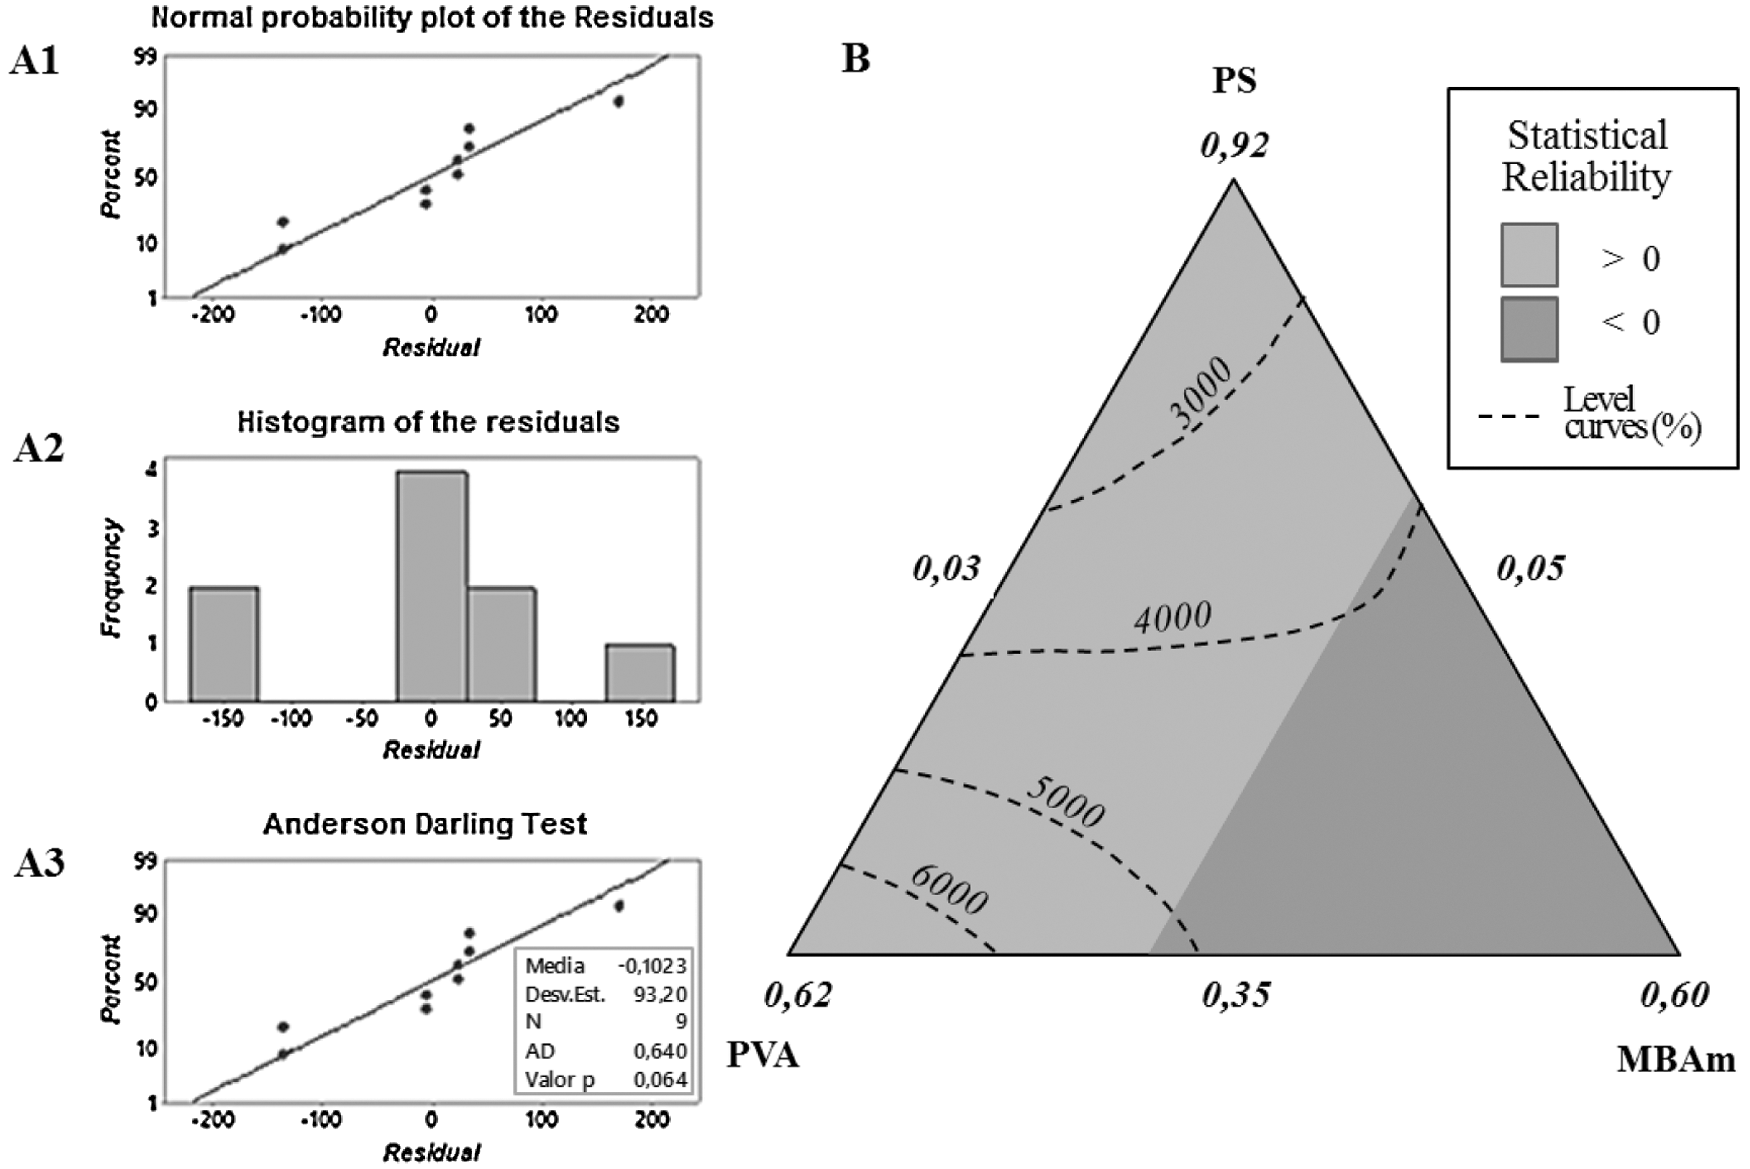
Figure 5: Statistical graphics: (A) residual plots. (B) contour plots for Wt1 content vs. PS, PVA and MBAm
The proposed model allowed us to understand and corroborate various aspects of the effects between the variables studied; initially, it allows us to determine two large regions of statistical relevance, which denote positive and negative statistical significance, see Fig. 5B. This is because, with incorporations greater than ~23 wt% of the MBAm crosslinking agent a negative effect is exerted on the response, these significant amounts of MBAm incorporated in the hydrogel drastically change the structure and its behavior about swelling. Effects associated with excess crosslinking produce a decrease in the elongation capacity of the polymeric chains, greater rigidity of the material and of the cavities that stock the absorbable liquid, producing in the hydrogel reduced or irregular liquid retention and swelling capacities. That phenomenon of changes in the swelling capacity related to the increase in crosslinking agent was already reported in previous studies that described similar behaviors [17,21–23].
On the other hand, the interactive effects of the variables studied on the response (Wt) were analyzed by drawing level curves in the ternary diagram as a function of the three variables (PS, PVA, and MBAm), see Fig. 5B. When observing the level curves, close to the PS-PVA axis, it can be observed that reciprocity occurs in which the response increases with the gradual incorporation of the PVA component.
Fig. 6 shows the general results of the experimental (Wt) and theoretical (W∞) swellings in equilibrium referring to the Schott and statistical models, data extracted from Tables 4 and 7. In these results, it is possible to observe that the data are expressively close to the experimental data for each type of hydrogel. The comparison of the absolute values of the models together with the experimental results allows to verify the proximity in the results by hydrogel, allowing the indirect validation of the studied models, since, although the models have different foundations, they provide results and responses associated with the theoretical swelling in equilibrium of the hydrogels studied.
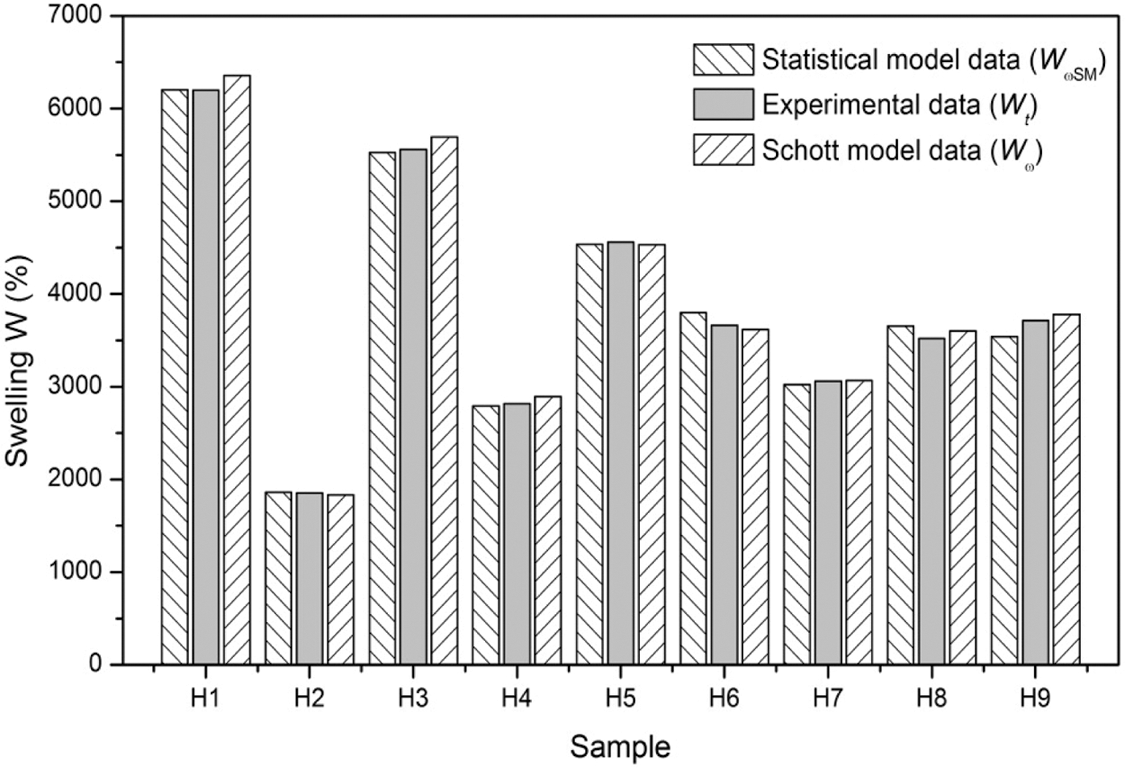
Figure 6: Comparison of equilibrium swellings
The water retention of hydrogel integrated into the soil is of great importance to evaluate the interaction of water in conjunction with different phases, which can positively impact sectors such as agriculture, as it would contribute to optimizing the use of water for plantations, and in this way the loss of water by leaching, filtration, evaporation and/or transpiration is avoided. In this context, said behavior was verified in the hydrogels with better performances in relation to swelling. Thus, in Fig. 7 the water retention curves can be observed in the soil and swollen hydrogel systems, where it is observed that the soil in the absence of hydrogel reaches a mass stabilization in a period of time of approximately 25 h. The water retention result in the pure soil contrasts with the retention result of the hydrogel systems where they have dehydration periods greater than approximately 52, 57 and 62 h for the samples with the hydrogels with references H5, H3 and H1, respectively. As expected, the hydrogel with higher swelling indices achieves better retention indices, decreasing as a function of the amount of PVA.
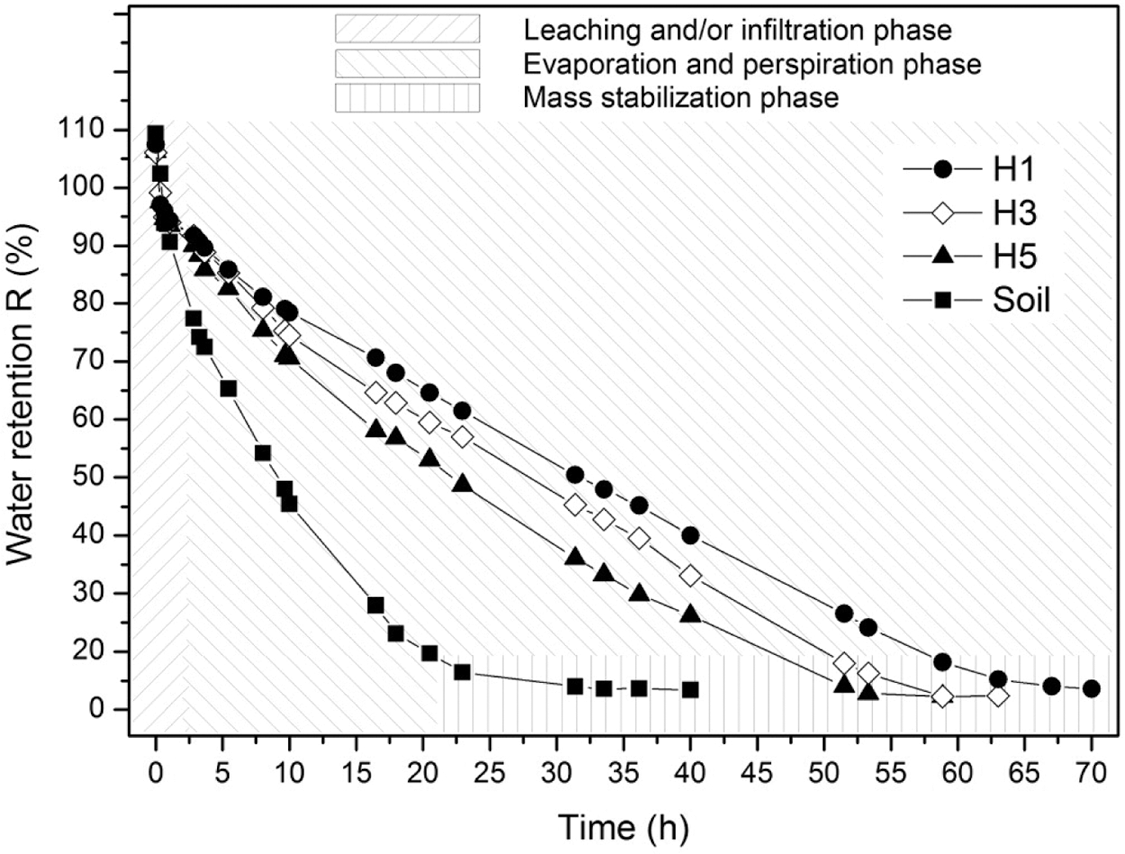
Figure 7: Water retention in soil/hydrogel systems
On the other hand, it is important to highlight that the integration of the hydrogel and the soil in the form of layers contributes to the retention of water compared to the deswelling of only the hydrogel. The deswelling and water retention curves indicate that the interaction between the hydrogel and soil reduces the elimination of water by means of leaching, filtration, evaporation and/or transpiration, suggesting that this prolonged humidity in the soil can be exploited by organisms present in it.
The main raw materials used in the present work were characterized by FTIR, to verify the transformations generated after the synthesis. In this context, Fig. 8 shows the FTIR spectra of PVA, PS, and MBAm, in the case of PVA spectrum the typical bands were identified of the presence by hydroxyl groups O–H at ~3301 cm−1, stretching C–H from alkyl groups at ~2925 cm−1, bands of bonds deformations of C=O and C–O at ~1733–1716 cm−1, bending vibration mode of –CH2 group at ~1436 cm−1, stretching vibration of C–O–C and C–OH at ~1139 and ~1091 cm−1, respectively, band of ester stretch and C–O bond at 1025 cm−1 and deformation outside the O-H band plan at ~947 cm−1 [1,3,8,24–27].
FTIR spectra of PS (Fig. 8) shows hydroxyl groups O-H at ~3315 cm−1, stretching C–H from alkyl groups at ~2929 and ~1150 cm−1, the band of deformation from CH2 and –COO at ~1417, vibrations of the C-O-C and glycosidic bond can present different modes of vibrations and bending conformations at ~1155 and ~927 cm−1, the band of C-C stretch at ~769 cm−1, and the bands of stretching pyranose ring at ~1004 and ~574 cm−1 [19–20,25,28–29]. On the other hand, the FTIR spectra of MBAm shows bands of deformations N-H bond at 3309, 3037, and 1541 cm−1, bands of deformations N-H bond at 1307 and 955 cm−1, several stretching of CH2 at 3107, 3070, 2960, 1412, 1384, 1436, 989 cm−1, two stretching of C–H at 2854 and 1072 cm−1, deformations at 1657, 1625, 967 and 479 cm−1 caused by C=O, C=C and C–C bond, and stretching at 619 cm−1 caused by O=C–N group [30].
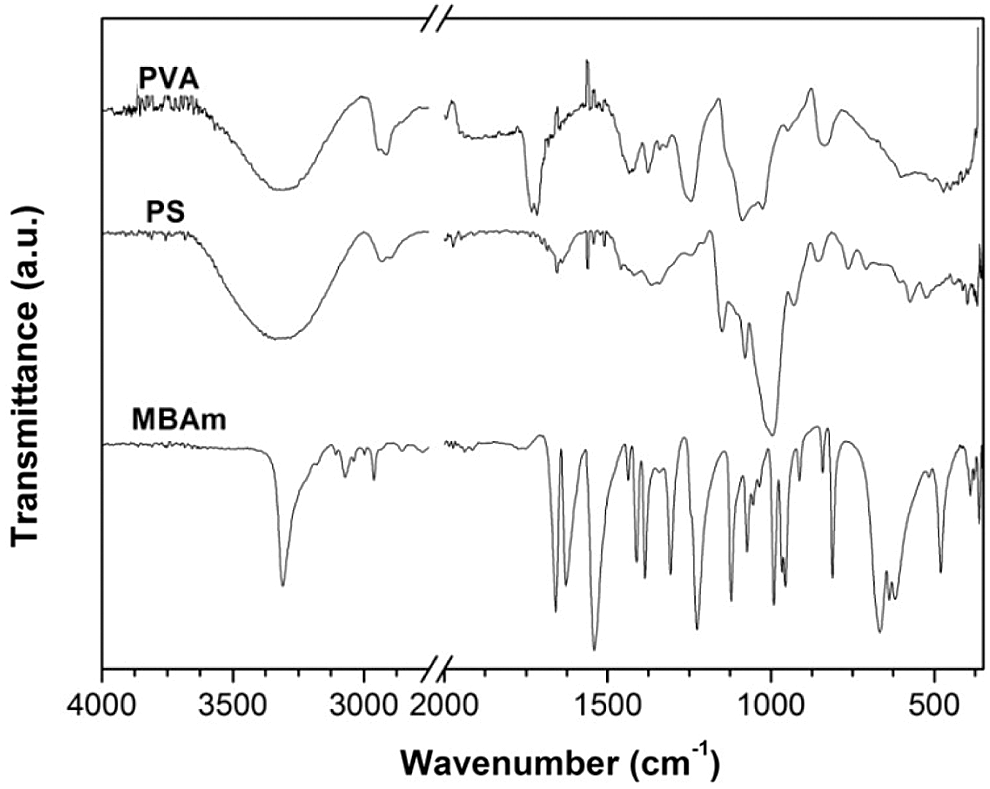
Figure 8: FTIR spectra of raw materials to synthetize hydrogels based in PVA, PS and MBAm
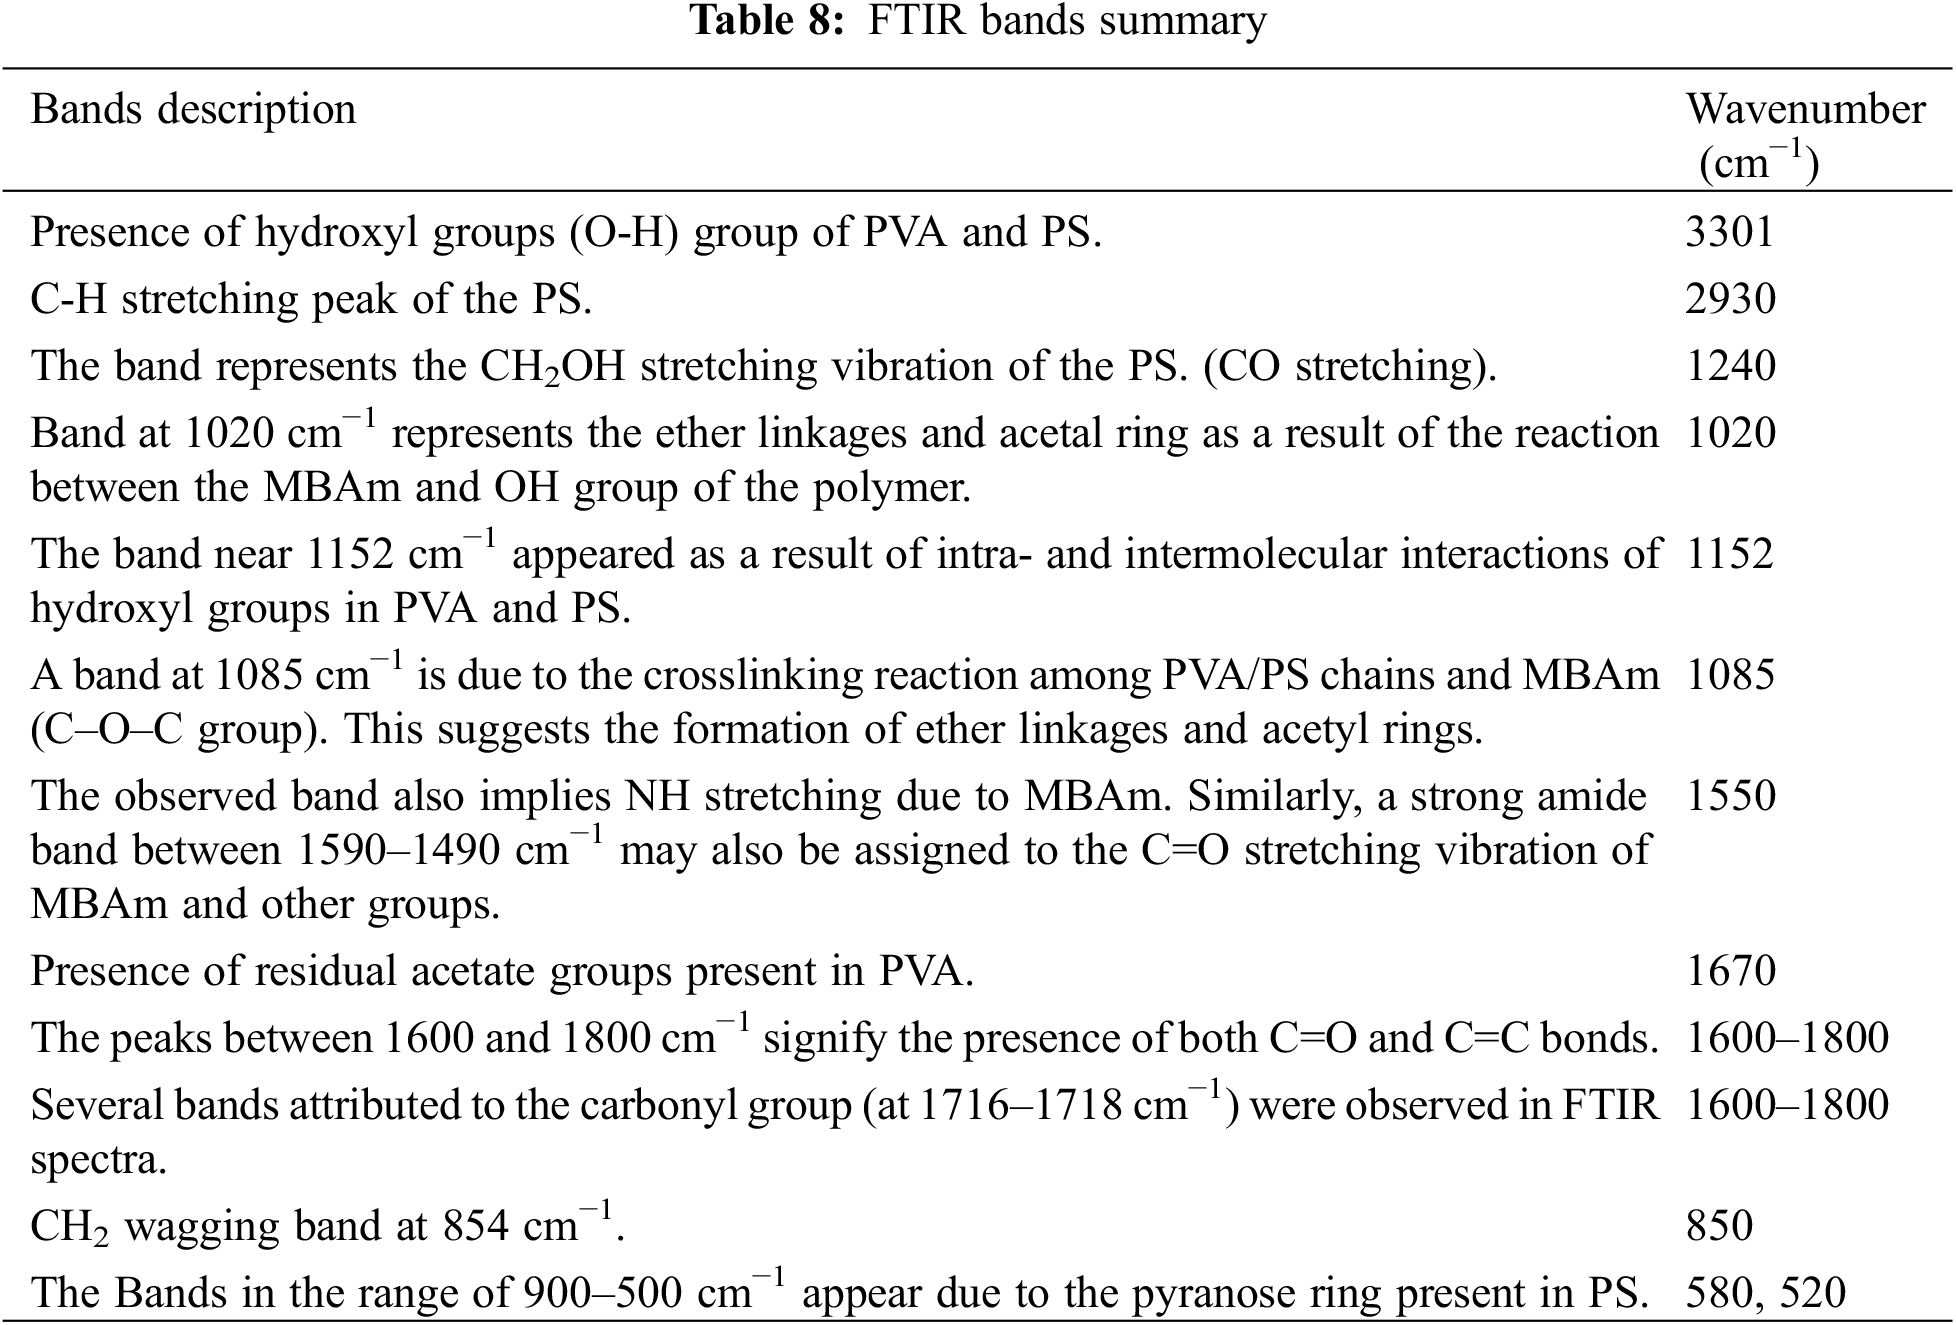
Fig. 9 shows the spectra of the hydrogels produced, where can be observed the presence of hydroxyl groups (O-H bond) of PVA and PS at 3301 cm−1 [24–25,31–35], C–H stretching peak of the PS at 2930 cm−1 [25,31,34–36], the band at 1670 cm−1 ascribed to the presence of residual acetate groups present in PVA [37], the observed band also implies for N-H stretching due to MBAm. Similarly, strong amide bands between 1590–1490 cm−1 may also be assigned to C=O and C=C stretching vibration from effective crosslinking of MBAm.
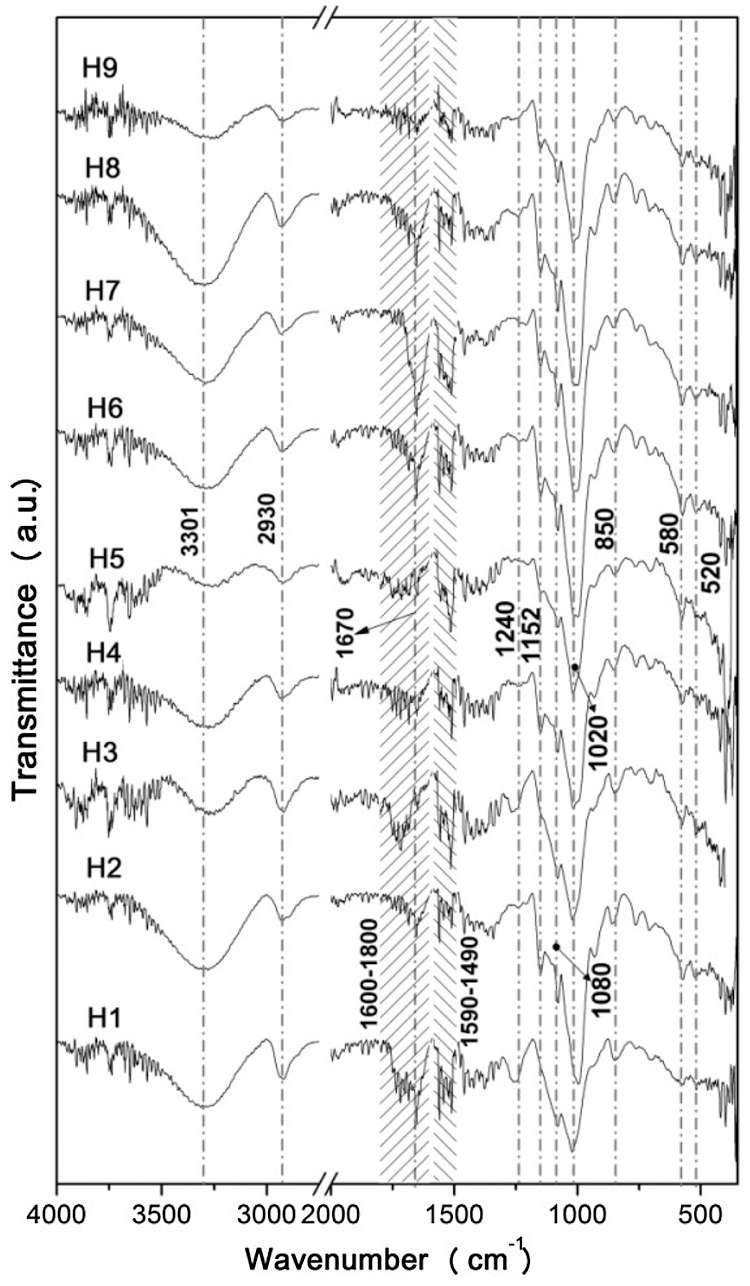
Figure 9: Hydrogel FTIR spectra
In addition, the band represents the CH2OH stretching vibration of the PS (C–O stretching) 1240 cm−1 [31,34–35], band near 1152 cm−1 suggests the robust inter- and intramolecular interactions of hydroxyl groups [25,32–33], the stretch near 1085 cm−1 arises as a result of crosslinking reaction among PVA/PS chains and MBAm (C–O–C group). This also suggests the formation of ether linkages and acetyl rings. The strong band at 1020 cm−1 represents the ether linkages and acetal ring as a result of the reaction between the MBAm and OH group of the PS and PVA [37]. Likewise, the crosslinking generated by MBAm is reflected in several bands of different intensities between the 1200 and 1000 cm−1 range through the formation of the C–O–C group. At last, the CH2 wagging band at 850 cm−1 and the small bands 580 and 520 cm−1 appear due to the pyranose ring present in PS. Table 8 summarizes the characteristics of the bands identified in the FTIR spectra of the hydrogels. The generation of new characteristics in the spectra of the hydrogels compared with the raw materials, as well as the types of bands generated in the products studied proposed suggests that the crosslinking was carried out, confirming that the proposed synthesis methodology was effective concerning to integration of new hydrogels.
In Fig. 10, the FTIR spectra of the hydrogel H1 are presented before and after the swelling process, duly dry. Note that the two spectra have some differences concerning the morphologies, intensities, and ratio of bands that indicate changes in the structure of the hydrogel after swelling. The main changes include the significant reduction of the ~3850 cm−1 and ~3745 cm−1 bands associated with the NH group, fluctuations in the ~3301 cm−1 band that may be associated with NH and OH, transformations in the bands between ~1600 and ~1800 cm−1 associated to the C=C and carbonyl groups (C=O) [38], and reduction in the band close to ~1080 cm−1 associated with COC (see Fig. 10). This series of changes in the FTIR spectrum suggests that during the swelling process the crosslinking bridges are mainly affected, explaining the reduction in the swelling capacity in second swells.
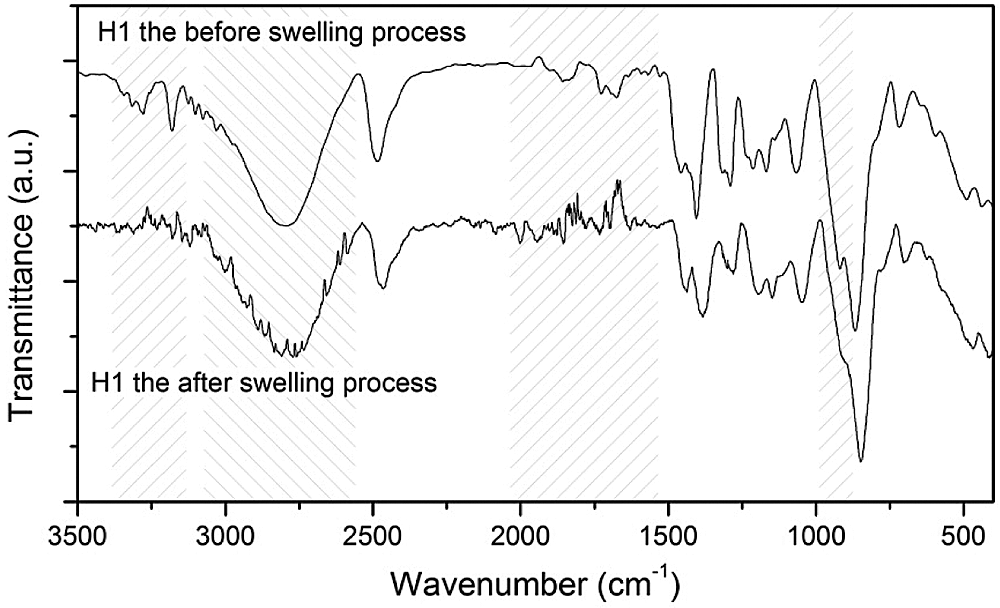
Figure 10: Comparison of FTIR spectra before and after the swelling process
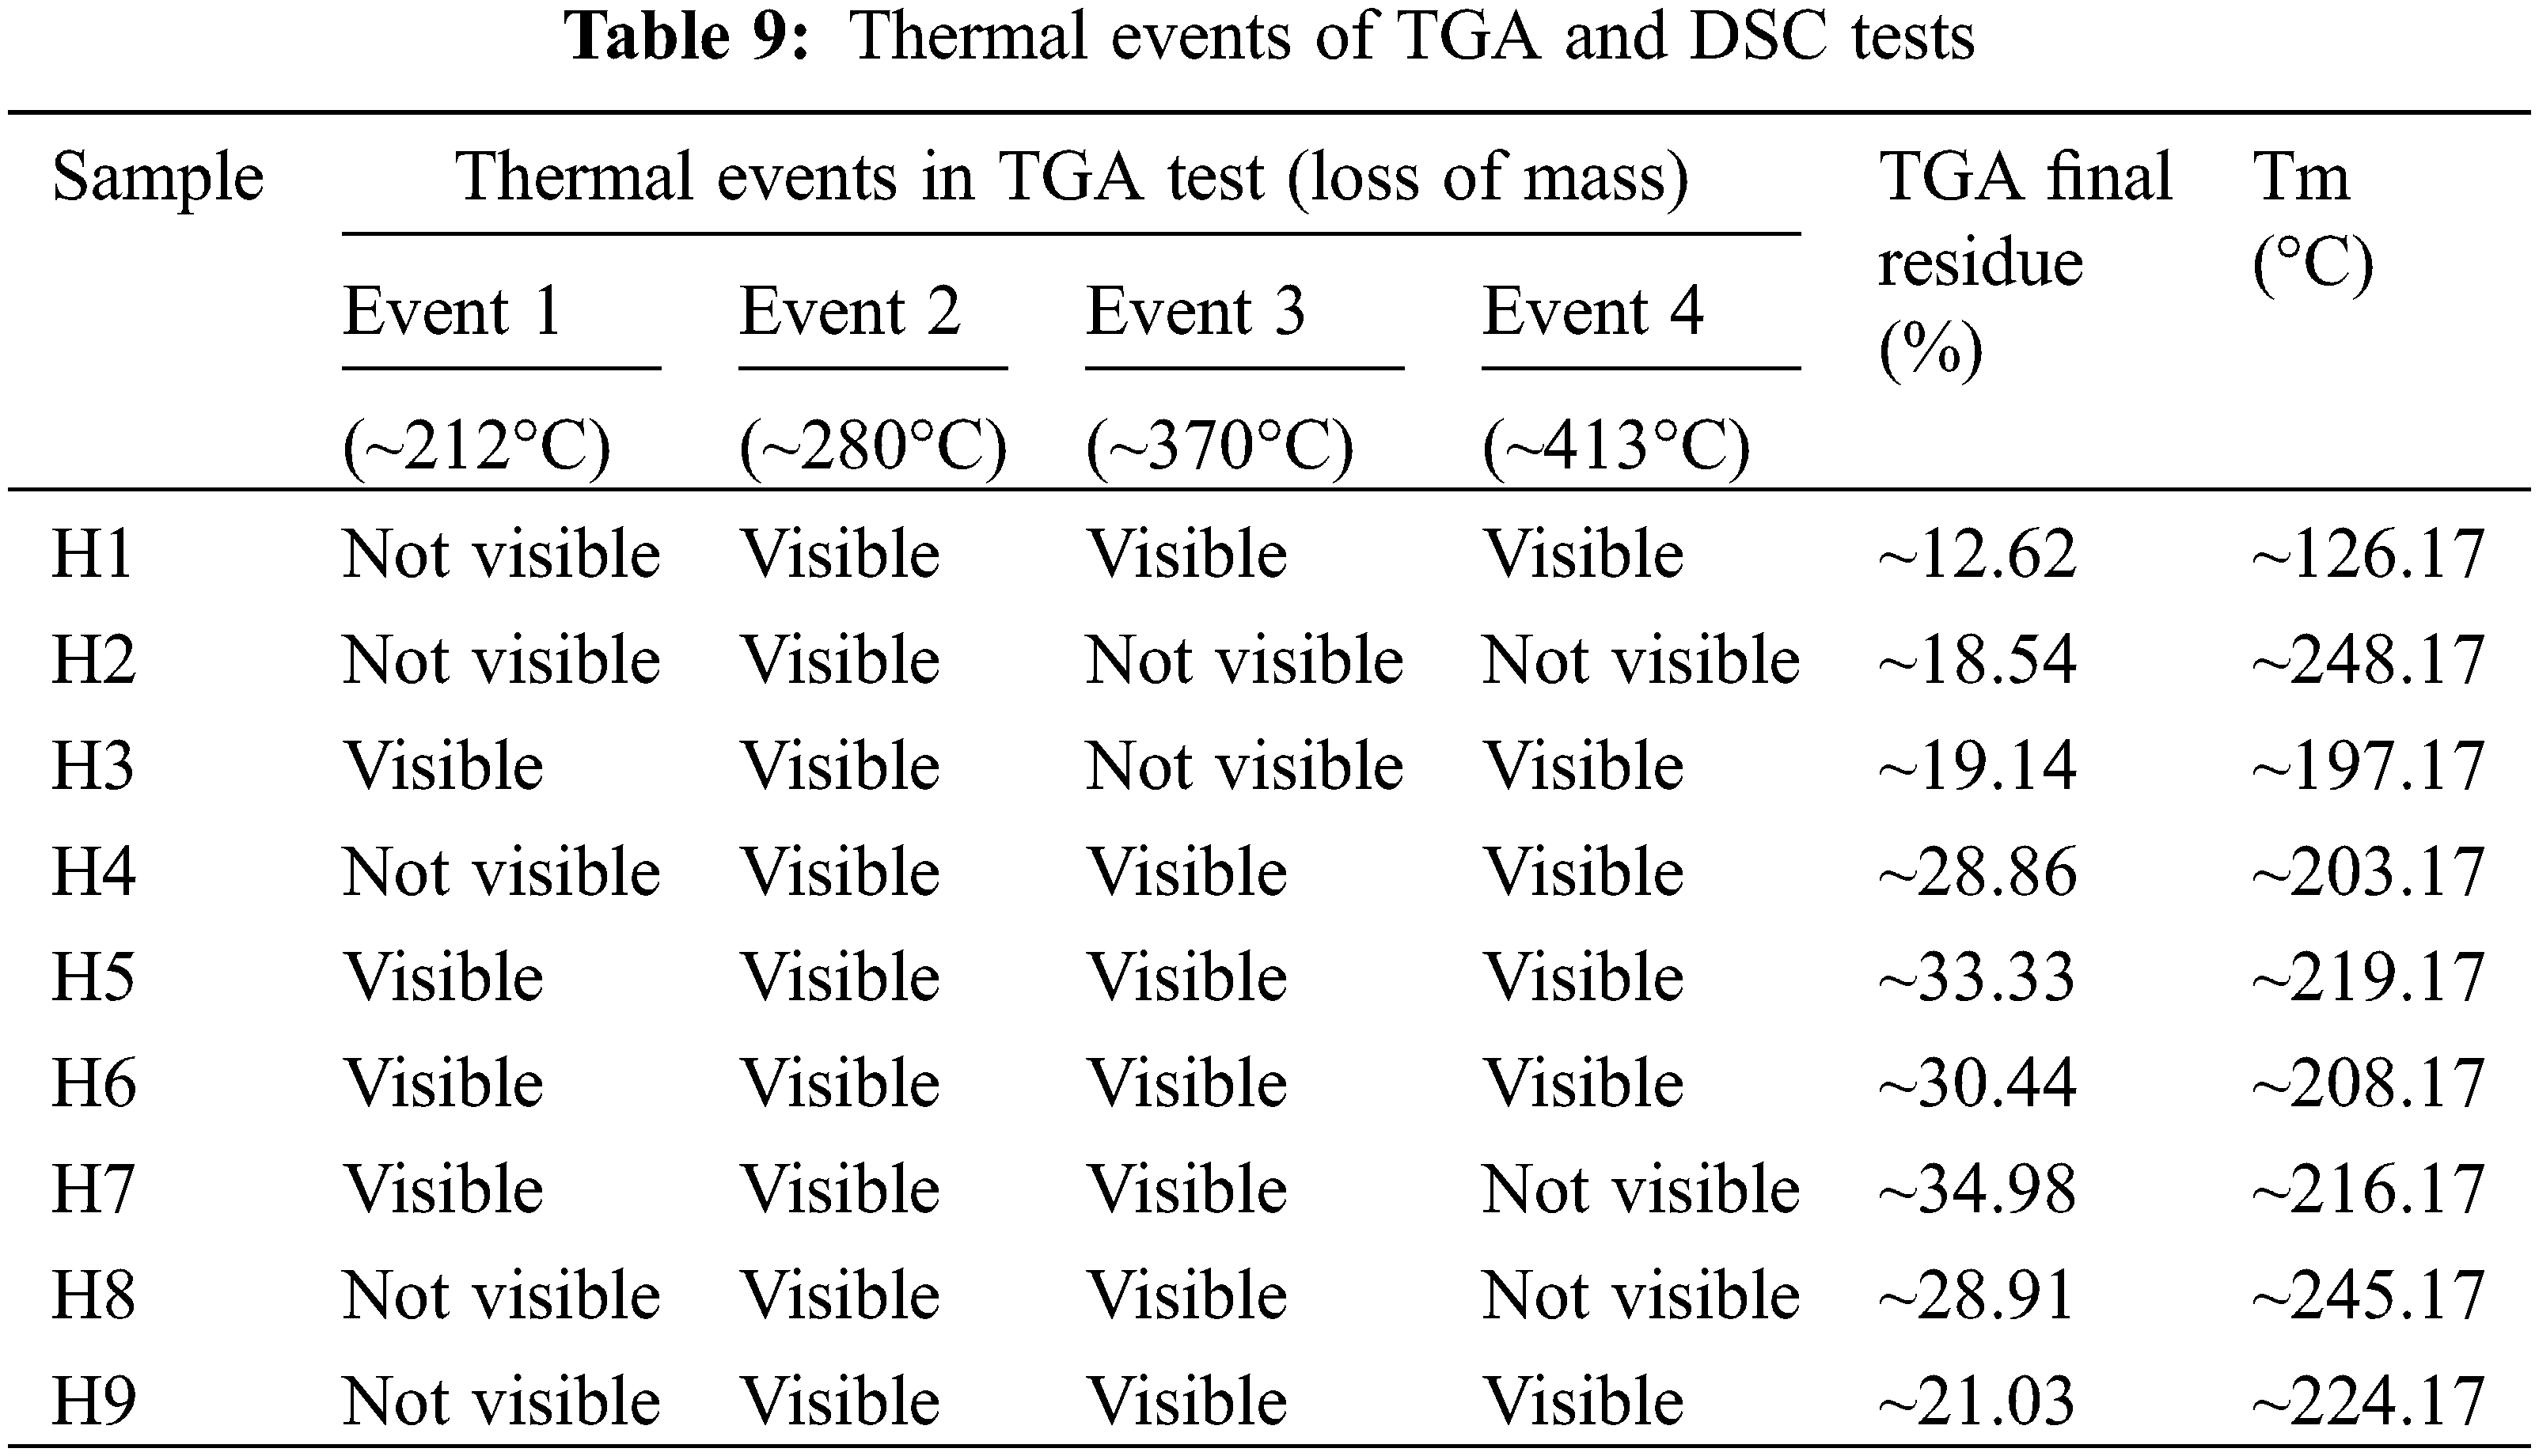
The TGA thermograms can be observed in Fig. 11A, in these curves, it can be seen that each sample presents several mass losses that can be confirmed and defined with their respective first derivatives, see Fig. 11B and Table 9. In this way, four main events were identified related to critical mass losses that are associated with the decomposition of the PVA side groups and the chain itself (~208°C and ~413°C), on the other hand, critical mass losses by decomposition of starch and their respective amylose and amylopectin fractions were identified at temperatures of ~212°C and ~370°C, respectively. It should be noted that these events were not fully evidenced in all the TGA tests of the studied samples (see Fig. 11A and Table 9), this possibly due to the differences between compositions of the samples and due to the washes carried out that could remove fractions in different proportions that did not react during the synthesis.
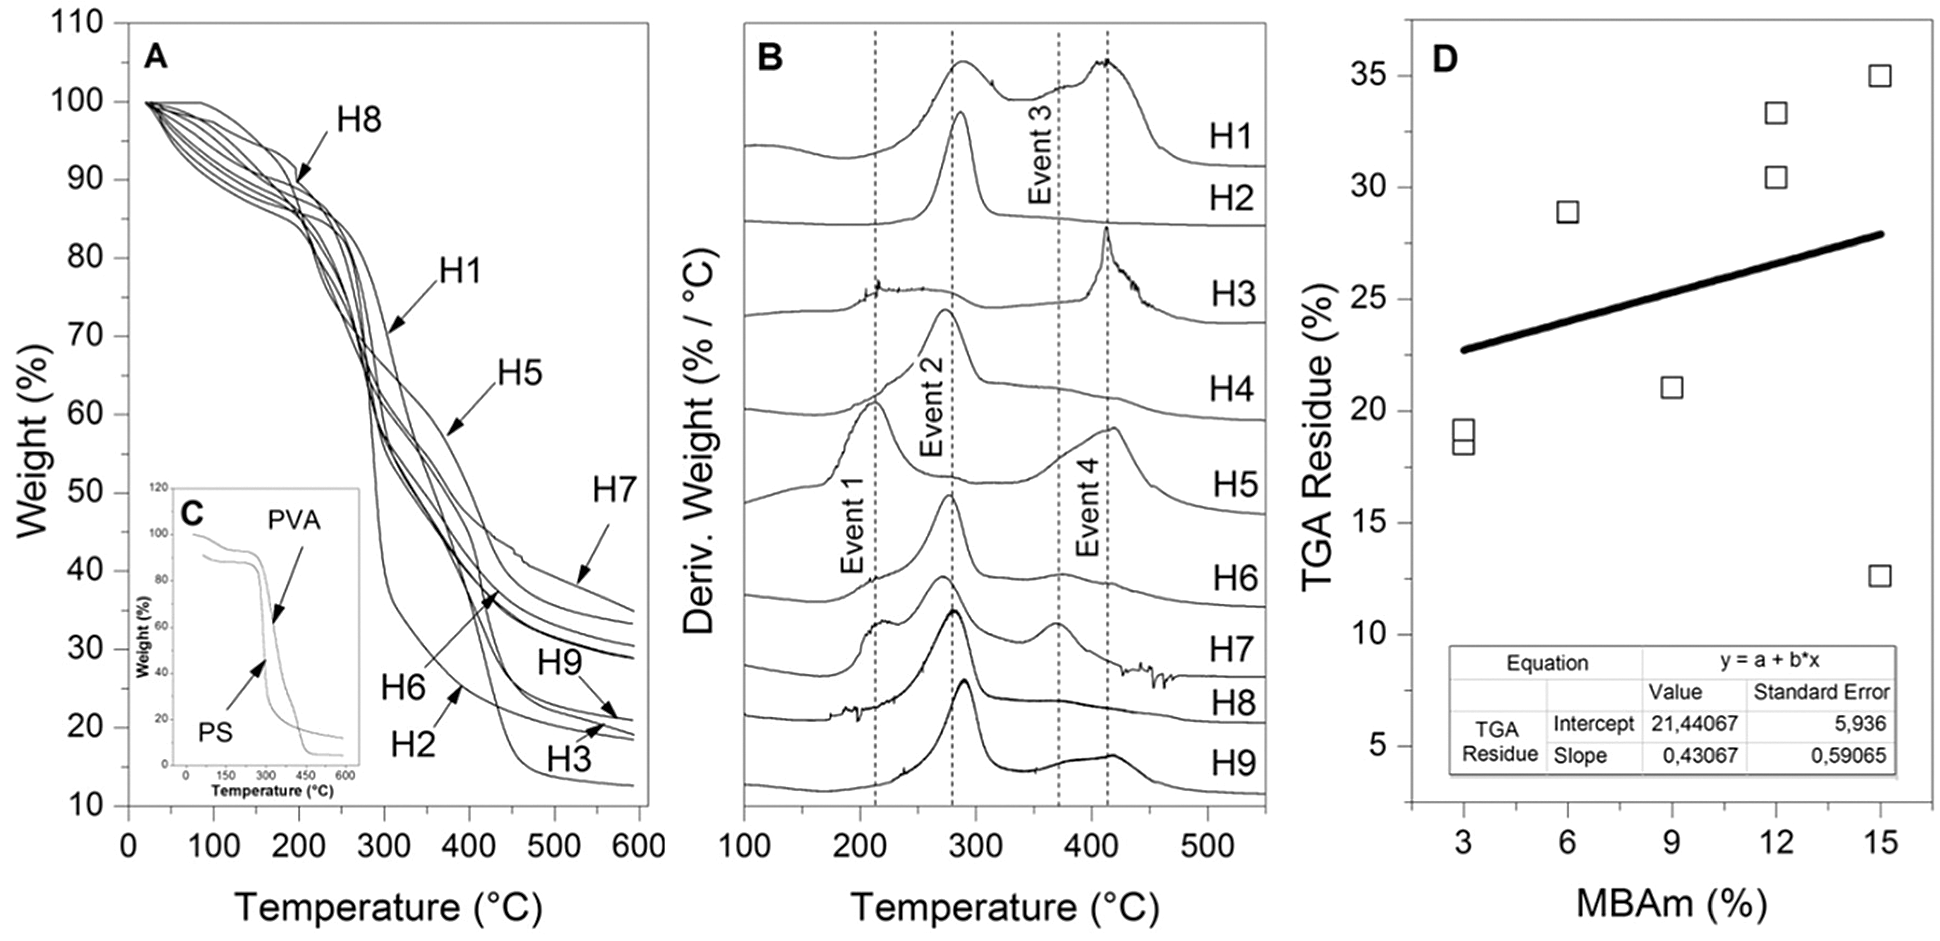
Figure 11: Thermal results. (A) TGA curves of hydrogels, (B) Derivative weight, (C) TGA curves of pure components, and (D) Residue of TGA test vs. MBAm
In the same way, Fig. 11A allows appreciating the percentage residues of the samples generated at the end of the thermal treatment of the TGA, these residues were examined finding an apparent relationship between the percentage of residue and the amount of MBAm incorporated in the synthesis. In this context, the percentage residuals generated in the TGA tests were plotted as a function of the amount of MBAm incorporated at the time of synthesis and treated by linear adjustment, see Fig. 11D. These results suggest a possible relationship between the amount of crosslinker and the thermal stability of the hydrogels; similar behavior was reported in other cross-linked polymeric works [39–44]. Increasing thermal stability in the function of the incorporation of MBAm is another evidence, together with the FTIR technique, for successful cross-linking of hydrogels. Also suggests that the crosslinker coupled to other structures such as PVA and PS can induce an improvement of thermal stability when compared to the performance of pure PVA and PS, see Fig. 11C.
Fig. 12A shows the DSC thermograms of the hydrogels referring to the second heating, in these thermograms events were identified in the form of endothermic peaks associated with the melting temperature, which manifest themselves at different temperatures, see Table 9. This behavior indicates the alteration in crystallinity that may be due to the change in the degree of crosslinking in the hydrogel, which implies a change as a function of the amount of crosslinking incorporated during the synthesis. These observed changes in crystallinity support previous studies where agents incorporated into PVA affect observable transitions in DSC tests, generating transition temperature shifts as in the case of melting point [10,45–49].
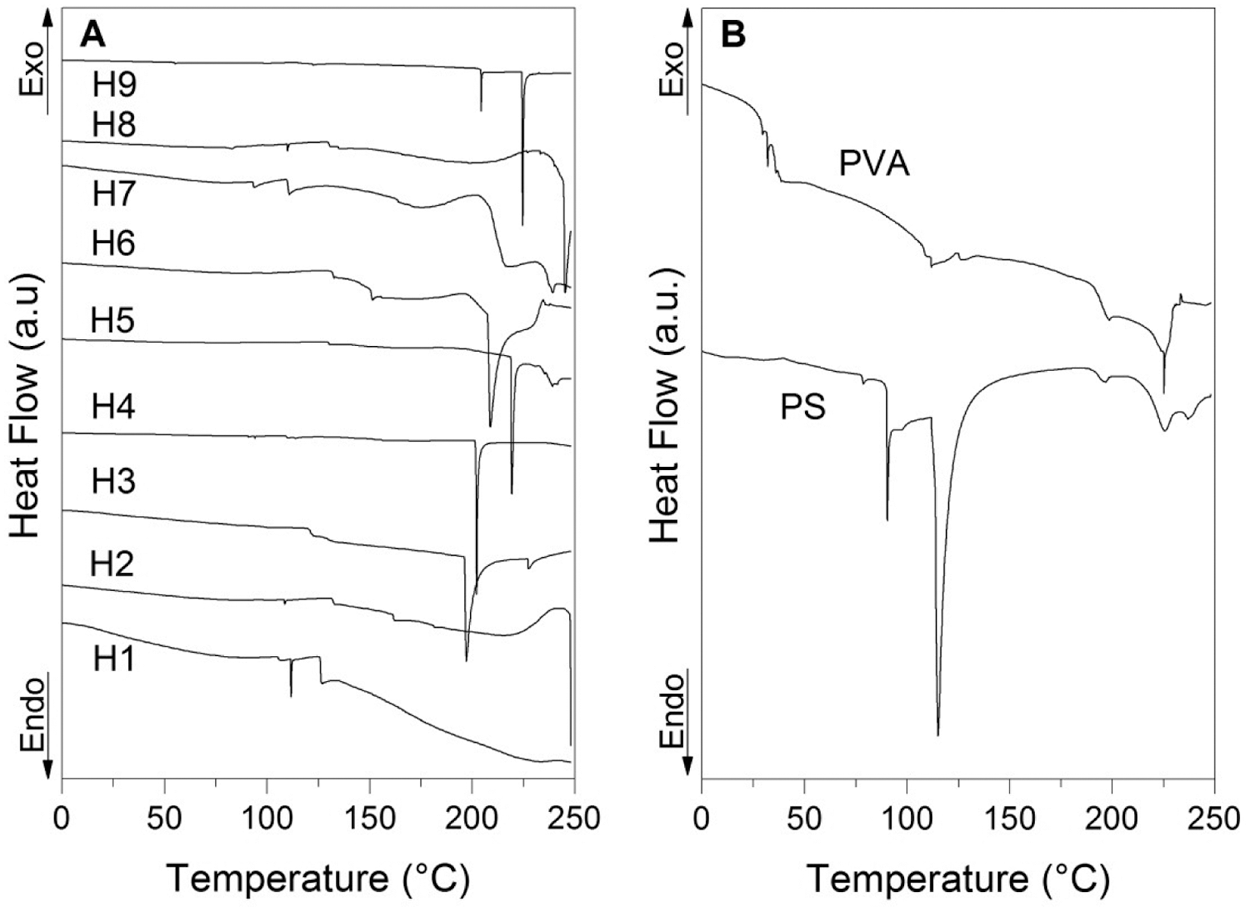
Figure 12: DSC thermograms: (A) DSC curves of hydrogels and (B) PVA and PS
Figs. 13–15 show the SEM micrographs of the hydrogels named H2, H5, and H9, respectively, these micrographs were selected based on their swelling potential (high, medium, and low). In general, all the presented micrographs of the hydrogels show morphological characteristics of a composite material wherein the polymeric matrix constituted by PVA is visualized, integrating dispersed phases constituted by aggregate PS. In most micrographs, the PVA polymer phase is characterized by predominantly smooth surfaces and the dispersed phase (PS) is characterized by having curved or flat granules with variable roughness and have spherical, polygonal, and oval shapes, morphological characteristics previously recorded in the literature [13,50]. Additionally, the polydispersity of the dispersed phase within the polymeric matrix is observed to be homogeneous with some agglomerations possibly produced in the drying and washing processes, however, the aggregates are present throughout the matrix.
Looking at it the other way, it can be seen in Figs. 13–15 various pores represented as black irregular dots or dark irregular cavities scattered in the matrix, additionally, an increase in the presence of pores is observed with the decrease of the PVA content and with the increase of the PS. Likewise, the presence of greater amounts of porosity is observed in the spaces of the agglomerated PS aggregate particles.
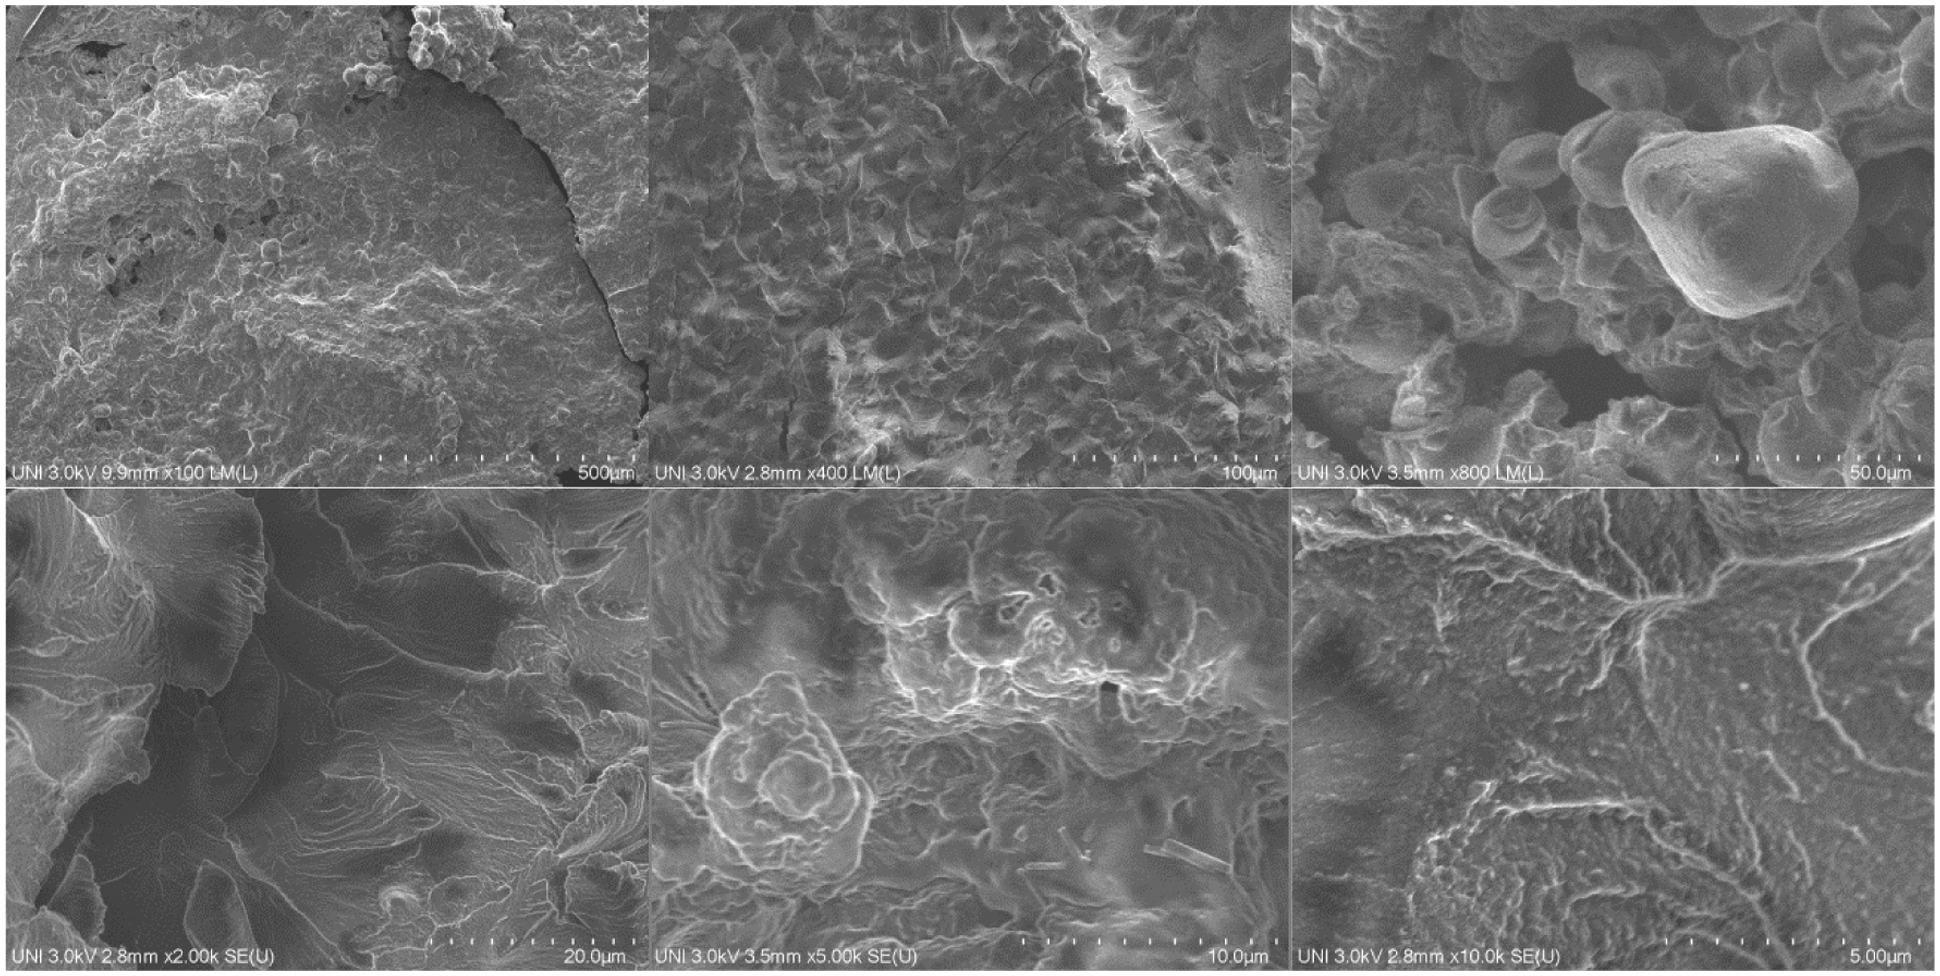
Figure 13: SEM micrographs of hydrogels H2
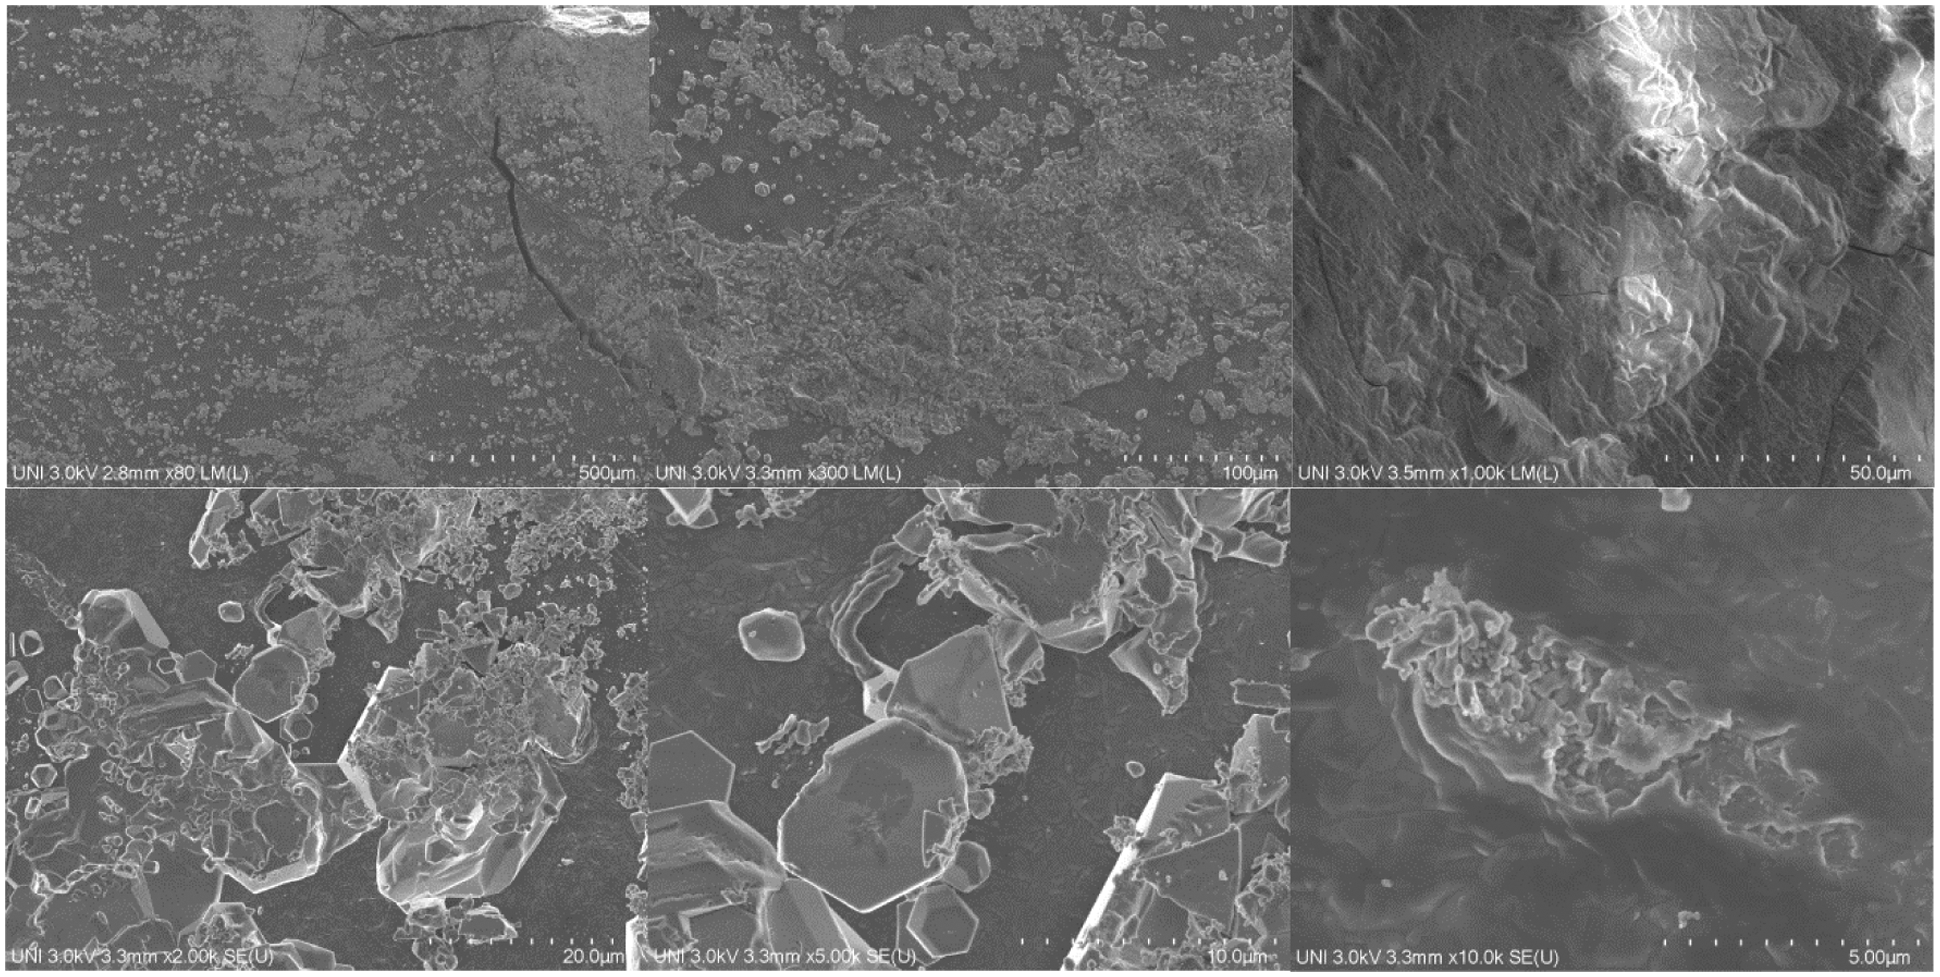
Figure 14: SEM micrographs of hydrogels H5
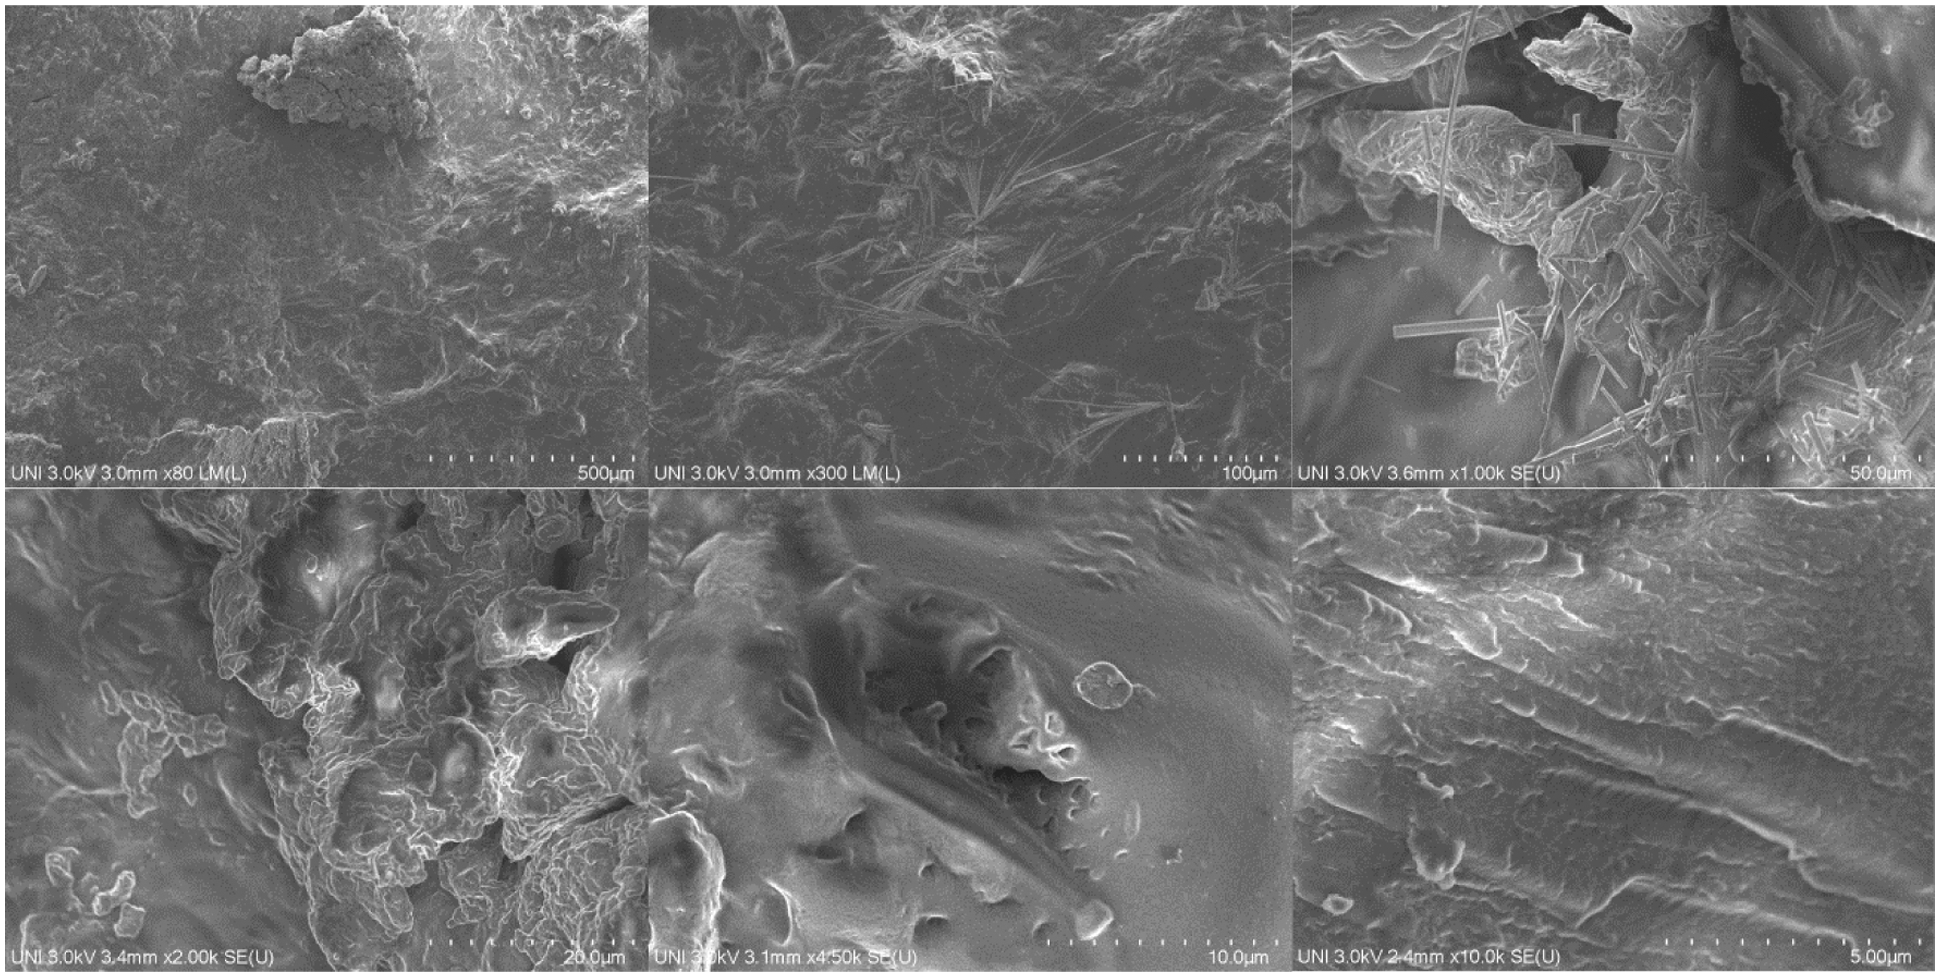
Figure 15: SEM micrographs of hydrogels H9
Different hydrogels were synthesized by free-radical polymerization in an aqueous medium based on potato starch (PS), poly(vinyl alcohol) (PVA), and N,N′-Methylenebisacrylamide (MBAm). Thermal and spectroscopic characterizations made it possible to determine the crosslinking of the raw materials, showing the viability of the synthesis and consequently the obtaining of hydrogels.
The results of swelling and deswelling of different hydrogels demonstrate that the synthesized material suffering irreversible disruptions and transitions after the first swelling and deswelling decreasing the degree of swelling. In addition, Schott’s pseudo-second order swelling kinetics model fits the experimental results, however, the model loses affinity with the second swelling, generating a loss of relative precision, which must be considered when performing this type of cyclical test.
The results generated in the water retention tests in samples made up of soil and hydrogel show the effectiveness of the hydrogel in reducing the loss of water by different mechanisms (leaching, filtration, evaporation, and/or transpiration). These results indicate that the retention of water in the soil with the help of the hydrogel can reach approximately 2.5 times the period concerning pure soil in conditions of high environmental temperatures, this information suggests that this retained water can be used by organisms that depend on this resource in the soil.
The complementary characterizations developed and the proposed statistical model allow the generation or formulation of desired absorbent hydrogels, based on potato starch, poly(vinyl alcohol), and N,N′-methylenebisacrylamide, in technical terms and cost/benefit criteria for specific purposes.
Acknowledgement: Special thanks and gratitude dedicated to Dr. J. Quispe and Dr. H. Loro for their valuable support, and to the Centro de Investigaciones Tecnológicas, Biomédicas y Medioambientales (CITBM), and the Laboratorio de Investigación en Control y Análisis de aguas, and the Laboratorio de Investigación en Nanotecnología de Alimentos of Jose Maria Arguedas National University.
Funding Statement: Authors are grateful to Concytec-Peru and the World Bank for the financial support of this project under the call “Mejoramiento y Ampliación de los Servicios del Sistema Nacional de Ciencia Tecnología e Innovación Tecnológica” 8682-PE, through Fondecyt Grant 017-2019 FONDECYT BM INC.INV.
Conflicts of Interest: The authors declare that they have no conflicts of interest to report regarding the present study.
1. Ullah, K., Sohail, M., Murtaza, G., Khan, S. A. (2018). Natural and synthetic materials based CMCh/PVA hydrogels for oxaliplatin delivery: Fabrication, characterization, In-Vitro and In-Vivo safety profiling. International Journal of Biological Macromolecules, 122(3), 538–548. DOI 10.1016/j.ijbiomac.2018.10.203. [Google Scholar] [CrossRef]
2. Wen, N., Jiang, B., Wang, X., Shang, Z., Jiang, D. et al. (2020). Overview of polyvinyl alcohol nanocomposite hydrogels for electro-skin, actuator, supercapacitor and fuel cell. The Chemical Record, 20(8), 773–792. DOI 10.1002/tcr.202000001. [Google Scholar] [CrossRef]
3. Rafeeka, M. R., Rabatb, N. E., Yahyab, W. Z. N., Ghania, M. A. (2019). Adsorption and desorption of nickel (II) ion by oil palm empty fruit bunch grafted polyvinyl alcohol hydrogel. Chemical Engineering, 72, 175–180. DOI 10.3303/CET1972030. [Google Scholar] [CrossRef]
4. Baghaie, S., Khorasani, M. T., Zarrabi, A., Moshtaghian, J. (2017). Wound healing properties of PVA/starch/chitosan hydrogel membranes with nano Zinc oxide as antibacterial wound dressing material. Journal of Biomaterials Science, Polymer Edition, 28(18), 2220–2241. DOI 10.1080/09205063.2017.1390383. [Google Scholar] [CrossRef]
5. Sirousazar, M., Ghanizadeh, E., Rezazadeh, B., Abbasi-Chianeh, V., Kheiri, F. (2019). Polymeric hydrogel pipes for irrigation application. Journal of Polymers and the Environment, 27(12), 2842–2852. DOI 10.1007/s10924-019-01567-z. [Google Scholar] [CrossRef]
6. Anagha, B., George, D., Maheswari, P. U., Begum, K. M. S. (2019). Biomass derived antimicrobial hybrid cellulose hydrogel with green ZnO nanoparticles for curcumin delivery and its kinetic modelling. Journal of Polymers and the Environment, 27(9), 2054–2067. DOI 10.1007/s10924-019-01495-y. [Google Scholar] [CrossRef]
7. Huang, M., Hou, Y., Li, Y., Wang, D., Zhang, L. (2017). High performances of dual network PVA hydrogel modified by PVP using borax as the structure-forming accelerator. Designed Monomers and Polymers, 20(1), 505–513. DOI 10.1080/15685551.2017.1382433. [Google Scholar] [CrossRef]
8. Zulfiqar, M., Lee, S. Y., Mafize, A. A., Adlin, N., Abdul, M. (2020). Efficient removal of Pb (II) from aqueous solutions by using oil palm bio-waste/MWCNTs reinforced PVA hydrogel composites: Kinetic, isotherm and thermodynamic modeling. Polymers, 12(2), 430. DOI 10.3390/polym12020430. [Google Scholar] [CrossRef]
9. Bai, H., Li, Z., Zhang, S., Wang, W., Dong, W. (2018). Interpenetrating polymer networks in polyvinyl alcohol/cellulose nanocrystals hydrogels to develop absorbent materials. Carbohydrate Polymers, 200, 468–476. DOI 10.1016/j.carbpol.2018.08.041. [Google Scholar] [CrossRef]
10. Liu, P., Chen, W., Liu, C., Tian, M., Liu, P. (2019). A novel poly (vinyl alcohol)/poly (ethylene glycol) scaffold for tissue engineering with a unique bimodal open-celled structure fabricated using supercritical fluid foaming. Scientific Reports, 9(1), 1–12. DOI 10.1038/s41598-019-46061-7. [Google Scholar] [CrossRef]
11. Tang, X., Alavi, S. (2011). Recent advances in starch, polyvinyl alcohol based polymer blends, nanocomposites and their biodegradability. Carbohydrate Polymers, 85(1), 7–16. DOI 10.1016/j.carbpol.2011.01.030. [Google Scholar] [CrossRef]
12. Clerici, M. T. P. S., Schmiele, M. (2018). Starches for food application: Chemical, technological and health properties. Campinas: Academic Press. [Google Scholar]
13. Benavent-Gil, Y., Rosell, C. M. (2017). Morphological and physicochemical characterization of porous starches obtained from different botanical sources and amylolytic enzymes. International Journal of Biological Macromolecules, 103(1), 587–595. DOI 10.1016/j.ijbiomac.2017.05.089. [Google Scholar] [CrossRef]
14. Saari, H., Rayner, M., Wahlgren, M. (2019). Effects of starch granules differing in size and morphology from different botanical sources and their mixtures on the characteristics of pickering emulsions. Food Hydrocolloids, 89(2), 844–855. DOI 10.1016/j.foodhyd.2018.11.063. [Google Scholar] [CrossRef]
15. El Halal, S. L., Bruni, G. P., do Evangelho, J. A., Biduski, B., Silva, F. T. et al. (2018). The properties of potato and cassava starch films combined with cellulose fibers and/or nanoclay. Starch-Stärke, 70(1–2), 1700115. DOI 10.1002/star.201700115. [Google Scholar] [CrossRef]
16. Shafqat, A., Tahir, A., Mahmood, A., Tabinda, A. B., Yasar, A. et al. (2020). A review on environmental significance carbon foot prints of starch based bio-plastic: A substitute of conventional plastics. Biocatalysis and Agricultural Biotechnology, 27(14), 101540. DOI 10.1016/j.bcab.2020.101540. [Google Scholar] [CrossRef]
17. Arum K. S., Prastiti E. C., Trisanti P. N., Sumarno S. (2020). Preparation of starch-graft-acrylic acid/bentonite composite gel. AIP Conference Proceedings, 2237, 1–6. DOI 10.1063/5.0006169. [Google Scholar] [CrossRef]
18. Biduski, B., da Silva, W. M. F., Colussi, R., El Halal, S. L. D. M., Lim, L. T. et al. (2018). Starch hydrogels: The influence of the amylose content and gelatinization method. International Journal of Biological Macromolecules, 113, 443–449. DOI 10.1016/j.ijbiomac.2018.02.144. [Google Scholar] [CrossRef]
19. Abdullah, H. D., Chalimah, A. S., Primadona, I., Hanantyo, M. H. G. (2018). Physical and chemical properties of corn, cassava, and potato starchs. IOP Publishing, 160, 1–6. DOI 10.1088/1755-1315/160/1/012003. [Google Scholar] [CrossRef]
20. Dankar, I., Haddarah, A., Omar, F. E. L., Sepulcre, F. (2018). Characterization of food additive-potato starch complexes by FTIR and X-ray diffraction. Food Chemistry, 260(2), 7–12. DOI 10.1016/j.foodchem.2018.03.138. [Google Scholar] [CrossRef]
21. Zhang, H., Huang, X., Jiang, J., Shang, S., Song, Z. (2017). Hydrogels with high mechanical strength cross-linked by a rosin-based crosslinking agent. RSC Advances, 7(67), 42541–42548. DOI 10.1039/C7RA08024G. [Google Scholar] [CrossRef]
22. Fekete, T., Borsa, J., Takács, E., Wojnárovits, L. (2014). Synthesis of cellulose-based superabsorbent hydrogels by high-energy irradiation in the presence of crosslinking agent. Radiation Physics and Chemistry, 118, 114–119. DOI 10.1016/j.radphyschem.2015.02.023. [Google Scholar] [CrossRef]
23. Kordjazi, S., Kamyab, K., Hemmatinejad, N. (2020). Super-hydrophilic/oleophobic chitosan/acrylamide hydrogel: An efficient water/oil separation filter. Advanced Composites and Hybrid Materials, 3(2), 167–176. DOI 10.1007/s42114-020-00150-8. [Google Scholar] [CrossRef]
24. Hassan, A., Bilal, M., Niazi, K., Hussain, A., Farrukh, S. (2017). Development of anti-bacterial PVA/starch based hydrogel membrane for wound dressing. Journal of Polymers and the Environment, 26(1), 235–243. DOI 10.1007/s10924-017-0944-2. [Google Scholar] [CrossRef]
25. Olad, A., Doustdar, F., Gharekhani, H. (2018). Starch-based semi-IPN hydrogel nanocomposite integrated with clinoptilolite: Preparation and swelling kinetic study. Carbohydrate Polymers, 200(3), 516–528. DOI 10.1016/j.carbpol.2018.08.014. [Google Scholar] [CrossRef]
26. Ghasemzadeh, H., Ghanaat, F. (2014). Antimicrobial alginate/PVA silver nanocomposite hydrogel, synthesis and characterization. Journal of Polymer Research, 21(3), 1–14. DOI 10.1007/s10965-014-0355-1. [Google Scholar] [CrossRef]
27. Singh, B., Sharma, V. (2010). Design of psyllium-PVA–acrylic acid based novel hydrogels for use in antibiotic drug delivery. International Journal of Pharmaceutics, 389(1–2), 94–106. DOI 10.1016/j.ijpharm.2010.01.022. [Google Scholar] [CrossRef]
28. Braşoveanu, M., Nemţanu, M. R., Duţă, D. (2013). Electron-beam processed corn starch: Evaluation of physicochemical and structural properties and technical-economic aspects of the processing. Brazilian Journal of Chemical Engineering, 30(4), 847–856. DOI 10.1590/S0104-66322013000400016. [Google Scholar] [CrossRef]
29. Wang, L., Wang, W., Wang, Y., Xiong, G., Mei, X. et al. (2018). Effects of fatty acid chain length on properties of potato starch-fatty acid complexes under partially gelatinization. International Journal of Food Properties, 21(1), 2121–2134. DOI 10.1080/10942912.2018.1489842. [Google Scholar] [CrossRef]
30. Reddy, B. V., Rao, G. R. (2008). Vibrational spectra and modified valence force field for N,N′-methylenebisacrylamide. Indian Journal of Pure and Applied Physics, 46, 611–616. ISSN 0019-5596. [Google Scholar]
31. Batool, S., Hussain, Z., Niazi, M. B. K., Liaqat, U., Afzal, M. (2019). Biogenic synthesis of silver nanoparticles and evaluation of physical and antimicrobial properties of Ag/PVA/starch nanocomposites hydrogel membranes for wound dressing application. Journal of Drug Delivery Science and Technology, 52(3), 403–414. DOI 10.1016/j.jddst.2019.05.016. [Google Scholar] [CrossRef]
32. Ahmed, A., Niazi, M. B. K., Jahan, Z., Samin, G., Pervaiz, E. et al. (2020). Enhancing the thermal, mechanical and swelling properties of PVA/starch nanocomposite membranes incorporating g-C3N4. Journal of Polymers and the Environment, 28(1), 100–115. DOI 10.1007/s10924-019-01592-y. [Google Scholar] [CrossRef]
33. Ahmed, A., Niazi, M. B. K., Jahan, Z., Ahmad, T., Hussain, A. et al. (2020). In-vitro and in-vivo study of superabsorbent PVA/Starch/g-C3N4/Ag@TiO2 NPs hydrogel membranes for wound dressing. European Polymer Journal, 130, 109650. DOI 10.1016/j.eurpolymj.2020.109650. [Google Scholar] [CrossRef]
34. Ounkaew, A., Kasemsiri, P., Jetsrisuparb, K., Uyama, H., Hsu, Y. I. et al. (2020). Synthesis of nanocomposite hydrogel based carboxymethyl starch/polyvinyl alcohol/nanosilver for biomedical materials. Carbohydrate Polymers, 248, 116767. DOI 10.1016/j.carbpol.2020.116767. [Google Scholar] [CrossRef]
35. Pang, S. C., Chin, S. F., Tay, S. H., Tchong, F. M. (2011). Starch-maleate–polyvinyl alcohol hydrogels with controllable swelling behaviors. Carbohydrate Polymers, 84(1), 424–429. DOI 10.1016/j.carbpol.2010.12.002. [Google Scholar] [CrossRef]
36. Shukla, S., Bajpai, A. K., Kulkarni, R. A. (2005). Preparation, characterization, and water-sorption study of polyvinyl alcohol based hydrogels with grafted hydrophilic and hydrophobic segments. Journal of Applied Polymer Science, 95(5), 1129–1142. DOI 10.1002/app.21344. [Google Scholar] [CrossRef]
37. Zhai, M., Yoshii, F., Kume, T., Hashim, K. (2002). Syntheses of PVA/starch grafted hydrogels by irradiation. Carbohydrate Polymers, 50(3), 295–303. DOI 10.1016/S0144-8617(02)00031-0. [Google Scholar] [CrossRef]
38. Altaf, F., Bilal, M., Niazi, K., Jahan, Z., Ahmad, T. et al. (2020). Synthesis and characterization of PVA/starch hydrogel membranes incorporating essential oils aimed to be used in wound dressing applications. Journal of Polymers and the Environment, 29(1), 156–174. DOI 10.1007/s10924-020-01866-w. [Google Scholar] [CrossRef]
39. Ebadi, S. V., Fakhrali, A., Ranaei-Siadat, S. O., Gharehaghaji, A. A., Mazinani, S. et al. (2015). Immobilization of acetylcholinesterase on electrospun poly(acrylic acid)/multi-walled carbon nanotube nanofibrous membranes. RSC Advances, 5(53), 42572–42579. DOI 10.1039/C5RA03456F. [Google Scholar] [CrossRef]
40. Azizi, H., Barzin, J., Morshedian, J. (2007). Silane crosslinking of polyethylene: The effects of EVA, ATH and Sb2O3 on properties of the production in continuous grafting of LDPE. Express Polymer Letters, 1(6), 378–384. DOI 10.3144/expresspolymlett.2007.53. [Google Scholar] [CrossRef]
41. Pan, Y., Liu, L., Zhang, Y., Song, L., Hu, Y. et al. (2019). Effect of genipin crosslinked layer-by-layer self-assembled coating on the thermal stability, flammability and wash durability of cotton fabric. Carbohydrate Polymers, 206(3), 396–402. DOI 10.1016/j.carbpol.2018.11.037. [Google Scholar] [CrossRef]
42. Yu, C., Tang, X., Liu, S., Yang, Y., Shen, X. et al. (2018). Laponite crosslinked starch/polyvinyl alcohol hydrogels by freezing/thawing process and studying their cadmium ion absorption. International Journal of Biological Macromolecules, 117(3), 1–6. DOI 10.1016/j.ijbiomac.2018.05.159. [Google Scholar] [CrossRef]
43. Sun, S., Liu, P., Ji, N., Hou, H., Dong, H. (2018). Effects of various cross-linking agents on the physicochemical properties of starch/PHA composite films produced by extrusion blowing. Food Hydrocolloids, 77(10), 964–975. DOI 10.1016/j.foodhyd.2017.11.046. [Google Scholar] [CrossRef]
44. Guo, Y., Zeng, X., Lai, X., Li, H. (2018). Enhancement of tracking and erosion resistance of silicone rubber with platinum/amino-silane by modulation of crosslinking density. IEEE Transactions on Dielectrics and Electrical Insulation, 25(2), 741–748. DOI 10.1109/TDEI.2017.007016. [Google Scholar] [CrossRef]
45. Hu, X. Q., Ye, D. Z., Tang, J. B., Zhang, L. J., Zhang, X. (2016). From waste to functional additives: Thermal stabilization and toughening of PVA with lignin. RSC Advances, 6(17), 13797–13802. DOI 10.1039/C5RA26385A. [Google Scholar] [CrossRef]
46. Xiang, A., Wang, H., Liu, D., Ma, S., Zhang, X. et al. (2018). Melt processing of high alcoholysis poly(vinyl alcohol) with different polyol plasticizers. Journal of Polymer Engineering, 38(7), 659–665. DOI 10.1515/polyeng-2017-0304. [Google Scholar] [CrossRef]
47. Liu, Y., Wei, H., Wang, Z., Li, Q., Tian, N. (2018). Simultaneous enhancement of strength and toughness of PLA induced by miscibility variation with PVA. Polymers, 10(10), 1178. DOI 10.3390/polym10101178. [Google Scholar] [CrossRef]
48. Uto, K., Ebara, M., Aoyagi, T. (2014). Temperature-responsive poly (ε-caprolactone) cell culture platform with dynamically tunable nano-roughness and elasticity for control of myoblast morphology. International Journal of Molecular Sciences, 15(1), 1511–1524. DOI 10.3390/ijms15011511. [Google Scholar] [CrossRef]
49. Ozturk, M. K., Nergis, B., Candan, C. (2018). Thermal analysis of PVA nanofibrous membranes. IOP Conference Series: Materials Science and Engineering, 460(1), 12048. DOI 10.1088/1757-899X/460/1/012048. [Google Scholar] [CrossRef]
50. Salcedo, J., Contreras, K. (2017). Agroindustria de productos amiláceos: Métodos y técnicas de caracterización. Sincelejo: Universidad de Sucre. [Google Scholar]
 | This work is licensed under a Creative Commons Attribution 4.0 International License, which permits unrestricted use, distribution, and reproduction in any medium, provided the original work is properly cited. |