| Journal of Renewable Materials |
DOI: 10.32604/jrm.2022.019660
ARTICLE
Study on Acoustic Emission Characteristics of Self-Compacting Concrete under Uniaxial Compression Test
1College of Water Resources & Civil Engineering, China Agricultural University, Beijing, 100083, China
2School of Engineering and Technology, China University of Geosciences, Beijing, 100083, China
*Corresponding Author: Yongshuai Sun. Email: cugbsys@163.com
Received: 07 October 2021; Accepted: 01 December 2021
Abstract: To study the relationship between acoustic emission characteristic parameters of self-compacting concrete(SCC) and its destruction evolution, under uniaxial compression, acoustic emission(AE) tests are performed on C30 self-compacting concrete test blocks that are preserved for 7 days and 28 days, the corresponding relationship among energy, amplitude, ring count and different failure stages of the specimens are analyzed by AE experiment, and the spatial distribution of AE in each stage is described by introducing location map. The test shows that there are two rules for the failure of SCC specimens cured for 7 days and 28 days: (1) The first failure law is divided into four stages according to the percentage of the stress value reaching the limit stress: Initial stage: above 10%, the compaction time of test block cured for 28 days is relatively low; Elastic failure stage: 30%–35%, the cumulative value of each parameter increases linearly, and the cumulative value of the amplitude is the largest; Crack stable propagation stage: 35%–90%, there is a moment that causes local stress concentration in both test blocks; Active stage: above 90%, the cumulative value of the parameter rises sharply, then continues to load the test block instability and damage. (2) The second failure law is divided into five stages according to the percentage of the stress value reaching the limit stress: Initial stage: 15%–20%, the cumulative value of each parameter increases with time; Elastic failure stage: 20%–40%, the cumulative value of the parameter continues to grow, but the growth curve is approximately parallel; Crack stable propagation stage: 40%–60%, all parameters increased sharply and the increase reached the peak of the whole process; A stable state: 60–80%, the emission characteristic parameter will become zero, and the stable state of the 28 days curing test block is lagging; Active stage: above 90%, the number of signals increased sharply, but the energy and amplitude are low, and the later test block is completely fractured. (3) In the process of failure, the test block of SCC will form an inverted triangle or landslide failure surface, and the part above the failure surface is prone to failure, and there is a tendency to leave the test block. (4) Under uniaxial compression, the penetration of SCC cracks is mostly shear penetration.
Keywords: Acoustic emission; change rule; damage localization; self-compacting concrete; uniaxial compression
Self-compacting concrete is a new composite material developed based on ordinary concrete, which can be compacted and formed by using its gravity, and has excellent construction performance [1], after experimental research, its mechanical behavior is related to the added fiber content [2].
Some researchers compare and analyze the impact compression failure mode of SCC with different rubber content [3], measure the load-displacement curve of rubber self-compacting concrete [4], and analyze the influence of various factors on the physical properties of steel fiber self-compacting concrete by orthogonal experiment [5].
It can effectively solve some engineering problems [6] and it is widely applied in many major projects. In recent years [7], it becomes the new direction of development of concrete materials. Although it has good working performance, there are also some problems, that is, in the use of concrete structures, under the influence of external load, internal cracks, and cavity emergence and expansion, ultimately leading to the destruction of the structure, posing a threat to the safety of the project. Therefore, in the use of SCC materials, it is a problem to be solved to choose appropriate means to study the failure law and ensure the safety of concrete structures.
As a means of dynamic nondestructive testing [8], acoustic emission technology has been applied to the safety monitoring of civil engineering structures [9]. At the same time, some researchers have introduced this technology into the field of concrete for crack detection of concrete structures [10]. Some researchers [11–13] have made use of this technology to study ordinary concrete and obtained rich research results. Although the technology is widely used in the field of ordinary concrete, there are still some deficiencies in the study of SCC, especially the failure law of SCC. Therefore, it is necessary to use AE testing technology to study SCC.
In this paper, through the AE test of self-compacting concrete under uniaxial compression, the change law of acoustic emission parameters in the process of SCC failure is studied, the change characteristics of internal cracks of SCC under load are revealed, and the spatial location evolution law of cracks in the whole process of SCC failure is obtained, which provides the theory for the application of AE technology to the field of SCC. It also provides a practical basis for stability monitoring and damage warning of SCC.
2 Experiment Materials/Equipment and Test of Related Test
The materials used in the SCC mixture include powder materials, natural aggregates, admixtures, and additives. The powder material is ordinary portland cement (C-P.O 42.5) and density is 3100 kg/m3, initial setting time of more than 150 min, and final setting time of more than 240 min. The natural aggregates mainly include coarse aggregates and fine aggregates, the fine aggregate is river sand with a fineness modulus of 2.3–3.0, which with an apparent density of 2600 kg/m3, the coarse aggregate is nature gravel with an apparent density is 1600 kg/m3. The admixture is Grade


Figure 1: The photos of (a) single horizontal-axis forced concrete mixer and (b) finished SCC mixture
2.2 Test of Working Performance
The working performance of the concrete mixture is tested. The basic properties of self-compacting concrete include fluidity, filling, and gap passage [14], so slump flow, extension time T500, V-funnel time, and H2/H1 values are tested. The details of these tests are shown in Fig. 2.
The working performance values required [15–17] by the design code of self-compacting concrete and the values obtained by tests are shown in Table 2. The experiment shows that the workability of the prepared concrete mixture meets the specified working requirements, and the designed mix proportion scheme is scientific and feasible. Subsequent tests can be carried out with the prepared concrete.

Figure 2: The photos of (a) slump flow test (b) extension time T500 test (c) V-funnel test (d) L flow meter test

Two groups of SCC specimens (Group A1 and Group A2) with the specification of 150 × 150 × 150 mm are prepared for mix proportion. After 24 h, we remove the molds of the specimens and place them in the curing room for curing. Under the same curing conditions, Group A1 of SCC specimens are cured for 7 days and Group A2 of SCC specimens are cured for 28 days. The photo of SCC specimens in curing is shown in Fig. 3.

Figure 3: Self-compacting concrete specimens in curing
Before collecting the failure waveform of the specimens under uniaxial compression test conditions by using an acoustic emission system, the sound velocity calibration of the specimens of self-compacting concrete should be carried out by using a broken lead test, sensors are arranged on the surface of the self-compacting concrete specimens, the other end of the sensor is connected to the acoustic emission instrument and then the lead broken test is carried out. At the end of the broken lead test, the collected lead breaking waveform is processed, and then the sound velocity is calibrated. The photo of a broken lead test is shown in Fig. 4, sensors arrangement of a broken lead test is shown in Fig. 5, acoustic emission detection system is shown in Fig. 6.

Figure 4: Broken lead test

Figure 5: Sensor layout position of broken lead test
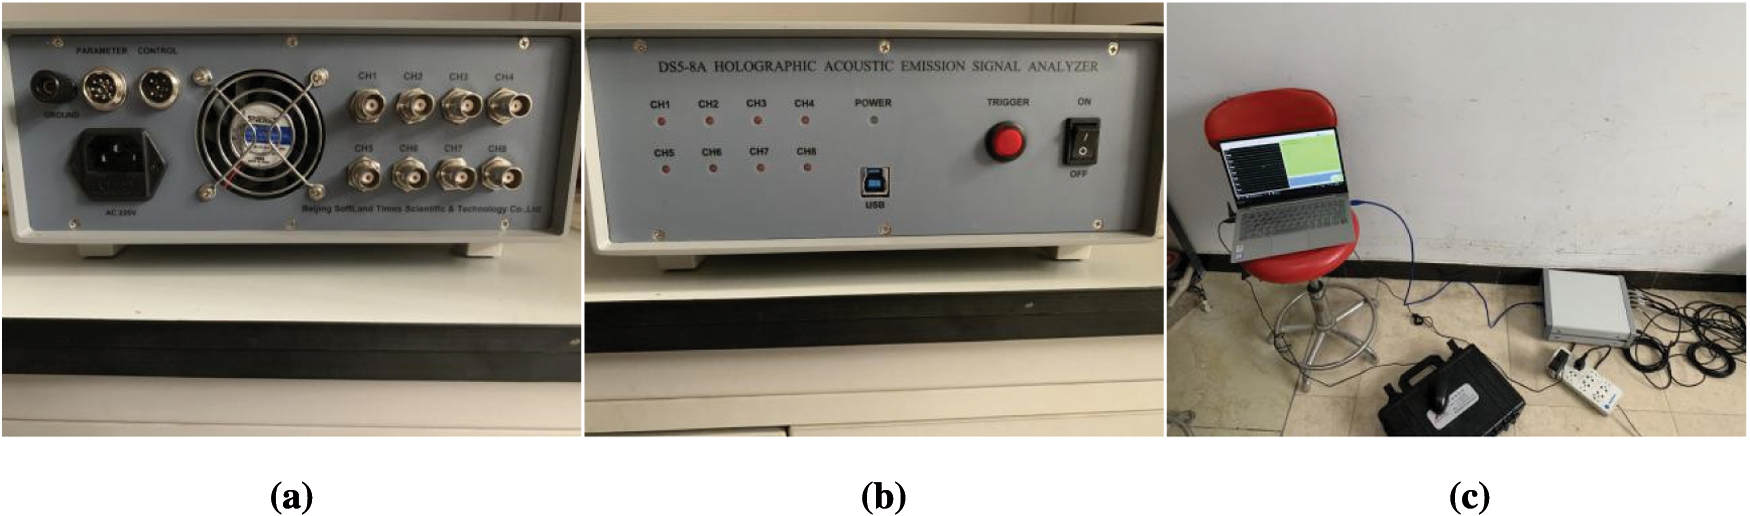
Figure 6: The photos of (a–b) acoustic emission instrument and (c) acoustic emission system after connection
Through the broken lead test, the calibrated sound velocity values of the specimens are shown in Table 3.

After the sound velocity calibration, specimens A1 and A2 are placed on the WHY-2000 pressure testing machine (as shown in Fig. 7) for the uniaxial compression test. The loading rate is 20 mm/min. sensors are arranged on the surface of the specimens, sensors layout of specimens is shown in Fig. 8. At the same time as the uniaxial compression test, the acoustic emission system is used to collect the failure waveform of the specimens under the condition of the uniaxial compression test.

Figure 7: Pressure testing machine
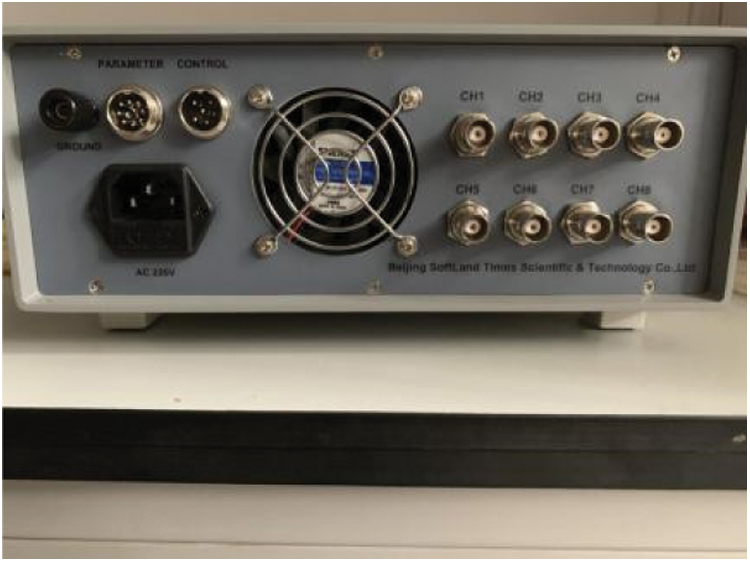
Figure 8: Sensor layout position
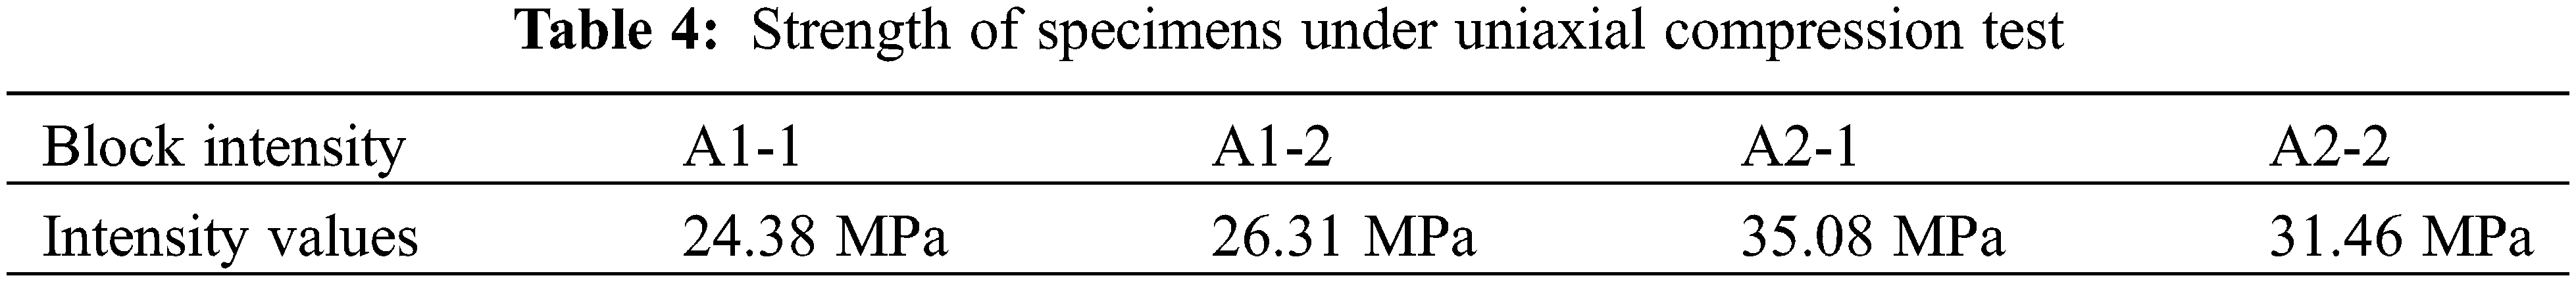
Through the uniaxial compression test, the measured strength values of the specimens are shown in Table 4. It can be seen from the test that after 7 days of curing, the strength of the specimens in group A1 reached more than 80% of the designed strength, while that of the specimens in Group A2 also met the expected strength design requirements after 28 days of curing.
2.5.1 Analysis of Acoustic Emission Characteristic Parameters
The test results can be obtained by processed and analyzing the failure waveform of each specimen that the AE parameters of the specimens of SCC in Group A1 or Group A2 have two various rules, the change rule of the two specimens has the same place.
Figs. 9–12 are the curves of the cumulative values of energy, amplitude, and ringing count of specimens A1-1/A2-1 and A1-2/A2-2 over time and the histogram of the values of acoustic emission parameters of each specimen. According to the various characteristics of AE parameters, AE variations of specimens A1-1 and A2-1 are divided into four stages: initial stage, elastic failure stage, nonlinear stage, and active stage. The variation stage of AE parameters corresponds to the failure stage of the specimens, including the compaction stage of the specimens in the initial stage, the elastic deformation stage of the specimens in the linear stage, the plastic deformation stage of the specimens in the nonlinear stage, and the failure stage of the specimens in the active stage. Characteristics of AE parameters of specimens A1-1 and A2-1 at different stages:
i) Initial stage (A1-1:0s-6s, A2-1:0s-4s): in the initial stage, the specimens are in the state of compaction, and the primary cracks and cavities inside the specimens are squeezed and compactly, at the same time, the concrete particles raised on the surface of the specimens are crushed. In this stage, the stress is about 10% of the ultimate stress, although acoustic emission events occur in the specimens, the number of events is small, the overall signal strength is low, and there are large attenuations. The cumulative value of each parameter increases slightly with time, in the 6s, the cumulative value of amplitude, energy, and ringing count of specimen A1-1 reached 8.0e4, 2.0e4, 8.0e3, in the 4s, the cumulative value of the specimen A2-1 reached 8.0e4, 3.1e4, 4.0e4, in the initial stage, the cumulative value of energy and ringing count of specimen A2-1 should be greater than specimen A1-1, and the cumulative value of A2-1 is 5 times higher than specimen A1-1. The initial stage of specimen A1-1 accounts for 28.6% of the whole loading process, and the initial stage of specimen A2-1 accounts for 21.1% of the whole loading process. The initial stage of specimen A2-1 is lower than specimen A1-1. The reason is that through a certain period of curing, cracks and voids in the test block can be reduced. The curing time of specimen A2-1 is longer than that of specimen A1-1, and the internal structure of specimen A2-1 is more compact with fewer cracks and voids, so the compaction time of specimen A1-1 is longer than A2-1.
ii) Elastic failure stage (A1-1:6s-11s, A2-1:4s-8s): with the growth of the test load, the part of the aggregate combined with the cement of the specimens A1-1 and A2-1 will undergo elastic deformation under stress, elastic failure begins to occur in the specimens, microcracks begin to occur, and AE events increased linearly with time, releasing a large amount of energy. In this stage, the stress is about 30%–35% of the ultimate stress, and the accumulative value of all parameters in this stage increases linearly, which the accumulative value of the amplitude is the largest, the cumulative value of the amplitude of A1-1 increased from 8.0e4 to 2.65e5, with the growth rate of 69.8%, while the cumulative value of A2-1 increases by 51.2%.
iii) Crack stable propagation stage (A1-1:11s-18s, A2-1:8s-14s): after a period of elastic failure, the specimens entered into the stage of stable crack propagation. The micro-crack begins to expand continuously, releasing a large amount of energy, and the specimens produced a large number of acoustic emission events. The accumulative value of all parameters begins to show nonlinear growth, which the accumulative value of specimen A1-1 increased from 5.5e4 to 4.6e5, with a growth rate of 88%, reaching 1.3e5 in the 17s. The cumulative value of specimen A2-1 increased from 1.8e5 to 7.2e5, and the ringing count reached 1.6e5 in the 11s, this indicates that in the crack stable expansion stage, stress concentration may occur in the local area of the specimens at some time [18].
iv) Active stage (A1-1:18s-21s, A2-1:14s-19s): the crack of specimens after a period of stable extension, when the stress value reaches more than 90% of the limit stress, specimens gradually entered the stage of damage, the acoustic emission parameters accumulative total value begin to rise sharply, events, intensity, and energy all reached the peak value, the cumulative peak value of amplitude, energy and ringing count of A1-1 reached 4.0e5, 3.0e5 and 5.4e5, the cumulative peak value of amplitude, energy and ringing count of A2-1 reached 3.5e5, 5.9e5 and 8.0e5. When the stress is close to the ultimate stress value, the stored strain energy of the specimen is greater than the energy required for the crack development, thus forming the unstable state of rapid crack development, continuously appearing cracks and extending to the surface. When the specimens enter the later stage of failure, the specimens still have the bearing capacity and continue to be loaded, each parameter value of acoustic emission per second begin to decrease, but the cumulative value of each parameter still increased, indicating that although the specimens had begun to destroy, sound emission events still occurred. When the whole specimens became unstable, acoustic emission events disappeared.

Figure 9: The photos of (a) acoustic emission parameter cumulative value curve and (b) acoustic emission parameter histogram of specimen A1-1

Figure 10: The photos of (a) acoustic emission parameter cumulative value curve and (b) acoustic emission parameter histogram of specimen A2-1
According to the various characteristics of AE parameters, the AE parameters variation of specimens A1-2 and A2-2 can be divided into five stages:
i) The stage where the stress increases from 0 to the limit stress of 10%–20% (A1-2:0s-3s, A2-2: 0s-5s), the cumulative values of all parameters of specimen A1-2 increase with time, but ringing counts increase small, the cumulative value of amplitude, energy, and ringing count reached 2.0e5, 9.0e4, 4.0e4, the cumulative value of amplitude, energy, and ringing count of specimen A2-2 reached 5.7e5, 3.3e5, 1.2e5. Compared with other stages, the energy of the AE signal generated in this stage is larger and more than that in other stages, indicating that at the initial stage of the test, the state of the specimens is not stable and a large number of AE signals are generated.
ii) With the growth of stress (A1-2:3s-5s, A2-2:5s-9s), the cumulative values of all parameters continue to increase, but the growth curve is approximately parallel, indicating that with the progress of the test, the specimens are in a relatively stable state of change, but the trend of crack development is slow, and the change range of AE signal is small.
iii) Along with the test (A1-2:5s-10s, A2-2:9s-13s), each parameter per second is at a high level, and the cumulative value of each parameter increases rapidly for a short time, reaching the peak of the whole process, indicating that the specimens in this stage have a large crack locally and suddenly releases a large amount of energy.
iv) After a short period of rapid increase, the accumulative values of various parameters of specimens A1-2 and A2-2 all began to enter a stable state, and each AE parameter became zero. The stable period of specimens accounted for about 20% of the whole failure process, but the stable period of the specimen that had been preserved for 28 days lagged behind the specimen that had been preserved for 7 days.
v) When the stress value reaches more than 90% of the limit stress (A1-2:14s-19s, A2-2:16s-20s), the specimens begin to enter into the damage stage, AE signal presents the growth state again, the signal number has increased dramatically, but the values of energy and amplitude are lower, it indicates that the number of AE signals are large and the signals are weak, the specimens begin to appear penetrating crack and extend to the surface, the specimens change from local failure to global failure, and each parameter value per second gradually decreases until it stops changing. When the specimens are completely fractured, the failure ends.

Figure 11: The photos of (a) acoustic emission parameter cumulative value curve and (b) acoustic emission parameter histogram of specimen A1-2

Figure 12: The photos of (a) acoustic emission parameter cumulative value curve and (b) acoustic emission parameter histogram of specimen A2-2
Based on the above analysis, the change of acoustic emission parameters of Groups A1 and A2 reflects two failure states of SCC under uniaxial compression test: there are four failure stages in part of the SCC, at first, it is in the state of compaction, with a small number of acoustic emission events and a low intensity. The primary cracks and cavities inside the specimens are squeezed and compacted. After the specimens enter the elastic deformation stage, the AE signal increases linearly, and the specimens produce elastic deformation and micro-cracks. At the stage of crack stable propagation, the number of acoustic emission signals increased sharply, and the micro-crack began to expand and extend, and the ringing count reached the maximum value at a certain time. When it comes to the failure stage, the crack is in an unstable state and continuously penetrates to the surface until the specimens are completely unstable and acoustic emission events disappear. By comparing and analyzing the research results of acoustic emission of ordinary concrete by Guo et al. [19–22], it can be concluded that the failure rule of self-compacting concrete under uniaxial compression is the same as that of ordinary concrete.
There are five failure stages in some self-compacting concretes. In the initial stage, the number of acoustic emission signals is large, and the cumulative value of each parameter increases greatly. Then the specimens entered a stable state of change, the crack development trend was slow, and a small number of acoustic emission signals were generated. In the initial stage, the number of acoustic emission signals is large, and the cumulative value of each parameter increases greatly. Then the specimens entered a stable state of change, the crack development trend is slow, and a small number of acoustic emission signals are generated. Then the parameter values began to increase rapidly, the growth rate reached the peak, the specimens produced a large penetration crack, and released a lot of energy; After experiencing rapid growth, the specimens entered a stable period, and no acoustic emission signal is generated. After the end of the stability period, the specimens begin to enter the failure stage, the number of signals increased sharply, but the strength is low and continues to appear penetration cracks until the specimens are completely crushed. The failure of common concrete does not exist a stable period [23–26], but the failure of granite, skarn, marble and other materials has a stable period [27,28], so the failure law of self-compacting concrete is different from that of common concrete but similar to that of some rock materials.
2.5.2 Acoustic Emission Location Analysis
Based on the analysis of the AE location of specimens, it can be concluded that both Group A1 specimens and Group A2 specimens have two spatial distribution characteristics of AE location, so the AE location of Group A1 specimens are emphatically analyzed.
As shown in Fig. 13 are the AE location result of the specimen A1-1 in each period and the state of the specimen A1-1 after destruction. In the initial stage of 0s-6s, the stress reaches 10% of the ultimate stress, and there are few locating points distributed on the specimen, only sparse locating points distributed on the inside and the edge of the compression surface at the top of the specimen. This is because the foreign bodies raised on the surface of the specimen are crushed, while the internal primary cavities and micro-cracks are squeezed and compacted [10]. Compared with the initial stage; in the 6s-11s, the number of anchor points in the specimen increased significantly, and begin to concentrate at the top edge of the specimen, with a tendency to extend downward, indicating that micro-cracks begin to occur at the top edge in the 6s-11s and begin to extend downward; in the 11s-18s, with the further increase of load, surfaces 1-3,1-4 border begin to produce a large number of dense anchor point, the number increases and concentrates downward along the edge trajectory, this indicates that the anchor points have a tendency to extend downward along the edges, and obvious cracks begin to appear near these areas; in the 18s-21s, the number of anchor point on the surfaces 1, 3 increase sharply, macroscopic cracks begin to appear rapidly on the surface of the specimen, while a large number of anchor points accumulated on the bottom of the specimen, the anchor point extending from the edge of faces 1 and 3 has a tendency to intersect the anchor point at the bottom, this indicates that the cracks on the surface and the cracks on the bottom surface begin to intersect and expand into the interior, the intersecting extended cracks form a landslide failure surface, and the extension direction points to the interior of the specimen. As the failure progresses, the specimen transforms from local failure to overall instability.
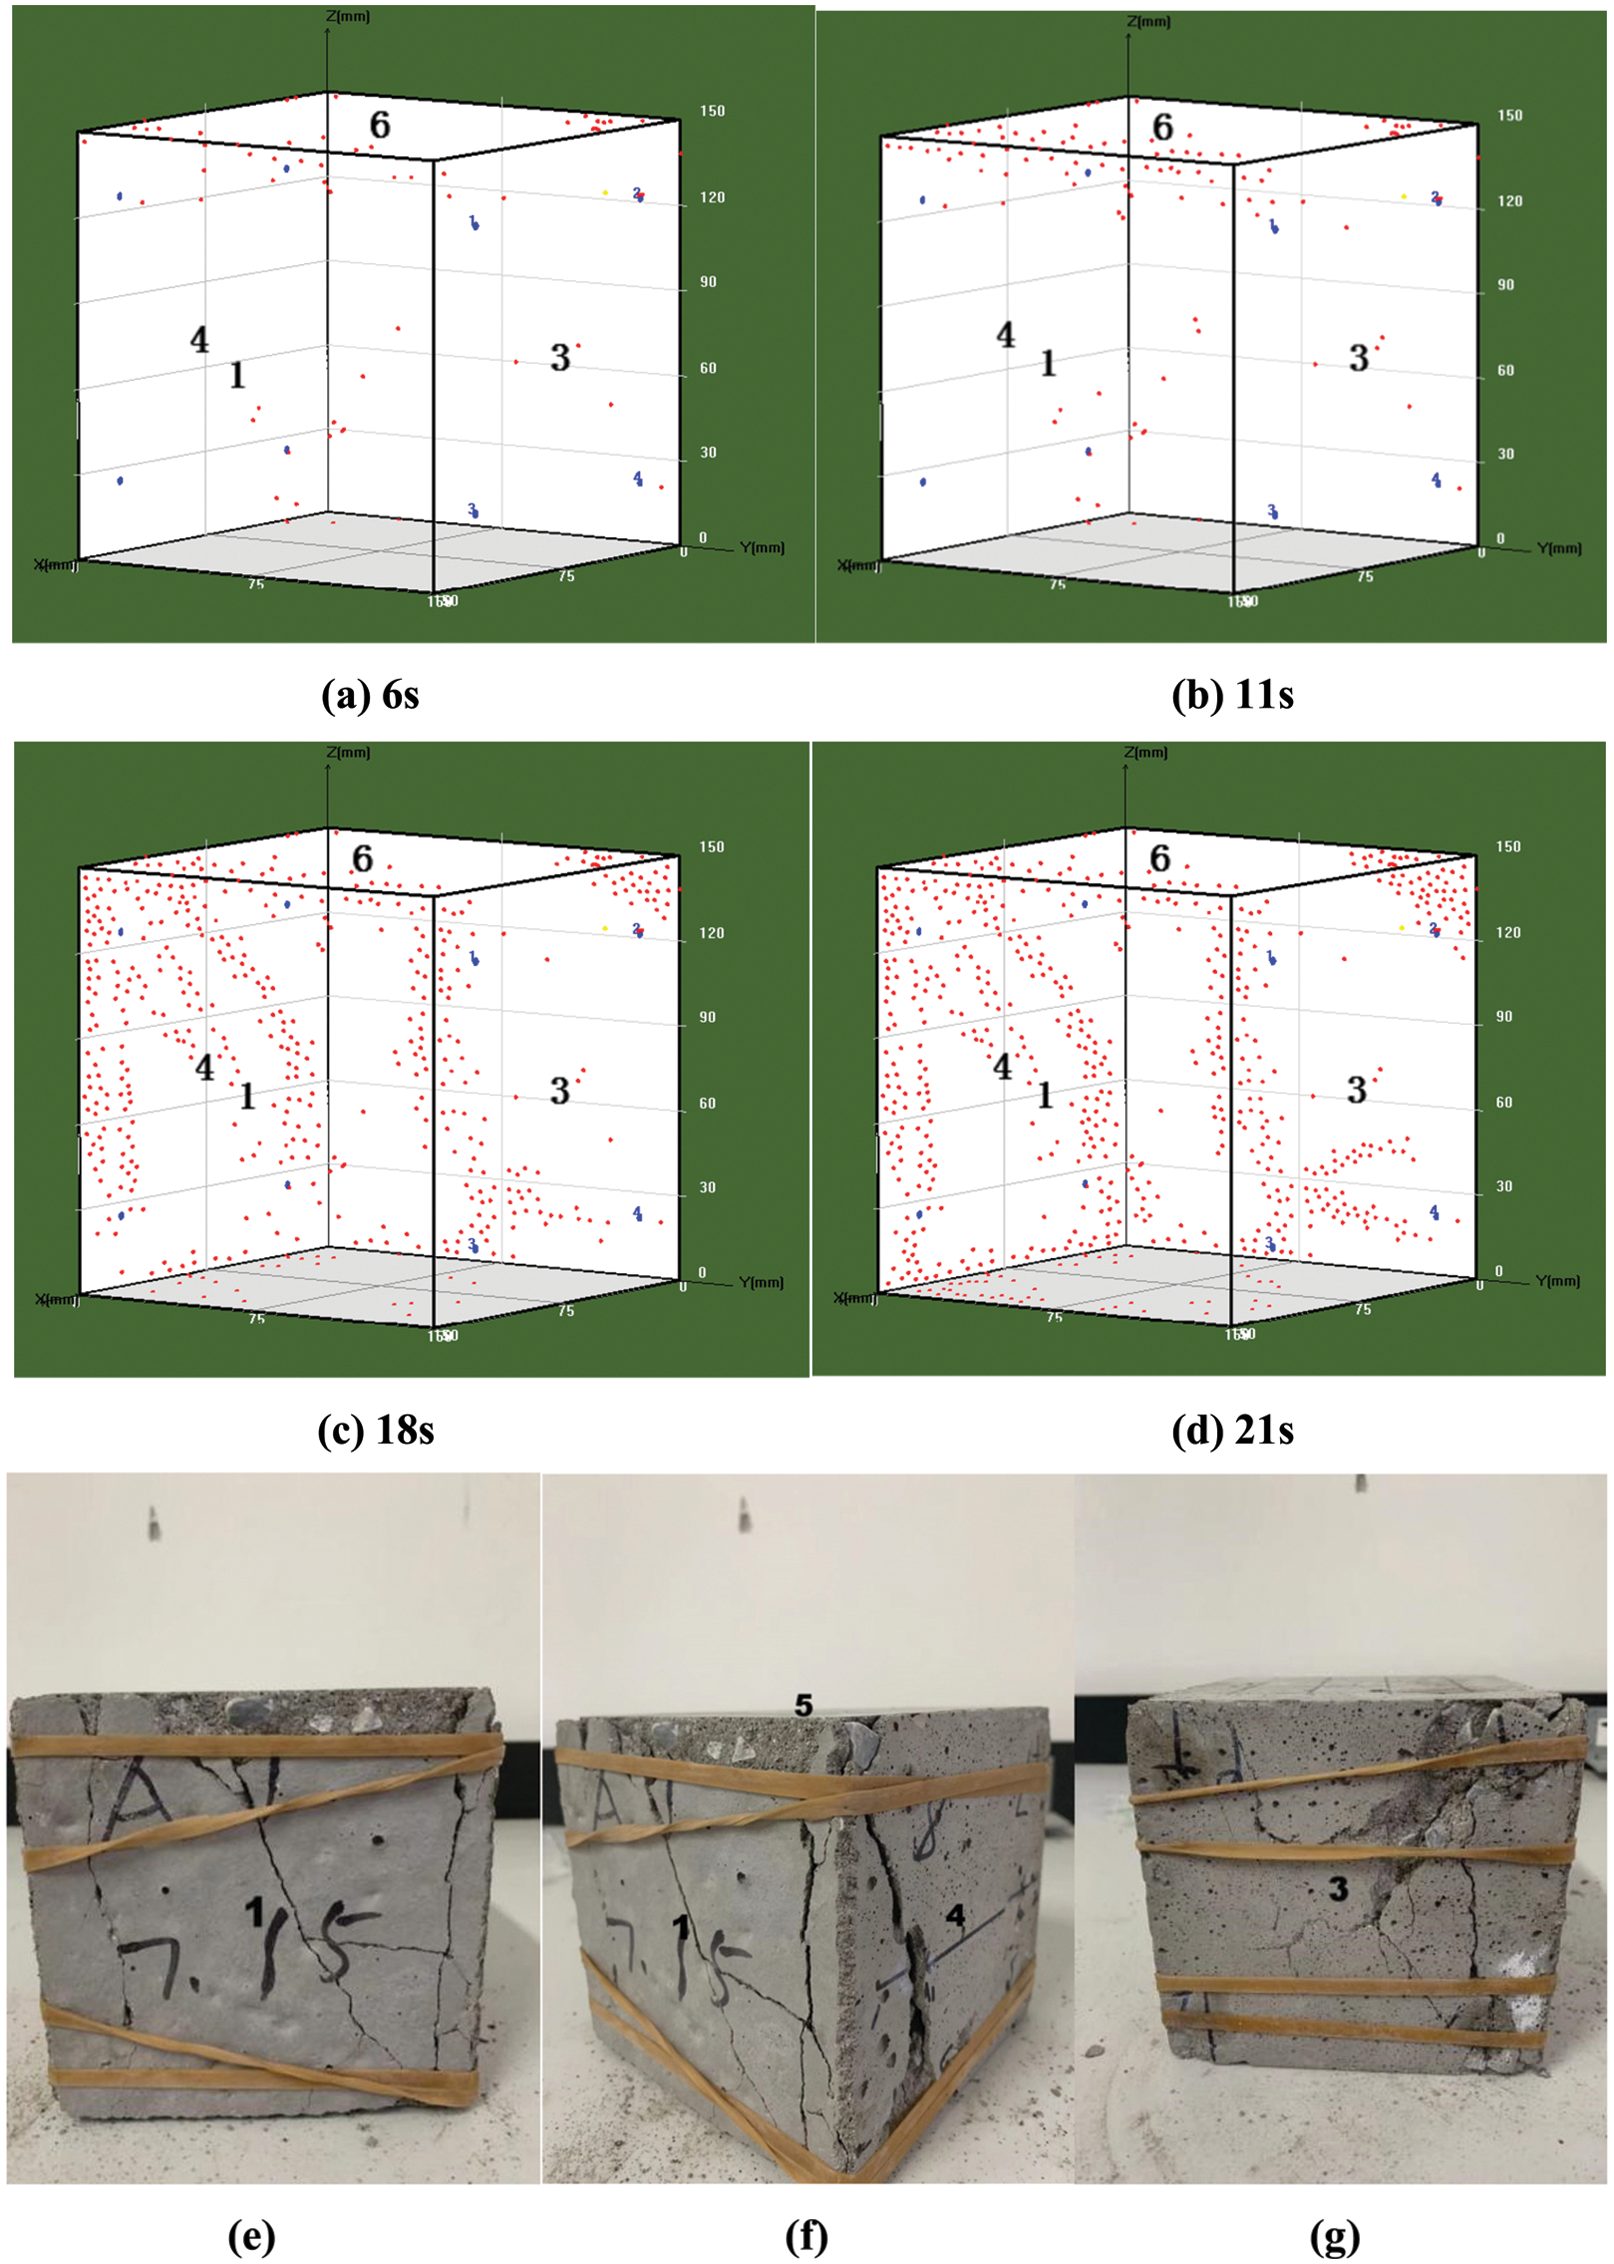
Figure 13: The photos of (a–d) Location map of specimen A1-1 and (e–g) actual failure state of specimen A1-1
As shown in Fig. 14 are the AE location result of the specimen A1-2 in each period and the state of the specimen A1-2 after destruction. In the 0s-3s, location points are also distributed inside and at the edge of the compression surface at the top of the specimen, but the number is significantly higher than that of A1-1, indicating that under the load in the 0s-3s, the internal primary cavities, and cracks are not only squeezed and compacted but also some micro-cracks are generated and obvious cracks are formed in some areas [10]. Compared with the state of the 3s, in the 3s-5s, the number of anchor points at the junction of surface 1-4-5 increases significantly and extends downward along the edge of surface 1, indicating that cracks near the top edge of the specimen are expanding in the 3s-5s, increasing in number and beginning to extend downward. Compared with the state of the 5s, the number of anchor points near the junction of surface 1-4-5 is still increasing in the 5s-10s, and the cracks are still expanding and showing a dense trend. Meanwhile, cracks extending downward begin to appear near the top edge of surfaces 1 and 4, indicating that the failure of the specimen has entered a more active stage. By comparison, it is observed that the number and position of anchor point distribution did not change in the 10s-14s, indicating that the specimen is in a stable state at this stage and a silent emission signal is generated. Compared with the state of the 10s, near the edge of surface 1-4, anchor point number showed a trend of increase sharply in the 14s-19s, on the surfaces 1 and 4, a large number of the anchor point continued downward and showed a trend of intersection, and extended to the inside of the specimen, at the same time, some location points begin to appear at the bottom of the specimen, indicating that during 14s-19s, cracks in the block begin to expand into macroscopic cracks and eventually intersected, forming an inverted triangular failure surface, the failure surface presented a horizontal angle of about 45°, and the extension direction is downward along the edge of the specimen.

Figure 14: The photos of (a–d) Location map of specimen A1-2 and (e–g) actual failure state of specimen A1-2
The mode of crack penetration during the failure of concrete samples is closely related to the mechanical properties, particle grading, and physical properties of materials [18]. Bobet et al. [29] and Cheng et al. [30] proposed that in the case of failure of concrete specimens under uniaxial compression, there are three types of crack penetration, namely shear penetration, tensile penetration, and shear/tensile penetration [18]. According to the actual failure state of specimens A1-1 and A1-2, the surface of the main crack and secondary crack on specimens A1-1 and A1-2 are very rough, and the penetration form has many bends [18]. There are some concrete particles near the crack surface, so the penetration of the crack of SCC belongs to shear penetration.
By comparing and analyzing the spatial distribution of the locating point of the specimens and the actual state after the failure, the failure state of the specimens simulated by the positioning diagram is consistent with the real failure state of the specimens, and the simulation results are consistent with the failure rule of the specimens obtained by the analysis of AE parameters.
The following conclusions can be drawn from the acoustic emission study on the whole process of failure of self-compacting concrete specimens under uniaxial compression test conditions:
1. For the self-compacting concrete specimens of 7 days and 28 days of curing, there are two rules of failure. For some self-compacting concrete specimens, there are four failure stages, namely the initial stage, elastic failure stage, crack stable expansion stage, and active stage. The failure rules are the same as those of ordinary concrete. There are five failure stages in some concretes, and in the process of destruction, there is a stable period and silent emission event.
2. In the first failure rule, the compaction time of the specimens after being cured for 28 days is lower than that of the specimens after 7 days in the initial stage. In the stable stage of crack propagation, the specimens maintained for 7 days and 28 days exist at a certain time, the ringing value will change suddenly, and the stress concentration phenomenon will occur in the local area of specimens.
3. In the second failure rule, there is a stage before the specimens enter the stable state, during which the acoustic emission parameter values will increase rapidly and the speed is the largest in the whole process. In the second failure law, after the rapid increase, the specimens will appear a stable period like part of the rock material, and the stable period of the specimens during curing 28 days will lag behind the specimens during curing 7 days.
4. The spatial distribution state of the anchor point is consistent with the actual failure state of the specimens and has good consistency with the failure rule of the specimens in response to the change of acoustic emission parameters. In the process of failure, the specimens of SCC will form an inverted triangle or landslide failure surface. The part above the failure surface is prone to failure, and there is a tendency to break away from the specimens. The concrete body below the failure surface is relatively stable, which is not suitable for failure.
5. Under uniaxial compression, the penetration of self-compacting concrete cracks is mostly shear penetration.
Funding Statement: This work is supported by Beijing Natural Science Foundation (8214060), National Natural Science Foundation of China (42107164).
Conflicts of Interest: The authors declare that they have no conflicts of interest to report regarding the present study.
1. Li, W. X., Ma, K. L., Long, G. C., Xie, Y. J. (2019). Stability dynamic monitoring and simulation of self-compacting concrete. Materials Reports, 33(7), 2206–2213. [Google Scholar]
2. Prakash, R., Raman, S. N., Divyah, N. (2021). Fresh and mechanical characteristics of roselle fiber reinforced self-compacting concrete incorporating fly ash and metakaolin. Construction and Building Materials, 290(1), 123209. DOI 10.1016/j.conbuildmat.2021.123209. [Google Scholar] [CrossRef]
3. Long, G. C., Li, N., Xue, Y. H. (2016). Mechanical properties of self-compacting concrete incorporating rubber particles under impact load. Journal of the Chinese Ceramic Society, 44(8), 1081–1090. DOI 10.14062/j.issn.0454-5648.2016.08.02. [Google Scholar] [CrossRef]
4. Ma, K. L., Long, G. C., Xie, Y. J. (2014). Effect of rubber particles on properties of self-compacting concrete. Journal of the Chinese Ceramic Society, 42(8), 966–973. DOI 10.7521/j.issn.0454-5648.2014.08.03. [Google Scholar] [CrossRef]
5. Zhou, S. K., Xie, S. H., Kang, M. A. (2019). Mixing design of steel fibre reinforced self-compacting concrete based on orthogonal experiment. Journal of North China University of Water Resources and Electric Power (Natural Science Edition), 40(2), 70–76. DOI 10.19760/j.ncwu.zk.2019025. [Google Scholar] [CrossRef]
6. Luo, X. Y., Yu, Z. W., Nie, J. G. (2003). Research on application of self-compacting concrete structures. Journal of The China Railway Society, 25(5), 75–80. DOI 10.3321/j.issn:1001-8360.2003.05.015. [Google Scholar] [CrossRef]
7. Yao, D. L., Yu, F., Xie, G. F. (2019). Mechanical properties of recycled aggregate self-compacting concrete during different curing periods. Journal of Shenyang University of Technology, 41(5), 589–593. DOI 10.7688/j.issn.1000-1646.2019.05.20. [Google Scholar] [CrossRef]
8. Jiang, Y., Xu, F. Y., Xu, B. S. (2014). Application of acoustic emission tomography in concrete structures. Journal of Southeast University (Natural Science Edition), 44(4), 822–825. DOI 10.3969/j.issn.1001-0505.2014.04.025. [Google Scholar] [CrossRef]
9. Wang, Y., Zhang, Y. T., Hu, H. X. (2014). Identification of damage degree of concrete by acoustic emission and artificial neural network. Journal of Building Materials, 17(4), 672–676. DOI 10.3969/j.issn.1007-9629.2014.04.020. [Google Scholar] [CrossRef]
10. Li, S. L., Shi, H. S., Wu, G. M., Wang, D. W. (2017). Application of acoustic emission technique to crack detection of concrete hollow slab bridges. Bridge Construction, 47(5), 83–88. [Google Scholar]
11. Liu, J. H., Yang, Y. F., Xie, J., Liu, Y. J. (2018). Acoustic emission test and damage fractal characteristics analysis of concrete with different initial porosity. Transactions of Beijing Institute of Technology, 38(12), 1231–1236. DOI CNKI:SUN:BJLG.0.2018-12-004. [Google Scholar]
12. Lai, Y. S., Xiong, Y., Cheng, L. F. (2014). Frequency band energy characteristics of acoustic emission signals in damage process of concrete under uniaxial compression. Journal of Vibration and Shock, 33(10), 177–182. DOI 10.13465/j.cnki.jvs.2014.10.034. [Google Scholar] [CrossRef]
13. Wang, L., Zhong, L. H., Xia, H. L., Zhang, X. (2016). Acoustic Emission (AE) characteristics of corroded reinforced concrete beams in loading process. Journal of Building Materials, 19(4). DOI 10.3969/j.issn.1007-9629.2016.04.013. [Google Scholar] [CrossRef]
14. Ashtiani, M. S., Scott, A. N., Dhakal, R. P. (2013). Mechanical and fresh properties of high-strength self-compacting concrete containing class C fly ash. Construction and Building Materials, 47(5), 1217–1224. DOI 10.1016/j.conbuildmat.2013.06.015. [Google Scholar] [CrossRef]
15. Ministry of Housing and Urban-Rural Development of the People’s Republic of China (2012). Technical specification for application of self-compacting concrete. Beijing: China Construction Industry Press. [Google Scholar]
16. Wen, X. Q., Wang, J. L., Shan, J. H., Liu, Y., Long, F. (2011). Research on comparative experiments of proportion design method of self-compacting concrete. Concrete, (12), 103–105+115. DOI 10.3969/j.issn.1002-3550.2011.12.032. [Google Scholar] [CrossRef]
17. Chen, C. Q., Yu, Y. H. (2011). Study on design method of SCC mix ratio added with naphthalene series water reducers. Urban Roads Bridges & Flood Control, (9), 216–222. DOI 10.16799/j.cnki.csdqyfh.2016.09.060. [Google Scholar] [CrossRef]
18. Cheng, A. P., Zhang, Y. S., Dai, S. Y., Dong, F. S., Zeng, W. X. (2019). Space-time evolution of acoustic emission parameters of cemented backfill and its fracture prediction under uniaxial compression. Rock and Soil Mechanics, 40(8), 2965–2974. DOI 10.16285/j.rsm.2018.1940. [Google Scholar] [CrossRef]
19. Guo, Q. H., Zheng, X. C., Li, Z. W. (2015). Experimental research on relationship between frequency characteristics of acoustic emission and strength parameter in concrete. Journal of Central South University (Science and Technology), 46(4), 1482–1488. [Google Scholar]
20. Qiu, J. S., Pan, D., Wang, M. H. (2018). Acoustic emission characteristics of compression damage of coal gangue concrete after freeze-thaw cycles. Journal of Building Materials, 21(2), 196–201. DOI 10.11817/j.issn.1672-7207.2015.04.040. [Google Scholar] [CrossRef]
21. Chen, C., Chen, X. D., Guo, S. S. (2019). Experimental study on acoustic emission characteristic of fatigue crack growth of self-compacting concrete. Structural Control and Health Monitoring, 26(4). DOI 10.1002/stc.2332. [Google Scholar] [CrossRef]
22. Toufigh, V., Abyaneh, M. J., Jafari, K. (2017). Study of behavior of concrete under axial and triaxial compression. ACI Materials Journal, 114(4), 619–629. DOI 10.14359/51689716. [Google Scholar] [CrossRef]
23. Yang, J. (2014). Acoustic emission region localization of damage evolution of concrete (Master Thesis). Yanshan University. [Google Scholar]
24. Wu, L. Q. (2006). Mesoscopic experiment of concrete damage propagation under axial compressive condition (Master Thesis). Guangxi University. [Google Scholar]
25. Qi, Z. T. (2017). Study on acoustic emission localization of concrete using corrected velocity (Master Thesis). Jinan University. [Google Scholar]
26. Liu, F., Huang, M. S., Gong, P., Zhang, J. Y. (2017). Research on acoustic emission characteristics of concrete under uniaxial compression. Journal of Xinyu University, 22(5), 1–5. [Google Scholar]
27. Yin, Y. B., Li, A. B., Yuan, J. P., Chen, J. J., Wang, F. K. (2005). Experimental research of rock acoustic emission characteristics. Rock and Soil Mechanics, S2, 115–118. [Google Scholar]
28. Yu, F. (2012). Study on Acoustic Emission of Rocks Based on Uniaxial Compression (Master Thesis). China University of Geosciences (Beijing). [Google Scholar]
29. Bobet, A., Einstein, H. H. (1998). Fracture coalescence in rock-type materials under uniaxial and biaxial compression. International Journal of Rock Mechanics & Mining Sciences, 35(7), 863–888. DOI 10.1016/S0148-9062(98)00005-9. [Google Scholar] [CrossRef]
30. Cheng, L. C., Xu, J., Feng, D. (2016). Analysis of mesoscopic cracking propagation and coalescence mechanisms of rocks subject to shearing. Rock and Soil Mechanics, 37(3), 655–664. DOI 10.16285/j.rsm.2016.03.006. [Google Scholar] [CrossRef]
 | This work is licensed under a Creative Commons Attribution 4.0 International License, which permits unrestricted use, distribution, and reproduction in any medium, provided the original work is properly cited. |