| Journal of Renewable Materials |
DOI: 10.32604/jrm.2022.021211
ARTICLE
Glycated Hemoglobin HbA1c: Permittivity Experimental Applications with Some Mathematical Concepts, Temperature and Frequency Variations
1Department of Physics, Faculty of Science, King Abdulaziz University, Jeddah, Saudi Arabia
2Department of Materials Science, Institute of Graduate Studies and Research, Alexandria University, Alexandria, Egypt
3Department of Physics, Faculty of Science, Jeddah University, Jeddah, Saudi Arabia
*Corresponding Author: Soliman Abdalla. Email: smabdullah@kau.edu.sa
Received: 01 January 2022; Accepted: 27 February 2022
Abstract: Diabetes disorder turns smoothly to be a global epidemic disorder and the glycated hemoglobin (HbA1c) starts to be an efficient marker of it. The dielectric spectroscopy on different human normal- and diabetic-blood samples is used to characterize and to estimate the HbA1c concentration. “dc-” and ac-measurement of the complex conductivity in the temperature range from 280 K up to 320 K, and in the frequency range from one Hz up to 32 MHz have been performed. The thermal activation energy, ΔEσ, of dc-electric conductivity lies in the range 95 meV < ΔEσ < 115 meV; while the thermal activation energy, ΔEτ, of RBCs relaxation time is about ΔEτ = 140 meV. The experimental data have been modeled by a physical-model and good fittings have been found between calculated and experimental values. The effective number of charges, nG, T, is estimated after Cole and Cole curves. One has found that nG, T increases with both temperature, T, and with the glycation rate GG. This increase may shed some light on an effective and possible way to treat (and to detect) diabetes disorders via eliminating the excess electric charges produced by glycation processes. The present work sheds the light on the possible combination of focused ultrasound with magnetic resonance imaging to study the dielectric-thermal variations of glycated-RBCs, which can lead to very precise and non-invasive monitoring of glycation concentration in vivo and in vitro via magnetic resonance-thermometry.
Keywords: Glycated-hemoglobin rate; thermal characterization; red blood cells RBCs; relaxation of RBCs; dielectric constant; mathematical model
Nomenclature
| E0 | maximum amplitude of electric field |
| F | two equal and opposite electric forces |
| GG | glycated hemoglobin |
| HbA1c | the glycated hemoglobin |
| k0 | damping mechanical force acting on the RBC |
| nG, T | effective number of charges |
| RBCs | red blood cells |
| t | time |
| x (T, t) | displacement parameter |
| ΔEσ | Thermal activation energy of dc-electrical conductivity |
| ΔEτ,σ | Thermal activation energy of relaxation time |
| βG | velocity-damping |
| η’ | the opposing viscous forces |
| η0 | viscosity coefficient acting on the RBC |
| μG | mass-increasing factor |
| σac | dc-electric conductivity |
| σdc | dc-electric conductivity |
| ω | Angular frequency is ω is 2π *frequency, f |
Multifunctional and very vital fluid is the human blood; it regularly and precisely distributes oxygen to the different human systems [1], it transfers aliments, drugs, and metabolites [2–4]. In addition, it is an essential component of the immune system [5,6]. Even, Dache et al. [7] have recently reported the presence of respiratory-competent cell-free mitochondria in human blood (up to 3.7 × 10⁶ per mL of blood). This gives an interesting and stimulating issues to perform further studies on the multifunction characters of blood, (the term blood in the present study refers to human blood). Moreover, precise information about its functions, its elementary elements, its vital properties and its dynamics is of great significance. In particular, the study of these vital properties under some disorder, for example, diabetes I and II as they are common disorder factors and the side effects of this disorder is seriously dangerous [8]. A recent report (April 29, 2021) of the international diabetes federation (IDF) atlas shows that 463 million adults have currently diabetes. Moreover, IDF predicts 700 million adults on 2045 [9,10]. Therefore, several researchers have paid great attention to develop either efficient treatment [11,12] or rapid detection of that disorder [13,14]. One of effective markers to diabetes is glycation of red blood cells (RBCs). The glycation of RBCs hemoglobin produces glycated hemoglobin (HbA1c). This HbA1c reduces the function- efficiency of the RBCs. Therefore, it is necessary to study the glycation mechanisms, the glycation effects and the role played by HbA1c concentrations (GG) on the different functions of RBCs. Several studies have considered that GG is an efficient indictor for long-term glucose levels [15–17].
Unfortunately, except reference [18], we did not find any study, in the present published literature, dealing with the dielectric characteristics of HbA1c as function of frequency and/or temperature; taken into account the life-span of RBCs on the same time with the continuous formation of glycated hemoglobin. However, Cohen et al. [19] have reported that: “the effect of glycation on the dielectric parameters of the lens at any temperature is the result of a greater number of polar sites than in a healthy sample, which affects the mechanism of polarization of protein molecules on the surface and within this tissue under the influence of an electric field”. End of citation. In fact, the continuous formation of glycated hemoglobin by time, is depending on 2-factors: The first is the life-period of red blood cells, which is about four months [20]; the second parameter is the glucose growth through rate of the blood (GG) [21,22]. It is worth mentioned that the word blood, in the present study, means human blood in vitro.
Thus, any reasonable study for HbA1c should take, on the same time per days, two paradoxes factors: The first is HbA1c concentration (GG) that increases with time (t) while, on the contrary, the number of RBCs (holding HbA1c), which is decreased by time due to their life span. When characterizing HbA1c, several authors [20–22], consider one part and neglect the other. We did not find any publication that considers the characteristics of HbA1c taken into considerations the two factors on the same time. In reference [18], the authors have reported that glycation of hemoglobin increases the electric charges. In fact, the origin of these charges comes from a chemical “two-step reaction” of the carbonyl group (-C=O) of glucose which is negatively partially polarized and thus can easily react with the amino (-N=O), which is positively partially polarized group of the N-terminal “valine” of the (third-globin chain of hemoglobin). The partial electric-polarization reactions result in more positive and negative charges bearded on the RBCs. Moreover, the glycation-processes occur, in normal conditions, smoothly where the first reaction leads to a Schiff’s base (aldimine) [23,24]; and the second reaction is an Amadori rearrangement [24,25]. This reaction results in a stable “keto-amine”-compound. This stable keto-amine plays the principal role as a marker of the blood glucose level.
Moreover, we follow the work published by Diederich [26] and point out about the possible combination of focused ultrasound with magnetic resonance imaging to study the dielectric-thermal variations of glycated-RBCs which can lead to very precise and non-invasive monitoring of glycation concentration in vivo and in vitro via magnetic resonance-thermometry [26–30].
On the other hand, the thermal variations of RBCs through the blood affects their functions. For example, when human tissue inevitably absorbs microwave energy, which is directly converted to heat [31] (within skin) due to dielectric losses; this, varies the electric and dielectric properties of RBCs and would lead to drastic effects on the blood functions. Therefore, studding the thermal effects of RBCs requires more intensive steps.
In the present study, we (i) present experimental data to characterize HbA1c as a function of some extra “harmful” electric charges; using broad band dielectric measurements (ii) present experimental data and explain the thermal relation between the growth of HbA1c and its dependence on the permittivity measurements, (iii) present a theoretical model, which fits well to our experimental data, (iv) explain experimental data taking into considerations the three above-mentioned factors on the same time.
2 Experimental and Methods Details
Expect the temperature variations combined with glyction variations, the experimental details of the present study are exactly the same as those published in reference [18], namely: (i) Sample Collection (ii) ac-Electrical and dielectric measurements under different hemoglobin-glycation rates (iii) Determination of the cell constant of the impedance sample holder, (iv) dc-Electrical measurements (IV characteristics) under different hemoglobin-glycation concentrations, (v) ac-Electrical and dielectric polarization of glycated hemoglobin as a function of time (vi) variations of RBCs relaxation times as a function of time and HbA1c concentration (vii) Red blood cells span-life (RBCs Survival-period), (viii) Some clinical-characteristics (ix) Statistical Analysis. However, the published model in reference [18] has suffered some essential modifications when varying temperature. In the present study, one summarizes the temperature-modified equations of reference [18].
2.1 Theoretical Model with Glycation of RBCs under Forced Ac-Electric Field: Effect of Temperature Variations
A micro particle such as RBC can freely move (or/ and can be freely suspended) in a viscous fluid such as plasma. Because the RBCs are negatively charged [14], they are completely surrounded by positive charges (Fig. 1a). Under an ac-elecric field, E0eiωt, with E0 is its maximum amplitude and its angular frequency is ω. The RBC can be forced and derived to have two equal and opposite electric forces F (Fig. 1b). This forms a mechanical-torque that can drive the RBC to oscillate with an angular frequency ω. The RBCs form dipoles that oscillate with ω as seen in Fig. 1c.
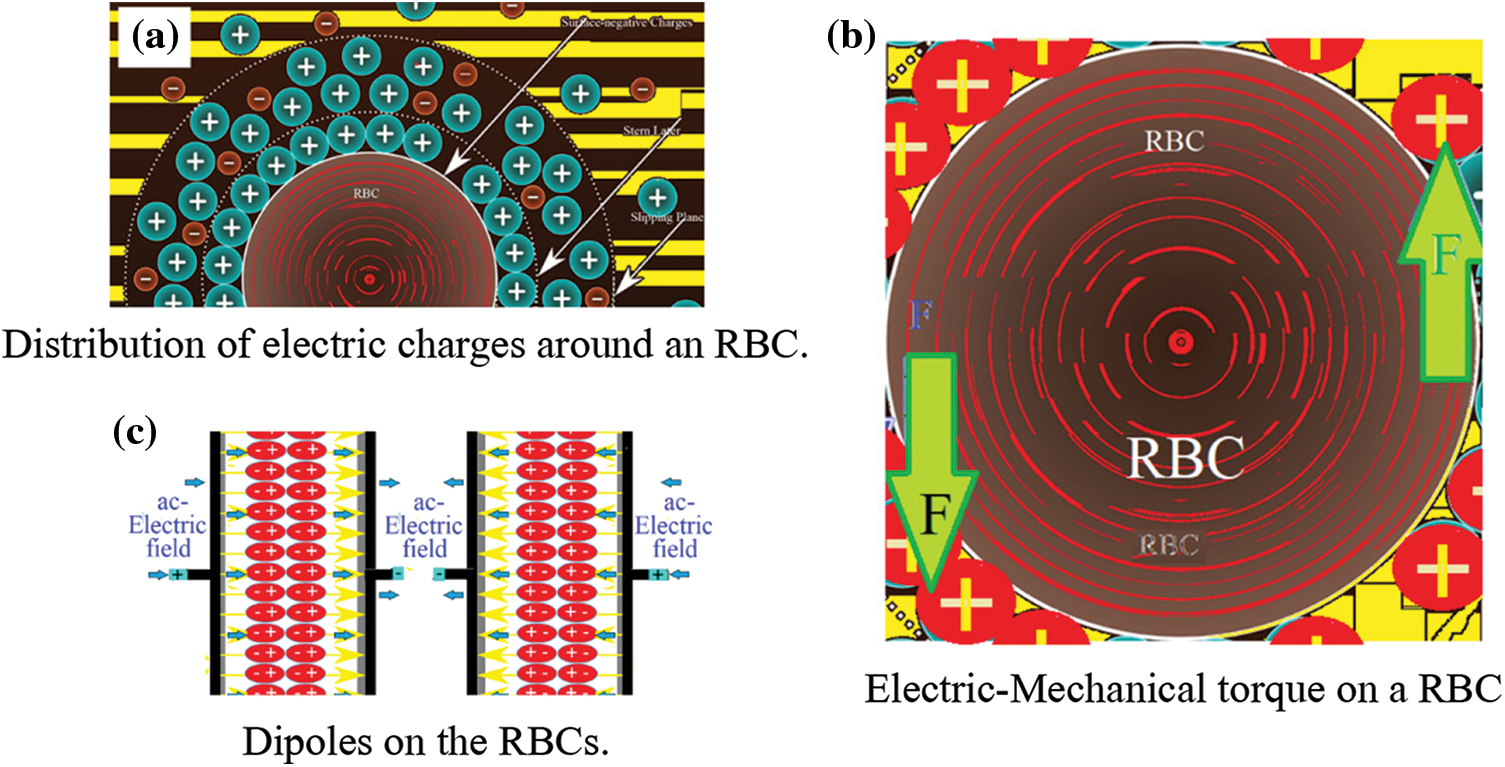
Figure 1: (a) Distribution of electric charges around an RBC (b) Electric-Mechanical torque on a RBC (c) Dipoles on the RBCs
In order to mathematically describe the motion of a micro particle of a healthy-RBC, with mass m0, under an external field E0eiωt, one can use Newton’s equation of motion and write:
Here, η’ represents the opposing viscous forces which have η0 viscosity coefficient. “k0” stands for the damping force acting on the RBC of the normal RBC. In reference [18], the authors have applied Eq. (1) at room temperature, however, in the present work one consider the temperature as a varying parameter, which varies in the range from 280 K up to 320 K. Moreover, in reference [18] one has taken into account the glycation-effect on the previous Newton’s equation of motion in such a way that it can be written as a differential equation, however, in the present study we have taken the displacement parameter (x) as a variable parameter with temperature.
Therefore, if one considers that
We can write the displacement parameter
Here, ΔE is a thermal activation energy with a negative sign that makes x (t, T) decreases with T.
In order to take the glycation processes of a RBC and following the same notations as those in reference [18]. We consider the following (i) an increase of the RBC-mass due to glycation. The mass-increasing factor μG; with 0 < μG < 1, (ii) an increase of the mechanical friction against the RBC-velocity: βG is a velocity-damping 0 < βG < 1, (iii) an increase of the mechanical restoring force against the displacement: αG represents an x-damping factor. All these increasing parameters μG, βG and αG depend on the glycation concentration ratio GG, with q is the electronic charge, E0 is the maximum amplitude of the ac-electric field, n is the effective number of electric-charges on the surface of RBCs, i is the unit complex number
Subtracting exp(iωt) from both sides (and rearranging) Eq. (4), one finds the amplitude as following:
One notices that
One can, also, write the amplitude of this complex number
and the phase angle as:
which means that
Therefore, the parameter A defined by Eq. (4) could be written as:
It is interesting to note that: (i) the amplitude of the parameter |A| = r is directly proportional to the strength of the external electric force E0, and that ratio is determined by the parameters of the underived oscillator, (ii) from Eq. (10), if the damping factor β is small, the parameter A increases drastically when the frequency of the external electric comes near to the natural frequency, ω0, of the oscillator (see Section 3.1.3), (iii) at low frequencies where ω << ω0, the oscillator slows behind by a small angle, however, at ω = ω0 one finds that θ = π/2. At higher frequencies where ω >> ω0, (and for driving frequencies above ω0), one finds that θ > π/2, (iv) from these analysis, one expects that the curve between θ and ω should pass by a maximum. This maximum happens at θ = π/4 (45°). This leads to the different maxima found in Section 3.1.1. So, these maxima happens when
The general solution of Eq. (13) can be written as:
If:
If
Then, the resonance condition occurs when the relaxation time, τG = 1/ω [32–36]. Thus, one can write that the relaxation time of a glycated RBC τG can be written as:
One should notice that the relaxation time τG is directly proportional (and it is sensitively proportional to) to the glycation processes as seen from the following proportionality:
In the presence of glycated-RBC at different ratios and at different temperatures, the ac-electrical conductivity σac(G,T), the dielectric constant ε’ac(G,T), and the electric losses ε”ac(G,T), can be represented, considering τac(G,T) given by Eq. (15), one can describe σac(G,T), ε’ac(G,T), and ε”ac(G,T), in the following section.
2.1.1 Effect of Temperature on the Permittivity of RBCs Suspended through Plasma with HbA1c Variations
At certain temperature T, the relaxation time of RBCs given by Eq. (15) depends on the glycation concentration, GG, via the increase of the RBC mass. However, after thermal-energy considerations, one should reconsider these issues. In particular, the principle of energy equilibrium between the thermal energy (kT) and the minimum mechanical energy affected by the external electric field; τG, given by Eq. (19), which represents a simple restatement of the second law of thermodynamics [37]. Here, one defines an activation energy of a suspended RBC, ΔEG, as the minimum energy which can return the RBC to its initial position after application of an ac-electric field. A suspended RBC attains its minimum potential energy when an optimum equality (condition) between its activation energy ΔEG and its thermal energy kT will happen [38,39] where k is Boltzmann constant and T is the absolute temperature. One considers this optimal energy condition and write:
Thus, taken into account the thermal variations with the relaxation time given by Eq. (17), one can rewrite Eqs. (32)–(34) and (36) of reference [18] to become as following:
2.1.2 Effect of Temperature on the Cole-Cole Analysis with HbA1c Variations
Theory: One has to use a reasonable analysis in order to attain a corresponding reasonable quantification of glycation ratios by broad band dielectric spectroscopy technique. In reference [40], the authors have shown that Cole & Cole experimental data are suitable to characterize and to model impedance spectra of biological materials. While the experimental data and the plot of Cole and Cole mask the frequency dependence, they present a clear sights through the different physiological changes of biological materials [41–44]. In addition, different authors [45,46] have reported that Cole and Cole data give an important explanation in the form of resistance to charge transfer Rct which is equal to the diameter of semicircular plots. Cole and Cole data show a maximum at which frequency attains a critical value with equality between electric losses ε” and dielectric constant ε’. At this maximum, bulk solution resistance is given at infinite frequencies [47].
In addition, it supplies the magnitude and the possible distribution of the relaxation times which can assess the charges-mobility [48–50].
For Debye-type relaxations, Cole and Cole curves can be represented as a function of GG and temperature by Eq. (21). Both the center and the radius of the semicircle is located on the x-axis: The center is located at y = ε”= 0, & x = [ε’dc-ε’∞]/2 (see Figs. 6a and 6b).
The surface area of the circle AG,T, is a function of both temperature and glycation rate:
We can estimate the number of charges nG as a function of GG from the area under the Cole Cole curves with semi-circle area AG, given by Eq. (38), as following: (i) One locates the xy coordinates at the maximum point of the semicircle (the two coordinates are nearly equal) xmax, ymax = [ε’max, ε”max], (ii) Then, we calculate the radius of the semicircle from Eq. (23), (iii) One can estimate the electric charges, QG, in Coulomb, as a function of the applied potential v from the equation:
where the ratio A/d is the ratio between the sample holder area and the electrode separation. The number of charges, GG, could be given from the equation
3.1 IV Characteristics and Experimental Data of Dc-Electrical Conductivity, as a Function of Temperature for Different Glycation Concentrations σdc (G, T)
At certain glycation rate GG = 0.04591, Fig. 2a shows the IV-characteristics, at different temperatures in the range (280 K < T < 320 K). Similarly, at room temperature, Fig. 2b shows the IV-characteristics at different GG values in the range (0.04591 < GG < 0.013688). Both figures have the same experimental data, however, the first figure takes the experimental data at certain GG with different temperatures; while the second shows the experimental data at certain temperature with different GG values and we will present our experimental data following the same scheme.
The IV-characteristics represents a good indication about both the rectification effects found due to the electrodes and the presence of any Faradic effects which may found at the contact surface between blood samples and the metallic-electrodes. The experimental data in Fig. 2a reveal that neither rectification effects nor Faradic effects are found near the electrodes. This is, clearly, seen from the good linearity found in both Figs. 2a and 2b; moreover, the similarities between the negative and positive sides of the obtained curves reveal that there are no Faradic effects around the metallic electrodes.
Fig. 2e The dc-electrical conductivity, σdc(GG, T) as a function of 1000/T. The linear behavior of the natural logarithm of σdc(GG, T) as a function of 1000/T shows that σdc (GG, T) is thermally activated following an Arrhenius type as: as σdc (GG, T) = σdc0 exp [-ΔE/kT]. The best fit of the experimental data to Arrhenius equation is given when the activation energy, ΔE = 0.115 eV and σdc0 = 46.0715 Sm-1.
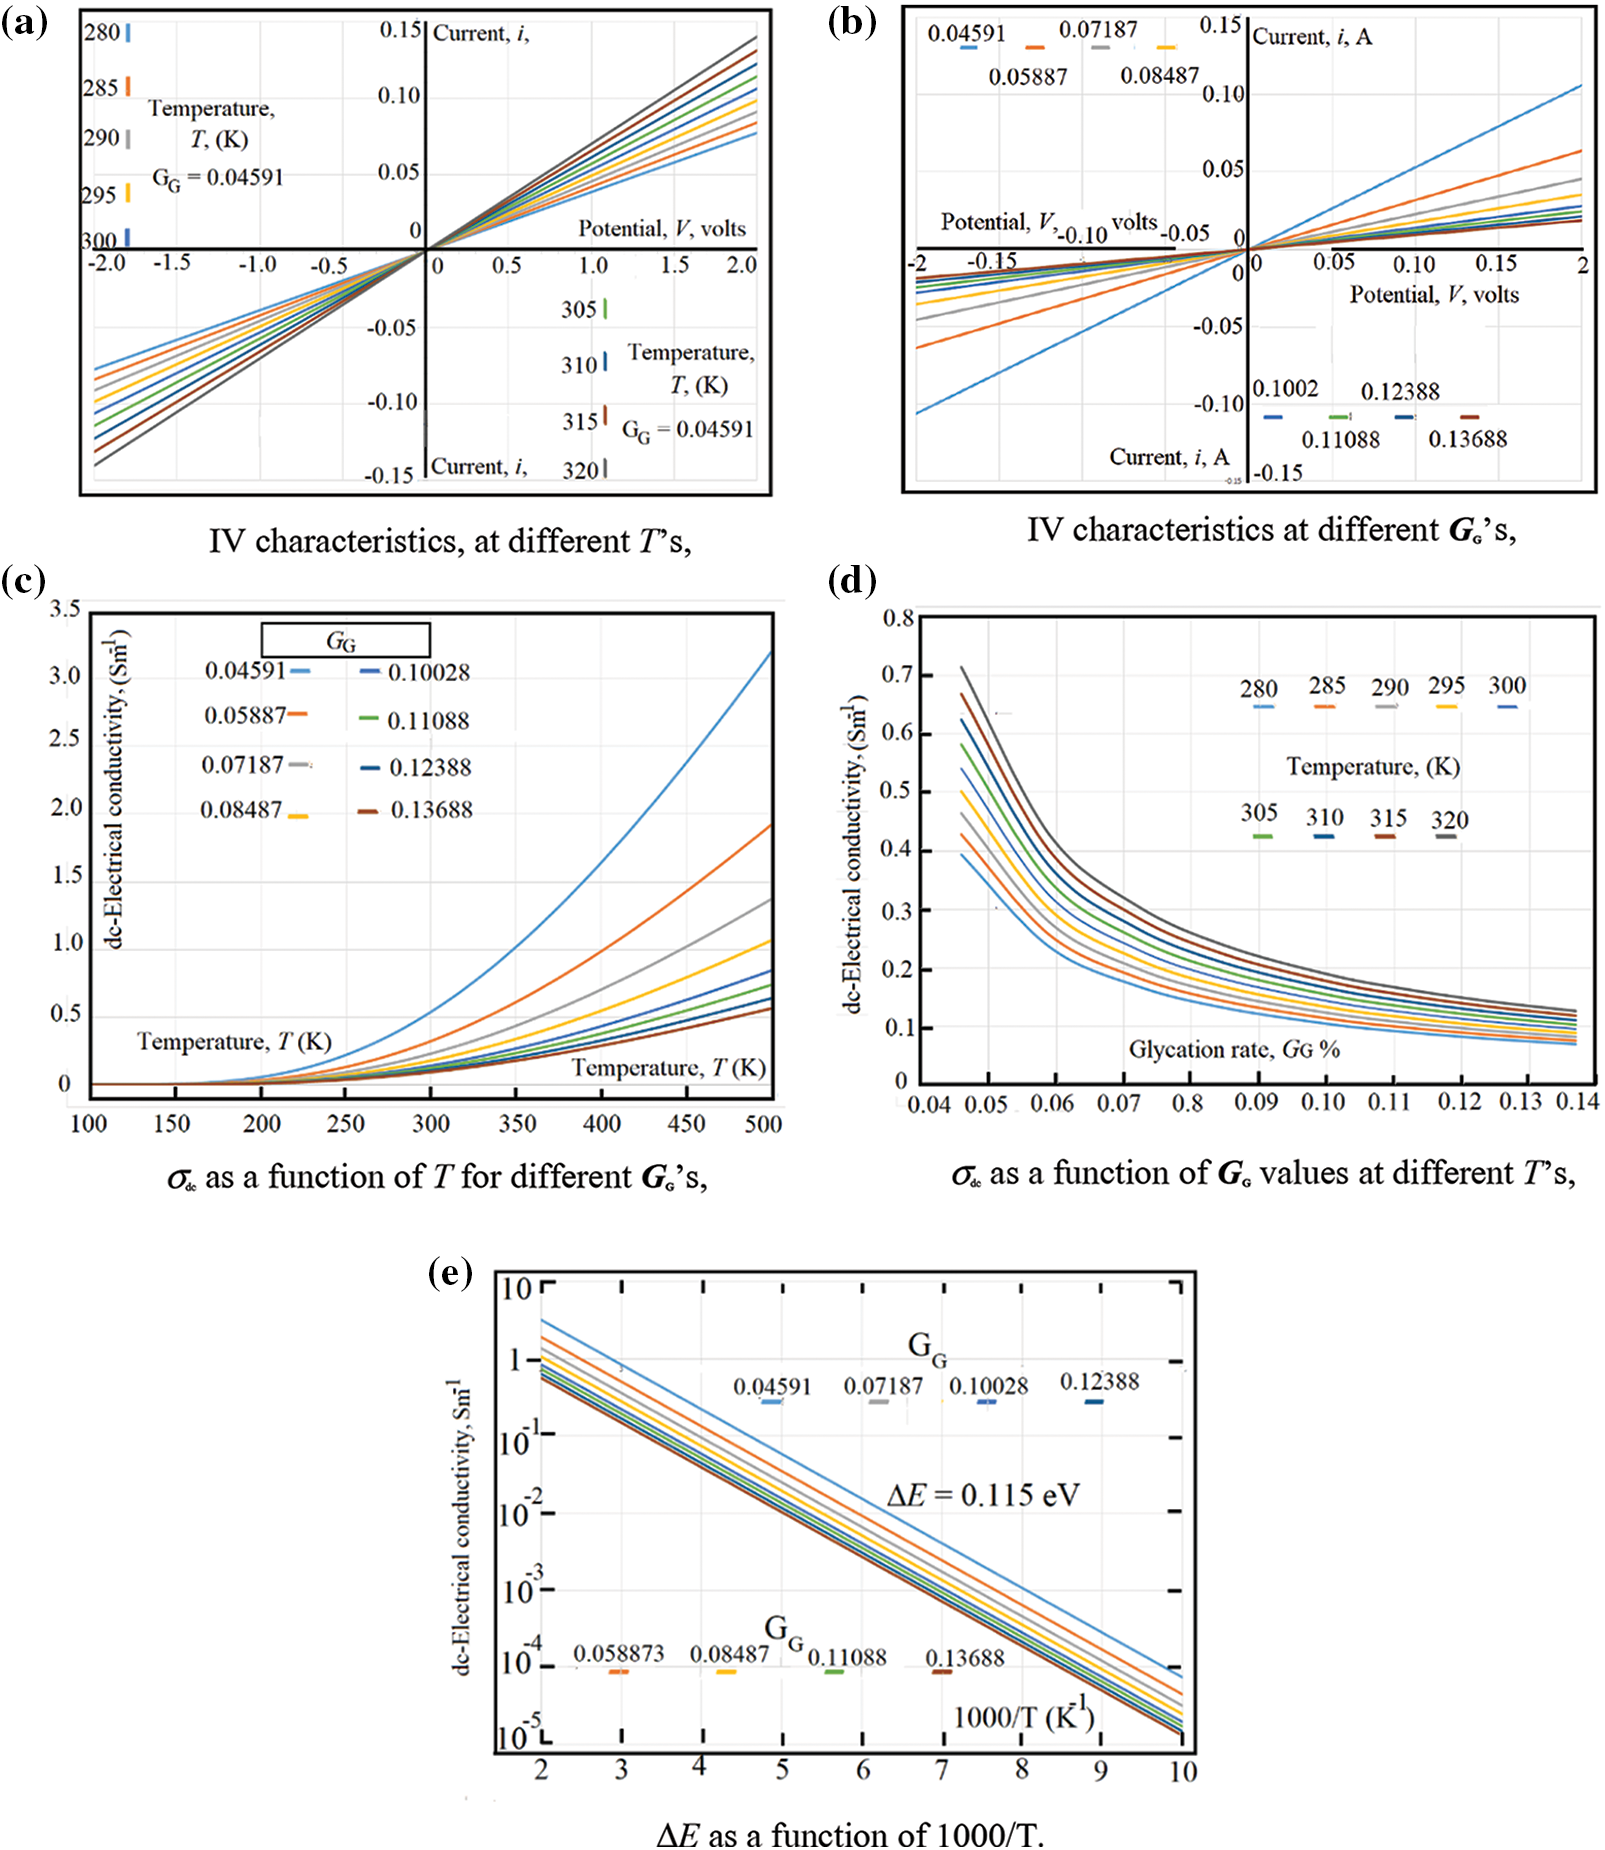
Figure 2: (a) IV characteristics, at different T’s, (b) IV characteristics at different GG’s (c) σdc as a function of T for different GG’s, (d) σdc as a function of GG values at different T’s, (e) ΔE as a function of 1000/T
From the slopes of both Figs. 2a and 2b, one can estimate the dc-electrical conductivity σdc (GG, T). Fig. 2c shows the dc-electrical conductivity σdc (GG, T) as a function of temperature for different glycation rates. Fig. 2d shows the dc-electrical conductivity σdc (GG, T) as a function of glycation rates for different temperatures. In order to estimate the thermal activation energy ΔEσdc, the data in Fig. 2d are represented in Fig. 2e as a function of 1000/T. The linear behavior of the natural logarithm of σdc as a function of 1000/T shows that σdc (GG, T) is thermally activated following an Arrhenius type as: σdc (GG, T) = σdc0 exp [-ΔE/kT]. The best fit of the experimental data to Arrhenius equation is given when the activation energy, ΔE = 0.115 eV and σdc0 = 46.0715 Sm-1.
3.1.1 AC-Electrical Conductivity of Glycated-Blood as a Function of Frequency for Different Glycation Concentrations, and at Different Temperatures
Asama et al. [50] have reported that the RBC-membrane contains poorly-conducting lipids, which makes the electrical conductivities of RBCs (either dc-/or ac-conductivity) in low frequency range is by far smaller than that of the plasma-medium. We have seen this behavior in the dc-conductivity σdc (G, T) as a good linear behavior of IV-characteristics as showed in Figs. 2a and 2b in the previous section. Moreover, both Figs. 3a and 3b confirm this behavior: Fig. 3a shows the ac-conductivity σac (ω, T, GG = 0.04591) as a function of frequency for different temperatures, here we can notice the presence of an excellent plateau extending from one Hz up to about 5 kHz having no variations of σac with ω. The same trend is seen in Fig. 3b, which shows the ac-conductivity as a function of frequency for different glycation concentrations at 320 K, σac (ω, GG, T = 320 K). The presence of plateau up to 5 kHz confirms, also, the linear behavior of the IV-characteristics. However, at moderate frequencies, σac (ω, T, GG = 0.04591) increases with both frequency and temperature. This increase is attributed to the relatively good response of the RBCs to the applied ac-electric field. As the frequency increases, the relaxation time τac (GG, T) decreases and, thus, σac (ω, GG, T) increases according to Eq. (18). Similarly, when temperature increases, the response of RBCs lowers the relaxation time according to Eq. (17) which in turn increases the electrical conductivity according to Eq. (18). On the other hand, increasing the glycation
The temperature effect on σac (ω, GG, T) is shown in Figs. 3c and 3d. One can notice a steep increase of the conductivity followed the presence of some maxima that vary with both GG, and T. We notice that at 10 kHz, the maxima lay in a relatively lower temperatures (in the range 150 K < T < 200 K). However, when applying 1 MHz these maxima displaced to higher temperatures (in the temperature range from 280 K up to 350 K). The presence of maxima is better seen in Section 3.1.3.
Symbols in Figs. 3c and 3d stand for the experimental data while the continuous lines are calculated after Eq. (18). A good fit of the calculated data to the experimental ones is obtained which stand with the validity of the presented model via Eq. (18). The strong increase of σac (ω, GG = 0.04591, 300 K< T < 500 K) is due to the strong response of the RBCs to the applied ac electric field. Here, the frequency is strongly increased resulting in strong decrease in the relaxation time that increases the ac electrical conductivity. The glycation effect is well seen via data in Figs. 3e and 3f. In Fig. 3e, one can see a weak dependence of the ac-electrical conductivity with the glycation processes. This weak dependence of σac (ω, GG, T) is attributed to the increase of the relaxation time due to the increase of RBCs-mass with glycation. However, the increase with frequency is still predominant.
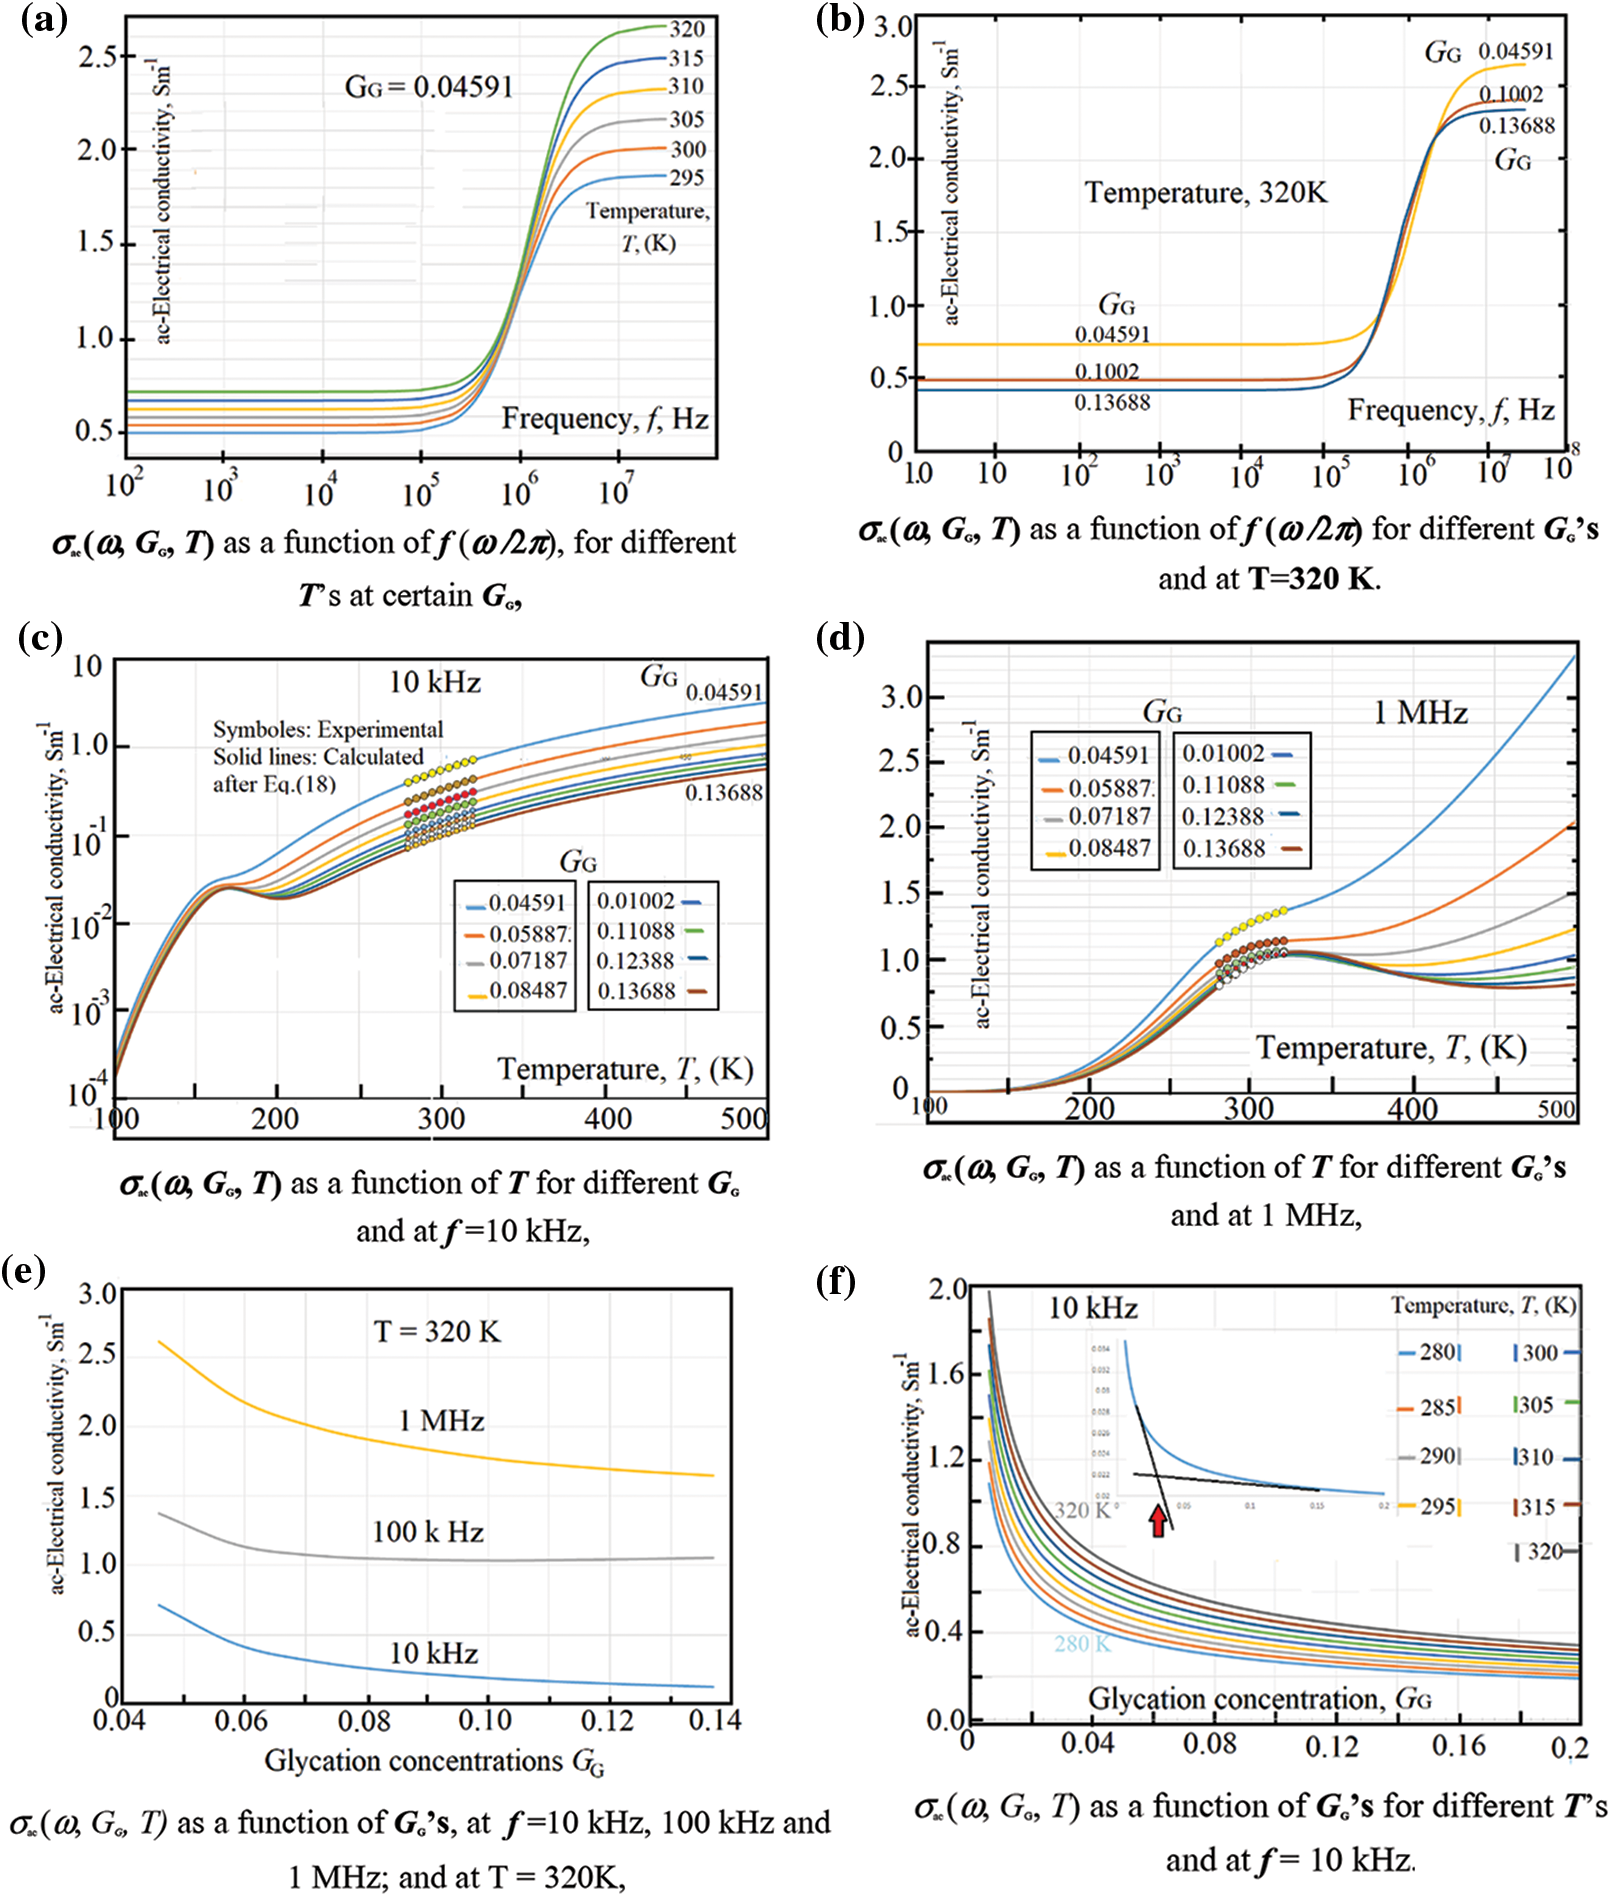
Figure 3: (a) σac (ω, GG, T) as a function of f (ω /2 π), for different T’s at certain GG, (b) σac (ω, GG, T) as a function of f (ω /2 π) for different GG’s and at T = 320 K. (c) σac (ω, GG, T) as a function of T for different GG and at f = 10 kHz, (d) σac (ω, GG, T) as a function of T for different GG’s and at 1 MHz, (e) σac (ω, GG, T) as a function of GG’s, at f = 10 kHz, 100 kHz and 1 MHz; and at T = 320 K, (f) σac (ω, GG, T) as a function of GG’s for different T’s and at f = 10 kHz

Figure 4: (a) ε’ (ω, GG, T) as a function of f (ω /2π), for different T’s and at GG = 0.13688, (b) ε’ (ω, GG, T) as a function of f (ω /2π), for different GG’s and at T = 0.13688, (c) ε’ (ω, GG, T) as a function of f (ω /2π), at temperature T = 0.13688, (d) ε’ (ω, GG, T) as a function of T, for different GG’s and at f = 1 MHz, (e) ε’ (ω, GG, T) as a function of GG for different T’s, and at f = 10 kHz, (f) ε’ (ω, GG, T) as a function of GG’s for different T’s, and at f = frequency 1 MHz, (g) ε’ (ω, GG, T) as a function of at GG’s for different T’s, and at f = 1 MHz
3.1.2 Dielectric Constant of Glycated-Blood as a Function of Frequency for Different Glycation Concentrations, and at Different Temperatures
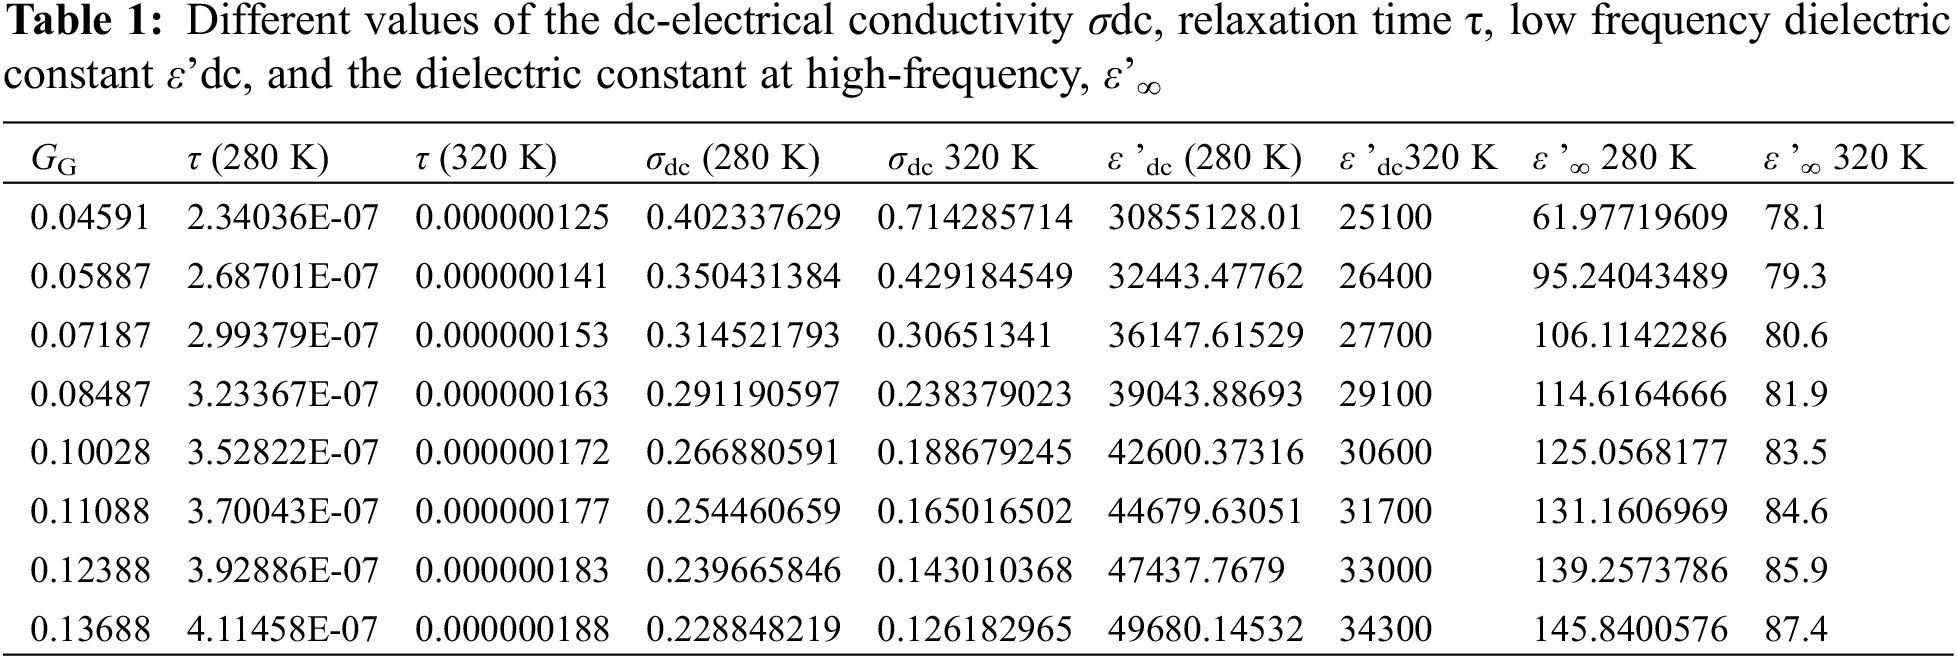
Fig. 4a shows the dielectric constant ε’ (ω, T, GG = 0.13688) as a function of frequency for different temperatures at certain GG value: GG = 0.13688. Here, we can notice a relatively long plateau with no variations of ε’with ω from 1 Hz up to about 50 kHz. This behavior is in complete harmony with the data in Fig. 3a concerning the plateau of ac-electrical conductivity σac (ω, T, GG = 0.13688) variations with frequency at the same temperatures and at the same GG value. The weak variations of ε’ with frequency is directly attributed to the very weak response of the RBCs to the ac-electric field at low frequencies. At these low frequencies, all the electric charges (dipoles) surrounded the RBCs are tightly bonded to the micro particles and the relaxation times is so high that there is nearly no response from the RBCs to the applied external field, which explains the presence of such plateau. At moderate frequency, however, the dielectric constant decreases rapidly with frequency (Fig. 4a) which is in complete accordance with the increase of the electrical conductivity (Fig. 3a) due to the rapid decrease of the relaxation time at these moderate frequencies. The decrease of ε’ with frequency is attributed to good response of the charged dipoles to the external field; then, the dielectric constant continues to decrease with the frequency till reaching a limit value ε’∞ at very high frequency. At ε’∞, one finds that all the dipoles surrounded the RBCs have attained the limit polarization at high frequency with a minimum relaxation time corresponds to τ∞ = ε’∞/σ∞. One can see the ε’-behavior at all frequencies via Eq. (19): This equation shows clearly that at low frequency (when ω tends to zero) ε’tends to a constant value (ε’dc - ε’∞). At moderate frequencies, ε’ starts to decrease with frequency until reaching an inflection point at critical frequency when 2π *f critical = ω = 1/τcritical; then it tends to a limit value ε’∞ at very high frequencies. Fig. 4b confirms this behavior: One can see a net stability of ε’ (ω, GG, T = 290 K) as function of frequency in the low frequency range; the curve starts to decrease at moderate frequencies followed by an inflection point and finish by a limit value ε’∞ at very high frequencies. At 280 K and 320 K with two glycation concentrations: 0.04591 and 0.13688, Table 1 reports on different values of the dc-electrical conductivity σdc, relaxation time τ, low frequency dielectric constant ε’dc, and the dielectric constant at high-frequency, ε’∞.
The effect of temperature variation on ε’ is seen in Figs. 4c and 4d. Fig. 4c shows the dielectric constant ε’ (T, GG, at 10 kHz) as a function of temperature for different glycation concentrations, at 10 kHz. Here, we can notice a steep rise of ε’with T at low temperatures. This is due to the formations of more “static” dipoles with temperature, which corresponds to the constant-value of ac-electrical conductivity in the low temperature range (Fig. 2d). This steep rise is followed directly by smooth maxima which depend on temperature. Such maxima happen when the applied frequency fcritical matches well with the relaxation time τcritical of RBCs in such a way that 2πf critical *τ critical = ω critical *τ critical = 1.
Fig. 4d shows the dielectric constant ε’ (GG, T, f = 1 MHz) as a function of glycation concentration, GG for different temperatures, here we can notice no variations of ε’ with ω from 1 Hz up to about 50 kHz. This behavior is in complete harmony with the constancy of the data concerning the ac-electrical conductivity σac (ω, T, GG = 0.13688) variations with frequency at the same temperatures. One can notice, also, in Fig. 4d that the maxima region has been displaced towards higher temperatures when measuring the frequency at 1 MHz.
These maxima are, also, function of both temperature and glycation concentration ratios as those found in Fig. 4c. Comparing the maxima in both figures, one finds a net change of the curves-shape. This is due to the nature of relaxed dipoles: In low temperature range (Fig. 4c, at 10 kHz- c), the relaxation time is by far higher than the maxima which are reported in Fig. 4d.
Moreover, the effect of glycation variations on ε’ is seen in Figs. 4e–4g: Fig. 4e shows the dielectric constant ε’ (GG, T, at 10 kHz) as a function of glycation concentrations GG for different temperatures, at 10 kHz. Here we can notice a regular increase of ε’ (GG, T, at 10 kHz) with GG with faint effect of temperature. At the present case, the formations of quasi-static dipoles with temperature has no important effect because the mass (of dipoles) increases due to glycation which decreases the relaxation time, which increases, in turn, the dielectric constant. This is corresponding to the constant-value of ac-electrical conductivity in the low temperature range (Fig. 3d). Fig. 4f shows the dielectric constant as a function of the glycation concentration for different values of temperatures. One can see at 100 K up to 300 K the presence of net maxima. These maxima are so weakened with temperature that they disappear at 400 K. In order to explain this behavior, one sees that at lower temperature the number of dipoles increases with temperature which increases the dielectric constant. However, this increase is masked by increasing temperature in such a way that the relaxation time τG,T given by Eq. (15) masks the increase of dipoles-number. From Eq. (15), τG,T depends exponentially on the temperature in such a way that at low temperatures τG,T is by far greater than τG,T at high temperatures. This yields high values of τG,T at higher temperatures. τG,T continue decreasing with temperature which decreases ε’G, T till reaching ε’∞ at very high temperatures.
From the data in Fig. 4f, one can see that ε’passes by maxima depend on the temperature. This behavior is controlled by two parameters: (i) increasing of dipoles number with temperature which increases the dielectric constant and, on the contrary, (ii) decreasing ε’ with increasing the relaxation time effect: First, ε’increases with temperature from 100 K up to about 200 K, followed by maxima, then decrease with temperature. As a matter of fact, ε’ increases with temperature due to the increase of dipoles number with temperature. However, the relaxation time effect is very weak at low temperature according to the exponential behavior of the temperature (see Eq. (15)); then above about 250 K, the increase of the number of dipoles is highly masked by the relaxation time effect.
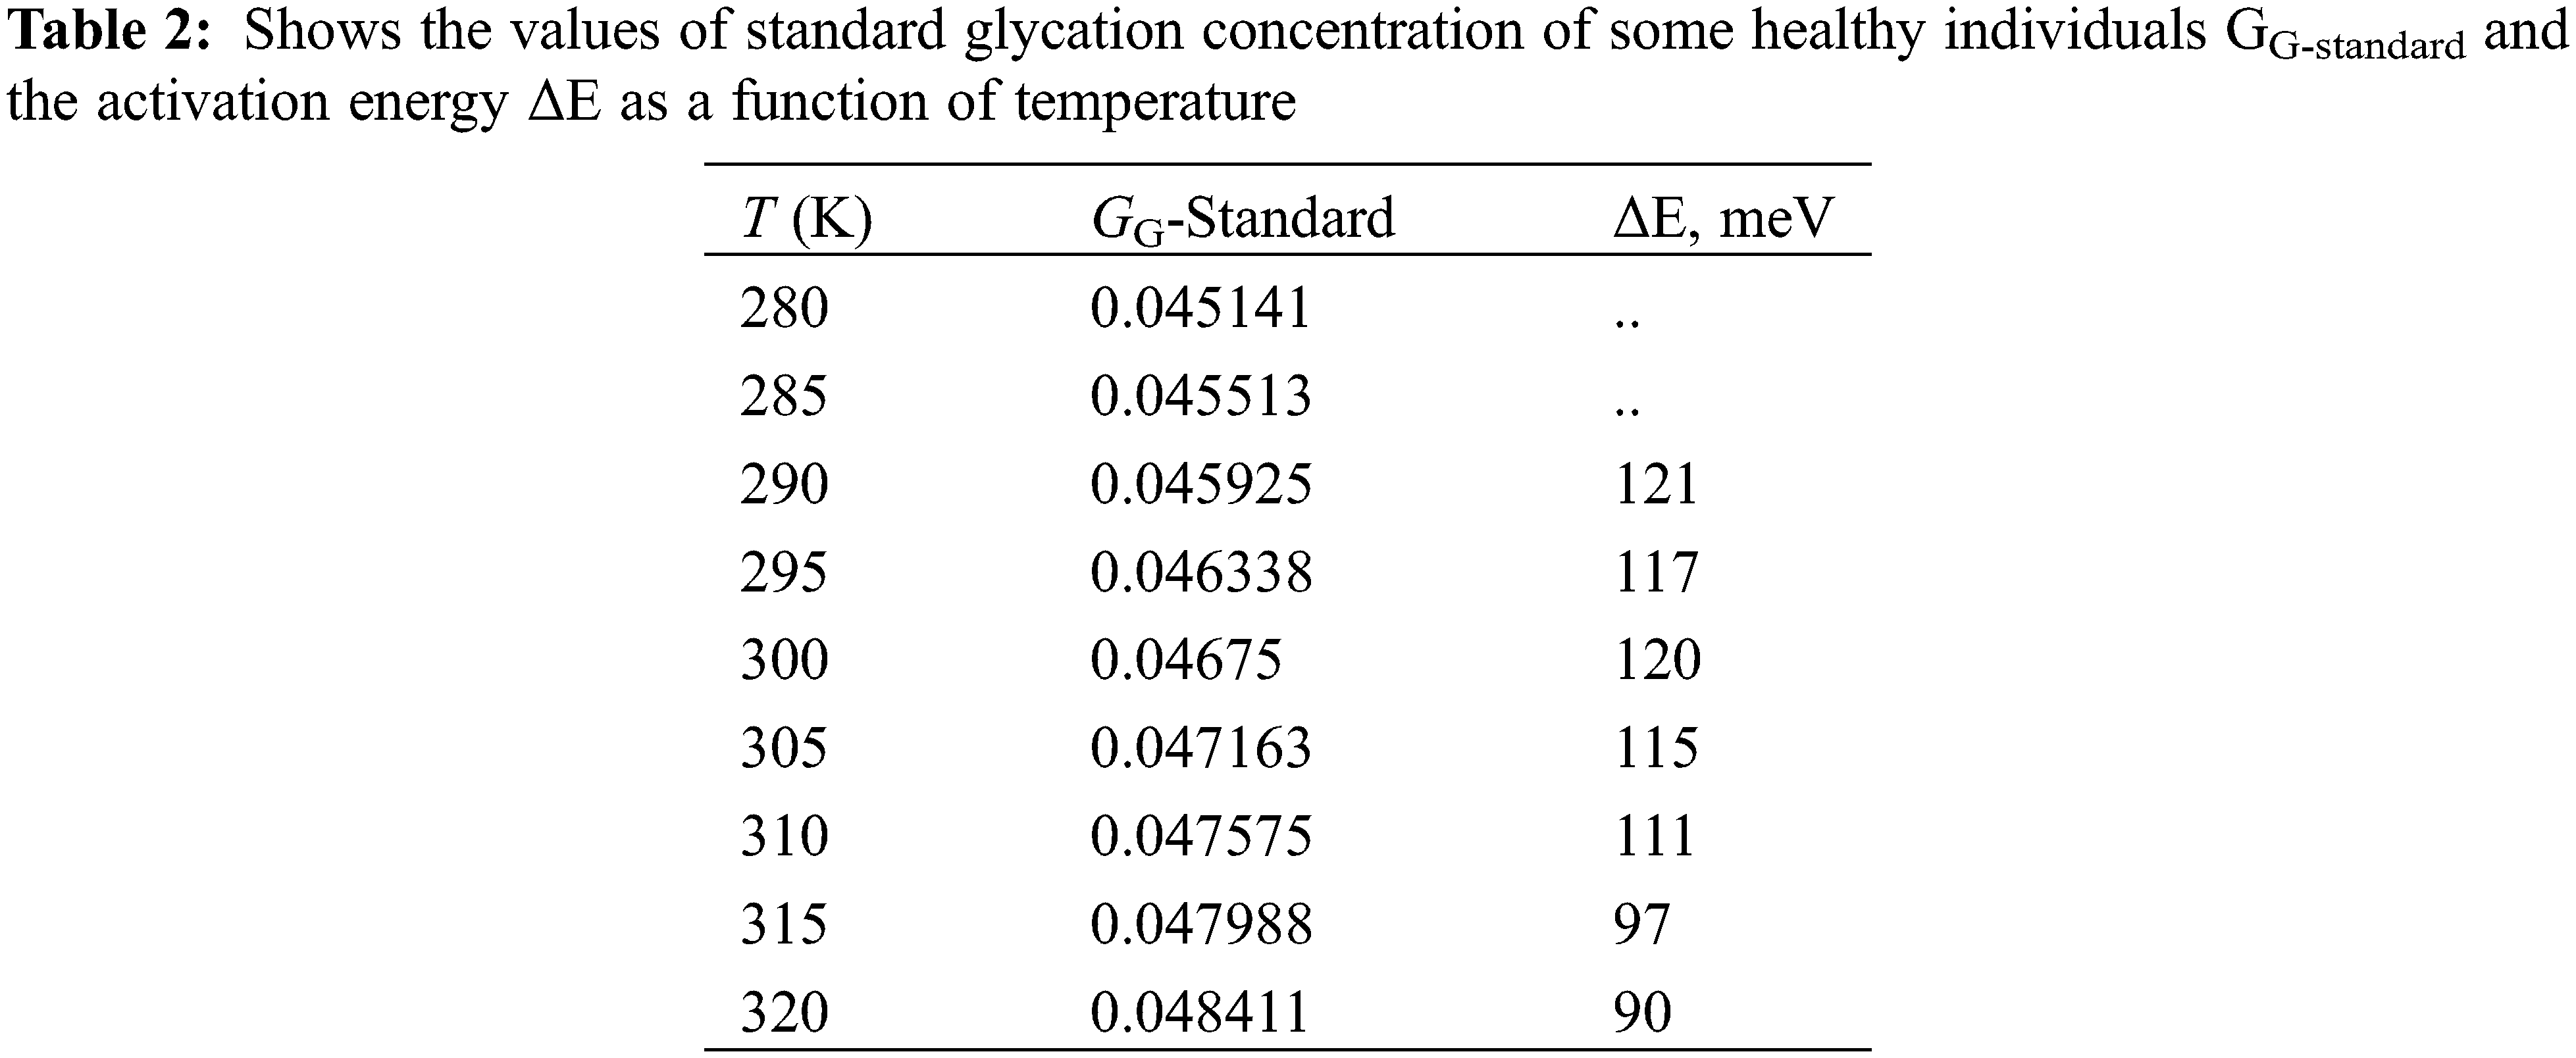
Moreover, we consider the maxima values as the allowed minimum glycation value for a non-diabetic individual (standard and healthy human). Table 2 shows the values of GG-standard as a function of temperature. Fig. 4g reports on the variations of ε’ (GG, f, at 320 K) with GG at three frequencies, and at 320 K. As it is seen, ε’ (GG, f, at 320 K) varies smoothly with GG at certain frequency and certain temperature. This reflects the nature of the initial non-enzymatic covalent binding of glucose to hemoglobin bonds between electric charges through N-terminal HbA1c and the carbonyl group of glucose. The binding is so robust that further glycation effect become very weak. The data in Fig. 3g are in complete homogeneity with the data in Fig. 4g. So, the effect of glyction of RBCs (at certain temperature) increases ε’-parameters due to the increase of dipoles number with glycation, and the effect of thermal variations (temperature) of RBCs (at certain glyction concentration) increases ε’-parameters due to the increase of dipoles number with temperature, at low temperatures; then decreases ε’-parameters at higher ones.
3.1.3 Electric Losses of Glycated-Blood as a Function of Frequency for Different Glycation Concentrations, and at Different Temperatures
In this study, the complete broadband spectra are considered when combining the relaxation dispersion and the free RBCs motion (linear) contribution. Moreover, the blood plasma contains free ions in addition to the several types of microgerms such as RBCs, which contribute to the dc- and the ac-conductivity.
Applying an ac-electrical field on these RBCs and ions will add an oscillatory motion to the RBCs and ions. The oscillatory motion of ions appears at very high frequency which is far from the measurements of the present study (occurs at GHz range). The linear and oscillatory motions are completely independent. So, one has to cancel the dc-conductivity role when the fitting routine. Therefore, we have subtracted σdc (GG, T) from the total measured ac-conductivity σac (ω, GG, T). Fig. 5a shows the electric losses ε” (ω, T, GG = 0.04591) as a function of frequency for different temperatures, at glycation rate GG = 0.04591. One can see a plateau of ε” with ω from 1 Hz up to about 10 kHz, followed by some maxima of the curves(near 50 kHz). These maxima are very sensitive to both temperature and glycation concentrations. At about 10 MHz, the curves tend to obey the plateau shape, followed by constant values at very high frequencies.
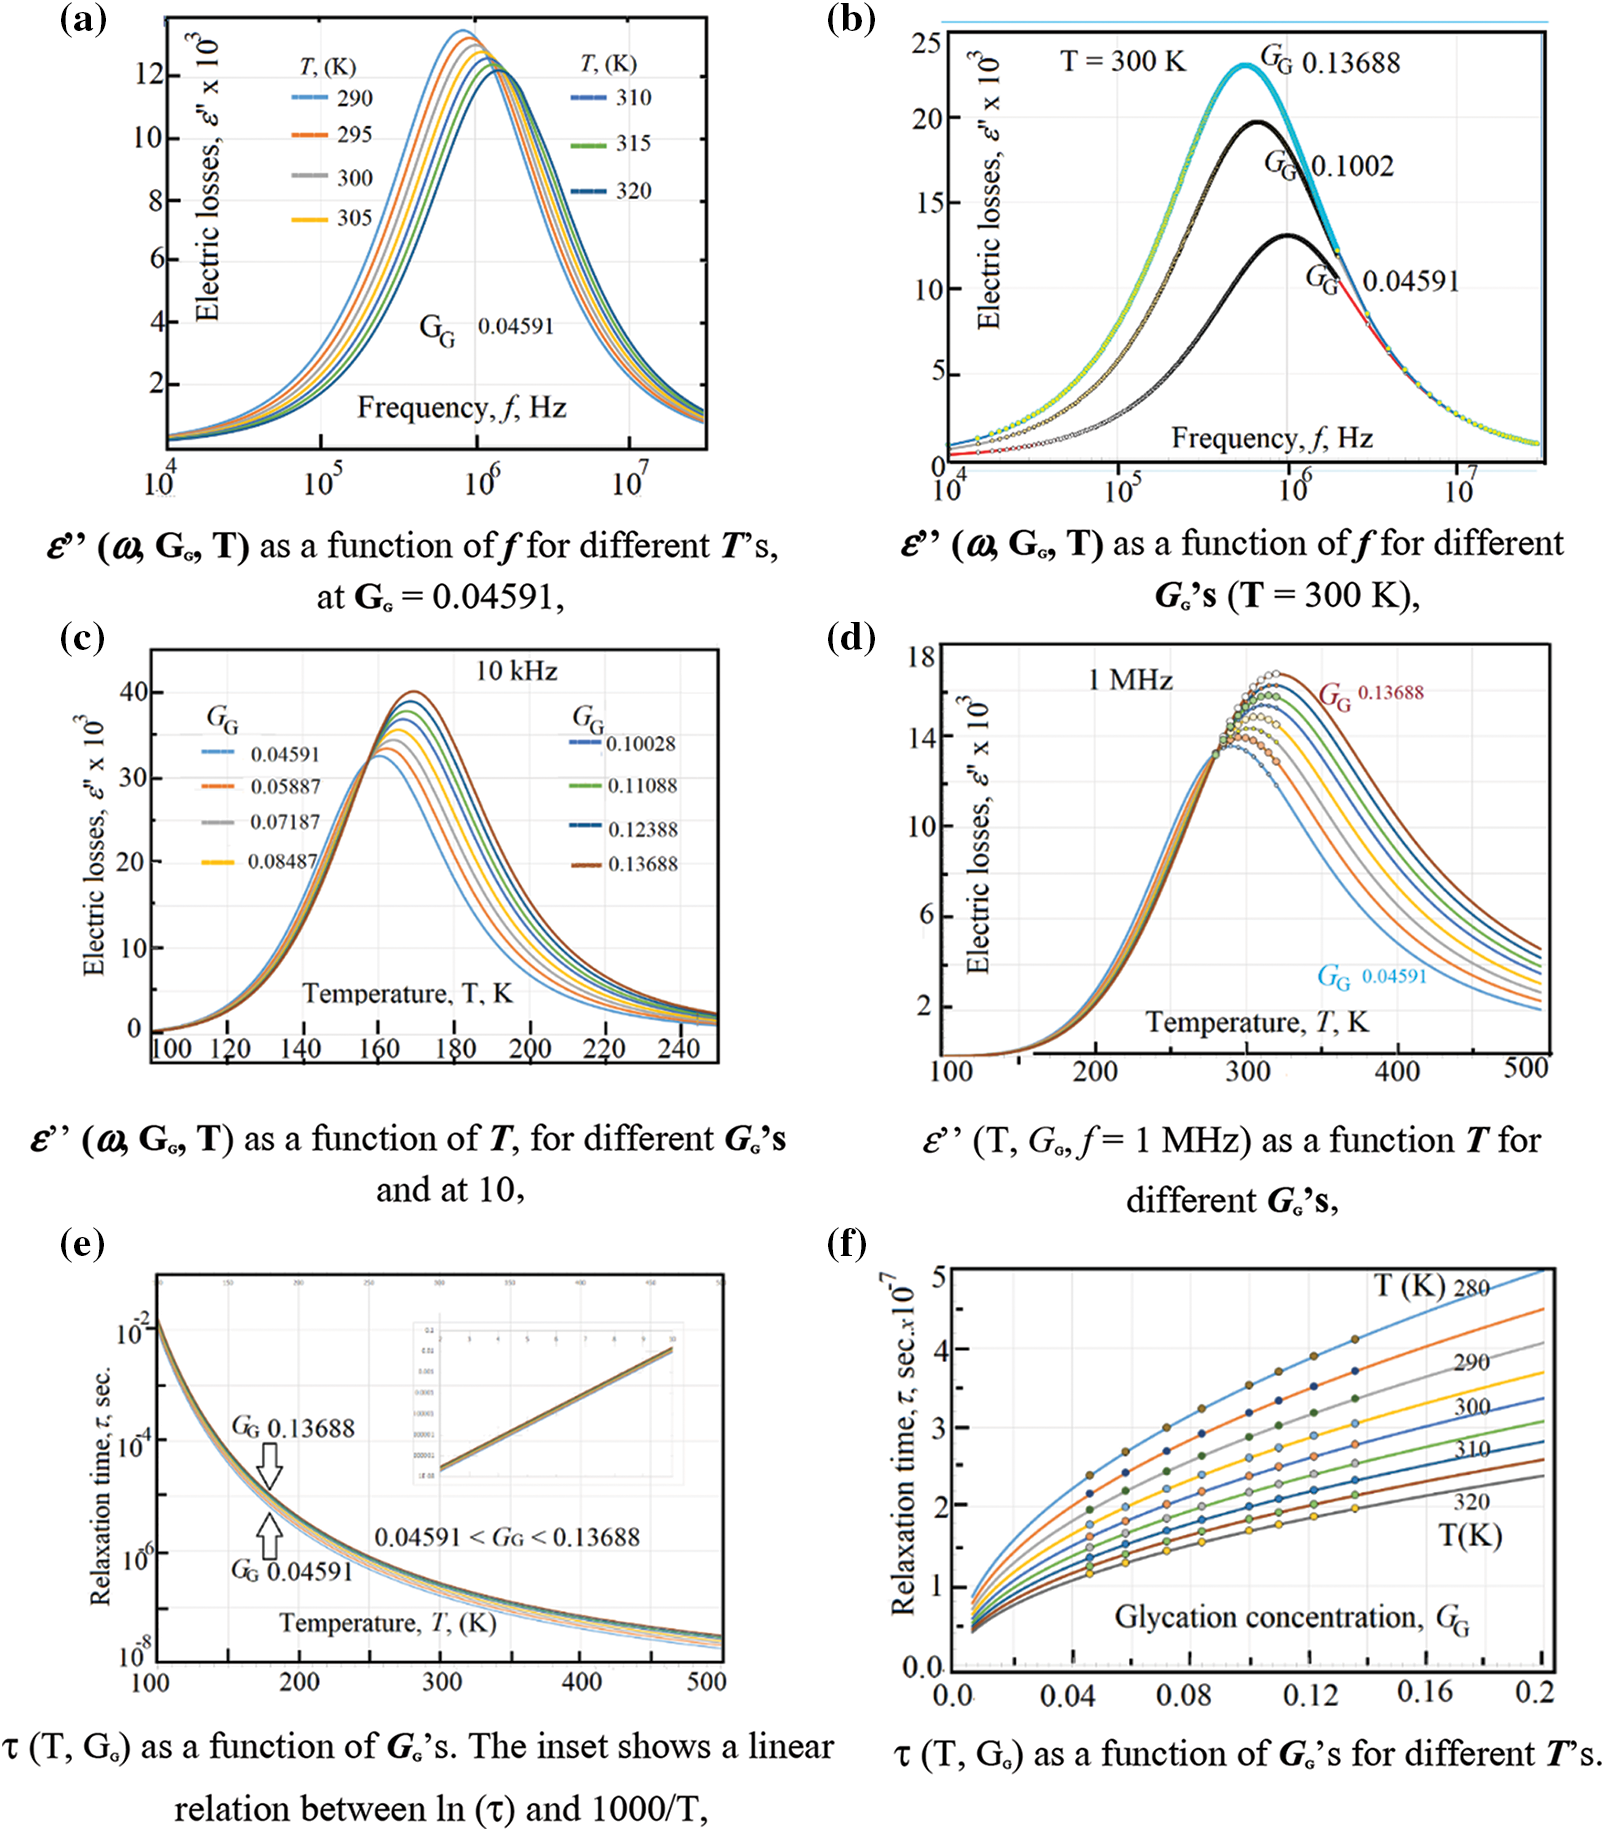
Figure 5: (a) ε’’ (ω, GG, T) as a function of f for different T’s, at GG = 0.04591, (b) ε’’ (ω, GG, T) as a function of f for different GG’s (T = 300 K), (c) ε’’ (ω, GG, T) as a function of T, for different GG’s and at 10 kHz. (d) ε’’ (T, GG, f = 1 MHz) as a function T for different GG’s (e) τ (T, GG) as a function of GG’s. The inset shows a linear relation between ln (τ) and 1000/T, (f) τ (T, GG) as a function of GG’s for different T’s
Alternatively, the same data are presented in Fig. 5b where one can see the electric losses ε” (ω, GG, T = 300 K) as a function of frequency for different glycation rates and at 300 K. Similar to Fig. 5a, one can see a plateau of ε” with ω from 1 Hz up to 10 kHz, then the curve starts to increase (near 50 kHz) till reaching some maxima of the curves. Here, the maxima vary with the glycation concentrations; while in Fig. 5a they vary with temperatures at certain glycation concentration.
The effect of temperature is well seen when plotting the electric losses ε” (T, GG, f = 10 kHz) as a function of temperature for different glycation rates at 10 kHz (Fig. 5c). At this frequency, the maxima of the curves lay in the temperature range from 160 K up to 170 K (Fig. 5c). However, these maxima are highly displaced from 290 K up to 320 K when applying 1 MHz as it is seen in Fig. 5d. This displacement towards the higher temperatures is well explained if one take into consideration the variation of the relaxation time with temperature as given by Eq. (15).
In order to calculate the relaxation time of RBCs τT, GG (T, GG) as a function of both temperature and glycation concentration, one have considered the data in Figs. 5a–5d as following: (i) One considers the experimental data of ε” (ω, T, GG) in the ranges: 280 K < T < 320 K, 0.04591 < GG < 0.13688, and 1 Hz < ω < 32 MHz that shown in Figs. 5a and 5b. (ii) One reports the value of the critical frequency at which the maximum has been attained at certain temperature and certain glycation concentration, (iii) We precise the critical frequency, fG,T, as a function of temperature at each glycation rate from the experimental data in Fig. 5a, (iv) We precise the critical frequency, fG,T, as a function of glycation rate at each temperature from the experimental data in Fig. 5b. Then, one uses Eq. (15) to estimate the relaxation time as the inverse of the critical angular frequency τG,T = 1/(2πfG,T) = 1/ωG,T. Table 1 reports on the relaxation time values as a function of glycation concentrations for two temperatures 280 K and 320 K.
Fig. 5e reports on the relaxation time as a function of temperature at the range 0.04591 < GG < 0.13688 and Fig. 5f reports on the relaxation time as a function of GG in the temperature range 280 K < T < 320 K.
As it is seen, in Fig. 5c, the relaxation time is a weak function of the glycation concentration, which is confirmed in the data in Fig. 5d. The inset in Fig. 5e shows the variations of τ (T, GG) as a function of the inverse of temperature. The linear semi logarithmic curve, in the inset of Fig. 5, reveals the presence of thermal energy activation ΔEτ that obeys relation (15). We have found, after data in Fig. 5e, that ΔEτ = 0.14 eV.
3.1.4 Cole and Cole Representation with Temperature Variations
As it is well known [40] Cole and Cole curve represented by the dielectric constant as x-axis and the electric losses as y-axis. We present the Cole and Cole curves in 2-versions: (i) Cole and Cole with temperature as a variable parameter under constant value of glycation concentration GG = 0.04591 (Fig. 6a), and (ii) Cole and Cole with glycation concentration as a variable parameter under constant temperature T = 300 K (Fig. 6b). However, in order to compare between the circle diameters, one presents, in Fig. 6c Cole and Cole curves in three pairs: The first (the smallest-blue color) happens at GG = 0.04591 where the diameter of circle with 290 K is greater than that of 320 K, the second pair (mid-diameter with orange color) happens at GG = 0.1002 where the diameter of circle with 290 K is greater than that of 320 K, and the third (largest pair-gray color) occurs at GG = 0.13688 where the diameter of circle with 290 K is greater than that of 320 K.
As it is previously mentioned in reference [18], the importance of Cole and Cole curves lies when estimating the effective number of electric charges found in the medium. One uses the word “effective” in order to show the real number of charges that really affects the glycation processes.
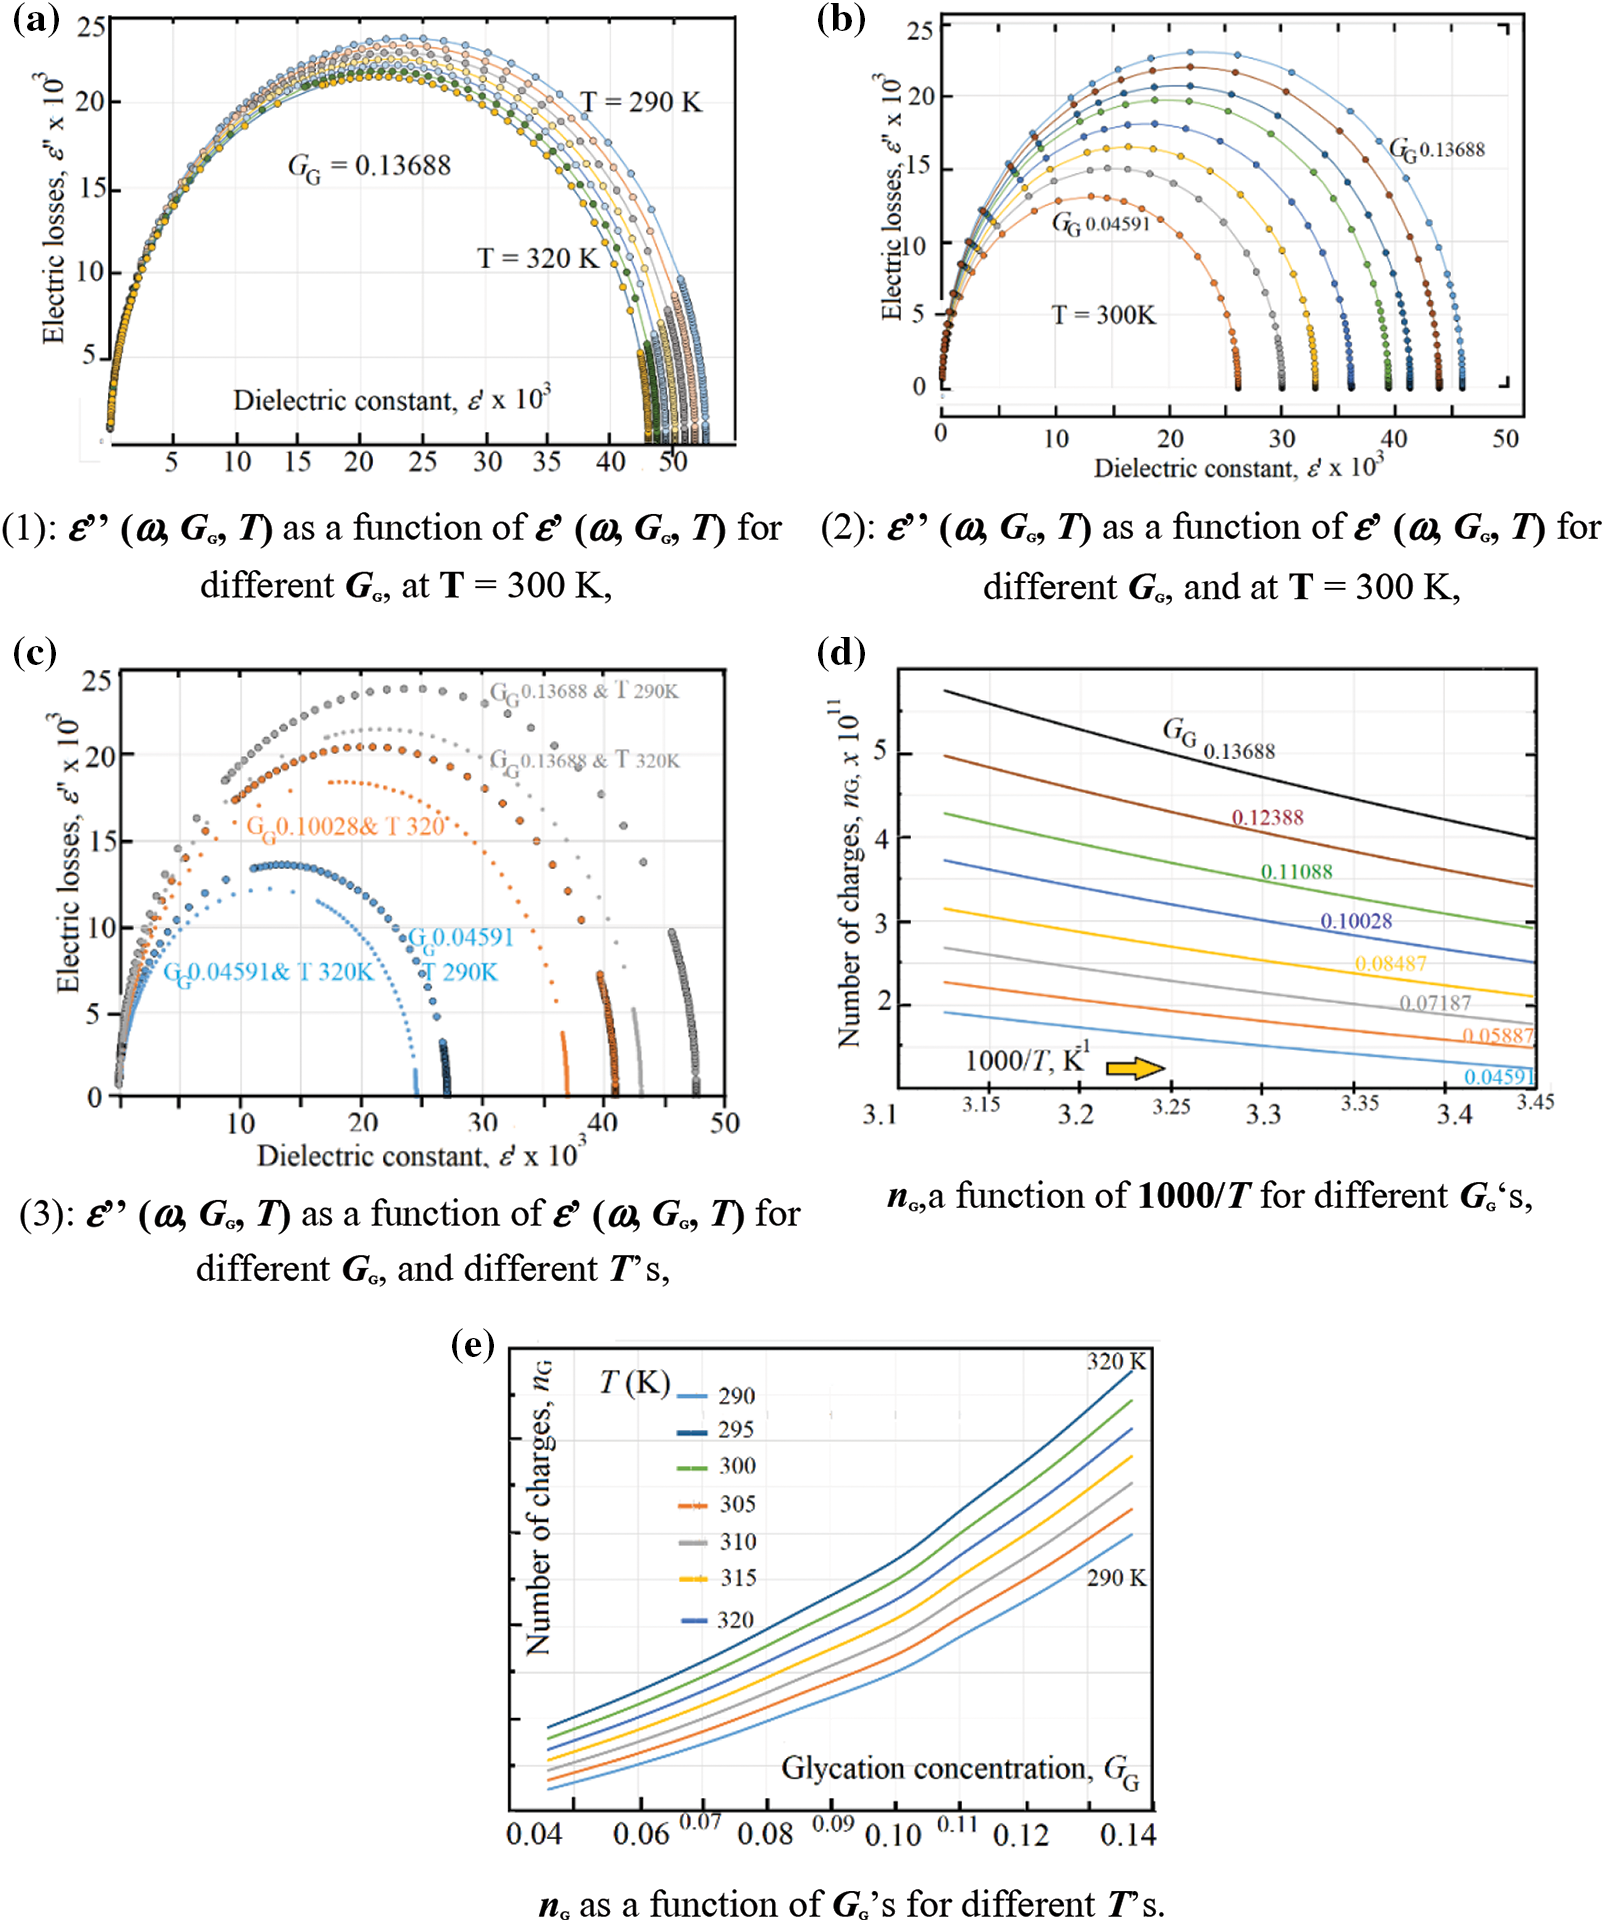
Figure 6: (a) ε’’ (ω, GG, T) as a function of ε’ (ω, GG, T) for different GG, at T = 300 K, (b) ε’’ (ω, GG, T) as a function of ε’ (ω, GG, T) for different GG, and at T = 300 K, (c) ε’’ (ω, GG, T) as a function of ε’ (ω, GG, T) for different GG, and different T’s (d) nG, a function of 1000/ T for different GG’s, (e) nG as a function of GG’s for different T’s
In fact, the number of produced electric-dipoles increases when the tail-amide group of hemoglobin joins the ketone group in glucose through the glycation processes. In reference [18], the authors have reported an increase of the Cole-Cole diameter-circle with glycation and found an empirical equation, at room temperature, relating the effective number of electric charges in one mm3 (nG) as: nG = 9.8 x 10⁹ + 8.2 x 10¹²GG [18]. This value has been found, at 300 K, in Fig. 6d, where nG is illustrated as a function of 1000/T for different GG values; while Fig. 6e shows nG as a function of GG for different temperatures. In the present study, one estimates the effective number of charges after Cole and Cole data after Eq. (24).
From the data in Figs. 6d and 6e one can see an exponential variation of nG as a function of temperature with an activation energy (ΔE) varies in the range: 90 meV < ΔE < 120 meV, Table 2 shows both the activation energy ΔE and the corresponding nG0 value for each temperature.
The effective number nG varies exponentially with temperature as the following exponential equation, nG = nG0 * exp (-ΔE/kT), where the critical (limit) number of charges at very high temperatures, nG0 = 1.34 x 1011 mm-3.
The present study reveals that the ac-electric/dielectric measurements can be accurately used to characterize and to estimate the glycation concentrations of the hemoglobin in a RBC. The net electric charges on the RBCs increases with both temperature and glycation rate, which increases the mass of glycated RBCs. This mass-increase drastically decreases the relaxation time of RBCs which increases both electric losses and dielectric constant; however, the ac- and dc-electrical conductivity decreases with glycation due to mass increase. Moreover, we have found that a suspended RBC attains its minimum potential energy when an optimum equality (condition) between its activation energy and its thermal energy happens. Finally, as it is above-mentioned, we shed the light to the possible combination of focused ultrasound with magnetic resonance imaging to study the dielectric-thermal variations of glycated-RBCs which can lead to very precise and non-invasive monitoring of glycation concentration in vivo and in vitro via magnetic resonance-thermometry.
Funding Statement: The authors received no specific funding for this study.
Conflicts of Interest: The authors declare that they have no conflicts of interest to report regarding the present study.
1. Stier, A. (2021). Human blood contains circulating cell-free mitochondria, but are they really functional? American Journal of Physiology-Endocrinology and Metabolism, 320(5), 859–863. DOI 10.1152/ajpendo.00054.2021. [Google Scholar] [CrossRef]
2. Becker, C. D., Stichtenoth, D. O., Wichmann, M. G., Schaefer, C., Szinicz, L. (2009). Blood donors on medication–An approach to minimize drug burden for recipients of blood products and to limit deferral of donors. Transfusion Medicine and Hemotherapy, 36(2), 107–113. DOI 10.1159/000203355. [Google Scholar] [CrossRef]
3. Widmaier, E., Raff, H., Strang, K. (2019Vander’s human physiology. McGraw-Hill Education (15th Editionpp. 493(ch. Respiratory physiology, Transport of carbon dioxide in blood). [Google Scholar]
4. Guyton, J., Hall, J. E. (2015). Textbook of medical physiology, pp. 204. Saunders,London. [Google Scholar]
5. Janeway, C. A., Travers, P., Walport, M., Shlomchik, M. (2001). The components of the immune system. Immunobiolog: The immune system in health and disease (5th edition). New York: Garland Science.https://www.ncbi.nlm.nih.gov/books/NBK27092/. [Google Scholar]
6. Chaussabel, D., Pascual, V., Banchereau, J. (2010). Assessing the human immune system through blood transcriptomics. BMC Biolology, 8, 84. DOI 10.1186/1741-7007-8-84. [Google Scholar] [CrossRef]
7. Dache, Z. A. A., Otandault, A., Tano, R., Pastor, B., Romain, M. et al. (2020). Blood contains circulating cell-free respiratory competent mitochondria. Federation of American Societies for Experimental Biology Journal, 34(3), 3616–3630. DOI 10.1096/fj.201901917RR. [Google Scholar] [CrossRef]
8. Wu, Y., Ding, Y., Tanaka, Y., Zhang, W. (2014). Risk factors contributing to type 2 diabetes and recent advances in the treatment and prevention. International Journal of Medical Sciences, 11(11), 1185–1200. DOI 10.7150/ijms.10001. [Google Scholar] [CrossRef]
9. Atlas, I. D. F. (2021). Diabetes around the world in 2021. https://www.diabetesatlas.org/en/sections/worldwide-toll-of-diabetes.html. [Google Scholar]
10. The International Diabetes Federation (2030). One billion people globally estimated to be living with obesity by 2030https://.https://www.idf.org/news. [Google Scholar]
11. Khan, F. A. (2018). Newer approach in the management of diabetes and reduction of HbA1c level by the use of natural remedies over synthetic drugs. Pharmacy & Pharmacology International Journal, 6(5), 357–361. DOI 10.15406/ppij.2018.06.00201. [Google Scholar] [CrossRef]
12. McGovern, A. P., Dennis, J. M., Shields, B. M., Hattersley, A. T., Pearson, E. R. (2019). What to do with diabetes therapies when HbA1c lowering is inadequate: add, switch, or continue? A MASTERMIND study. BMC Medicine, 17, 79. DOI 10.1186/s12916-019-1307-8. [Google Scholar] [CrossRef]
13. Cottle, L., Gan, W. J., Gilroy, I., Samra, J. S., Gill, A. J. et al. (2021). Structural and functional polarization of human pancreatic beta cells in islets from organ donors with and without type 2 diabetes. Diabetologia, 64, 618–629. DOI 10.1007/s00125-020-05345-8. [Google Scholar] [CrossRef]
14. Dai, X., Heng, B. C., Bai, Y., You, F., Sun, X. et al. (2020). Restoration of electrical microenvironment enhances bone regeneration under diabetic conditions by modulating macrophage polarization. Bioactive Materials, 6(7), 2029–2038. DOI 10.1016/j.bioactmat.2020.12.020. [Google Scholar] [CrossRef]
15. Lee, J. E. (2015). Alternative biomarkers for assessing glycemic control in diabetes: Fructosamine, glycated albumin, and 1, 5-anhydroglucitol. Annals of Pediatric Endocrinology & Metabolism, 20(2), 74–78. DOI 10.6065/apem.2015. 20.2.74. [Google Scholar] [CrossRef]
16. Costa, D., Lourenço, J., Monteiro, A. M., Castro, B., Oliveira, P. et al. (2020). Clinical performance of flash glucose monitoring system in patients with liver cirrhosis and diabetes mellitus. Scientific Reports, 10(1), 7460. DOI 10.1038/s41598-020-64141-x. [Google Scholar] [CrossRef]
17. Valenzano, M., Cibrario, B., Valenzano, A., Grassi, G. (2021). Time in range-A1c hemoglobin relationship in continuous glucose monitoring of type 1 diabetes: A real-world study. BMJ Open Diabetes Research Care, 9(1), e001045. DOI 10.1136/bmjdrc-2019-001045. [Google Scholar] [CrossRef]
18. Abdalla, S., Farsaci, F., Tellone, E., Shirbeeny, W., Hassan, A. M. et al. (2022). Hemoglobin glycation increases the electric charges on red blood cells: Effects of dielectric polarization. Materials Chemistry and Physics, 276, 125348. DOI 10.1016/j.matchemphys.2021.125348. [Google Scholar] [CrossRef]
19. Cohen, R. M., Franco, R. S., Khera, P. K., Smith, E. P., Lindsell, C. J. et al. (2008). Red cell life span heterogeneity in hematologically normal people is sufficient to alter HbA1c, Dielectric properties of healthy and diabetic alloxan-induced lenses in rabbits. Blood, 112(10), 4284–4291. DOI 10.1182/blood-2008-04-154112. [Google Scholar] [CrossRef]
20. Rashed, E. R., Alkout, A. T., Eltomy, S. S., Etekbali, O. R., Alkou, A. et al. (2020). The effects of red blood cells parameters on HbA1c and random blood sugar levels in diabetics diagnosis. International Journal of Diabetes and Clinical Research, 7(3), 128. DOI 10.23937/2377-3634/1410128. [Google Scholar] [CrossRef]
21. Prosenz, J., Öhlinger, T., Müllner, E. W., Marculescu, R., Gerner, C. et al. (2019). Glycated hemoglobin concentrations of red blood cells minimally increase during storage under standard blood banking conditions. Transfusion, 454, 59. DOI 10.1111/trf.14956. [Google Scholar] [CrossRef]
22. Bhattarai, G., So, H. S., Kieu, T. T. T., Kook, S. H., Lee, J. C. et al. (2021). Astaxanthin inhibits diabetes-triggered periodontal destruction, ameliorates oxidative complications in STZ-injected mice, and recovers Nrf2-dependent antioxidant system. Nutrients, 13(10), 3575. DOI 10.3390/nu13103575. [Google Scholar] [CrossRef]
23. Singh, V. P., Bali, A., Singh, N., Jaggi, A. S. (2014). Advanced glycation end products and diabetic complications. Korean Journal of Physiology & Pharmacology, 18(1), 1–14. DOI 10.4196/kjpp.2014.18.1.1. [Google Scholar] [CrossRef]
24. Nadeem, A. A., Dash, D. A. (2013). Glycated proteins: Role in production of autoantibodies in diabetes mellitus and effect of inhibitors on non-enzymatic glycation. Aging and Disease, 4(1), 50–56. [Google Scholar]
25. Remigante, A., Morabito, R., Spinelli, S., Trichilo, V., Loddo, S. et al. (2020). D-Galactose decreases anion exchange capability through band 3 protein in human erythrocytes. Antioxidants, 9(8), 689. DOI 10.3390/antiox9080689. [Google Scholar] [CrossRef]
26. Diederich, C. J. (2005). Thermal ablation and high-temperature thermal therapy: Overview of technology and clinical implementation. International Journal Hyperthermia, 21(8), 745–753. DOI 10.1080/02656730500271692. [Google Scholar] [CrossRef]
27. Abdullah, B., Subramaniam, R., Omar, S., Wragg, P., Ramli, N. et al. (2010). Magnetic resonance-guided focused ultrasound surgery (MRgFUS) treatment for uterine fibroids. Archive of Biomedical Imaging and Intervention Journal, 6(2), e15. DOI 10.2349/biij.6.2.e15. [Google Scholar] [CrossRef]
28. Staruch, R., Chopra, R., Hynynen, K. (2011). MRI-controlled ultrasound thermal therapy, pulse. Institute of Electrical and Electronics Engineers, 2(5), 39–47. DOI 10.1109/MPUL.2011.942604. [Google Scholar] [CrossRef]
29. Collins, C. M., Wang, Z. (2011). Calculation of radiofrequency electromagnetic fields and their effects in MRI of human subjects. Magnetic Resonance in Medicine, 65(5), 1470–1482. DOI 10.1002/mrm.22845. [Google Scholar] [CrossRef]
30. Xin, X., Wang, D., Han, J., Feng, Y., Feng, Q. et al. (2012). Numerical optimization of a three-channel radiofrequency coil for open, vertical-field, MR-guided, focused ultrasound surgery using the hybrid method of moment/finite difference time domain method. NMR in Biomedicine, 25(7), 909–916. DOI 10.1002/nbm.1811. [Google Scholar] [CrossRef]
31. Prakash, P. (2010). Theoretical modeling for hepatic microwave ablation. Open Biomedical Engineering Journal, 4, 27–38. DOI 10.2174/1874120701004020027. [Google Scholar] [CrossRef]
32. Abdalla, S., Al-ameer, S. S., Al-Magaishi, S. H. (2010). Electrical properties with relaxation through human blood. Biomicrofluidics, 4, 34101. DOI 10.1063/1.3458908. [Google Scholar] [CrossRef]
33. Abdalla, S. (2011). Effect of erythrocytes oscillations on dielectric properties of human diabetic-blood. AIP Advances, 1(1), 012104. DOI 10.1063/1.3556986. [Google Scholar] [CrossRef]
34. Abdalla, S. (2011). Low frequency dielectric properties of human blood. IEEE Transactions on Nano Bioscience, 10(2), 113–120. DOI 10.1109/TNB.2011.2159734. [Google Scholar] [CrossRef]
35. Abdalla, S. (2011). Complex permittivity of blood cells and E. coli suspensions. Journal of Molecular Liquids, 160(3), 130–135. DOI 10.1016/j.molliq.2011.03.004. [Google Scholar] [CrossRef]
36. Abdalla, S. (2011). Gaussian distribution of relaxation through human blood. Physica B: Condensed Matter, 406(3), 584–587. DOI 10.1016/j.physb.2010.11.047. [Google Scholar] [CrossRef]
37. Sandler, S. I., Woodcock, L. V. (2011). Historical observations on laws of thermodynamics. Journal of Chemical & Engineering Data, 55, 4485–4490. DOI 10.1021/je10068282010. [Google Scholar] [CrossRef]
38. Ellahi, R., Zeeshan, A., Hussain, F., Asadollahi, A. (2019). Peristaltic blood flow of couple stress fluid suspended with nanoparticles under the influence of chemical reaction and activation energy. Symmetry, 11(2), 276. DOI 10.3390/sym11020276. [Google Scholar] [CrossRef]
39. Carvalho-Silva, V. H., Coutinho, N. D., Aquilanti, V. (2019). Temperature dependence of rate processes beyond arrhenius and eyring: Activation and transitivity. Frontiers in Chemistry, 7, 380. DOI 10.3389/fchem.2019.00380. [Google Scholar] [CrossRef]
40. Cole, K. S., Cole, R. H. (1941). Dispersion and absorption in dielectrics I. Alternating current. Journal of Chemical Physics, 9, 341–351. DOI 10.1063/1.1750906. [Google Scholar] [CrossRef]
41. Gabriel, S., Lau, R. W., Gabriel, C. (1996). The dielectric properties of biological tissues: III. Parametric models for the dielectric spectrum of tissues. Physics in Medicine & Biology, 41, 2271–2293. [Google Scholar]
42. Lazebnik, M., Okoniewski, M., Booske, J. H., Hagness, S. C. (2007). Highly accurate debye models for normal and malignant. IEEE Microwave Wireless components Letters, 17, 822–824. DOI 10.1109/LMWC.2007.910465. [Google Scholar] [CrossRef]
43. Maundy, B. J., Elwakil, A. S., Allagui, S. (2015). Extracting the parameters of the single-dispersion Cole bioimpedance model using a magnitude-only method. Computers and Electronics in Agriculture, 119, 153–157. DOI 10.1016/j.compag.2015.10.014. [Google Scholar] [CrossRef]
44. Aftab, S., Kurbanoglu, S., Ozcelikay, G., Shah, A., Ozkan, S. A. (2019). NH2-Functionalized multi walled carbon nanotubes decorated with ZnO nanoparticles and graphene quantum dots for sensitive assay of pimozide. Electroanalysis, 31, 1083–1094. DOI 10.1002/elan.201800788. [Google Scholar] [CrossRef]
45. Zhuang, S., Wang, H., Ding, K., Wang, J., Pan, L. et al. (2016). Interactions of benzotriazole UV stabilizers with human serum albumin: Atomic insights revealed by biosensors, spectroscopies and molecular dynamics simulations. Chemosphere, 144, 1050–1059. DOI 10.1016/j.chemosphere.2015.09.085. [Google Scholar] [CrossRef]
46. Li, J., Kikuchi, D., Sapkota, A., Takei, M. (2018). Quantitative evaluation of electrical parameters influenced by blood flow rate with multiple-frequency measurement based on modified Hanai mixture formula. Sensors and Actuators. B, Chemical, 268, 7–14. [Google Scholar]
47. Cole, K. S., Curtis, H. J. (1944). Electrical physiology: Electrical resistance and impedance of cells and tissues. Medical Physics, 1, 344–348. DOI 10.1101/SQB.1936.004.01.010. [Google Scholar] [CrossRef]
48. Baidillah, M. R., Iman, A. A. S., Sun, Y., Takei, M. (2017). Electrical impedance spectro-tomography based on dielectric relaxation model. IEEE Sensors Journal, 17, 8251–8262. DOI 10.3390/s22031025. [Google Scholar] [CrossRef]
49. Li, J., Sapkota, A., Kikuchi, D., Sakota, D., Maruyama, O. (2018). Red blood cells aggregability measurement of coagulating blood in extracorporeal circulation system with multiple-frequency electrical impedance spectroscopy. Biosensors and Bioelectronics, 112, 79–85. DOI 10.1016/j.bios.2018.04.020. [Google Scholar] [CrossRef]
50. Asama, K., Hanai, T. (1992). Dielectric monitoring of biological cell sedimentation. Colloid and Polymer Science, 270, 78–84. DOI 10.1007/BF00656933. [Google Scholar] [CrossRef]
 | This work is licensed under a Creative Commons Attribution 4.0 International License, which permits unrestricted use, distribution, and reproduction in any medium, provided the original work is properly cited. |