| Journal of Renewable Materials |
DOI: 10.32604/jrm.2022.021339
ARTICLE
A Novel Method for the Quantitative Detection of Sericin Content in Silk Fiber Based on the Ratio of Aspartate to Alanine
National Engineering Laboratory for Modern Silk, College of Textile and Clothing Engineering, Soochow University, Suzhou, 215123, China
*Corresponding Author: Mingzhong Li. Email: mzli@suda.edu.cn
Received: 09 January 2022; Accepted: 01 March 2022
Abstract: The development of a method for the quantitative determination of the sericin content ratio (SCR) is urgently needed for silk refining and the purification of silk fibroin for biomedical applications. In this work, a series of sericin/fibroin mixed samples with known SCRs were prepared by mixing initial samples of extracted sericin and fibroin from Bombyx mori silk. Significant differences were found in the contents of characteristic hydrophilic amino acids abundant in sericin and hydrophobic amino acids abundant in fibroin, and several linear relationships of SCR associated with the content ratios of Ser/Ala, Asp/Ala, Lys/Ala, Asp/Gly and Ser/Gly were established by amino acid analysis. Subsequently, the linear equation expressing SCR (%) as a function of the Asp to Ala content ratio X (%) was established as SCR = 2.5634X − 12.5587 (R2 = 0.9972). The results indicated that the SCR of degummed silks calculated by the equation is more objective and effective than the results obtained by the traditional weight loss method. Our study provides a novel approach for the sensitive and quantitative detection of the sericin content within the detection limit in unknown silks, which can contribute to quality control in the silk production process.
Keywords: Silk; sericin content; amino acid analysis
Bombyx mori silk, a large-scale natural protein fiber, is attracting intense attention for its uses from the textile industry to various biomaterials because of its outstanding mechanical properties, attractive aesthetic features, good biocompatibility, and tunable degradability [1–3]. Silk is composed of two major protein components: fibroin forms the thread core, and glue-like sericin surrounds the fibroin fibers and cements them together. Sericin, a globular protein, plays an important role in silk reeling, finishing, and weaving; however, residual sericin after degumming has substantial influences on the properties of silk fiber and is responsible for harsh and stiff handling, dim luster, unstable rubbing behavior, poor staining uniformity and poor colorfastness [4]. In the field of silk-based biomaterials, removing sericin from the silk covering is essential to guarantee the biocompatibility of the materials [5]. The textile processing of silk products or further processing into regenerative medical biomaterials generally requires the silk to undergo a preparatory treatment called degumming to remove unwanted sericin. Hence, a quantitative and effective detection method for determining the amount of residual sericin in silk fiber is highly desired for quality control in the silk production process. The quantitative determination of residual sericin will provide additional valuable information on the evaluation of the degumming efficiency and the degree of damage to fibroin because hydrolysis of the core fibroin frequently occurs during the degumming process [6], which will contribute to the further optimization and design of silk-based products.
Sericin accounts for approximately 25% of the total weight of silk fiber. The sericin content ratio (SCR) is commonly defined as the weight loss ratio of raw silk treated with 10 g/L Marseille soap or 0.5 g/L Na2CO3 before and after degumming [7,8]; however, the SCR measured by the weight-reduction method is higher than the actual SCR and does not objectively reflect the residual degree of sericin on the surface of silk after degumming, since Marseille soap and Na2CO3 not only hydrolyze and dissolve sericin but also cause the hydrolysis of silk fibroin. Picric acid-carmine staining (PACS) is recognized as a classic qualitative method to evaluate whether silk is degummed by observing the dyeing difference of silk based on the fact that silk fibroin selectively adsorbs picric acid molecules under alkaline conditions [9,10]. This method has the advantages of simple and rapid processing; nevertheless, the method that depends on visually observing the color of degummed silk after dyeing is greatly affected by factors such as the intensity of light, the frequency of the light source and the subjective judgment criteria of the observer, and it is insufficient for the effective evaluation of the residual sericin in silk, especially in the case of low sericin content or excessive degumming.
Quantitative characterization of residual sericin in silk based on the substantial differences between sericin and fibroin is the key to establishing a new method for detecting SCR to address the disadvantages of traditional detection techniques. Fourier transform infrared spectroscopy is a sensitive technology used for the detection and characterization of various types of molecules. Previous work has demonstrated that sericin and fibroin exhibit distinct IR absorptions due to the differences in their primary and secondary structures. The absorption intensity ratios I1650/I1625, I1400/I1445, and I1070/I1165, which are derived from the characteristic absorptions of sericin and fibroin, were proposed as useful quantitative indicators of the sericin content; however, this method is limited in the analysis of aged silks, historic silks and silks with different molecular conformations [11].
Silk fibroin and sericin are significantly different in amino acid composition and content. Silk fibroin is mainly composed of Gly (45.9%), Ala (30.3%), and Ser (12.1%) [12], while sericin contains approximately 33.4% Ser, 13.5% Gly, and 16.7% Asp, totaling over 60% of the overall amino acid composition [13]. Some studies have aimed to measure the SCR in terms of the differences in the contents of the main amino acids between fibroin and sericin. The relative molar content ratio of Asp/Gly was considered a marker for aged raw silks [14]. Another study suggested that the content of Ser decreased and the content of Gly increased the most as the sericin content increased; therefore, the molar ratio of Ser/Gly was selected as the index of sericin content with a detection limit between 1.0 and 10 wt% sericin content [15]. However, the silk fibroin sample was isolated from silk fiber degummed with Na2CO3 solution, which could potentially hydrolyze silk fibroin, interfering with the accuracy of the amino acid contents due to the incorporation of fibroin hydrolysates [16]. Moreover, Ser and Gly are abundant in both silk fibroin and sericin, resulting in an unchanged Ser/Gly ratio for silk with low sericin content.
Silk fibroin contains approximately 80% hydrophobic amino acids [17], among which the content of Ala is the highest. In contrast, 70% hydrophilic amino acids predominate in sericin [18], and hydrophilic Asp residues are the main components of sericin, while their content in silk fibroin is very low. Therefore, we suggest that the content ratio of hydrophilic and hydrophobic amino acids in silk can reflect the SCR. The content of Asp is high among the hydrophilic amino acids of sericin, and the content of Ala is the highest among the hydrophobic amino acids of fibroin. Asp and Ala could be selected as the representative amino acids in sericin and fibroin, respectively, because they are expected to show more significant differences between sericin and fibroin. Thus, the relationship between the SCR and the content ratio of Asp/Ala could be estimated, providing a quantitative measurement method for SCR.
In our previous study, silk fibroin was completely separated from silk fiber after degumming with 3.0 g/L papain, which is highly specific to sericin, thus preventing damage to silk fibroin during the complete removal of sericin [19]. Herein, a series of samples with known SCRs were prepared by mixing different ratios of fibroin and sericin initial (standard) samples to mimic the changes in SCR during the dynamic degumming process. The differences in the total content ratios of hydrophilic to hydrophobic amino acids as well as the content ratios of several typical amino acids in the samples were investigated by amino acid analysis. Then, several linear relationships of SCR as a function of the content ratios of different amino acids were established and compared with the SCR∼Asp/Ala. Finally, the applicability of the equation between SCR and Asp/Ala was validated by determining the SCR of silk fibers with unknown SCR, and the data were compared with the results of the weight loss method.
Fresh silkworm cocoons from Bombyx mori were provided by the Qidong cocoon drying station (Nantong, Jiangsu, China). Grade 6A Bombyx mori raw silk with a 20/22 denier was supplied by Haian Soho Silk Making Co., Ltd. (Nantong, Jiangsu, China). Papain (EC 3.4.22.2, 8 × 10⁵ units/g solid, lyophilized powder) was purchased from Beijing Solarbio Science and Technology Co., Ltd. (China). All other chemicals were of analytical grade. Deionized water was used throughout the experiment.
2.2 Extraction of Sericin and Fibroin
The cocoon shells were cut into 1 cm × 1 cm patches and thoroughly washed with distilled water. Sericin was extracted by treating the cocoon shells in water at 98–100°C for 2 h according to the published literature [20]. The insoluble cocoon shells were leached, and the solution was further filtered. The obtained sericin solution was frozen at −80°C for 6 h and lyophilized as an initial sericin sample.
Bombyx mori raw silks were degummed by the established procedure described previously [19]. Briefly, silk fibers were degummed at 85°C for 60 min in 3.0 g/L papain solution at a bath ratio of 1:50. The pH was maintained at 6.0 by adding buffer solution that was prepared by mixing 0.2 mol/L sodium dihydrogen phosphate solution and 0.1 mol/L citric acid solution with a volume ratio of 12.63:7.37. The degummed silks were thoroughly washed with hot and cold distilled water and finally air-dried. The morphology of the degummed silks was observed using field-emission scanning electron microscopy (SEM, S-4800, Hitachi, Tokyo, Japan) after being sputtered with gold. The obtained silk fibroin fiber was used as the initial silk fibroin sample for subsequent preparation of the sericin/fibroin composites and amino acid analysis.
2.3 Preparation and Amino Acid Analysis of the Sericin/Fibroin Composites
A series of sericin/fibroin mixed solid samples with various SCRs were prepared by mixing initial sericin samples with initial fibroin samples. The weight percentage of sericin in the mixture was set to 0.0, 0.05, 0.1, 0.2, 0.5, 1.0, 2.0, 5.0, 10.0, 15.0, 20.0, 25.0, and 30.0%. The ratio was calculated according to Eq. (1):
where Y (%) is the sericin content ratio, Ws (g) is the weight of the initial sericin sample, and WF (g) is the weight of the initial fibroin sample.
Amino acid analysis was carried out to determine amino acid composition with a Hitachi L-8900 amino acid analyzer with a 4.6 mm × 60 mm custom ion exchange resin packed column (Hitachi High-Technologies Corporation). The detection limit of this analyzer was 3 pmol (signal/noise ratio: 2, Asp) with a coefficient of variance of 0.1% in the repeatability of the peak area. Mixed protein solids were hydrolyzed in 6.0 mol/L HCl for 24 h at 110°C. After removal of the HCl, the residue was diluted to 0.02% with 0.02 mol/L HCl and filtered through a Millipore 0.22 μm syringe filter (Milford, USA) [21]. The absorbance of the amino acid derivatives from post column derivatization with ninhydrin was measured at 570 nm for most amino acids and 440 nm for proline. The contents of free amino acids were determined on the basis of peak areas of known concentration standards using an EZChrom EliteTM chromatography data system. The analyses were performed in triplicate, and the results are presented as the mean ± SD.
2.4 Establishment of the Equation for Detection of SCR
The content ratios Xi (%) of more abundant amino acids in sericin to more abundant amino acids in fibroin are defined in Eqs. (2)–(7), respectively.
where Mhydrophilic and Mhydrophobic are the total molar contents (mol%) of all hydrophobic amino acids and all hydrophilic amino acids in sericin/fibroin mixed samples, respectively. MSer, MAla, MAsp, MLys, and MGly represent the molar content (mol%) of Ser, Ala, Asp, Lys, and Gly, respectively.
The linear functional relationship between SCR (%) and the content ratios Xi (%) was established by linear regression. The optimal functional relationship for SCR detection was determined by comparison of the linear correlation coefficient (R2).
The linearity of SCR∼Asp/Ala in the range of different SCRs (0.0–30.0%, 0.05–30.0%, 0.1–30.0%, 0.2–30.0%, 0.5–30.0%, 1.0–30.0%, 2.0–30.0%, 5.0–30.0%, 10.0–30.0%) was further investigated to estimate the detection limit of the corresponding equation with the highest linear correlation coefficient.
2.5 Preparation and Determination of Silk Fibers with Unknown SCR
A series of silk fibers with unknown SCR were prepared, including nondegummed raw silk, silk degummed with 0.5 and 1.0 g/L papain at pH 6.0 and 85°C for 60 min, and silk boiled three times for 30 min each in 0.5 g/L Na2CO3 [22]. The SCR was determined by the established optimal function of SCR∼Asp/Ala in 2.4.
To verify the availability of the established optimal function of SCR∼Asp/Ala for the determination of SCR, SCR data obtained by this equation method were compared with the results of the weight loss method. Briefly, the above silk samples were further degummed three times with 0.5 g/L Na2CO3 solution for 30 min, and the SCRs measured by the weight loss method were calculated by Eq. (8):
where SCR’ (%) is the sericin content ratio measured by the weight loss method, W0 (g) and W1 (g) are the weights of the dried fiber before and after degumming with Na2CO3 solution, respectively.
3.1 Extraction of Silk Sericin and Fibroin
Silk fibroin is very resistant to hot water due to its highly oriented crystalline structure; in contrast, sericin in the fresh cocoon can be gradually dissolved in water at 98–100°C, which is still a classical technique for the isolation of sericin with a high molecular weight from cocoons or raw silk [23–25]. Lyophilized sericin powder (Fig. 1a) was used as an initial sericin sample.
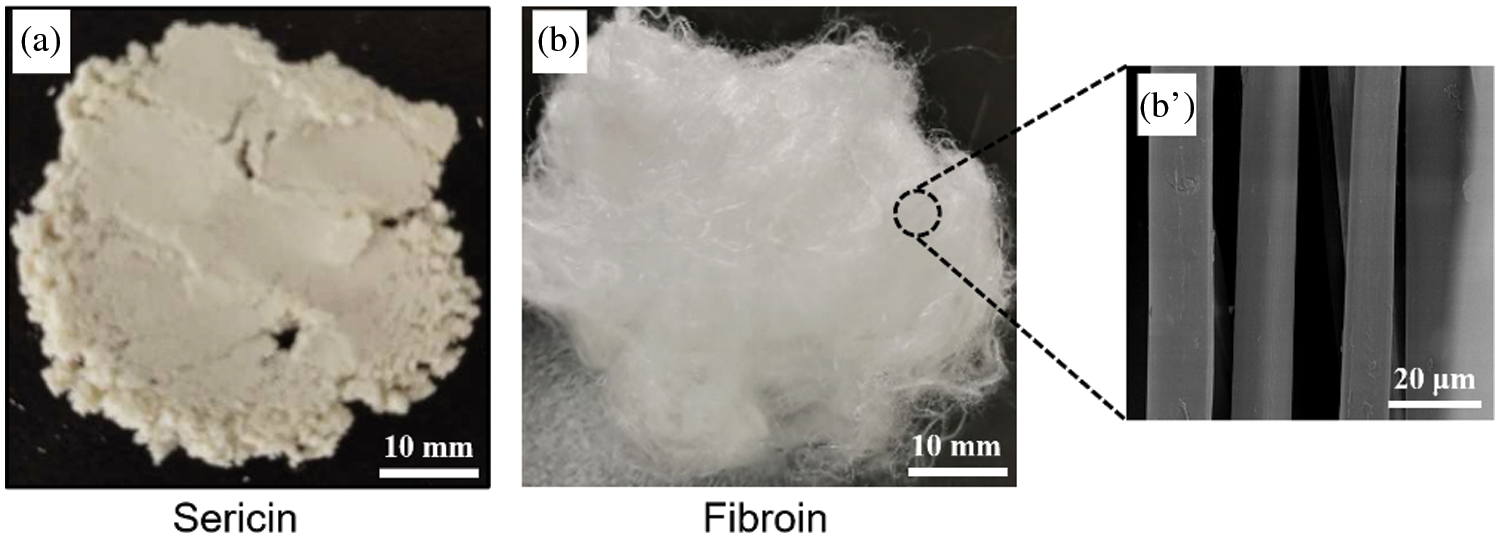
Figure 1: Photographs of extracted initial sericin and silk fibroin. (a) sericin solid, (b) silk fibroin fiber. (b’) SEM image of (b)
In our previous study, it was demonstrated that the sericin in silk fibers could be completely removed without obvious damage to silk fibroin after treatment with 3.0 g/L papain solution (pH = 6.0) at 85°C for 60 min based on the specificity of papain to sericin, and the degummed silks have a clean and smooth surface morphology, as shown in Figs. 1b and 1b’, leading to a significantly higher molecular weight and improved tensile strength of silk fibroin compared to the traditional Na2CO3 degumming method. The obtained fibroin fibers retained a high level of peptide chain integrity by amino acid analysis. Silk fibers degummed with 3.0 g/L papain solution were proven to be a high-purity fibroin protein [19] and employed as the initial fibroin sample in this study.
Amino acid composition analysis is considered a reliable technique for SCR determination [15,16]. It consists of two steps: hydrolyzing protein or peptides to liberate amino acids and their analysis and quantification. Hydrolysis is a critical step, and its successful realization has a direct impact on the accuracy and precision of the resulting amino acid analysis [26,27]. Three methods are usually performed the hydrolysis of bound amino acids, including alkaline, enzymatic and acidic reagents. Alkaline hydrolysis readily provokes extensive decomposition to some amino acids, such as serine, threonine, arginine and cysteine, accompanied by a low yield. The usefulness, therefore, still seems to be mainly employed in the determination of tryptophan, where the direct spectrophotometric methods used for pure proteins are not applicable [28]. Enzymatic hydrolysis is used to avoid hydrolytic losses of amino acids, to some degree, on account of the milder conditions than acid and alkaline hydrolysis; nevertheless, the major drawback of this method is incomplete degradation, and amino acids that are liberated from peptide linkages without destruction can be more accurately determined by acid hydrolysis, leading to the limited application of enzymatic hydrolysis. In comparison, acid hydrolysis has become the most commonly used method for the analysis of total amino acids because it creates complete hydrolysis with the least destruction and has little effect on the racemization of hydrolysates, although the yield and decay processes of amino acids take place simultaneously during acid hydrolysis [26,29–31]. Acid hydrolysis of silk fibroin and sericin remains the most common in most studies [32–36].
Fibroin and sericin, two protein constituents of silk fiber, are clearly different in amino acid composition and contents. Fibroin is dominated by hydrophobic amino acids, while sericin contains more hydrophilic amino acids. Variations in sericin content led to changes in the content of hydrophilic/hydrophobic amino acids and the main characteristic amino acids in silk sericin/fibroin mixed samples. The content of amino acids in the sericin/fibroin mixed samples at different SCRs are listed in Table 1. As shown by Table 1, the content of some hydrophilic amino acids such as Thr, Glu, Asp, Ser, Tyr, Lys, and His gradually increased; conversely, the content of hydrophobic amino acids including Phe, Leu, Ile, and Ala had a declining trend concomitant with an increase in the SCR. The changes in the total contents of hydrophilic or hydrophobic amino acids and the changes in the contents of the main amino acids with increasing SCR are visualized in Figs. 2a and 2b, respectively. As shown in Fig. 2a, the total content of hydrophilic amino acids gradually increased from 19.60 mol% to 30.37 mol% as the SCR increased from 0.0% to 30.0%; in contrast, the amount of hydrophobic amino acids decreased from 80.40 mol% to 69.92 mol%, and their content basically showed a linear change as the SCR ranged from 5.0% to 30.0%. The results of amino acid analysis demonstrated that changes in the sericin content were associated with significant differences in the total contents of hydrophobic and hydrophilic amino acids.


Figure 2: The changes in the content of amino acids in sericin/fibroin mixed samples with increasing SCR. (a) The total content of hydrophilic and hydrophobic amino acids and (b) several representative amino acids, such as Ala, Ser, Asp and Lys. The error bars are invisible since they are smaller than the marker size
The contents of characteristic amino acids, especially Ala, Ser, Asp and Lys, in mixed samples were significantly variable, as shown in Fig. 2b. As the SCR increased from 0.0% to 30.0%, the content of Ala gradually decreased from 31.09 mol% to 27.00 mol%. In contrast, the amounts of Ser, Asp and Lys continuously increased, among which the contents of Ser and Asp changed more obviously than that of Lys. The contents of Ser and Asp gradually increased from 10.52 mol% and 1.51 mol% to 14.97 mol% and 4.51 mol%, respectively.
The linear relationships between the content of the four characteristic amino acids and the SCR in different ranges (0.0–30.0%, 0.05–30.0%, 0.1–30.0%, 0.2–30.0%, 0.5–30.0%, 1.0–30.0%, 2.0–30.0%, 5.0–30.0%, 10.0–30.0%) were investigated. As revealed in Supplementary Data Figs. S1–S4, the linear correlation coefficient (R2) of Ala and SCR in each range was distributed between 0.95 and 0.97. There are high linear correlation coefficients (R2 > 0.99) between Ser and SCR and between Asp and SCR in every range. Additionally, their highest linear coefficients appeared when the SCR was in the range of 0.05–30.0% and 2.0–30.0%, respectively. The linear correlation coefficient between the content of Lys and SCR also exceeded 0.99 when the initial SCR was ≥0.05%, indicating that an obvious linear correlation existed between the four amino acids and the SCR.
The two hydrophilic amino acids with the highest content in sericin are Ser and Asp. Lys is much more abundant in sericin than in fibroin, while the content of Ala is the highest among the hydrophobic amino acids of silk fibroin due to the high frequency of repetitive Gly–Ala sequences in the H-chain of silk fibroin [37,38]. Therefore, the change degree of amino acids in Ala, Ser, Asp and Lys in the mixed samples is more obvious than that of the other 12 amino acids (data not shown) with increasing SCR. These results suggested that Ser, Asp or Lys could be considered marker amino acids of sericin, while Ala was employed as a marker amino acid of silk fibroin.
3.3 The Functional Equation for SCR Detection Based on the Content Ratio of Amino Acids
Our analysis suggested that the most significant differences in the amino acid contents between sericin and fibroin should be assessed and are expected to establish a functional relationship between the SCR and the differences in the amino acid contents. To estimate the degree of differences in the amino acid contents associated with an increase in the SCR, we defined several content ratios Xi% of more abundant amino acids in sericin to more abundant amino acids in fibroin. Six content ratios Xi% were considered: (a) the ratio of hydrophilic amino acids to hydrophobic amino acids, (b) the ratio of hydrophilic Ser with highest content in sericin to hydrophobic Ala with the highest content in silk fibroin, (c) the ratio of hydrophilic Asp with high content in sericin but low content in fibroin to hydrophobic Ala with the highest content in silk fibroin, (d) the ratio of hydrophilic Lys with high content in sericin but low content in fibroin to hydrophobic Ala with the highest content in silk fibroin, (e) the ratio of Asp/Gly and (f) the ratio of Ser/Gly. Among these ratios, (e) Asp/Gly and (f) Ser/Gly, which were suggested as useful markers for residual sericin in the previous literature [15,16], were used as controls. The results are shown in Fig. 3, and the original data are from Table 1.
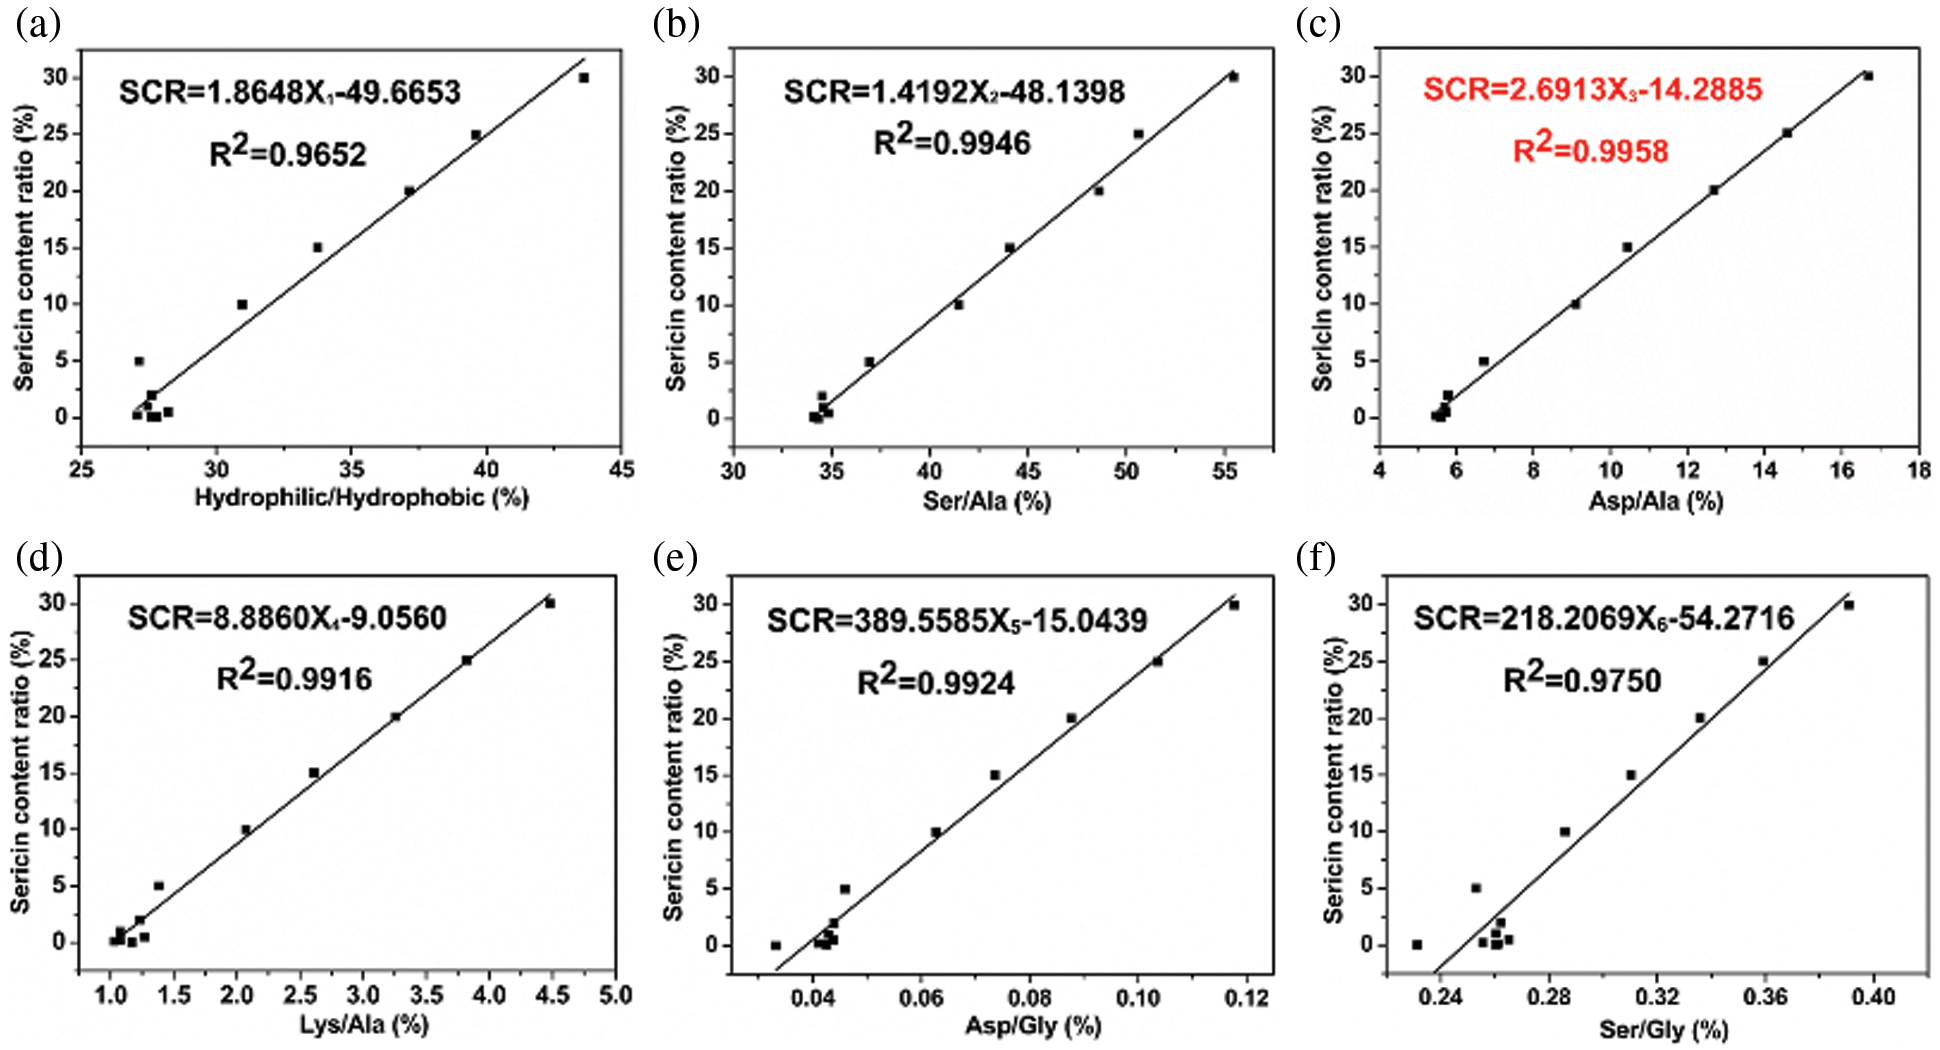
Figure 3: The relationships between SCR and the content ratio of several representative amino acids, including (a) hydrophilic/hydrophobic, (b) Ser/Ala, (c) Asp/Ala, (d) Lys/Ala, (e) Asp/Gly, and (f) Ser/Gly
As shown in Fig. 3, obvious linear relationships existed between the SCRs and the content ratios of hydrophilic/hydrophobic amino acids, Ser/Ala, Asp/Ala, Lys/Ala, Asp/Gly and Ser/Gly. Six deduced linear functions were established and compared. All functions had a high linear correlation coefficient with R2 values of 0.9652, 0.9946, 0.9958, 0.9916, 0.9924, and 0.9750, respectively, demonstrating that SCR was highly correlated with the content ratios of these selected amino acids, in other words, these content ratios of characteristic amino acids all reflect the SCR to some extent. The equation SCR = 2.6913X − 14.2885 in Fig. 3c shows the highest linear correlation coefficient (R2 = 0.9958) of all relational expressions and the lower dispersion of points remained to be observed when the SCR was in the range of 0.0% to 2.0% compared to other groups, which suggested that the variation in the content ratio of Asp/Ala yielded the most significant linear change with respect to SCR and that the content ratio of Asp/Ala was the most effective marker of sericin content in the sericin/fibroin mixture. In Fig. 3, data points are scattered when SCR was less than 2.0%. The reason was that the contents of hydrophilic amino acids, Ser, Asp, Lys, Asp and Ser in these samples were all very low, leading to relatively large deviations in the measured data.
To further identify the detection limit concerning the equation of SCR∼Asp/Ala, a similar method as described in 3.2 was adopted to investigate the degree of linearity between the content ratio of Asp/Ala and the SCR in different ranges (0.0–30.0%, 0.05–30.0%, 0.1–30.0%, 0.2–30.0%, 0.5–30.0%, 1.0–30.0%, 2.0–30.0%, 5.0–30.0%, 10.0–30.0%). From Fig. 4, all deduced linear functions possessed a high degree of linearity in each scope of SCR, and the linearity decreased when SCR was less than 2.0%. The equation SCR = 2.5634X − 12.5587 showed the highest linear correlation coefficient (R2 = 0.9972), where the SCR was in the range of 2.0% to 30.0%, demonstrating that the SCR values calculated by this equation can reflect the actual SCR in the silk samples most objectively.

Figure 4: The relationships between SCR and the content ratio of Asp/Ala when the SCR was in different ranges (0.0–30.0%, 0.05–30.0%, 0.1–30.0%, 0.2–30.0%, 0.5–30.0%, 1.0–30.0%, 2.0–30.0%, 5.0–30.0%, 10.0–30.0%)
The increase in sericin content of sericin/fibroin mixed samples resulted in an increase in the hydrophilic/hydrophobic amino acid ratio (Fig. 3a); however, the linearity of the SCR∼hydrophilic/hydrophobic amino acid ratio was less than that of the SCR∼selected amino acid ratios (Figs. 3b–3F). The main reason is that some hydrophilic amino acids, such as Tyr, are more abundant in fibroin than in sericin, while some hydrophobic amino acids, including Val, Ile, and Phe, are more abundant in sericin than in fibroin. Hence, the selection of representative hydrophilic and hydrophobic amino acids in sericin and fibroin can reflect the difference between sericin and fibroin more objectively. Among them, the content of Asp in sericin reached 16.21 ± 0.05%, while that in silk fibroin was only 1.51 ± 0.00%. The content of Ala in fibroin reached 31.09 ± 0.03% but remained at only 6.28 ± 0.04% in sericin (in Table 1). The content ratio of Asp/Ala can most effectively reflect the difference in the amino acid composition between sericin and fibroin. Therefore, the SCR correlated with the content ratio of Asp/Ala showed a high degree of linear correlation with a squared correlation coefficient of 0.9958 (Fig. 3c). By comparison, Ser was abundant in both sericin and fibroin (32.75 ± 0.01% vs. 10.52 ± 0.01%, Table 1), and Gly was rich in both sericin and fibroin (15.20 ± 0.05% vs. 45.46 ± 0.05%, Table 1). The content of Lys in sericin is higher than that in silk fibroin, but it is not abundant in sericin. Therefore, the linear correlations derived from SCR associated with Ser/Ala, Lys/Ala, Asp/Gly, and Ser/Gly are all lower than those of SCR∼Asp/Ala.
The detection limit is one of the most important characteristics of any quantitative method, and it helps to determine to what extent the equation is applicable. The emergence of dispersion of the points in Fig. 3c indicated that the linearity will gradually weaken as the initial SCR decreases to below 2.0%, suggesting that a detection limit belonging to the equation should be considered. Consistently, the highest linear coefficient occurred in the range of 2.0–30.0% in Fig. 4, and the linear correlation coefficient decreased as the initial SCR decreased below 2.0%, which was mainly because a large deviation had been created from measured data in this scope once exceeding the detection limit. Hence, the SCR of degummed silks could be calculated from the ratio of Asp to Ala using the equation SCR = 2.5634X − 12.5587 (R2 = 0.9972) with a detection limit between 2.0% and 30.0% w/w.
3.4 SCR Determination of Silk Fibers with Unknown SCR
To verify the applicability of this equation, the SCR of nondegummed raw silk and silks degummed with 0.5 g/L, 1.0 g/L papain and 0.5 g/L Na2CO3 were detected. Fig. 5 displays the contents of Asp and Ala of silk samples, SCRs calculated by the equation SCR = 2.5634X − 12.5587, and SCRs’ determined by the weight loss method. The data in Fig. 5a show that the raw silk contained approximately 3.89 mol% Asp and 27.58 mol% Ala. Sericin removal decreased the content of hydrophilic Asp, which predominates in sericin, while the proportion of hydrophobic Ala correspondingly increased after degumming. The SCR calculated by substituting the content ratio of Asp to Ala X (%) into the equation SCR = 2.5634X − 12.5587 is shown in Fig. 5b and compared with the SCR determined by the weight loss method. The SCRs’ obtained from the weight loss method was generally higher than the SCR calculated from the equation method. The SCR of nondegummed raw silks was approximately 23.60%, which is very close to the SCR’ value calculated from the weight loss method. The silk degummed with traditional 0.5 g/L Na2CO3 suffered a weight loss of 2.76% after retreatment with 0.5 g/L Na2CO3 solution, suggesting that significant damage to the silk fibroin core had occurred, thus excessive degumming. However, the SCR of this sample calculated by the equation method was 0.69%, indicating that the equation is no longer applicable in this case.

Figure 5: SCR determination of silk fibers with unknown SCR. (a) The contents of Asp and Ala in silk fibers, including nondegummed raw silk, silk degummed with 0.5 g/L or 1.0 g/L papain solution and silk degummed with 0.5 g/L Na2CO3 solution. (b) The SCRs of silk samples calculated by the equation method and SCRs’ determined by the traditional weight loss method
Many studies have confirmed that nonspecific Na2CO3 degumming provokes hydrolysis and damage to the core fibroin though sericin is completely removed [39–41]. The weight loss arising from degraded silk fibroin is incorrectly attributed to the weight reduction of sericin, leading to a higher sericin content measured by the weight loss method than the equation method. However, the SCR of the silk sample degummed with 0.5 g/L Na2CO3 remained at 0.69%, indicating that once the SCR value calculated by the equation exceeded the detection limit (2.0–30.0%), there would be a large error.
In our study, a linear relationship of SCR associated with the content ratio of Asp/Ala was finally established by the significant differences in the contents of characteristic hydrophilic amino acids abundant in sericin and hydrophobic amino acids abundant in fibroin. Compared with traditional PACS, the equation method can provide quantitative detection for SCR in silk instead of qualitative observation. The determination method in this study was established based on the differences in amino acid composition in silk samples to be tested and can avoid interference with the measurement results caused by changes in the molecular conformation of silk fibroin or sericin compared by infrared absorption spectroscopy. Ser and Gly are abundant in both sericin and fibroin. The content of Ala in fibroin is up to 31.09% but remains only 6.28% in sericin, which is the highest in hydrophobic amino acids of fibroin. Asp has a higher content in hydrophilic amino acids of sericin, which reached 16.21%, while that in silk fibroin was only 1.51%. Therefore, in comparison with Asp/Gly and Ser/Gly, the content ratio of Asp/Ala showed a stronger correlation with the sericin content in silk and can reflect the sericin content in unknown silk more sensitively. In summary, the equation method derived from amino acid analysis is more reasonable and practical. Our study provides a novel approach for the quantitative detection of sericin content within the detection limit in unknown silk samples, which can be widely used in silk fiber or fabric refining and the purification of biomedical silk fibroin.
In this study, a novel method for the quantitative detection of the sericin content in silk fiber was proposed based on the content ratio of Asp to Ala. Changes in the sericin content can lead to significant differences in the content ratio of Asp, with higher content in sericin, and Ala, with the highest content in fibroin. The sericin content ratio SCR (%) is highly correlated with the ratio X (%) of aspartate to alanine according to the equation SCR = 2.5634X − 12.5587 (R2 = 0.9972) in the SCR range of 2.0% to 30.0%. The established linear functional relationship can quantitatively and effectively detect the residual sericin content in degummed silk fiber and can monitor and prevent the occurrence of insufficient degumming, which is highly desired for quality control in the processing of silk-based products.
Funding Statement: This work was supported by the National Key Research and Development Program of China (2017YFC1103602).
Conflicts of Interest: The authors declare that they have no conflicts of interest to report regarding the present study.
References
1. Koh, L. D., Cheng, Y., Teng, C. P., Khin, Y. W., Loh, X. J. et al. (2015). Structures, mechanical properties and applications of silk fibroin materials. Progress in Polymer Science, 46, 86–110. DOI 10.1016/j.progpolymsci.2015.02.001. [Google Scholar] [CrossRef]
2. Shao, Z. Z., Vollrath, F. (2002). Surprising strength of silkworm silk. Nature, 418(6899), 741. DOI 10.1038/418741a. [Google Scholar] [CrossRef]
3. Wang, C. Y., Li, X., Gao, E. L., Jian, M. Q., Xia, K. L. et al. (2016). Carbonized silk fabric for ultrastretchable, highly sensitive, and wearable strain sensors. Advanced Materials, 28(31), 6640–6648. DOI 10.1002/adma.201601572. [Google Scholar] [CrossRef]
4. Freddi, G., Mossotti, R., Innocenti, R. (2003). Degumming of silk fabric with several proteases. Journal of Biotechnology, 106(1), 101–112. DOI 10.1016/j.jbiotec.2003.09.006. [Google Scholar] [CrossRef]
5. Thurber, A. E., Omenetto, F. G., Kaplan, D. L. (2015). In vivo bioresponses to silk proteins. Biomaterials, 71, 145–157. DOI 10.1016/j.biomaterials.2015.08.039. [Google Scholar] [CrossRef]
6. Ho, M. P., Wang, H., Lau, K. T. (2012). Effect of degumming time on silkworm silk fibre for biodegradable polymer composites. Applied Surface Science, 258(8), 3948–3955. DOI 10.1016/j.apsusc.2011.12.068. [Google Scholar] [CrossRef]
7. Rastogi, S., Kandasubramanian, B. (2020). Processing trends of silk fibers: Silk degumming, regeneration and physical functionalization. The Journal of the Textile Institute, 111(12), 1794–1810. DOI 10.1080/00405000.2020.1727269. [Google Scholar] [CrossRef]
8. Kim, H. J., Kim, M. K., Lee, K. H., Nho, S. K., Han, M. S. et al. (2017). Effect of degumming methods on structural characteristics and properties of regenerated silk. International Journal of Biological Macromolecules, 104, 294–302. DOI 10.1016/j.ijbiomac.2017.06.019. [Google Scholar] [CrossRef]
9. Teuschl, A. H., van Griensven, M., Redl, H. (2014). Sericin removal from raw Bombyx mori silk scaffolds of high hierarchical order. Tissue Engineering Part C: Methods, 20(5), 431–439. DOI 10.1089/ten.tec.2013.0278. [Google Scholar] [CrossRef]
10. Wang, Y. J., Zhang, Y. Q. (2011). Three-layered sericins around the silk fibroin fiber from Bombyx mori cocoon and their amino acid composition. Advanced Materials Research, 175–176, 158–163. DOI 10.4028/www.scientific.net/AMR.175-176.158. [Google Scholar] [CrossRef]
11. Zhang, X. M., Wyeth, P. (2010). Using FTIR spectroscopy to detect sericin on historic silk. Science China Chemistry, 53(3), 626–631. DOI 10.1007/s11426-010-0050-y. [Google Scholar] [CrossRef]
12. Zhou, C. Z., Confalonieri, F., Jacquet, M., Perasso, R., Li, Z. G. et al. (2001). Silk fibroin: Structural implications of a remarkable amino acid sequence. Proteins: Structure, Function, and Bioinformatics, 44(2), 119–122. DOI 10.1002/prot.1078. [Google Scholar] [CrossRef]
13. Limpeanchob, N., Trisat, K., Duangjai, A., Tiyaboonchai, W., Pongcharoen, S. et al. (2010). Sericin reduces serum cholesterol in rats and cholesterol uptake into Caco-2 cells. Journal of Agricultural and Food Chemistry, 58(23), 12519–12522. DOI 10.1021/jf103157w. [Google Scholar] [CrossRef]
14. Zhang, X., Berghe, I. V., Wyeth, P. (2011). Heat and moisture promoted deterioration of raw silk estimated by amino acid analysis. Journal of Cultural Heritage, 12(4), 408–411. DOI 10.1016/j.culher.2011.03.002. [Google Scholar] [CrossRef]
15. Wray, L. S., Hu, X., Gallego, J., Georgakoudi, I., Omenetto, F. G. et al. (2011). Effect of processing on silk-based biomaterials: Reproducibility and biocompatibility. Journal of Biomedical Materials Research Part B: Applied Biomaterials, 99(1), 89–101. DOI 10.1002/jbm.b.31875. [Google Scholar] [CrossRef]
16. Wang, H. Y., Zhang, Y. Q. (2013). Effect of regeneration of liquid silk fibroin on its structure and characterization. Soft Matter, 9(1), 138–145. DOI 10.1039/C2SM26945G. [Google Scholar] [CrossRef]
17. Braun, F. N., Viney, C. (2003). Modelling self assembly of natural silk solutions. International Journal of Biological Macromolecules, 32(3–5), 59–65. DOI 10.1016/S0141-8130(03)00038-2. [Google Scholar] [CrossRef]
18. Moazami, A., Montazer, M., Rashidi, A., Rahimi, M. K. (2010). Antibacterial properties of raw and degummed silk with nanosilver in various conditions. Journal of Applied Polymer Science, 118(1), 253–258. DOI 10.1002/app.32289. [Google Scholar] [CrossRef]
19. Feng, Y. F., Lin, J. M., Niu, L. X., Wang, Y., Cheng, Z. L. et al. (2020). High molecular weight silk fibroin prepared by papain degumming. Polymers, 12(9), 2105. DOI 10.3390/polym12092105. [Google Scholar] [CrossRef]
20. Tao, W., Li, M. Z., Xie, R. J. (2005). Preparation and structure of porous silk sericin materials. Macromolecular Materials and Engineering, 290(3), 188–194. DOI 10.1002/mame.200400306. [Google Scholar] [CrossRef]
21. You, R. C., Zhang, Y., Liu, Y., Liu, G. Y., Li, M. Z. (2013). The degradation behavior of silk fibroin derived from different ionic liquid solvents. Natural Science, 5(6A), 10–19. DOI 10.4236/ns.2013.56A002. [Google Scholar] [CrossRef]
22. Feng, Y. F., Li, X. F., Li, M. Z., Ye, D. Z., Zhang, Q. et al. (2017). Facile preparation of biocompatible silk fibroin/cellulose nanocomposite films with high mechanical performance. ACS Sustainable Chemistry & Engineering, 5(7), 6227–6236. DOI 10.1021/acssuschemeng.7b01161. [Google Scholar] [CrossRef]
23. Chirila, T. V., Suzuki, S., McKirdy, N. C. (2016). Further development of silk sericin as a biomaterial: Comparative investigation of the procedures for its isolation from Bombyx mori silk cocoons. Progress in Biomaterials, 5(2), 135–145. DOI 10.1007/s40204-016-0052-8. [Google Scholar] [CrossRef]
24. Belhaj KhCalifa, I., Ladhari, N., Touay, M. (2012). Application of sericin to modify textile supports. Journal of the Textile Institute, 103(4), 370–377. DOI 10.1080/00405000.2011.580539. [Google Scholar] [CrossRef]
25. da Silva, T. L., da Silva Junior, A. C., Vieira, M. G. A., Gimenes, M. L., da Silva, M. G. C. (2016). Biosorption study of copper and zinc by particles produced from silk sericin–alginate blend: Evaluation of blend proportion and thermal cross-linking process in particles production. Journal of Cleaner Production, 137, 1470–1478. DOI 10.1016/j.jclepro.2015.05.067. [Google Scholar] [CrossRef]
26. Fountoulakis, M., Lahm, H. W. (1998). Hydrolysis and amino acid composition analysis of proteins. Journal of Chromatography A, 826(2), 109–134. DOI 10.1016/S0021-9673(98)00721-3. [Google Scholar] [CrossRef]
27. Weiss, M., Manneberg, M., Juranville, J. F., Lahm, H. W., Fountoulakis, M. (1998). Effect of the hydrolysis method on the determination of the amino acid composition of proteins. Journal of Chromatography A, 795(2), 263–275. DOI 10.1016/S0021-9673(97)00983-7. [Google Scholar] [CrossRef]
28. Slump, P., Schreuder, H. A. W. (1969). Determination of tryptophan in foods. Analytical Biochemistry, 27, 182–186. DOI 10.1016/0003-2697(69)90231-0. [Google Scholar] [CrossRef]
29. Gehrke, C. W., Wall, L. L., Absheer, J. S., Kaiser, F. E., Zumwalt, R. W. (1985). Sample preparation for chromatography of amino acids: Acid hydrolysis of proteins. Journal of the Association of Official Analytical Chemists, 68(5), 811–821. DOI 10.1093/jaoac/68.5.811. [Google Scholar] [CrossRef]
30. Davies, M. G., Thomas, A. J. (1973). An investigation of hydrolytic techniques for the amino acid analysis of foodstuffs. Journal of the Science of Food and Agriculture, 24(12), 1525–1540. DOI 10.1002/jsfa.2740241208. [Google Scholar] [CrossRef]
31. Buňka, F., Kříž, O., Veličková, A., Buňková, L., Kráčmar, S. (2009). Effect of acid hydrolysis time on amino acid determination in casein and processed cheeses with different fat content. Journal of Food Composition and Analysis, 22(3), 224–232. DOI 10.1016/j.jfca.2008.10.023. [Google Scholar] [CrossRef]
32. Liu, L. C., Han, Y. Y., Lv, S. S. (2019). Design of self-healing and electrically conductive silk fibroin-based hydrogels. ACS Applied Materials & Interfaces, 11(22), 20394–20403. DOI 10.1021/acsami.9b04871. [Google Scholar] [CrossRef]
33. Yin, Z. P., Wu, F., Xing, T. L., Yadavalli, V. K., Kundu, S. C. et al. (2017). A silk fibroin hydrogel with reversible sol–gel transition. RSC Advances, 7(39), 24085–24096. DOI 10.1039/C7RA02682J. [Google Scholar] [CrossRef]
34. Cho, K. Y., Moon, J. Y., Lee, Y. W., Lee, K. G., Yeo, J. H. et al. (2003). Preparation of self-assembled silk sericin nanoparticles. International Journal of Biological Macromolecules, 32(1–2), 36–42. DOI 10.1016/S0141-8130(03)00023-0. [Google Scholar] [CrossRef]
35. Dong, Z. M., Guo, K. Y., Zhang, X. L., Zhang, T., Zhang, Y. et al. (2019). Identification of Bombyx mori sericin 4 protein as a new biological adhesive. International Journal of Biological Macromolecules, 132, 1121–1130. DOI 10.1016/j.ijbiomac.2019.03.166. [Google Scholar] [CrossRef]
36. Dash, R., Mukherjee, S., Kundu, S. C. (2006). Isolation, purification and characterization of silk protein sericin from cocoon peduncles of tropical tasar silkworm, Antheraea mylitta. International Journal of Biological Macromolecules, 38(3–5), 255–258. DOI 10.1016/j.ijbiomac.2006.03.001. [Google Scholar] [CrossRef]
37. Krejchi, M. T., Atkins, E. D., Waddon, A. J., Fournier, M. J., Mason, T. L. et al. (1994). Chemical sequence control of beta-sheet assembly in macromolecular crystals of periodic polypeptides. Science, 265(5177), 1427–1432. DOI 10.1126/science.8073284. [Google Scholar] [CrossRef]
38. Zhou, C. Z., Confalonieri, F., Medina, N., Zivanovic, Y., Esnault, C. et al. (2000). Fine organization of Bombyx mori fibroin heavy chain gene. Nucleic Acids Research, 28(12), 2413–2419. DOI 10.1093/nar/28.12.2413. [Google Scholar] [CrossRef]
39. Dou, H., Zuo, B. Q. (2015). Effect of sodium carbonate concentrations on the degumming and regeneration process of silk fibroin. The Journal of the Textile Institute, 106(3), 311–319. DOI 10.1080/00405000.2014.919065. [Google Scholar] [CrossRef]
40. Nultsch, K., Bast, L. K., Näf, M., Yakhlifi, S. E., Bruns, N. et al. (2018). Effects of silk degumming process on physicochemical, tensile, and optical properties of regenerated silk fibroin. Macromolecular Materials and Engineering, 303(12), 1800408. DOI 10.1002/mame.201800408. [Google Scholar] [CrossRef]
41. Wang, Z. Q., Yang, H. W., Li, W., Li, C. L. (2019). Effect of silk degumming on the structure and properties of silk fibroin. The Journal of the Textile Institute, 110(1), 134–140. DOI 10.1080/00405000.2018.1473074. [Google Scholar] [CrossRef]
Supplementary Data

Figure S1: The relationships between the content of Ala and SCR in different ranges (0–30%, 0.05–30%, 0.1–30%, 0.2–30%, 0.5–30%, 1–30%, 2–30%, 5–30%, 10–30%)

Figure S2: The relationships between the content of Ser and SCR in different ranges (0–30%, 0.05–30%, 0.1–30%, 0.2–30%, 0.5–30%, 1–30%, 2–30%, 5–30%, 10–30%)

Figure S3: The relationships between the content of Asp and SCR in different ranges (0–30%, 0.05–30%, 0.1–30%, 0.2–30%, 0.5–30%, 1–30%, 2–30%, 5–30%, 10–30%).
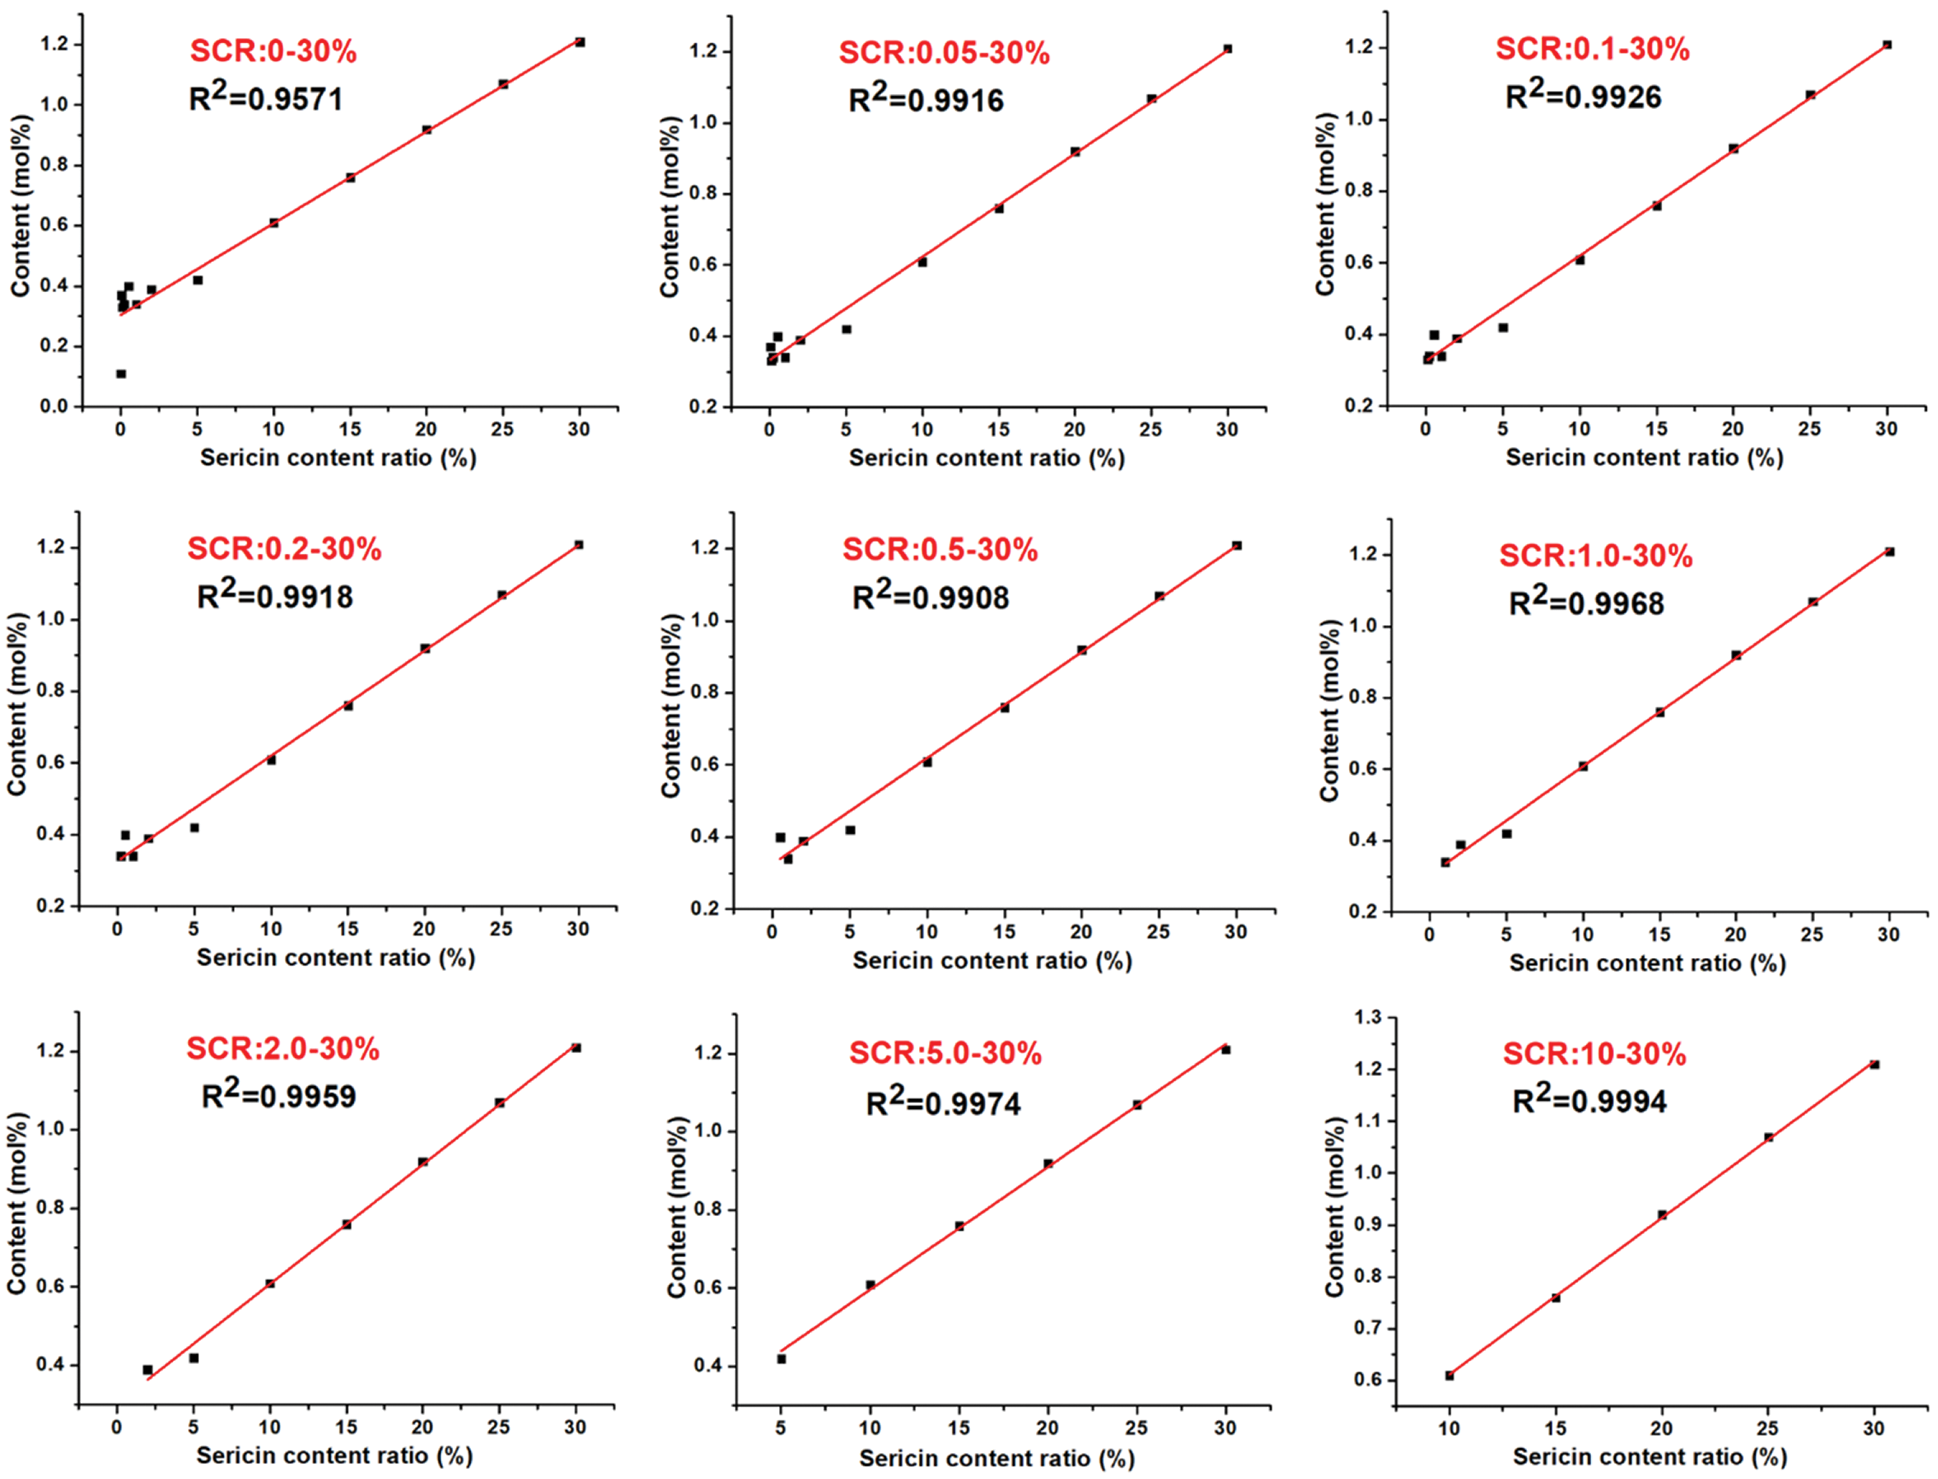
Figure S4: The relationships between the content of Lys and SCR in different ranges (0–30%, 0.05–30%, 0.1–30%, 0.2–30%, 0.5–30%, 1–30%, 2–30%, 5–30%, 10–30%).