| Journal of Renewable Materials |
DOI: 10.32604/jrm.2023.020406
ARTICLE
Bond of Seawater Scoria Aggregate Concrete to Stainless Reinforcement
Shandong Key Laboratory of Civil Engineering Disaster Prevention and Mitigation, Shandong University of Science and Technology, Qingdao, 266590, China
*Corresponding Author: Yijie Huang. Email: 302huangyijie@163.com
Received: 22 November 2021; Accepted: 25 February 2022
Abstract: This study investigates the bond between seawater scoria aggregate concrete (SSAC) and stainless reinforcement (SR) through a series of pull-out tests. A total of 39 specimens, considering five experimental parameters—concrete type (SSAC, ordinary concrete (OC) and seawater coral aggregate concrete (SCAC)), reinforcement type (SR, ordinary reinforcement (OR)), bond length (3, 5 and 8 times bar diameter), concrete strength (C25 and C30) and concrete cover thickness (42 and 67 mm)—were prepared. The typical bond properties (failure pattern, bond strength, bond-slip curves and bond stress distribution, etc.) of seawater scoria aggregate concrete-stainless reinforcement (SSAC-SR) specimen were systematically studied. Generally, the failure pattern changed with the concrete type used, and the failure surface of SSAC specimen was different from that of OC specimen. SSAC enhanced the bond strength of specimen, while its effect on the deformation of SSAC-SR was negative. On average, the peak slip of SSAC specimens was 20% lower while the bond strength was 6.7% higher compared to OC specimens under the similar conditions. The effects of variables on the bond strength of SSAC–SR in increasing order are concrete type, bond length, concrete strength and cover thickness. The bond-slip curve of SSAC-SR specimen consisted of micro-slipping, slipping and declining stages. It can be obtained that SSAC reduced the curve curvature of bond-slip, and the decline of curve became steep after adopting SR. The typical distribution of bond stress along bond length changed with the types of concrete and reinforcement used. Finally, a specific expression of the bond stress-slip curve considering the effects of various variables was established, which could provide a basis for the practical application of reinforced SSAC.
Keywords: Bond properties; seawater scoria aggregate concrete; stainless reinforcements; bond-slip curve; bond stress distribution; analytical model
Notation
| As | the cross-sectional area of the reinforcement |
| c | concrete cover thickness |
| d | diameter of reinforcement |
| Es, Ec | elastic modulus of reinforcement and concrete, respectively |
| F | pull-out load |
| Fmax | maximum pull-out load |
| fc, fcu | axial and cubic compressive strengths of concrete, respectively |
| fs, fy | tensile and yield strengths of reinforcement, respectively |
| ft | splitting strength of concrete |
| h, l | rib height and spacing of reinforcement, respectively |
| la | bond length |
| ∆l | the distance between the two adjacent strain gauges |
| α, β | parameters in the analytical expression |
| δ | interfacial shear slip at the free end |
| δmax | δ corresponding to bond strength |
| εs,i, εs,i+1 | axial strain of reinforcement at ith and i+1th location, respectively |
| λ | corrosion degree |
| ρd | bulk density of concrete |
| τ, τmax | averaged bond stress and bond strength, respectively |
| τu,e | calculated bond strength |
Concrete engineering has expanded the mainland to marine islands and reefs due to the growing economic and military requirements of countries across the world and of China in particular. Therefore, using locally available materials and developing new kinds of eco-friendly concrete that could reduce the demand for terrestrial resources, utilize marine resources and increase the rate of island construction is of significant importance [1,2].
Numerous volcanic islands and islets (e.g., the Hawaiian archipelago and Azores archipelago) are widely distributed in the Pacific, Atlantic and Indian oceans, etc. [3]. These islands contain huge deposits of volcanic scoria or pumice rocks, and the natural pozzolan materials (i.e., volcanic ash, tuff, volcanic glass, scoria and pumice aggregates) are abundant. Consequently, utilizing these volcanic materials together with seawater and sea sand to develop a new eco-friendly concrete is a good choice for the island construction, especially SSAC. SSAC adopts seawater, sea sand and scoria coarse aggregates (SCA) as mixing water, fine aggregate and coarse aggregate, respectively; and its application in practical engineering is promising. SSAC is an ideal material due to its advantages, i.e., locally available materials, fast offshore construction, low costs, and huge amount of raw material [4,5]. However, there are many chloride ions (Cl−), sulfate (SO42−) and shell fragments in sea sand and seawater; and SCA can be characterized by vesicular structure, porous, lightweight, high fire resistance, low elasticity modulus, good water absorption ability, high frost and corrosion resistance durability, and good insulation characteristics [6]. Compared to OC, the properties of SSAC are more complicated and need to be investigated.
According to the above analyses, the properties of SSAC are significantly affected by the concrete mix components. Several studies have focused on the impacts of volcanic scoria aggregate on the properties of concrete, especially its mechanical properties and durability. Islam et al. [7] studied the physical properties of SCA and concluded that scoria aggregate concrete (SAC) had low volume density and specific gravity as well as a high water absorption rate, indicating its application potential in the development of eco-friendly lightweight concrete with reasonable workability. Granata [8] found that the self-compacting concrete made of pumice or scoria aggregates had good workability. The scoria or pumice powder can be effectively used as filler for self-compacting concrete due to its particle size and granular properties. Generally, the compressive and tensile strengths of SAC were acceptable comparable to other lightweight aggregates concrete based on the test results [9,10]. It was obtained that the compressive strength and bend strength of SAC were 13.57% and 6.3% higher than those of ordinary concrete (OC) when the scoria aggregate replacement rate was 25% [11]. Campione et al. [12] studied the full stress-strain curves of SAC and OC. The test results indicated that SAC failed prematurely after the peak point under the similar strength condition, owing to the brittleness of the SCA. Furthermore, volcanic scoria aggregate could also improve the durability (e.g., corrosion resistance) of concrete based on the corrosion potential and linear polarization resistance tests [13,14], and the shock absorption performance of lightweight concrete adopting SCA was higher compared to OC through the impact test [14]. However, the ductility and deformability of concrete adopting SCA were inferior to those of OC due to the lightweight aggregates. Several studies also investigated the influences of seawater and sea sand on the properties of concrete [15]. Xiao et al. [16] obtained that the early strength of concrete made of sea sand and seawater developed more rapidly than that of OC, and these differences decreased after 7 days. Huang et al. [17] investigated the effects of sea sand Cl– content on the axial compression properties of concrete. On average, the ductility of concrete decreased with an increase in sea sand Cl– content. However, the Cl– in sea sand increased the compressive strength and elastic modulus of concrete under the sealing and carbonization conditions [18]. Compared to OC, the compressive strength and elastic modulus of sea sand concrete approximately increased by 5.2% and 1.3%, respectively [19]. According to the above analyses and results, the properties of concrete with seawater, sea sand and SCA could meet the basic requirements of engineering. However, its ductility, deformability and energy dissipation capacity need to be further improved.
A feasible method of improving ductility, deformability and energy dissipation capacity of concrete is to embed reinforcement. Generally, the ordinary steel reinforcement can be easily corroded by the Cl– and SO42− in seawater and sea sand [20–22]. The deterioration of steel would be accelerated under the marine environment [23,24], resulting in serious damage to concrete structure engineering. Therefore, the high durability reinforcement (i.e., fiber-reinforced polymers (FRP) reinforcement, epoxy-coated (EC) reinforcement and SR) would be utilized in marine engineering to protect reinforced concrete from corrosion. Compared to FRP and EC reinforcements [25–27], SR is characterized by the high durability, good energy dissipation capacity, acceptable adhesion and easy fabrication and construction [28]. SR could enhance the performance of plain SSAC, and its application in the island construction is promising. However, the bond of SSAC to SR is complex due to the coupled effects of SCA, seawater and sea sand. Further analyses should be undertaken to ensure that the concrete and the reinforcement bear external forces together.
The concrete mix components (aggregates and mixing water) significantly affected the bond of SSAC to SR. However, few studies have focused on this research field. Based on the limited results, specimens adopting SCA had a 20%–40% lower bond strength compared to OC specimens due to the lightweight and low modulus of scoria aggregates [29], while its effect on the peak slip of specimen was negligible. Furthermore, the bond properties of concrete adopting seawater and sea sand were systematically investigated. The Cl– in seawater and sea sand could easily corrode the ordinary steel reinforcement, and the bond strength (τmax) changed with the variation in corrosion degree of steel (λ). Generally, τmax significantly decreased when λ was more than 4%–5%; however, it increased with an increase in λ when λ was less than 4%. This is due to the enhanced radical compressive stress between concrete and reinforcement [30,31]. Yang et al. [32] studied the influence of seawater and sea sand on the bond of steel bar to alkali slag concrete through pull-out test. The test results indicated that τmax and residual frictional stress of specimen with seawater or sea sand increased by 3.3% compared to OC specimen. Tran et al. [33] also reported that the ultimate bond strength of sea sand concrete specimen was approximately 2% higher than that of OC specimen. Furthermore, SR was always utilized to reduce the impacts of sea sand and seawater on the reinforcement corrosion. On average, the bond strength of specimen adopting SR was around 20% lower than that of specimen using ordinary reinforcement [34], and the bond properties changed with the SR parameters used (strength, rib spacing and rib height, etc.) [35]. According to the above analyses [36], the concrete and rebar parameters (strength, cover thickness, size and rib height, etc.) had significant influences on the bond of SSAC to SR. However, there were few studies on this research field [37,38], and further investigations should be undertaken.
In this study, the bond properties of SAC-SR specimens under different factors such as concrete and reinforcement type, bond length, concrete strength and cover thickness were systematically studied. The bond-slip model and the bond strength expression considering the influences of marine materials and SCA were firstly established. The obtained results provide deep insight into the bond properties of SSAC specimens. The test results and theoretical model would prompt the design and practical application of reinforced SSAC structures.
2.1.1 Stainless Steel Reinforcement
Stainless and ordinary reinforcements with nominal diameter of 16 mm were used herein (Fig. 1). Table 1 presents the physical properties of SR and OR based on the standard code [39,40]. Compared to OR, the rib spacing and height of SR were about 5% and 42.7% lower, respectively.
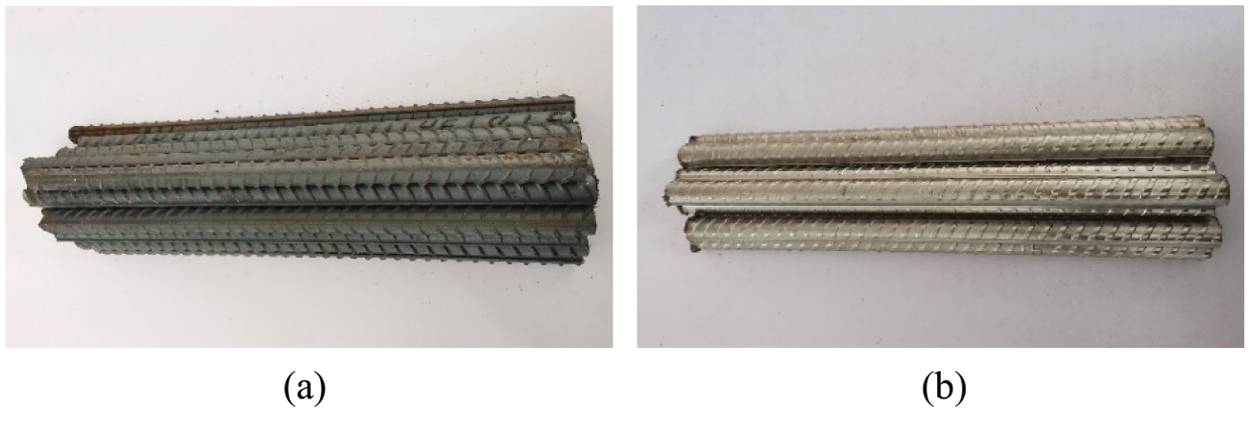
Figure 1: Type of reinforcement (a) ordinary reinforcement (b) stainless reinforcement

Raw Materials
Three different types of concrete were adopted in this study, i.e., OC, SSAC and SCAC. SCAC was used to analyze the influences of different marine lightweight aggregates on the bond properties of concrete. The coarse aggregates of SCAC and SSAC were coral coarse aggregate (CCA) and SCA, respectively. Furthermore, SCAC and SSAC adopted seawater and sea sand as the mixing water and fine aggregates (Figs. 2 and 3). Seawater and sea sand were derived from Qingdao Harbor, China. The mixing water, fine aggregate and coarse aggregate of OC were freshwater, river sand and gravel, respectively (Figs. 2 and 3). The ordinary Portland cement with strength of 42.5 MPa was utilized to fabricate specimen.
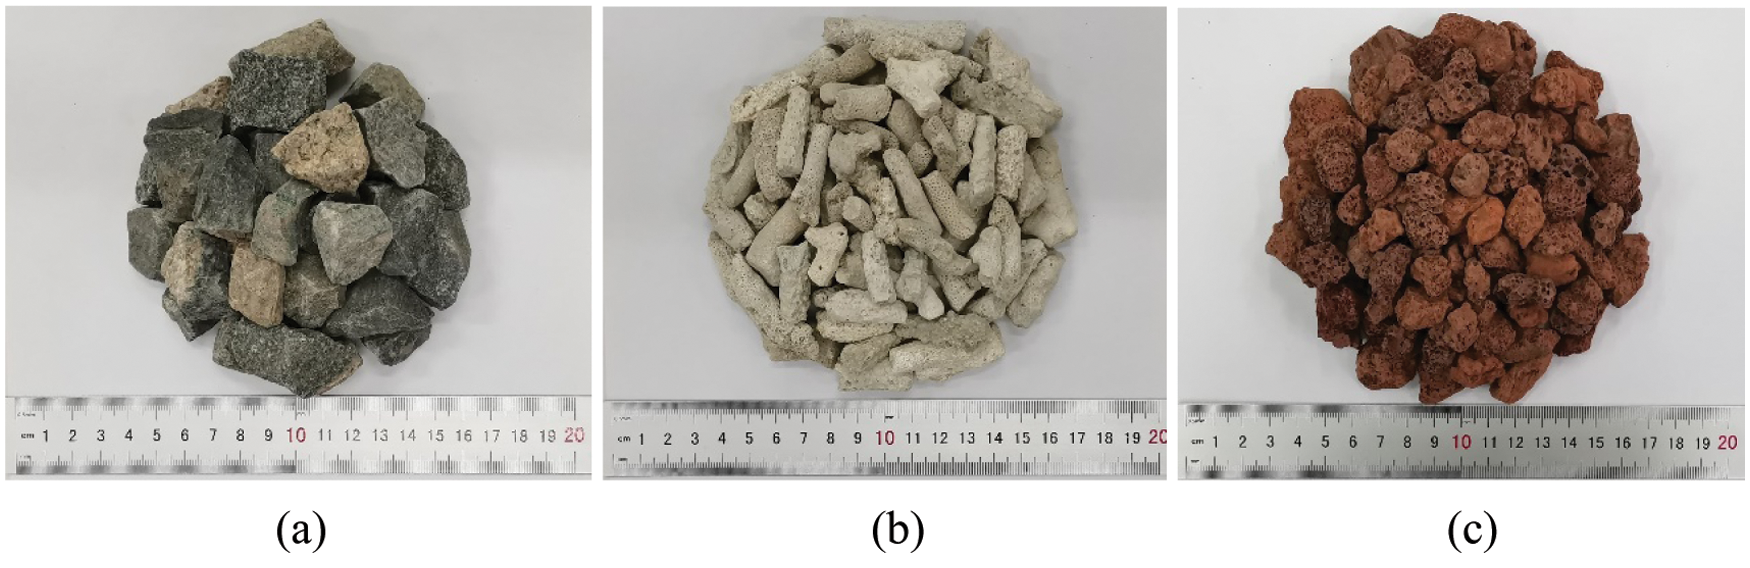
Figure 2: Type of coarse aggregate (a) gravel, (b) coral coarse aggregate, (c) volcanic scoria coarse aggregate
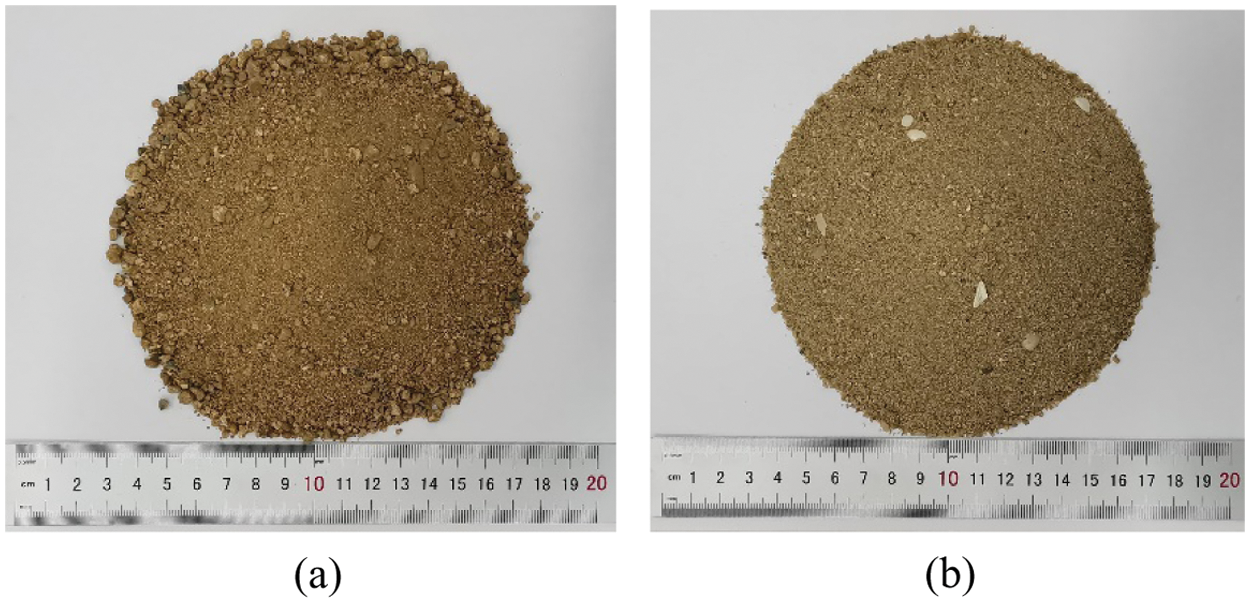
Figure 3: Type of fine aggregate (a) river sand, (b) sea sand
The CCA and SCA were obtained from broken reef and scoria rocks, respectively. Table 2 shows the basic properties of gravel, CCA and SCA. Due to the porous of lightweight aggregates, the water absorption ratio of CCA and SCA were 92.2% and 92.0% higher than those of gravel, respectively (Fig. 4). The physical and chemical properties of fine aggregates are present in Table 3. Compared to river sand, the clay content of sea sand decreased by 12.5%. Furthermore, the chemical composition of the seawater was obtained through the ion chromatography method [41]. The main contents of Cl–, Na+, SO42−, Mg2+ and Ca2+ in seawater were 19831 μg/l, 16563 μg/l, 1936 μg/l, 777 μg/l and 888 μg/l, respectively.

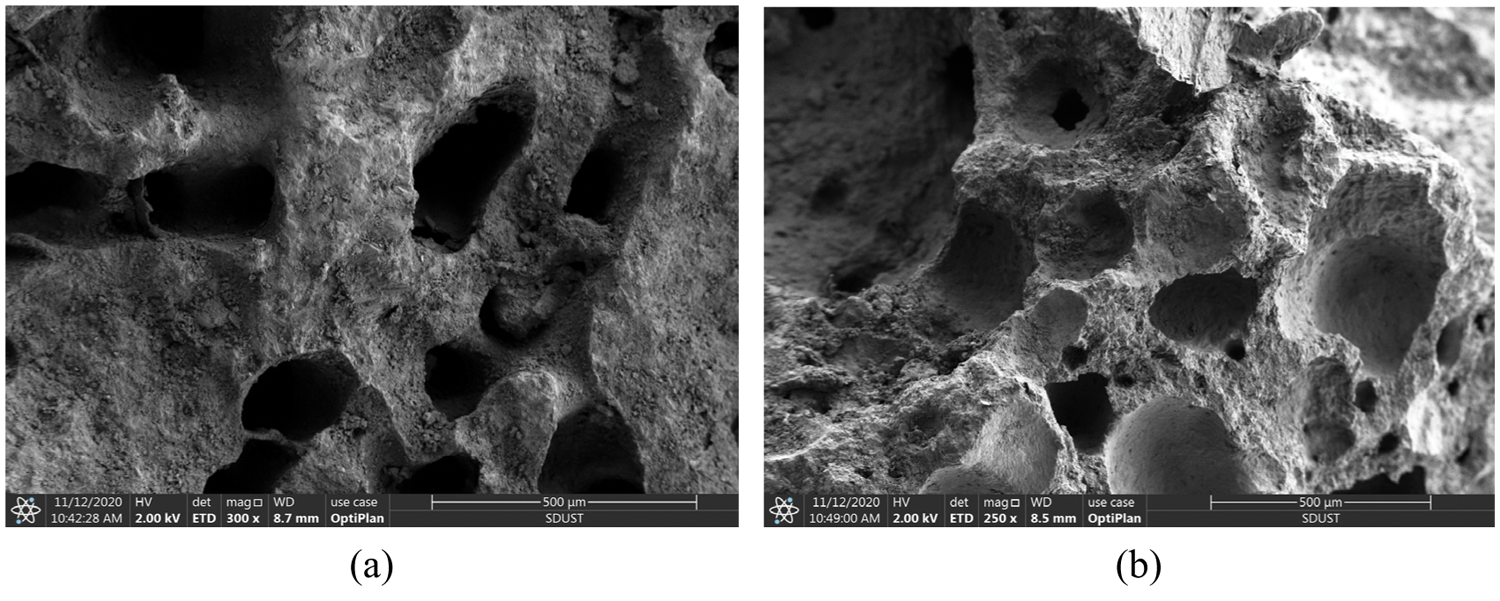
Figure 4: SEM images of CCA and SCA (a) CCA, (b) SCA

According to Table 2, the physical properties of SCA were different from those of gravel and CCA. Therefore, different mix proportions were adopted in the test to study the effect of concrete type on the bond properties under the same target strength grade (C30). The details of concrete mix proportion are listed in Table 4. Furthermore, two sets of SSAC mix proportions were provided to study the influence of concrete strength (C25 and C30) on the bond properties.

Curing and Testing of Concrete
The OC, SSAC and SCAC were cured under the standard conditions (room temperature: 20 ± 1°C, relative humidity: 90 ± 5%) until 28-d, and the mechanical and physical properties of concrete were tested based on the standard code [40]. Twelve cubic (100 × 100 × 100 mm3) and prismatic (100 × 100 × 300 mm3) specimens were fabricated to determine the concrete cubic compressive strength (fcu), axial compressive strength (fc), tensile strength (ft), elastic modulus (Ec) [42] and oven dry density (ρd) [37,43].
The fcu of OC, SSAC and SCAC satisfied the requirement of C30 strength grade (Table 4); and ρd decreased in order of OC, SCAC and SSAC due to the lightweight coarse aggregates. Compared to OC, fc of SSAC (SCAC) was 9.9% (4.2%) higher and Ec was 21.9% (6%) lower for a similar fcu, owing to the porous of scoria (coral) aggregates. Furthermore, ft of SSAC and SCAC were 6.1% and 1.1% higher than that of OC, respectively. The specific reason for this phenomenon is the “self-curing” of scoria and coral coarse aggregates [10,44].
Thirteen groups of pull-out specimens, considering five different parameters-the concrete type (OC, SSAC and SCAC), reinforcement type (OR and SR), concrete strength (C25, C30), bond length (3, 5 and 8 times reinforcement diameter) and cover thickness (67 and 42 mm) were manufactured here in [45–47]. Each group consisted of three specimens to ensure the reliability of the test results. The size of pull-out specimen was 150 mm × 150 mm × 150 mm based on the standard code [25,42], and Fig. 5 shows the details of specimen. There were 135 and 15 mm steel bar left at loading and free ends of specimen, respectively. The bond length of the reinforcement can be changed by adjusting the length of the PVC pipe (Fig. 6). Generally, the PVC pipe was set at the loading end of specimen to avoid the local damage of concrete [45,46].
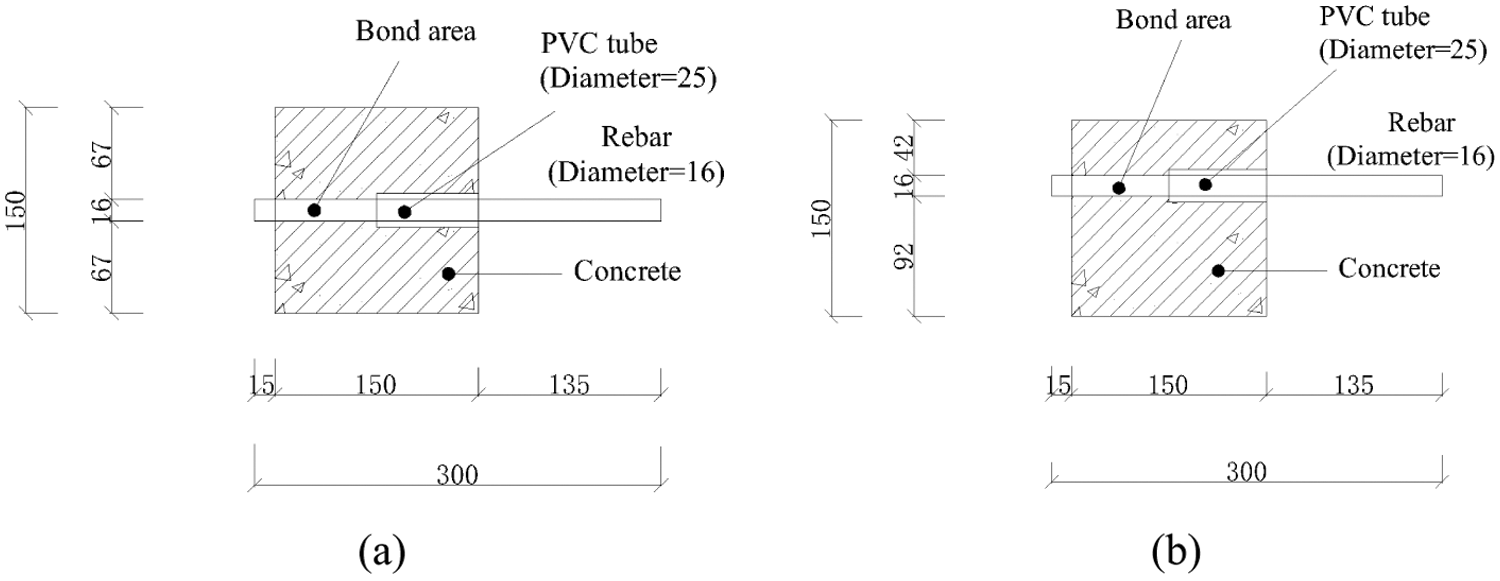
Figure 5: Illustration of pull-out specimen (a) 67 mm cover thickness specimen, (b) 42 mm cover thickness specimen
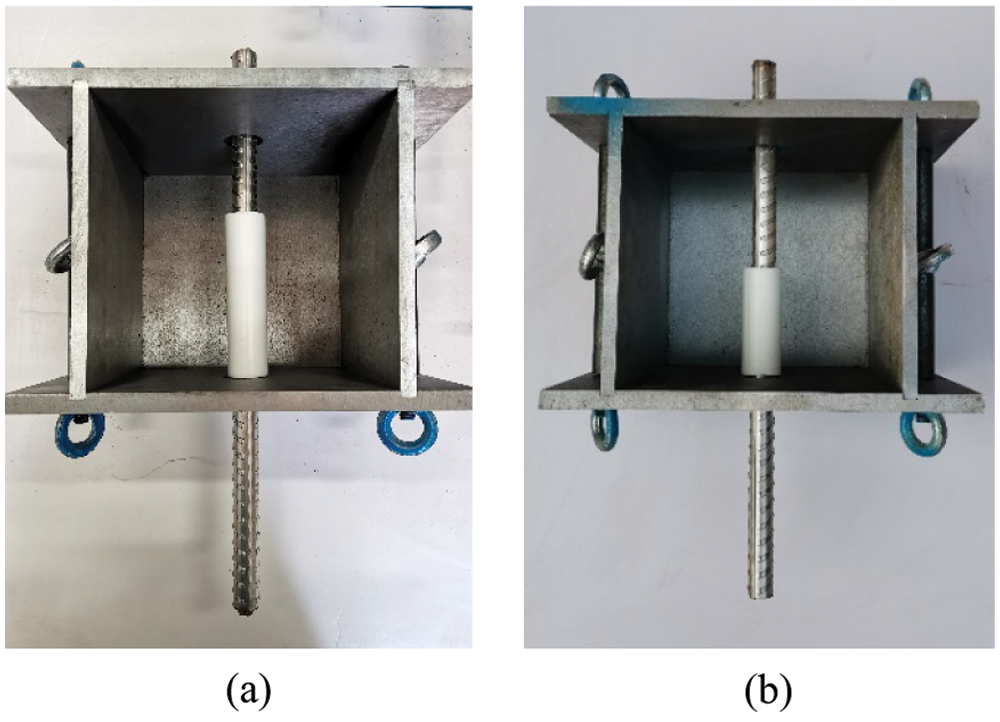
Figure 6: Inside of specimen (a) 3d bond length, (b) 5d bond length
The detailed information of specimen is shown in Table 5. All specimens were named according to concrete type (“OC”, “SSAC” and “SCAC” represent ordinary, seawater scoria aggregate and seawater coral aggregate concretes, respectively.), bond length (“3d”, “5d” and “8d” denote 3, 5 and 8 times reinforcement diameter, respectively.), concrete strength (“C25” and “C30” are C25 and C30 concrete grade, respectively.), reinforcement type (“O” and “S” denote ordinary and stainless reinforcements, respectively.) and cover thickness (“A”, “B” represent 67, 42 mm, respectively.). Taking SSAC-5d-C30-S-A as an example, the concrete type of specimen is SSAC, and the bond length, concrete strength, reinforcement type and cover thickness are 5d, C30, SR and 67 mm, respectively.

All pull-out samples were fabricated based on the following procedures. (1) The steel frameworks of specimens were prepared, and the reinforcement and PVC pipe were placed inside them (Fig. 6). (2) Filling the steel frameworks with concrete mixture, and vibrating mixture with an external vibrator for about 1 minute to ensure the concrete compaction. (3) The steel formworks were removed (after 1 day), and specimens were cured under the same conditions (room temperature: 20 ± 1°C, relative humidity: 90 ± 5%).
The loading system was composed of three parts, 300 kN MTS electro-hydraulic servo testing machine, rigid loading steel frame and computer system (Fig. 7). The rigid loading steel frame consisted of two steel plates (width:length:thickness = 300 mm:300 mm:30 mm) and four high-strength bolts (25 mm of diameter). An electronic extensometer was set at the free end of specimen to measure the relative slip between concrete and reinforcement (Fig. 7). The pull-out load was monitored by a computer system.
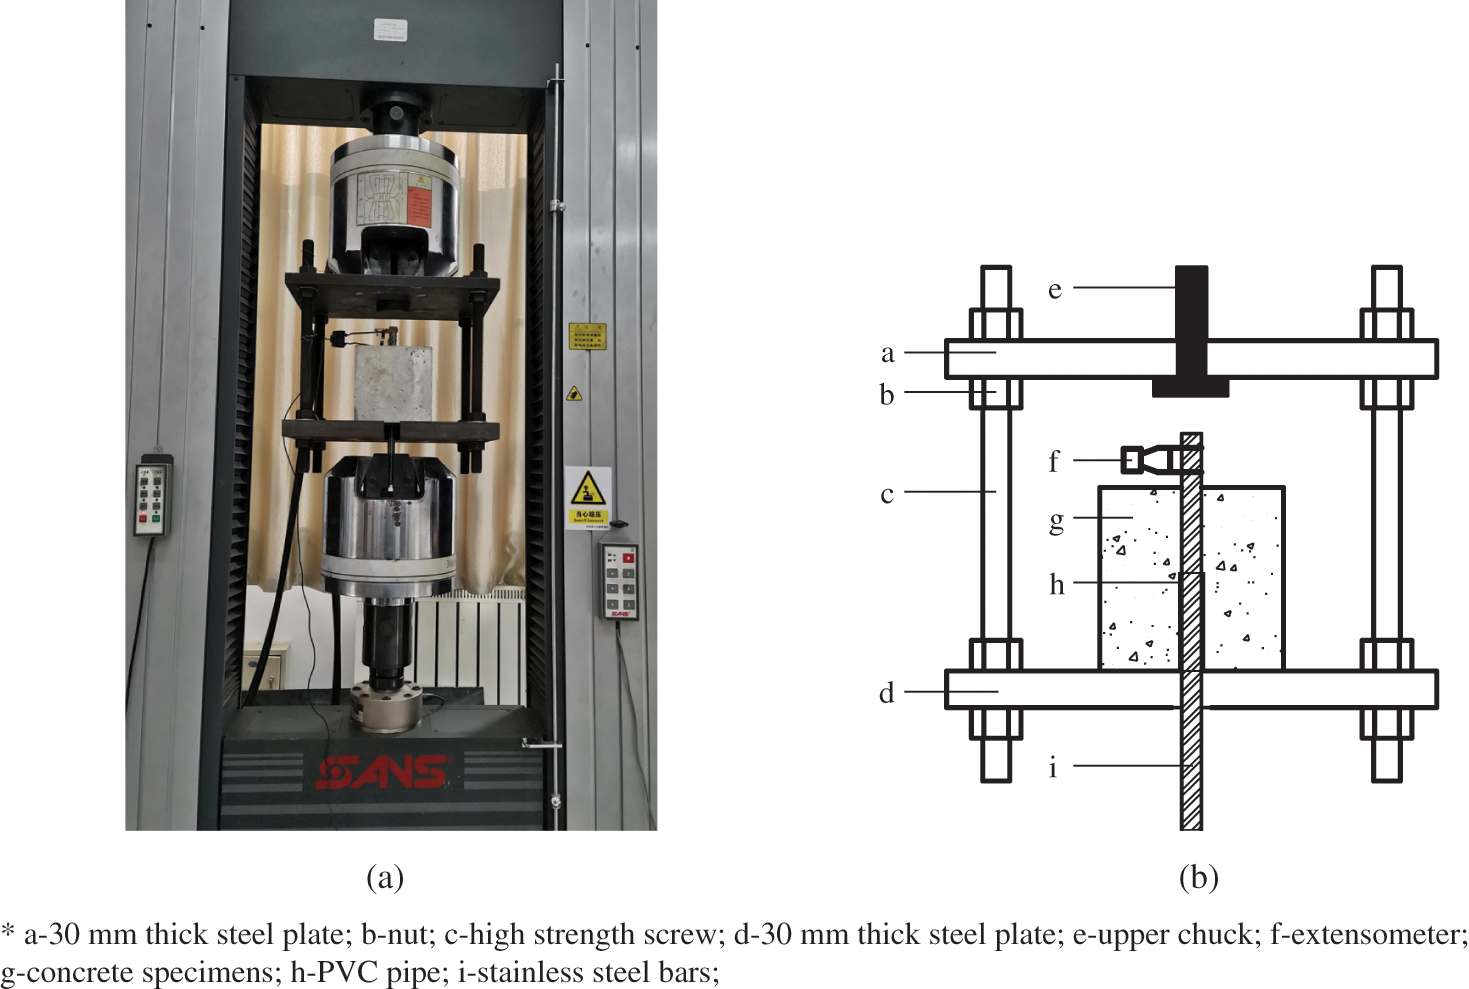
Figure 7: Loading system (a) loading equipment, (b) pull-out test device
Before actual test, the specimen was preloaded with a 2 kN pull-out load to ensure the normal function of loading device [37]. The displacement loading program was adopted in this study to obtain whole bond-slip curve, and the loading rate kept 0.3 mm/min. The typical failure pattern of specimen was also recorded at the end of the test.
2.4 Determination of Bond Properties
The averaged bond stress—relative slip at free end (τ-δ) curve, the bond strength (τmax) and the bond stress distribution were adopted in this test to study the general bond properties of SSAC-SR. The τ is calculated by Eq. (1).
where F, d and la are the pull-out load, reinforcement diameter and bond length, respectively. When F reaches the maximum value (Fmax), the bond strength (τmax) can be obtained through Eq. (1), and τmax is the maximum value of τ.
Generally, the bond stress distributed unevenly along bond length, and it changed with the variation in bond location. The investigation of bond stress distribution is critical to determine the anchorage length and splice length of specimen. However, there were no studies focused on the characteristics of SSAC-SR bond stress distribution.
A specific method suggested by Guo [48] was used to obtain the bond stress distribution. The details of method were concluded as follows: first, reinforcement was divided into two halves along the axial axis; second, a 4 mm in width, 2.5 mm in depth and full bar length groove were fabricated; third, several strain gauges were pasted at regular intervals (15 mm) and the wires were draw out (Fig. 8); finally, these two halves of reinforcement were stuck together, and the reinforcement was used to manufacture pull-out specimen. The distribution of bond stress can be obtained through strain gauges, as shown in Eq. (2).
In Eq. (2), τi denotes the bond stress at the ith location; εs,i+1 and εs,i is the strain values of the two adjacent measuring points on the reinforcement, respectively; Es represents the elastic modulus of the reinforcement, As and d denote the cross-sectional area of the reinforcement. ∆l represents the distance between the two adjacent strain gauges.
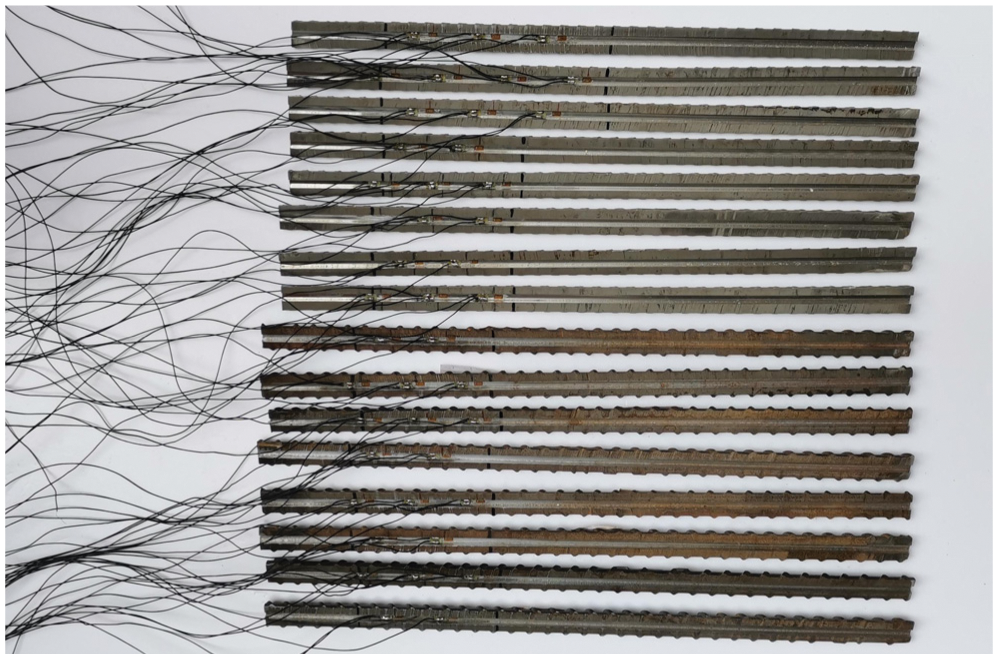
Figure 8: The treatment of stainless reinforcement
3.1 General Characteristics of Bond Properties
The τ-δ curve of SSAC-SR can be divided in to three stages, i.e., micro-slipping, slipping and declining stages (Fig. 9). During the micro-slipping stage, δ was negligible while τ obviously increased. There were no obvious deformation and micro-cracks observed, and τ was mainly provided by chemical adhesion [49].
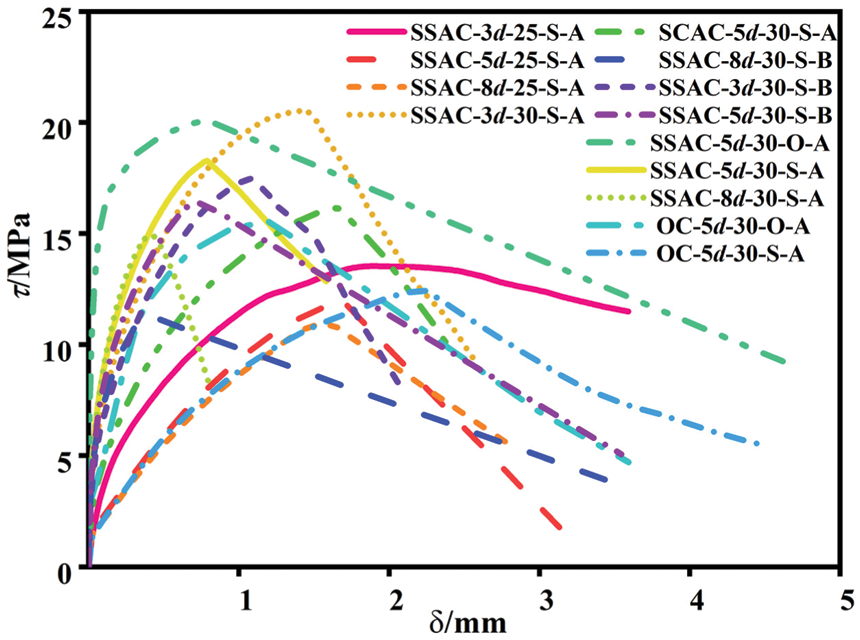
Figure 9: τ-δ curve
The τ-δ curve became nonlinear when τ reached 20%–90% of τmax (Fig. 10), and specimen was in the slipping stage [50]. The slope of τ-δ curve decreased due to the micro cracks and plastic deformation of concrete and the failure of adhesion. The τ mainly consisted of friction and mechanical interlock between the bars and the surrounding concrete during this stage [51]. It was obtained that the curve curvature and τmax changed with the variations in concrete type, bond length and cover thickness. The δ became large, and many micro-cracks appeared in the surface of concrete when τ approached τmax. Generally, the type of concrete and bond length had significant influences on the characteristics (width and length, etc.) of cracks.
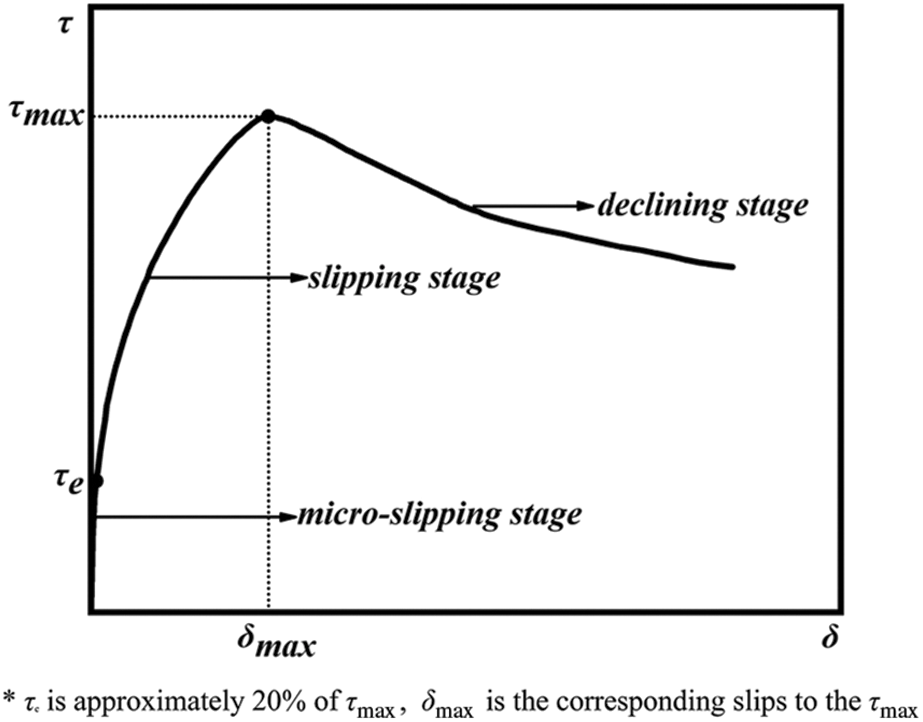
Figure 10: The representative τ-δ curve
After τmax, the mechanical interlock between ribbed bars and concrete failed gradually, and the τ-δ curve was in the declining stage. It was observed that τ decreased with the increase in δ. According to the test results, the decline of τ-δ curve changed with the variations in the bond length, cover thickness, concrete strength and types of concrete.
3.2 Failure Pattern and Surface
The failure patterns of SSAC-SR specimen were mainly splitting failure (SF), pull-out failure (PF) and splitting-pullout failure (SPF), as shown in Fig. 11. For PF specimen, the steel bar at the loading end was pulled out and there was no obvious crack observed in the surface of specimen. However, tiny cracks appeared in SF specimen surface when τ approached τmax. After τmax, cracks developed quickly and SF specimen was suddenly split into 2–3 pieces. Compared to SF specimen (Fig. 11), the macro cracks could be observed in SPF specimen and the reinforcement at the loading end of specimen was also pulled out, the concrete kept basically intact and the failure of specimen was relatively ductile.
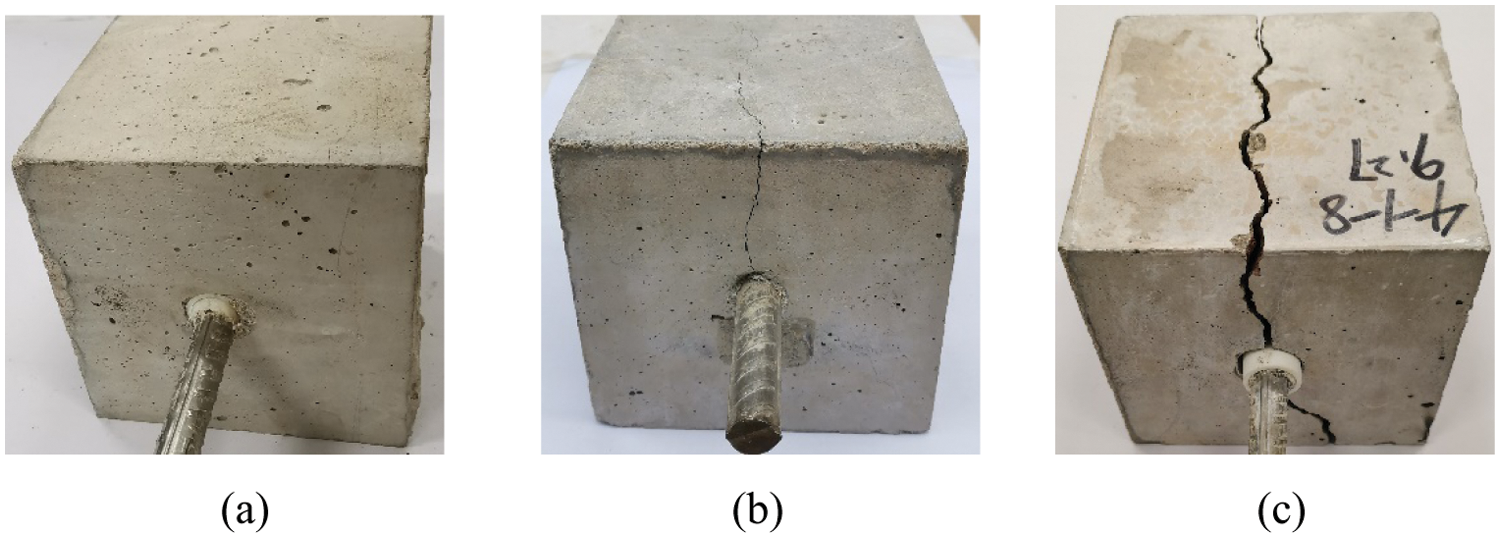
Figure 11: Typical specimen failure mode (a) pull-out failure, (b) splitting-pullout failure, (c) splitting failure
The effects of these factors on the failure pattern of SSAC–SR in increasing order are concrete type, bond length and concrete strength. It can be obtained that the failure patterns of SSAC-3d-25-S-A and SSAC-5d-25-S-A (C25 specimen) were pullout and pullout-splitting failures, respectively. However, SSAC-3d-30-S-A and SSAC-5d-30-S-A (C30 specimen) were splitting failure. That is attributed to specimen become more brittle with an increase in the concrete strength [52]. Furthermore, OC-5d-30-O-A specimen (OC specimen) was splitting-pullout failure while SSAC-5d-30-O-A (SSAC specimen) was splitting failure. The reason for this phenomenon can be explained as the ductility and deformability of SSAC are inferior to those of ordinary concrete, resulting in SSAC specimen is more prone to brittle failure [29].
The concrete type significantly changed the failure surface of specimen, as shown in Fig. 12. Compared to OC specimen (Fig. 12a), the failure surface of specimen adopting SSAC or SCAC (Figs. 12b–12f) was relatively smooth, and macro cracks crossed SCA, CCA and cement mortar. This is due to the low strength of coral and scoria aggregates and the high adhesion between cement paste and porous aggregates. The macro crack directly crossed the porous coral/scoria aggregate, causing a smooth failure surface [53].
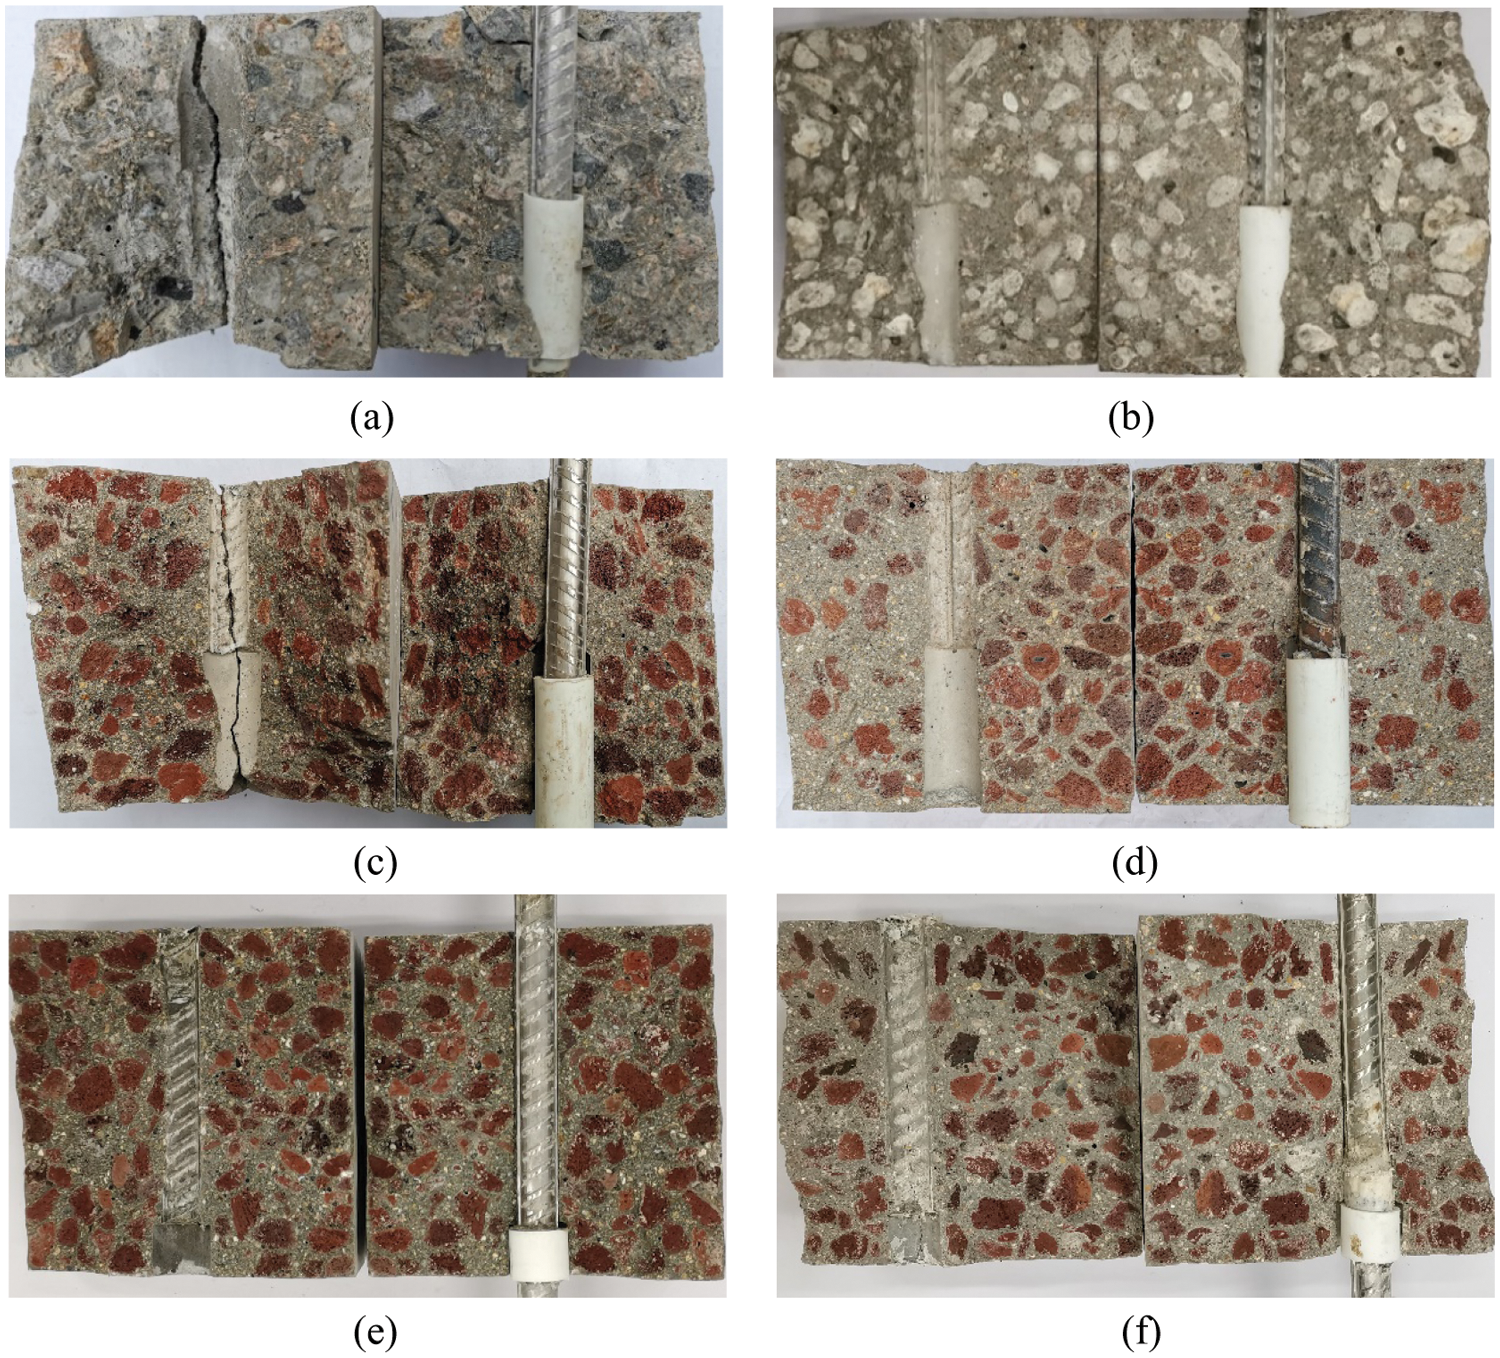
Figure 12: Failure surface of specimen (a) OC-5d-30-S-A, (b) SCAC-5d-30-S-A, (c) SSAC-5d-30-S-A, (d) SSAC-5d-30-O-A, (e) SSAC-8d-30-S-A, (f) SSAC-8d-30-S-B
Furthermore, SR effectively protected the reinforced SSAC from corrosion. There was no rust of steel bars observed in specimen adopting SR (Fig. 12c). However, the corrosion of ordinary reinforcement was found in SSAC-5d-30-O-A specimen (Fig. 12d). The Cl– in seawater and sea sand easily corroded ordinary reinforcement in a short term (day 28).
3.3 Distribution of Bond Stress
The measured strains (ε) along steel reinforcement under different loading stages are shown in Fig. 13. It was observed that the value of ε was small during the initial stage of loading (10%–20% of Fmax), while ε increased rapidly when F reached about 30%–40% of Fmax. That is due to the failure of chemical adhesion, and F was mainly composed of the friction and the mechanical interlock between the bars and the surrounding concrete. Generally, ε decreased from the loading end to the free end (Fig. 13), and the strain distribution of OC specimen was similar to that of SSAC specimen.
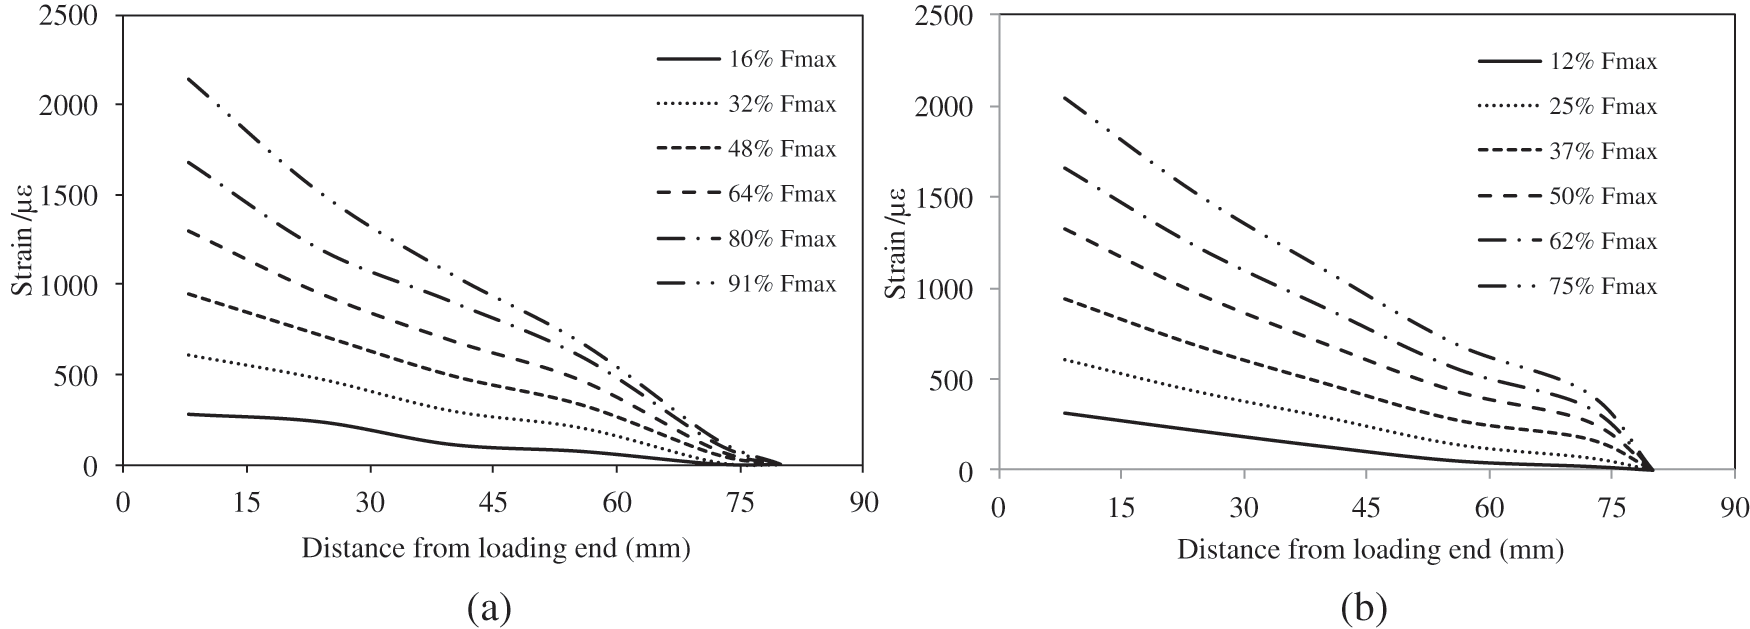
Figure 13: The strain distribution of specimen (a) OC-5d-30-O-A, (b) SSAC-5d-30-O-A
3.3.2 Distribution of Bond Stress
The distributions of bond stress changed with the variations in types of concrete and reinforcement (Fig. 14). Generally, bond stress distributed uniformly during the initial stage of loading (10%–20% of Fmax), while this pattern was changed when F approached 30%–50% of Fmax. That can be attributed to the failure of chemical adhesion. The bond stress decreased from the loading end to the free end, and the maximum value of bond stress was near the loading end of specimen (Fig. 14).
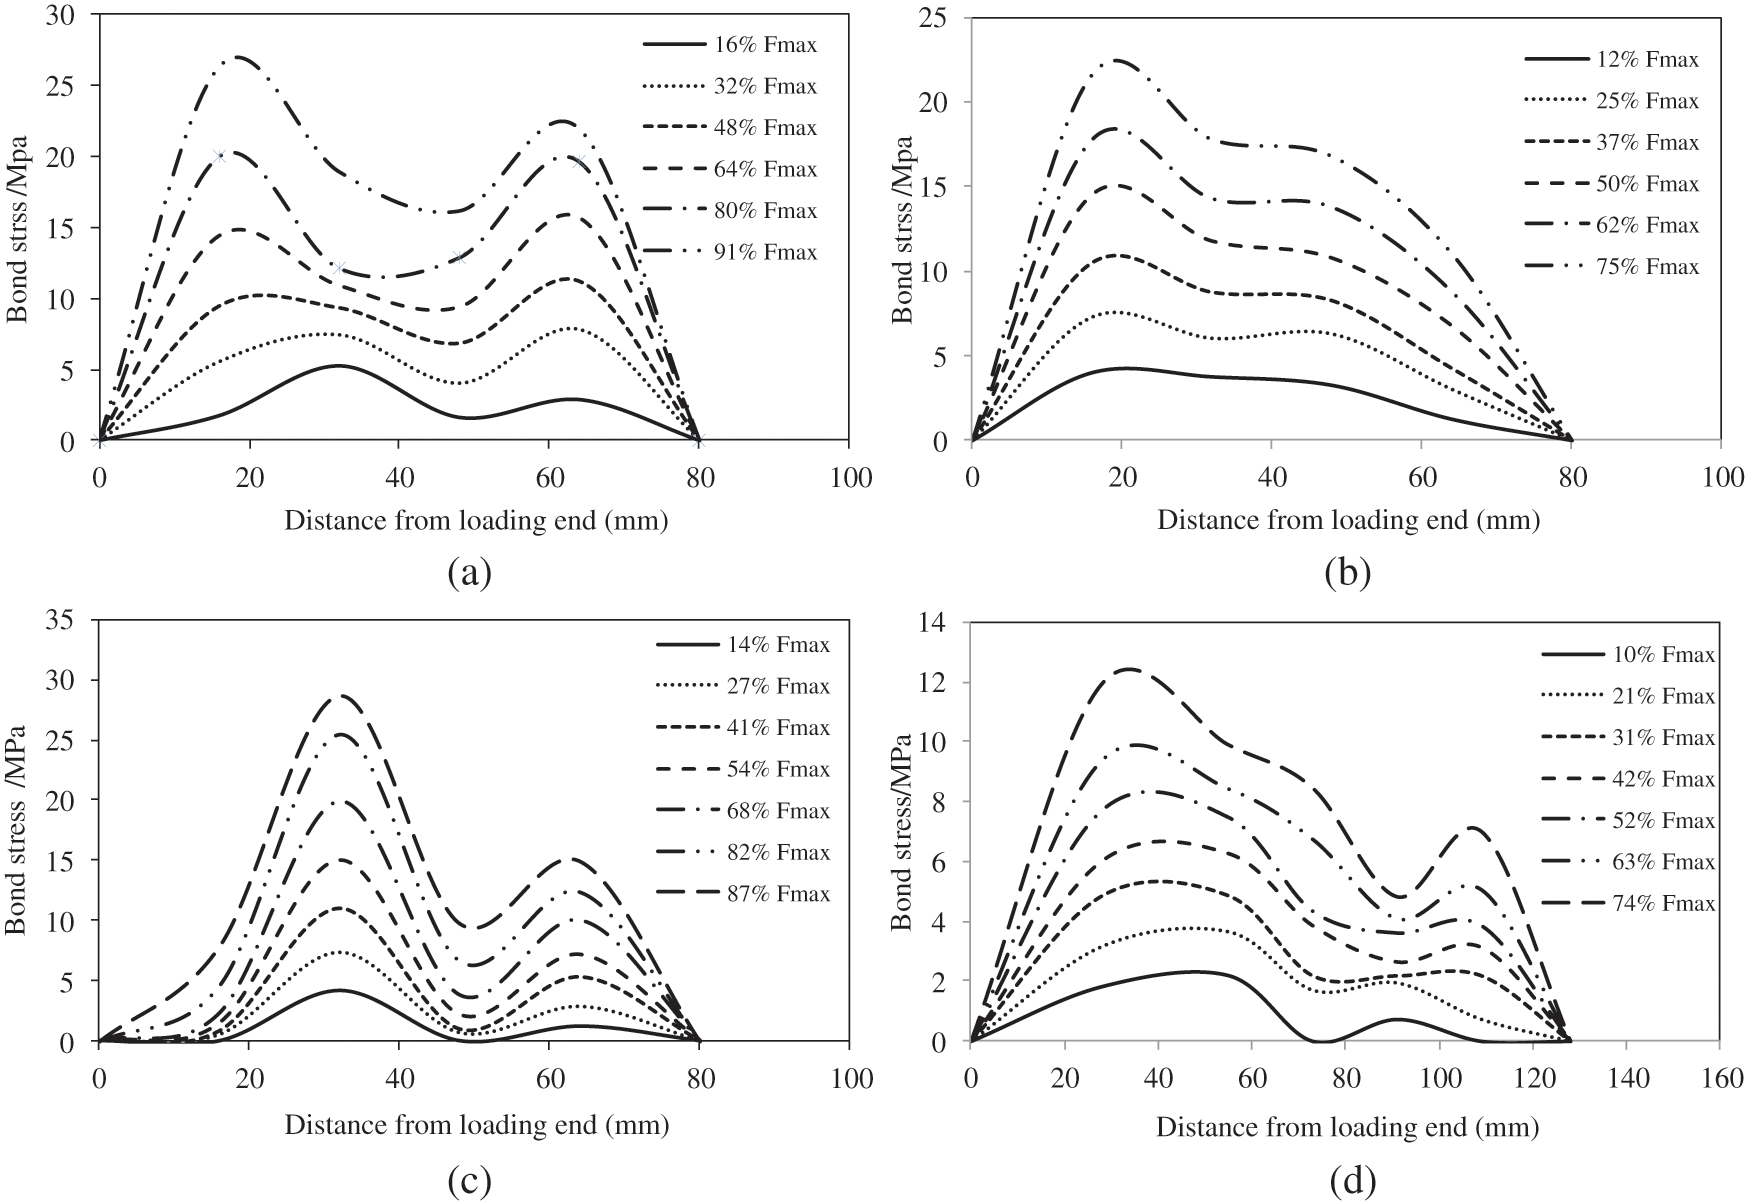
Figure 14: The distribution of bond stress along bond strength (a) OC-5d-30-O-A, (b) SSAC-5d-30-O-A, (c) OC-5d-30-S-A, (d) SSAC-8d-30-S-A
It can be found that the bond stress distribution of specimen adopting SSAC (SSAC-5d-30-O-A) was similar to that of OC specimen (OC-5d-30-O-A). However, several differences could be obtained. The bond stress distribution of SSAC-5d-30-O-A was more uniformly compared to OC-5d-30-O-A (Figs. 14a and 14b). For OC-5d-30-O-A, there were approximately two peaks in the bond stress along the bond strength. That is because the cracking of OC was higher than that of SSAC before the peak stress [54], causing the uneven distribution of bond stress.
The type of reinforcement could also change the bond stress distribution of specimen. It was observed that the location of maximum bond stress of specimen adopting ordinary reinforcement was about 15–18 mm away from loading end, which approximately decreased by 53%–44% compared to specimen adopting SR (Figs. 14b–14d). That is because the smooth surface and low rebar rib of SR reduce the friction and mechanical interlock of specimen. The lower the friction and mechanical interlock, the farther the maximum bond stress away from loading end.
3.4 Specific Effects of Variables on Bond Properties
The τ-δ curve, slip at peak load (δmax) and τmax changed with the variations in concrete type, bond length, cover thickness and material strength based on the test results (Table 5 and Fig. 9). The effects of these factors on the bond properties also need to be quantitatively analyzed.
Effects of Concrete and Reinforcement Types
The concrete type significantly affected τmax. Compared to specimen adopting OC, τmax of SSAC and SCAC specimens were averagely 38.2% and 29.7% higher, respectively. Considering OC-5d-30-S-A and OC-5d-30-O-A as examples (specimen adopting OC), τmax of SSAC-5d-30-S-A and SCAC-5d-30-O-A (specimens using SSAC and SCAC, respectively) increased by 46.8% and 29.6%, respectively. That can be attributed to the following reasons: first, the plastic deformation and micro cracks of SSAC and SCAC are lower than those of OC before the peak point under similar fcu condition [54]; second, ft of SSAC and SCAC are larger compared to OC due to the “self-curing” effect of lightweight coarse aggregate [55]. The less the plastic deformation and micro cracks, the higher the ft, and the more the value of τmax. It was observed that τmax of SSAC-5d-30-S-A (specimen using SSAC) was 13.2% more than that of SCAC-5d-30-S-A (specimen adopting SCAC), owing to the properties of SSAC.
The value of τmax changed with the type of reinforcement used. Generally, τmax of specimen adopting SR was averagely 17.4% lower than that of specimen adopting OR, owing to the low rib height and smooth surface of SR (Table 2). However, the effect of reinforcement type on τmax was modified after using different concrete types. The bond strength difference between OC-OR (ordinary concrete-ordinary reinforcement specimen) and OC-SR (ordinary concrete-stainless reinforcement specimen) was 24.7%, while the difference between SSAC-OR and SSAC-SR was 10.1% (Table 5). This is because chlorine ions in SSAC cause the corrosion of ordinary steel bars (Fig. 12d), and the corrosion degree (λ) is low during the initial stage (day 28). The low λ increased the radial compressive stress between surrounding concrete and bars, and the value of τmax was also enhanced.
Effect of Bond Length and Concrete Strength
The τmax decreased with an increase in bond length (Fig. 15). The longer the bond length (la), the less the τmax. Compared to SSAC-3d-30-S-A, τmax of SSAC-5d-30-S-A and SSAC-8d-30-S-A were decreased by 1.9% and 27.3%, respectively. The long bond length causes uneven distribution of τ and decreases the bond strength [56].
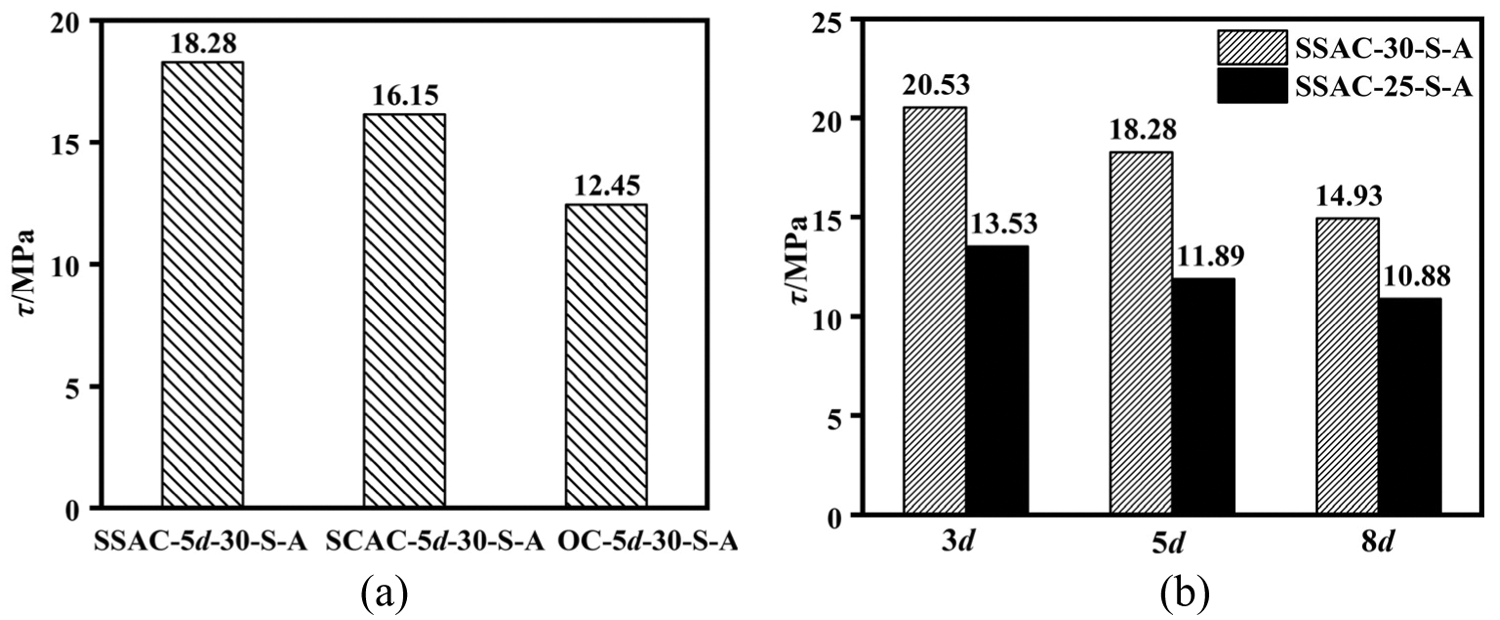
Figure 15: The influence of concrete type and bond length on bond strength (a) concrete type, (b) bond length
Generally, τmax of SSAC-SR increased with an increase in concrete strength. The τmax of SSAC-8d-30-S-A, SSAC-5d-30-S-A and SSAC-3d-30-S-A were 34.1%, 35% and 27.1% more than those of SSAC-8d-25-S-A, SSAC-5d-25-S-A and SSAC-3d-25-S-A, respectively. The higher the concrete strength grade, the more the tensile and compressive strengths, and the larger the τmax.
Furthermore, increasing the concrete strength could reduce the influence of bond length on τmax. The bond strength difference between SSAC-8d-25-S-A and SSAC-3d-25-S-A was 19.6%, while the difference between SSAC-8d-30-S-A and SSAC-3d-30-S-A was 27.3%. That is because of the high concrete strength reduces the uneven distribution of τ along the bond length [57].
Effect of Concrete Cover Thickness
According to test results, τmax significantly increased with an increase in concrete cover thickness. The τmax of SSAC-3d-30-S-A, SSAC-5d-30-S-A and SSAC-8d-30-S-A (specimen with 67 mm cover thickness) were 15%, 10.3% and 24.5% higher than those of SSAC-3d-30-S-B, SSAC-5d-30-S-B and SSAC-8d-30-S-B (specimen with 42 mm cover thickness), respectively. Increasing concrete cover thickness would enhance the radial compressive stress between the surrounding concrete and the rebar, which improves the value of τmax [58].
Effects of Concrete and Reinforcement Types
The τ-δ curve of specimen adopting SSAC was similar to that of specimen using OC, while a few changes could also be observed (Fig. 16). Compared to OC-5d-30-S-A (OC specimen), the curve curvature and the slip at peak load (δmax) of SSAC-5d-30-S-A (SSAC specimen) decreased while τmax increased under similar fcu condition. After τmax, the curve of SSAC-5d-30-S-A declined more quickly than that of OC-5d-30-S-A. The specific reason for these phenomena is the properties of concrete. According to Topu [10], the plastic deformation and micro cracks of concrete adopting scoria aggregate were low compared to ordinary concrete before the peak stress. The less the plastic deformation and micro cracks, the better the bond between concrete and reinforcement, the lower the curve curvature and δmax. However, the ductility and deformability of concrete using scoria aggregate were inferior to those of ordinary concrete [1,59], resulting in the rapid decline of SSAC specimen τ-δ curve.
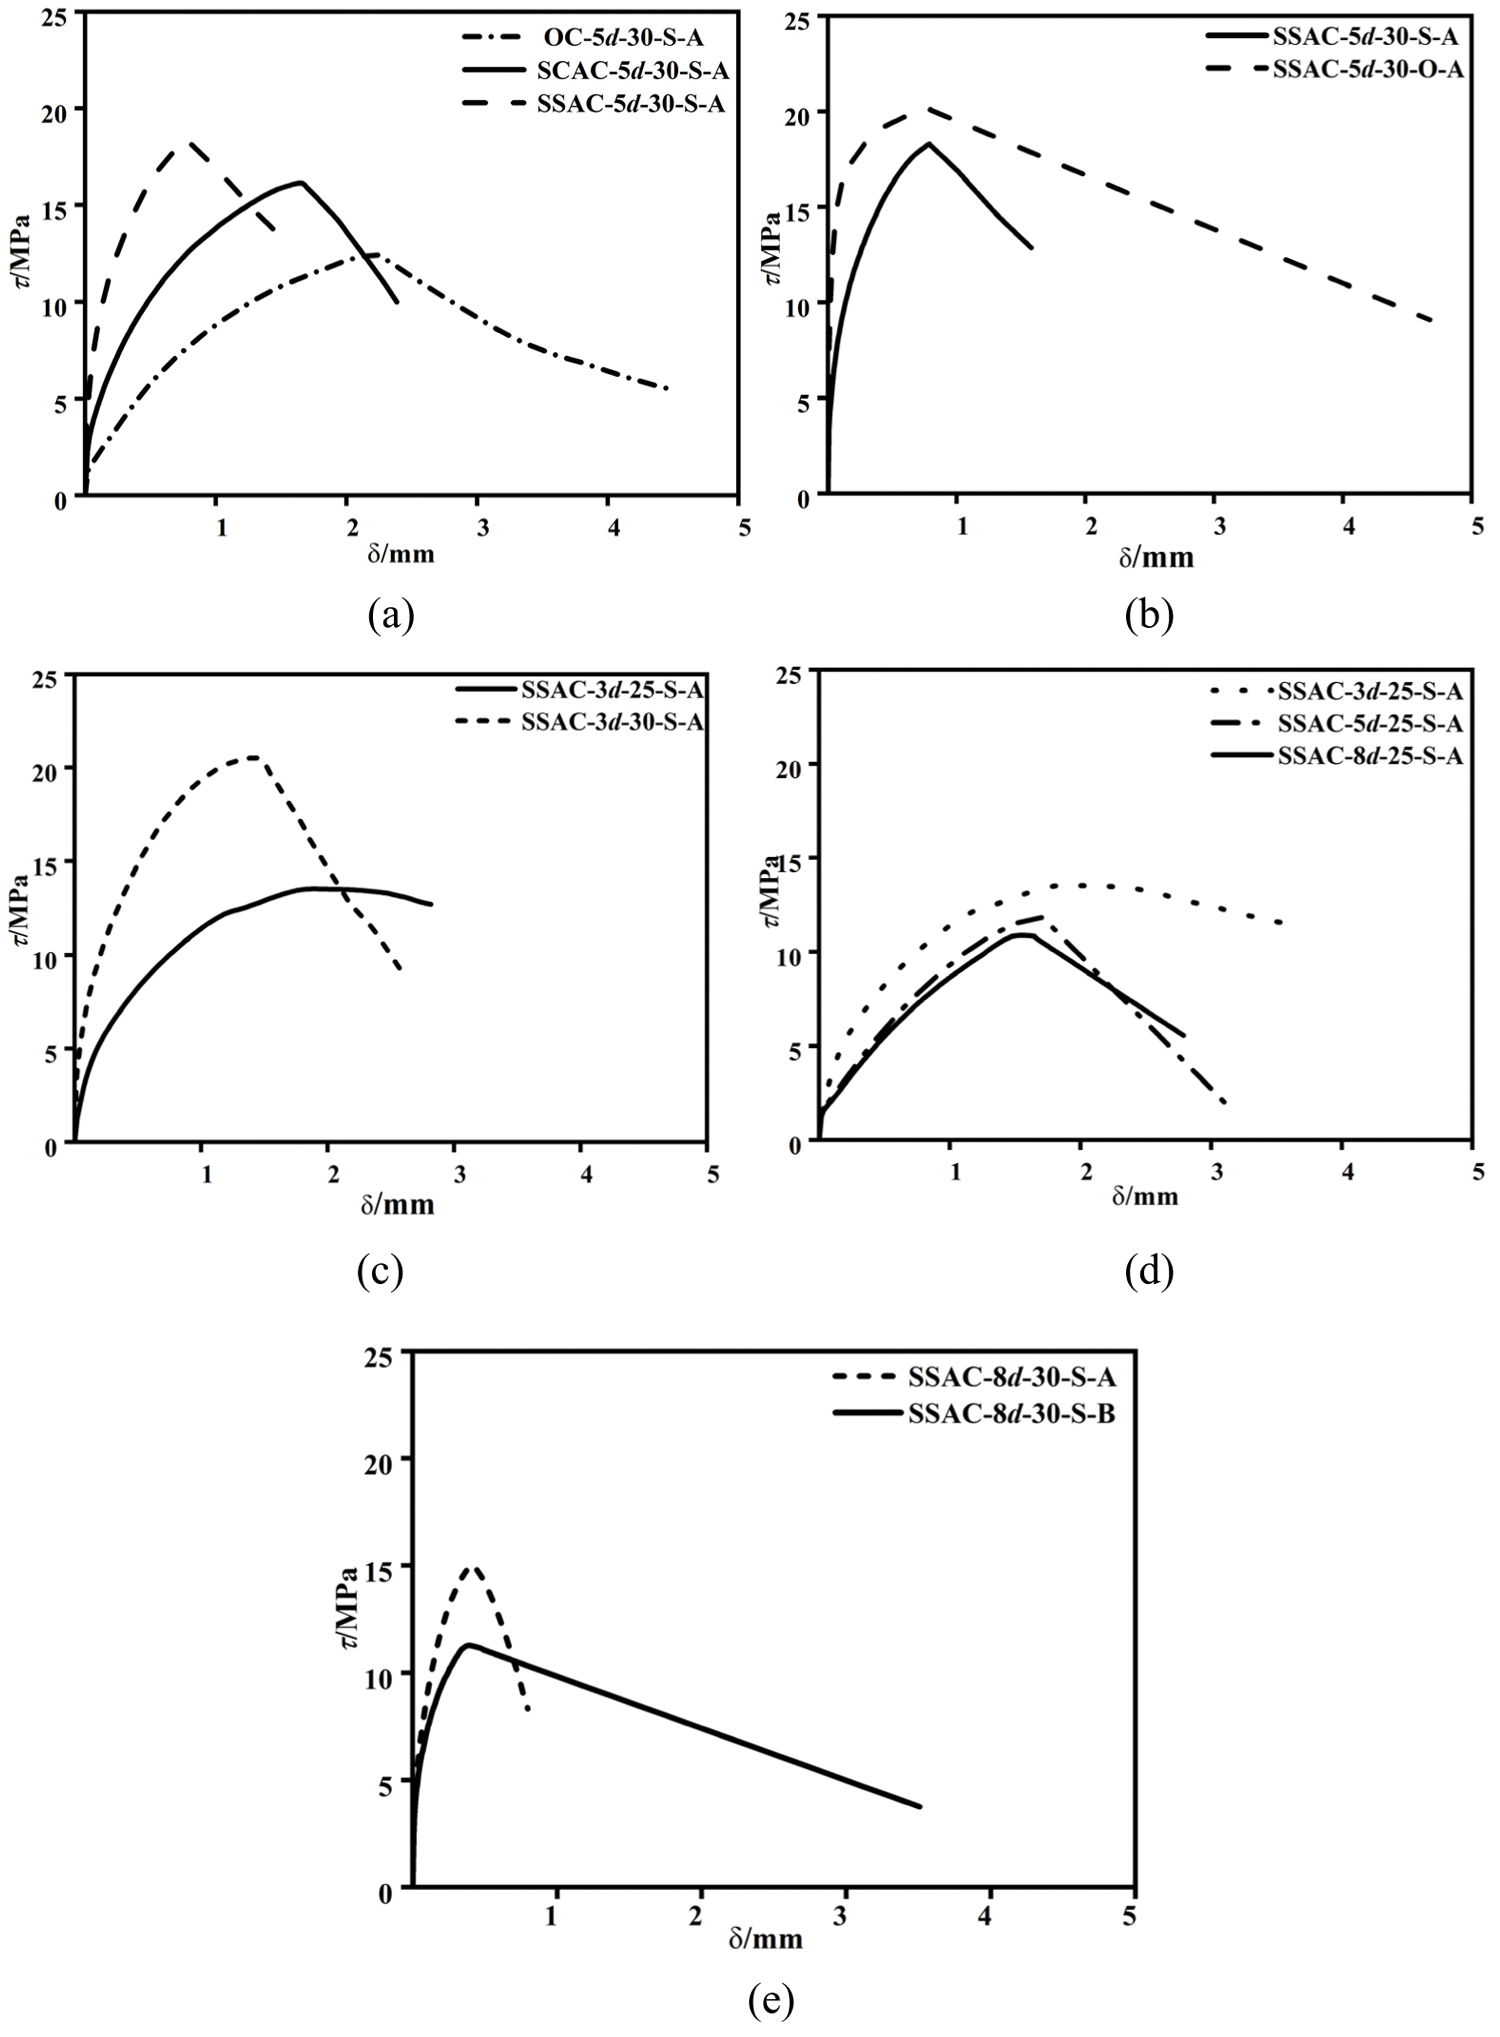
Figure 16: The influence of different factors on the τ-δ curve (a) concrete type, (b) reinforcement type, (c) concrete strength, (d) bond length, (e) cover thickness
Furthermore, τ-δ curve of SSAC specimen was slightly different from that of SCAC specimen. It was observed that τmax of SCAC specimen (SCAC-5d-30-S-A) decreased while the curve curvature and δmax increased compared to SSAC specimen (SSAC-5d-30-S-A) under similar strength condition (Fig. 16a). The δmax of SCAC-5d-30-S-A was 52% more than that of SSAC-5d-30-S-A due to the high density and strength of CCA. However, the decline of SCAC-5d-30-S-A curve was similar to that of SSAC-5d-30-S-A curve due to the lightweight of CCA and SCA.
Compared to SSAC-5d-30-O-A (specimen using ordinary reinforcement), δmax of SSAC-5d-30-S-A (SR specimen) increased by 1.3% while τmax decreased by 9.2% (Fig. 16b). That can be attributed to the friction force and chemical adhesion between the stainless steel bars and SSAC are relatively small, which improves δmax while reduces τmax [34].
Effects of Bond Length and Concrete Strength
The bond length and concrete strength had significant influences on τ-δ curve (Figs. 16c and 16d). Generally, the curve curvature and δmax increased with a decrease in concrete strength. It was found that δmax of SSAC-5d-25-S-A was about 52.7% higher than that of SSAC-5d-30-S-A, owing to the less micro-cracking and plastic deformation of high strength concrete before the peak stress.
Generally, the higher the concrete strength and bond length, the more the rapid decline of τ-δ curve (Figs. 16c and 16d). The decline of SSAC-8d-30-S-A curve is steeper than that of SSAC-3d-30-S-A curve. That can be attributed to the high energy accumulates in pull-out specimen with large bond length and concrete strength causes the fast crack propagation after the peak point.
Effect of Cover Thickness
The curve curvature and δmax slightly increased with a decrease in cover thickness (Fig. 16e). Taking SSAC-5d-30-S-A as an example (specimen with 67 mm cover thickness), its δmax was 11.3% higher than that of SSAC-5d-30-S-B (specimen with 42 mm cover thickness). However, the SSAC-5d-30-S-A curve declined quickly after τmax compared to SSAC-3d-30-S-B curve. This is because the thick concrete cover enhances the radial compressive stress between the surrounding concrete and the reinforcement, causing the reduction of δmax of specimen. However, the high energy accumulates in specimen with thick cover thickness causes the fast crack propagation after τmax.
According to the above results, the bond properties changed with the variations in concrete and reinforcement parameters. Consequently, the bond of SSAC to SR under different conditions need be quantitatively determined to describe the variations in bond characteristics.
An analytical expression of bond strength is important for the design of reinforced SSAC. However, there was no study focused on this research field. A specific method was suggested to obtain the analytical expression of SSAC-SR, and the detailed processes were concluded as follows. First, according to the test results and related references [29,59], τmax under different conditions were obtained; second, an approximate expression of τmax was adopted based on the references [60–63]; finally, the MATLAB software was adopted to code an least squares method numerical program to study test results and establish the specific formulas, as shown in Eq. (3).
In Eq. (3), τu,e denotes the calculated bond strength, ft is the concrete splitting tensile strength; c, la and d are the concrete cover thickness, bond length and reinforcement diameter, respectively; ρv denotes the volume reinforcement ratio k represents the parameter related to the shape of the reinforcement (Eq. (4)).
In Eq. (4), h and l are height and spacing of bar rib, respectively. A comparison between the calculated results and the test ones is shown in Table 5. The correlation coefficient was 0.9 and the difference was small. The suggested model can be adopted in the practical design of SSRAC structures.
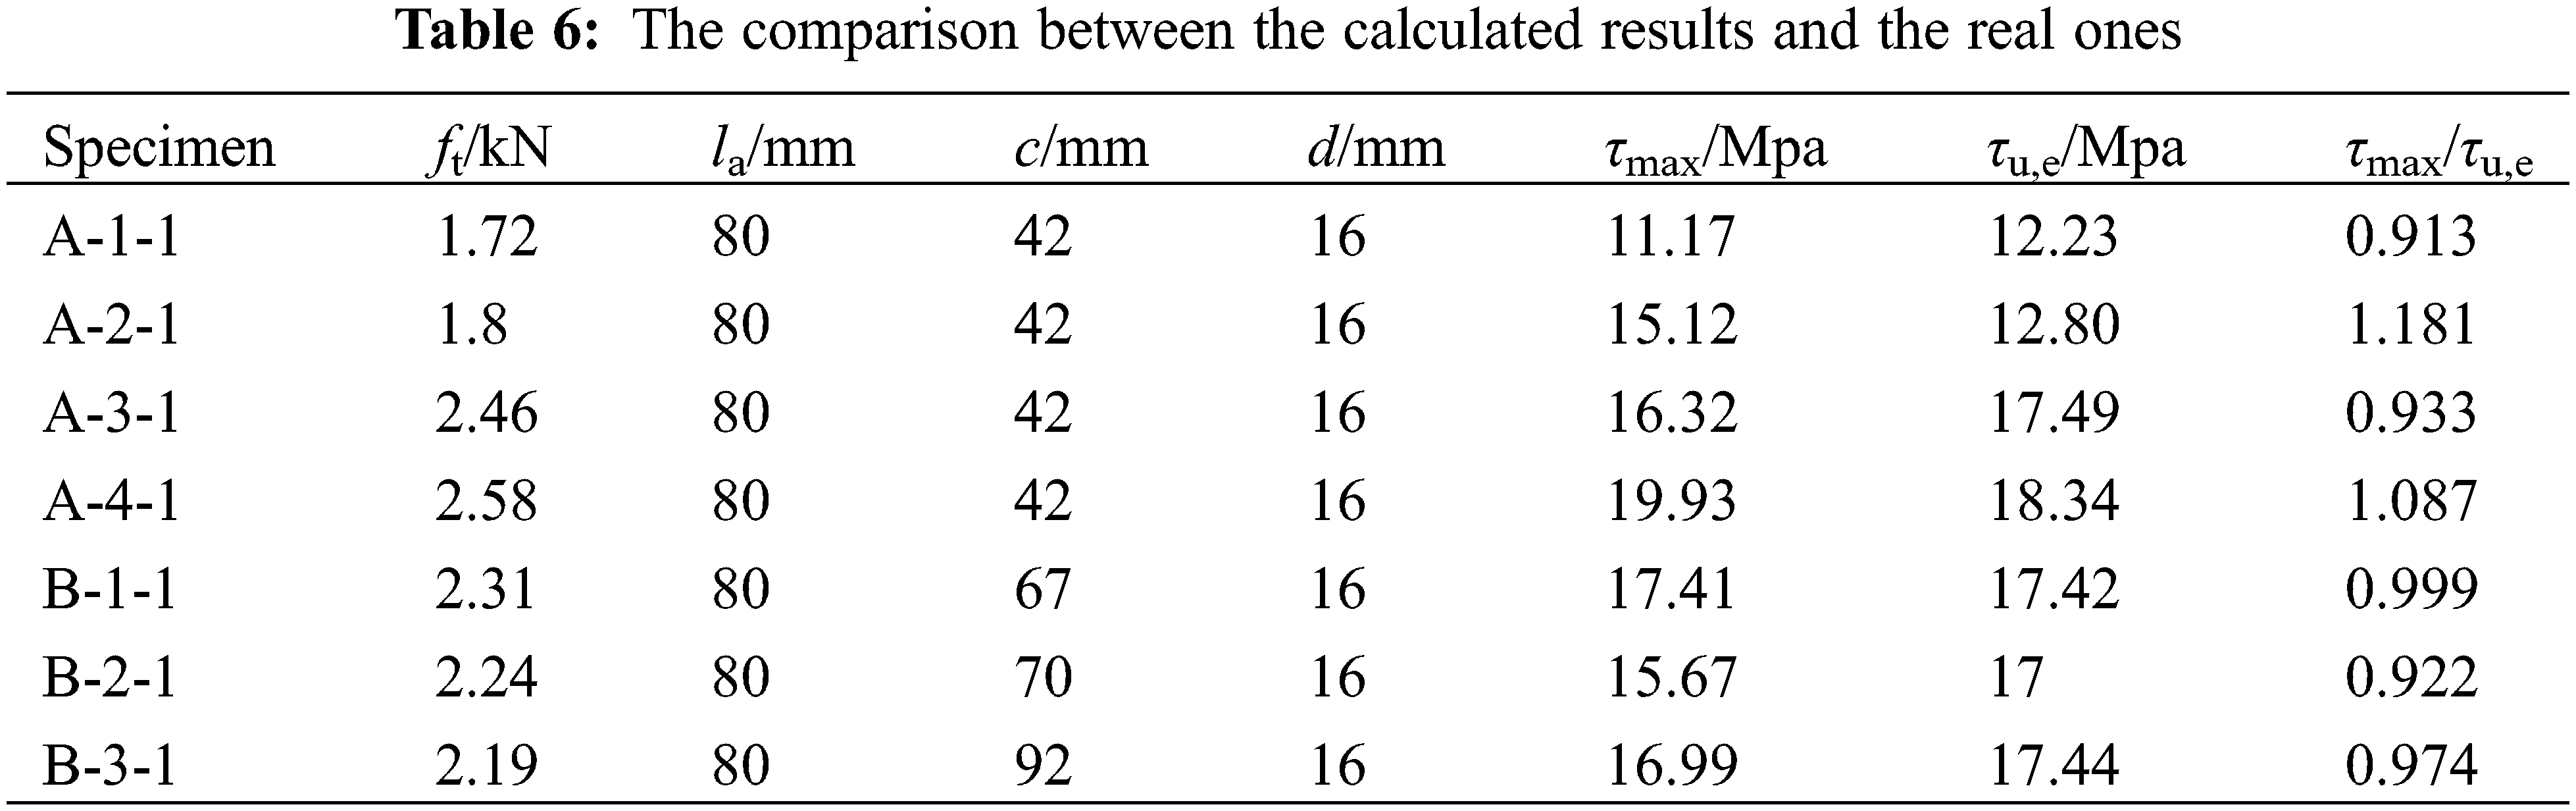
Furthermore, the comparison between the calculated values and the experimental data from other references is shown in Table 6 [63]. The results indicated that the difference was acceptable, and the suggested model can be applied in the practical design.
Based on the experimental results and related references [27,64–66], the analytical model of SSAC-SR bond-slip relation considering the coupled effects of variables are proposed (Eq. (5)). The derivation method of bond-slip relation is similar to that of τu,e, and the analytical model can be expressed as follows:
where, τ is the averaged bond stress and δ denotes the slip at free end of specimen; α and β are the key parameters in Eq. (5).
The parameter α represents the initial slope of curve. Generally, the higher the α, the larger the plastic deformation before the peak point. The specific model of a is shown in Eq. (6).
In Eq. (6), d, c and la are the diameter of reinforcement, concrete cover thickness and bond strength, respectively.
The parameter β denotes the area below the descending segment of curve. It was obtained that the larger the β, the more quickly the decline of curve.
In Eq. (7), fcu is the cubic compressive strength of concrete.
The comparison between the experimental curves and the calculated ones are shown in Fig. 17. The differences were acceptable, and the suggested model can be used in the practical design.
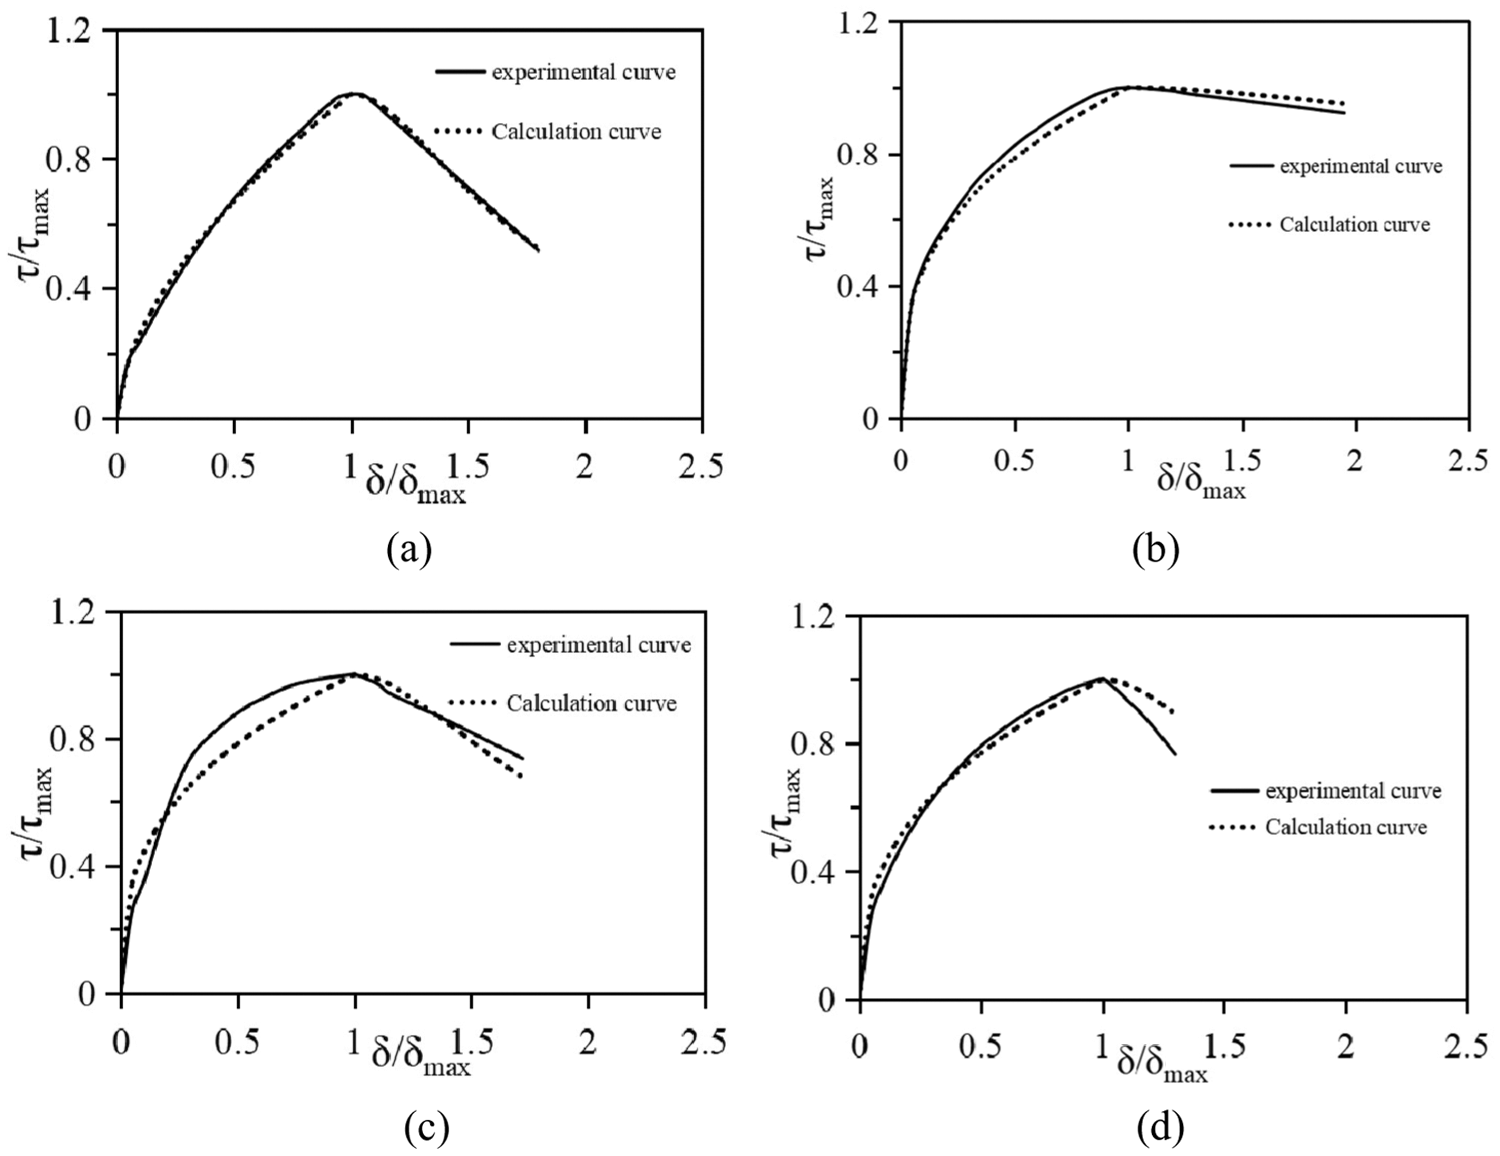
Figure 17: The comparison between the experimental curves and the calculated ones (a) SSAC-8d-25-S-A, (b) SSAC-8d-30-S-B, (c) OC-5d-30-O-A, (d) SCAC-5d-30-S-A
The bond of stainless reinforcement to seawater scoria aggregate concrete was systematically investigated in the study. The main conclusions are summarized as follows:
(1) The type of concrete changes the failure pattern of pull-out specimen, while the effect of reinforcement is negligible. The failure surface of specimen adopting SSAC is smooth, and macro cracks across aggregates and cement mortar. Compared to the OC specimen, τmax of SSAC specimen increases while δmax decreases under the same conditions. Furthermore, the τmax of stainless reinforcement specimens is 14.5% lower than that of ordinary reinforcement specimens. The bond stress distribution of specimen became uniformly after using SSAC, while SR changed the location of maximum bond stress.
(2) The τmax increases with the increases of concrete strength and cover thickness, while τmax decreases with an increase in bond length. The bond-slip curve consists of micro-slipping, slipping and declining stages. The curvature and ductility of curve are decreased after adopting SSAC. However, SR improves the curvature of bond-slip curve. Generally, the higher the concrete strength, bond length and cover thickness are, the more rapidly the decline of bond-slip curve is.
(3) The theoretical model of bond strength and bond-slip curve considering the coupled effects of variables are proposed in the study. The calculated results are in good agreement with the experimental values. These models provide deep insight in to the bond properties of SSAC-SR specimens.
Funding Statement: This research was funded by the National Natural Science Foundation of China (Nos. 51408346, 51978389), the Systematic Project of Guangxi Key Laboratory of Disaster Prevention and Structural Safety (2019ZDK035) and the Opening Foundation of Shandong Key Laboratory of Civil Engineering Disaster Prevention and Mitigation (No. CDPM2019KF12).
Conflicts of Interest: The authors declare that they have no conflicts of interest to report regarding the present study.
References
1. Da, B., Yu, H., Ma, H., Tan, Y. S., Mi, R. J. et al. (2016). Experimental investigation of whole stress-strain curves of coral concrete. Construction and Building Materials, 122, 81–89. DOI 10.1016/j.conbuildmat.2016.06.064. [Google Scholar] [CrossRef]
2. Wang, J., Feng, P., Hao, T. Y., Yue, Q. R. (2017). Axial compressive behavior of seawater coral aggregate concrete-filled FRP tubes. Construction and Building Materials, 147, 272–285. DOI 10.1016/j.conbuildmat.2017.04.169. [Google Scholar] [CrossRef]
3. Keller, J., Ryan, W. B. F., Ninkovich, D., Altherr, R. (1978). Explosive volcanic activity in the Mediterranean over the past 200,000 yr as recorded in deep-sea sediments. Geological Society of America Bulletin, 89(4), 591–604. DOI 10.1130/0016-7606(1978)89<591:EVAITM>2.0.CO;2. [Google Scholar] [CrossRef]
4. Takahiro, N., Nobuaki, O., Hiroki, O., Zoulkanel, M. G. S., Tomohiro, N. (2013). Some considerations for applicability of seawater as mixing water in concrete. Journal of Materials in Civil Engineering, 27(7), 1–7. DOI 10.1061/(ASCE)MT.1943-5533.0001006. [Google Scholar] [CrossRef]
5. Arzumanyan, A., Muradyan, N. (2019). Heat-acid-resistant light concretes on the base of volcanic tuff lava and pumice aggregates of Armenia. Key Engineering Materials, 828, 141–145. DOI 10.4028/www.scientific.net/KEM.828.141. [Google Scholar] [CrossRef]
6. Ugur, I. (2003). Improving the strength characteristics of the pumice aggregate lightweight concretes. 18th International Mining Congress and Exhibition of Turkey-IMCET 2003, vol. 1, pp. 579–585. IMCET, Turkey. [Google Scholar]
7. Islam, A. B. M. S., Al-Kutti, W., Alsaidan, M. N., Alharbi, F. S., Nasir, M. et al. (2018). Potential of volcanic waste scoria as an eco-friendly aggregate to produce lightweight concrete. 2018 Smart Cities Symposium, pp. 584–596. Bahrain, Bahrain. [Google Scholar]
8. Granata, M. F. (2015). Pumice powder as filler of self-compacting concrete. Construction and Building Materials, 96(6), 581–590. DOI 10.1016/j.conbuildmat.2015.08.040. [Google Scholar] [CrossRef]
9. Hossain, K. M. A. (2004). Properties of volcanic scoria based lightweight concrete. Magazine of Concrete Research, 56(2), 111–120. DOI 10.1680/macr.2004.56.2.111. [Google Scholar] [CrossRef]
10. Topu, L. B. (1997). Semi lightweight concretes produced by volcanic slag. Cement and Concrete Research, 27(1), 15–21. DOI 10.1016/S0008-8846(96)00190-1. [Google Scholar] [CrossRef]
11. Al-Zboon, K. K. (2017). Natural volcanic tuff for sustainable concrete industry. Jordan Journal of Civil Engineering, 11(3), 408–423. [Google Scholar]
12. Campione, G., La, M. L. (2004). Behavior in compression of lightweight fiber reinforced concrete confined with transverse steel reinforcement. Cement and Concrete Composites, 26(6), 645–656. DOI 10.1016/S0958-9465(03)00047-7. [Google Scholar] [CrossRef]
13. Gershome, A. G., Mutabaruka, J. D. D., Mbereyaho, L. (2020). Sulfate attack and embedded steel corrosion resistances of volcanic-aggregate concrete with fly ash and silica fume. Rwanda Journal of Engineering, Science, Technology and Environment, 3(1), 1–20. DOI 10.4314/rjeste.v3i1.12. [Google Scholar] [CrossRef]
14. Onoue, K., Tamai, H., Suseno, H. (2015). Shock-absorbing capability of lightweight concrete utilizing volcanic pumice aggregate. Construction and Building Materials, 83(2), 261–274. DOI 10.1016/j.conbuildmat.2015.03.019. [Google Scholar] [CrossRef]
15. Qi, X. B., Huang, Y. J., Li, X. W., Hu, Z. H., Ying, J. W. et al. (2020). Mechanical properties of sea water sea sand coral concrete modified with different cement and fiber types. Journal of Renewable Materials, 8(8), 915–937. DOI 10.32604/jrm.2020.010991. [Google Scholar] [CrossRef]
16. Xiao, J. Z., Qiang, C. B., Nanni, A., Zhang, K. J. (2017). Use of sea-sand and seawater in concrete construction: Current status and future opportunities. Construction & Building Materials, 155(305), 1101–1111. DOI 10.1016/j.conbuildmat.2017.08.130. [Google Scholar] [CrossRef]
17. Huang, Y. J., He, X. J., Wang, Q., Sun, Y. D. (2018). Mechanical properties of sea sand recycled aggregate concrete under axial compression. Construction & Building Materials, 175(1), 55–63. DOI 10.1016/j.conbuildmat.2018.04.136. [Google Scholar] [CrossRef]
18. Dang, Q. V., Ogawa, Y., Kawai, K. (2018). Compressive strength, permeability and sorptivity of sea sand concrete containing supplementary cementitious materials. 8th International Conference of Asian Concrete Federation, vol. 2, pp. 214–220. Fuzhou, China. [Google Scholar]
19. Manikandan, R., Revathi, S. (2018). Behavioural study on treated sea sand as a fine aggregate in concrete. Journal of Advances in Civil Engineering, 4(2), 8–14. DOI 10.18831/djcivil.org/2018021002. [Google Scholar] [CrossRef]
20. Guo, M., Hu, B., Xing, F., Zhou, X. Q., Sun, M. et al. (2020). Characterization of the mechanical properties of eco-friendly concrete made with untreated sea sand and seawater based on statistical analysis. Construction and Building Materials, 234(7), 1–12. DOI 10.1016/j.conbuildmat.2019.117339. [Google Scholar] [CrossRef]
21. Wang, R., Zhang, Q., Li, Y. (2022). Deterioration of concrete under the coupling effects of freeze-thaw cycles and other actions: A review. Construction and Building Materials, 319(7), 1–19. DOI 10.1016/j.conbuildmat.2021.126045. [Google Scholar] [CrossRef]
22. Li, Y., Wang, R. J., Li, S. Y., Zhao, Y., Qin, Y. (2018). Resistance of recycled aggregate concrete containing low-and high-volume fly ash against the combined action of freeze-thaw cycles and sulfate attack. Construction and Building Materials, 166(4), 23–34. DOI 10.1016/j.conbuildmat.2018.01.084. [Google Scholar] [CrossRef]
23. Kakooei, S., Akil, H. M., Dolati, A., Rouhi, J. (2012). The corrosion investigation of rebar embedded in the fibers reinforced concrete. Construction and Building Materials, 35(6), 564–570. DOI 10.1016/j.conbuildmat.2012.04.051. [Google Scholar] [CrossRef]
24. Da, B., Yu, H., Ma, H., Wu, Z. Y. (2018). Reinforcement corrosion research based on the linear polarization resistance method for coral aggregate seawater concrete in a marine environment. Anti Corrosion Methods & Materials, 65(5), 458–470. DOI 10.1108/ACMM-03-2018-1911. [Google Scholar] [CrossRef]
25. Goffin, B., Banthia, N., Yonemitsu, N. (2020). Use of infrared thermal imaging to detect corrosion of epoxy coated and uncoated rebar in concrete. Construction and Building Materials, 263, 1–12. DOI 10.1016/j.conbuildmat.2020.120162. [Google Scholar] [CrossRef]
26. Wang, X. H., Chen, B., Gao, Y., Wang, J., Gao, L. (2015). Influence of external loading and loading type on corrosion behavior of RC beams with epoxy-coated reinforcements. Construction and Building Materials, 93(4), 746–765. DOI 10.1016/j.conbuildmat.2015.05.101. [Google Scholar] [CrossRef]
27. Calderon-Uriszar-Aldaca, I., Briz, E., Larrinaga, P., Garcia, H. (2018). Bonding strength of stainless steel rebars in concretes exposed to marine environments. Construction and Building Materials, 172, 125–133. DOI 10.1016/j.conbuildmat.2018.03.156. [Google Scholar] [CrossRef]
28. Cardoso, J. L., Pacheco, M. S., Araujo, A., Jose, R., Zehbour, P. (2018). Stainless steel rebar for marine environment: Study of galvanic corrosion with carbon steel rebars used in the same concrete structure. Corrosion Conference and Expo 2018, vol. 1, pp. 1–10. Phoenix, Arizona, USA. [Google Scholar]
29. Hossain, K. (2008). Bond characteristics of plain and deformed bars in lightweight pumice concrete. Construction & Building Materials, 22(7), 1491–1499. DOI 10.1016/j.conbuildmat.2007.03.025. [Google Scholar] [CrossRef]
30. Zhou, J., Chen, X., Chen, S. (2012). Effect of different environments on bond strength of glass fiber-reinforced polymer and steel reinforcing bars. KSCE Journal of Civil Engineering, 16(6), 994–1002. DOI 10.1007/s12205-012-1462-3. [Google Scholar] [CrossRef]
31. Almusallam, A. A., Al-Gahtani, A. S., Aziz, A. R., Rasheeduzzafar (1996). Effect of reinforcement corrosion on bond strength. Construction and Building Materials, 10(2), 123–129. DOI 10.1016/0950-0618(95)00077-1. [Google Scholar] [CrossRef]
32. Yang, S. T., Xu, J. J., Zang, C. H., Li, R., Yang, Q. B. et al. (2018). Mechanical properties of alkali-activated slag concrete mixed by seawater and sea sand. Construction and Building Materials, 196(9), 395–410. DOI 10.1016/j.conbuildmat.2018.11.113. [Google Scholar] [CrossRef]
33. Tran, Q. K., Ngo, T. T., Nguyen, D. L., Tran, N. T. (2020). Ultimate bond strength of steel bar embedded in sea sand concrete under different curing environments. 5th International Conference on Green Technology and Sustainable Development, pp. 98–102. Ho Chi Minh City, Vietnam. [Google Scholar]
34. Rabi, M., Cashell, K. A., Shamass, R., Desnerck, P. (2020). Bond behaviour of austenitic stainless steel reinforced concrete. Engineering Structures, 221(2), 1–13. DOI 10.1016/j.engstruct.2020.111027. [Google Scholar] [CrossRef]
35. Islam, K., Billah, A. M., Chowdhury, M., Ahmed, K. S. (2020). Exploratory study on bond behavior of plain and sand coated stainless steel rebars in concrete. Structures, 27(3), 2365–2378. DOI 10.1016/j.istruc.2020.07.039. [Google Scholar] [CrossRef]
36. Li, W., Li, J., Ren, X., Leung, C. K. Y., Xing, F. (2015). Coupling effect of concrete strength and bonding length on bond behaviors of fiber reinforced polymer-concrete interface. Journal of Reinforced Plastics and Composites, 34(5), 421–432. DOI 10.1177/0731684415573816. [Google Scholar] [CrossRef]
37. Huang, Y. J., Zhang, Y. J., Li, X. W., Ying, J. W. (2021). Bond of epoxy-coated steel bars to seawater sea sand recycled concrete. Structures, 30(305), 866–876. DOI 10.1016/j.istruc.2021.01.056. [Google Scholar] [CrossRef]
38. Bazli, M., Zhao, X. L., Bai, Y., Raman, R. K. S., Al-Saadi, S. (2019). Bond-slip behaviour between FRP tubes and seawater sea sand concrete. Engineering Structures, 197(1), 1–14. DOI 10.1016/j.engstruct.2019.109421. [Google Scholar] [CrossRef]
39. Ministry of Communications of the Peoples Republic of China, Metallic Materials-Tensile Testing-Part 1: Method of test at room temperature (2010). GB/T 228.1-2010. Beijing, China. [Google Scholar]
40. Veljkovic, A., Carvelli, V., Haffke, M. M., Pahn, M. (2017). Concrete cover effect on the bond of GFRP bar and concrete under static loading. Composites Part B: Engineering, 124(2), 40–53. DOI 10.1016/j.compositesb.2017.05.054. [Google Scholar] [CrossRef]
41. Dahllöf, I., Svensson, O., Torstensson, C. (1997). Optimising the determination of nitrate and phosphate in sea water with ion chromatography using experimental design. Journal of Chromatography A, 771(1–2), 163–168. DOI 10.1016/S0021-9673(97)00198-2. [Google Scholar] [CrossRef]
42. GB/T 50081-2002 (2002). Standard for Test Method of Mechanical Properties on Ordinary Concrete. Beijing, China: Ministry of Communications of the Peoples Republic of China. [Google Scholar]
43. JGJ 51-2002 (2002). Technical Specification for Lightweight Aggregate Concrete. Beijing, China: Ministry of Construction of the People’s Republic of China. [Google Scholar]
44. Huang, Y. J., Li, X. W., Lu, Y., Wang, H. C., Wang, Q. et al. (2019). Effect of mix component on the mechanical properties of coral concrete under axial compression. Construction and Building Materials, 223(10), 736–754. DOI 10.1016/j.conbuildmat.2019.07.015. [Google Scholar] [CrossRef]
45. ACI 440.3R-04 (2004). Guide Test Methods for Fiber-Reinforced Polymers (FRPs) for Reinforcing or Strengthening Concrete Structures. ACI Committee. [Google Scholar]
46. CSA S806-12 (2012). Design and Construction of Building Structures with Fibre-Reinforced Polymers. Mississauga, Canadian Standards Association. [Google Scholar]
47. Zhou, J. K., Chen, S. X., Chen, L. H. (2007). Experimental study on bond properties of GFRP bars in concrete. Composites Science and Engineering, (1), 16–18+53 (in Chinese). DOI 10.3969/j.issn.1003-0999.2007.01.005. [Google Scholar] [CrossRef]
48. Guo, Z. H. (2003). The principle of reinforced concrete. Beijing, China: Tsinghua University Press. [Google Scholar]
49. Tighiouart, B., Benmokrane, B., Gao, D. (1998). Investigation of bond in concrete member with fibre reinforced polymer (FRP) bars. Construction and Building Materials, 12(8), 453–462. DOI 10.1016/S0950-0618(98)00027-0. [Google Scholar] [CrossRef]
50. Baena, M., Lluís, T., Albert, T., Cristina, B. (2009). Experimental study of bond behaviour between concrete and FRP bars using a pull-out test. Composites Part B: Engineering, 40(8), 784–797. DOI 10.1016/j.compositesb.2009.07.003. [Google Scholar] [CrossRef]
51. Shang, H. S., Cui, F. K., Zhang, P., Zhao, T. J., Ren, G. S. (2017). Bond behavior of steel bar embedded in recycled coarse aggregate concrete under lateral compression load. Construction and Building Materials, 150(6), 529–537. DOI 10.1016/j.conbuildmat.2017.05.060. [Google Scholar] [CrossRef]
52. Zhou, Y., Ou, Y. C., Lee, G. C. (2017). Bond-slip responses of stainless reinforcing bars in grouted ducts. Engineering Structures, 141(11), 651–665. DOI 10.1016/j.engstruct.2017.03.049. [Google Scholar] [CrossRef]
53. Huang, Y. J., He, X. J., Sun, H, S., Sun, Y. D., Wang, Q. (2018). Effects of coral, recycled and natural coarse aggregates on the mechanical properties of concrete. Construction and Building Materials, 192(6), 330–347. DOI 10.1016/j.conbuildmat.2018.10.111. [Google Scholar] [CrossRef]
54. Qian, J. R., Fang, E. H., Li, D. S., Cai, P. L. (1995). Experimental study on seismic performance of volcanic slag concrete coupling beams. Building Structure, 25(4), 3–7+20–21. (in Chinese). DOI 10.19701/j.jzjg.1995.04.001. [Google Scholar] [CrossRef]
55. Bogas, J. A., Cunha, D. (2017). Non-structural lightweight concrete with volcanic scoria aggregates for lightweight fill in building’s floors. Construction & Building Materials, 135(1), 151–163. DOI 10.1016/j.conbuildmat.2016.12.213. [Google Scholar] [CrossRef]
56. Li, Q., Xiang, Q., Wang, J., Lei, J. (2020). Study of factors affecting bond behavior between stainless steel rebar and concrete. IOP Conference Series: Materials Science and Engineering, vol. 780, pp. 1–11. Chengdu, China. [Google Scholar]
57. Yin, S., Hu, C., Liang, X. (2020). Bonding properties of different kinds of FRP bars and steel bars with all-Coral aggregate seawater concrete. Journal of Materials in Civil Engineering, 32(10), 1–12. DOI 10.1061/(ASCE)MT.1943-5533.0003378. [Google Scholar] [CrossRef]
58. Pauletta, M., Rovere, N., Randl, N., Russo, G. (2020). Bond-slip behavior between stainless steel rebars and concrete. Materials, 13(4), 1–17. DOI 10.3390/ma13040979. [Google Scholar] [CrossRef]
59. Xiao, L. G., Li, G. Z. (2018). Basalt fiber for volcanic slag lightweight aggregate concrete research on the impact of performance. IOP Conference Series: Earth and Environmental Science, vol. 128, pp. 1–5. Beijing, China. [Google Scholar]
60. Uygunoğlu, T., Brostow, W., Gencel, O., Topçu, I. B. (2013). Bond strength of polymer lightweight aggregate concrete. Polymer Composites, 34(12), 2125–2132. DOI 10.1002/pc.22621. [Google Scholar] [CrossRef]
61. Wu, Y. F., Zhao, X. M. (2013). Unified bond stress-slip model for reinforced concrete. Journal of Structural Engineering, 139(11), 1951–1962. DOI 10.1061/(ASCE)ST.1943-541X.0000747. [Google Scholar] [CrossRef]
62. Kim, Y., Sim, J., Park, C. (2012). Mechanical properties of recycled aggregate concrete with deformed steel re-bar. Journal of Marine Science and Technology, 20(3), 274–280. DOI 10.51400/2709-6998.1804. [Google Scholar] [CrossRef]
63. Wang, B., Li, X. Z., Ji, X. Y. (1998). Study on bonding and anchoring properties of pumice concrete and deformed steel bar. Journal of Harbin University of Civil Engineering and Architecture, 31(6), 30–37 (in Chinese). [Google Scholar]
64. Yang, S. T., Yang, C., Huang, M. L., Liu, Y., Jiang, J. T. et al. (2018). Study on bond performance between FRP bars and seawater coral aggregate concrete. Construction and Building Materials, 173(3), 272–288. DOI 10.1016/j.conbuildmat.2018.04.015. [Google Scholar] [CrossRef]
65. Harajli, M., Hamad, B., Karam, K. (2002). Bond-slip response of reinforcing bars embedded in plain and fiber concrete. Journal of Materials in Civil Engineering, 14(6), 503–511. DOI 10.1061/(ASCE)0899-1561(2002)14:6(503). [Google Scholar] [CrossRef]
66. Harajli, M. H., Hamad, B. S., Rteil, A. A. (2004). Effect of confinement on bond strength between steel bars and concrete. ACI Structural Journal, 101(5), 595–603. DOI 10.14359/13381. [Google Scholar] [CrossRef]