| Journal of Renewable Materials |
DOI: 10.32604/jrm.2023.021073
ARTICLE
Study on Sustained-Release Pesticides Blended with Fosthiazate-Stearic Acid/Expanded Perlite
1College of Chemistry and Chemical Engineering, Zhongkai University of Agriculture and Engineering, Guangzhou, 510225, China
2College of Light Industry and Food Science, Zhongkai University of Agriculture and Engineering, Guangzhou, 510225, China
*Corresponding Authors: Jie Yan. Email: yanjie0001@126.com; Qiaoguang Li. Email: liqiaoguang8799@163.com
Received: 25 December 2021; Accepted: 01 March 2022
Abstract: The low utilization rate of pesticides makes the migration of pesticides in water and soil, which brings great harm to the ecosystem. The development of pesticide carriers with good drug loading capacity and release control ability is an effective method to realize effective utilization of pesticides and reduce pesticide losses. In this work, fosthiazate-stearic acid/expanded perlite sustained-release particles were successfully prepared by vacuum impregnation using expanded perlite (EP) as carrier, fosthiazate (FOS) as model pesticide and stearic acid (SA) as hydrophobic matrix. The structure and morphology of the samples were studied by BET, FT-IR, TGA, XRD, DSC and SEM. The effects of different mass ratios of FOS to SA on loading capacity and release rate at 24 h were investigated. The sustained release behavior of FOS-SA/EP at different temperatures and pH values was investigated by static dialysis bag method. The results showed that FOS and SA were adsorbed in EP pores by physical interaction. With the mass ratios of FOS to SA decreasing from 7:3 to 3:7, the 24 h release rate of FOS-SA/EP decreased from 18.77% to 8.05%, and the drug loading decreased from 461.32 to 130.99 mg/g. FOS-SA/EP showed obvious temperature response at 25°C, 30°C and 35°C, the cumulative release rate (CRR) of 200 h were 33.38%, 41.50% and 51.17%, respectively. When pH = 5, the CRR of FOS was higher than that of pH = 7, and the CRR of FOS for 200 h were 49.01% and 30.12%, respectively. At different temperatures and pH = 5, the release mechanism of FOS-SA/EP belongs to the Fickian diffusion mechanism; When pH = 7, the diffusion mechanism is dominant, and the dissolution mechanism is complementary.
Keywords: Expanded perlite; fosthiazate; stearic acid; sustained release; release kinetics
Nomenclature
| FOS | fosthiazate |
| EP | expanded perlite |
| SA | stearic acid |
| CRR | cumulative release rate |
Pesticides play an irreplaceable role in agriculture and contribute greatly to the yield and quality of crops [1]. The low utilization rate of pesticides leads to large loss of pesticide active ingredients, as well as soil and water pollution. In recent years, slow and controlled release technology has been widely used in medicine [2], paint [3], cosmetics [4], environmental engineering [5] and other industries and fields. In the field of pesticide dosage form processing, slow and controlled release technology is also an ideal choice to improve the effective utilization rate of pesticides and reduce environmental pollution, and has become an important direction of the development of new pesticide dosage forms [6,7].
Adsorption type sustained release agent is the original drug adsorption in inorganic, organic and other adsorbent carriers, as storage, such as attapulgite [8], bentonite [9], sepiolite [10], diatomite [11], zeolite [12], resin [13], etc. The preparation process of adsorbent sustained-release agent is simple, short time and low cost. Chen et al. [14] used sodium montmorillonite (Na–Mt), zinc nitrate ion and sodium alginate (ALG) to prepare ALG-Zn-Mt, which has high sustained release efficiency and is sensitive to pH. The drug loading of the system for triazolone is 17.75 mg/g. Xu et al. [15] prepared chitosan-grafted polyacrylic acid/attapulgite (CTS-g-PAA/ATP) composite adsorbent using chitosan (CTS), acrylic acid (AA) and attapulgite (ATP) materials. The results showed that the theoretical maximum drug loading of CTS-g-PAA/ATP at 30°C, 35°C and 40°C were 57.8, 54.3 and 51.2 mg/g, respectively. All these studies provide extensive useful exploration for the preparation and application of sustained release pesticide, however, their loading needs to be further improved.
Therefore, it is necessary to prepare loading materials with large drug loading, good structure and slow-release performance [16]. The expanded perlite (EP) used in this sustained-release pesticide is formed from the high-temperature transformation of the mineral perlite. Perlite is a natural, common, non-toxic and cheap raw material. EP has the characteristics of lightweight, thermal stability and chemical inertia [17]. Compared with other common synthetic zeolite, nano clay, amorphous silicon and so on, EP has a large load, and has the natural abundance and economic feasibility, so it will hopefully replace other synthetic adsorbents. Furthermore, EP can be used to prepare loading materials, such as sustained-release pesticides, bactericides, antibacterial drugs and so on. Mahkam et al. [18] prepared methacrylic acid (MAA)/perlite composite (APC) via sol-gel route and studied the influence of 3-(trimethoxysilyl) propyl methacrylate ratio on its drug release properties. The results showed that the release rate of 5-aminosalicylic acid in the buffer decreased with the increase of the content of the coupling agent 3-(trimethoxy-methylsilyl-propyl methacrylate) in the composite. Using the cellular structure of EP, Rachel et al. [19] developed a sustained-release biocide system, involving an anchored quaternary ammonium salt (AQAS) embedded in EP substrate. The results showed that the honeycomb cellular microstructure of EP enables the adsorption and accumulation of AQAS monomeric species from methanol solution and acts as a substrate for the formation of oligomeric species after curing, which slowed down the dissolution rate of AQAS, so that AQAS could be released continuously for a long time. Finally, EP can also be used as a soil auxiliary medium for planting tomato, pepper and other crops [20,21]. Therefore, we believe that EP has sufficient potential as a sustained-release pesticide carrier.
Fosthiazate [22] (FOS) is one of the main non-fumigating nematocides against root knot nematodes in vegetables. It is widely used at home and abroad because it is easier to use than fumigating nematocides [23,24]. The method currently used is to apply the FOS to the soil in a single full dose. To achieve the desired control effect, the retention period of nematocides needs to be at least 6–8 weeks. At present, the main dosage form of FOS are granules, followed by emulsion and aqueous emulsion. The effective content of common FOS granules in the market is 10% and the sustained release time is short. Oil and water emulsions have short sustained release time and need to use organic solvents, which will cause secondary pollution to the environment. Therefore, in order to improve the efficacy of pesticides, it is necessary to prepare pesticide preparations with long sustained release period and environmental friendliness.
In this study, in order to improve the load of FOS by EP and prolong the sustained release time of FOS, FOS-SA/EP sustained release agent was prepared using FOS as model pesticide and stearic acid (SA) as hydrophobic matrix by vacuum impregnation method. The structure and morphology of the samples were studied by BET, FT-IR, TGA, XRD, DSC and SEM. The sustained release behavior of the particles at different temperatures and pH values was studied by static dialysis bag method and the responsive release kinetics of FOS to temperature and pH stimulation were studied.
Stearic acid (analytical grade, Tianjin Fuyu Fine Chemicals Co., Ltd., China), methanol (chromatographic pure), fosthiazate (99.7%, Ishihara Industry Co., Ltd., China), pH buffer standard solution (Guangzhou Hewei Pharmaceutical Technology Co., Ltd., China), expanded perlite (Size 5 to 7 mm, Guangzhou Fengzexuan garden materials wholesale).
2.2 HPLC Test Conditions of FOS
The HPLC column was COSMOCORE 2.6 μm C18 (4.6 mm × 100 mm, 5 μm) and the mobile phase was methanol/water (70:30 v/v). The injection volume was 5 μL with a flow rate of 1.0 mL/min, and the oven temperature was maintained at 30°C. The UV detection wavelength was 220 nm [25].
2.3 Preparation of Composite FOS-SA/EP
Composite FOS-SA/EP was prepared by vacuum impregnation method [26]. Firstly, molten FOS-SA mixture was prepared with mass ratios of 7:3, 6:4, 5:5, 4:6, 3:7 and 0:10, respectively. Then the mixture and EP were placed in a round-bottom flask at a mass ratios of 10:1 and stirred evenly at 70°C. Third, the round bottom flask is connected to circulating water vacuum pump through the pipeline with a valve. When the vacuum degree of the pump reaches 0.09 MPa, vacuumize continuously for 1 min. Then closed the valve, soaked at 70°C for 1 h. Finally, the sample was thermally filtered out and named FOS-SA/EP-1, FOS-SA/EP-2, FOS-SA/EP-3, FOS-SA/EP-4, FOS-SA/EP-5 and SA/EP.
2.4 Characterization of Composite FOS-SA/EP
BET: The specific surface area of EP was measured by automatic surface area and porosity analyzer(ASAP 2460, Mike Instruments Inc., USA). The sample was degassed in vacuum at 200°C for 8 h, and the N2 adsorption and desorption isotherms were tested in liquid nitrogen. The BET method was used to calculate the specific surface area of the samples.
FTIR: Fourier transform infrared spectra of FOS, SA, EP and FOS-SA/EP-3 were recorded. Each sample was compressed with KBr powder into a pellet and scanned in the spectral range of 450∼4000 cm–1 (Spectrum 100, Perkin Elmer Inc., USA).
XRD: The structure and crystal form of the samples were measured by X-ray diffractometer (SMARTLAB 9KW, Rigaku, Japan). Cu-target rays were used in the measurement, and the scanning range was 2θ = 10∼80°, and the scanning speed was 5°/min.
TGA: Thermal stabilities of the samples were determined using a thermo gravimetric analyzer (TGA2, Mettler Toledo, USA), under nitrogen atmosphere of 50 mL/min at a heating rate of 10 °C/min from 40°C to 600°C.
DSC: Thermal analysis of samples was conducted from 20°C to 100°C using a differential scanning calorimeter (Q200, TA Instruments, USA) at a heating rate of 10 °C/min under nitrogen atmosphere of 20 mL/min.
SEM: The FOS-SA/EP sample was placed on a copper sheet, dried using high-power lamp, and the surface of the solid sample was sputter-coated with gold. The images of the samples were acquired by scanning electron microscopy (EVO18, ZEISS, Germany) at an accelerating voltage of 15 kV under nitrogen gas atmosphere, to observe their microstructures.
2.5 Determination of Drug Loading
Accurately weighed 0.500 g of FOS-SA/EP powder into a 100 ml brown volumetric flask and treated in ultrasonic cleaner (JP-020, Skymen, China) for 30 min to release FOS. Removed 1 mL of the solution and diluted it with methanol to 10 mL, and then determined the mass concentration of FOS (mg/L) by HPLC(Waters, USA). The concentration of FOS was calculated using a calibration working curve A = 7238.4 C + 423.66 (R2 = 0.9999), where A is the peak area and C (mg/L) is the injection concentration. Each sample was tested three times and the average value was calculated.
2.6 Evaluation of Sustained-Release Performance
A certain mass (M1, g) of drug-loaded EP was weighed and put into a dialysis bag. The bag was placed in brown conical flask containing 100 mL of water or buffer solution. At certain intervals (t), transfered 1.00 mL of the sample solution to a brown volumetric flask and made up to 10 mL with methanol. At the same time, 1.00 mL of the original sustained-release medium was added to the conical flask [27]. The cumulative release rate (Mt/M∞, CRR, %) of FOS was calculated using Eq. (1)
where, i is sampling times; Ci is the concentration of FOS at different time intervals, mg/L; M1 is the mass of the adsorbed sample, g; LC is the drug loading, mg/g.
The N2 adsorption-desorption isotherms of EP are shown in Fig. 1. It can be seen from the figure that the nitrogen adsorption-desorption isotherm of EP is a typical type IV isotherm with obvious type H3 hysteresis ring, indicating that EP has slit holes formed by the extrusion of laminar particles. This is mainly related to the production and processing method of EP particles. EP is usually a porous material made of perlite under the condition of rapid heating, which vaporizes the bound water and rapidly expands the volume. Most of them are irregular flaky structures. The EP has a specific surface area of 3.4190 m2/g, a pore diameter of 86.358 Å and a pore volume of 0.007381 cm³/g. It is not much different from what is recorded in the literature [28].
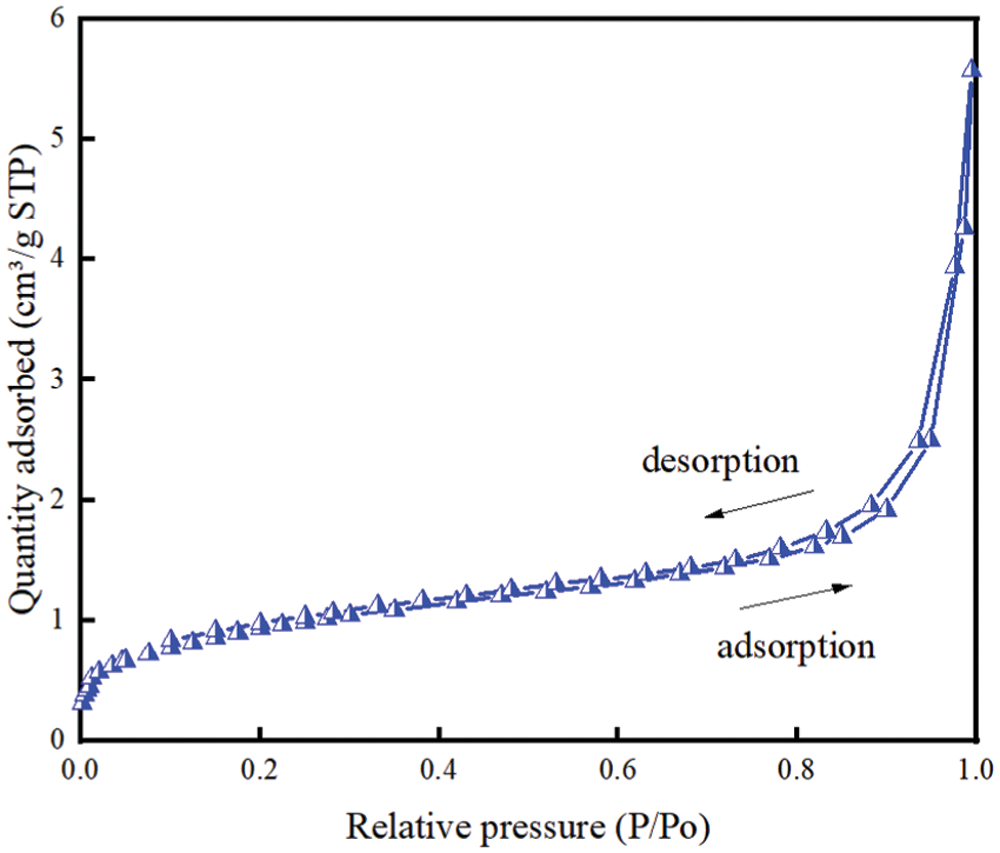
Figure 1: N2 adsorption and desorption isotherms for EP at 77 K
3.2 FT-IR Analysis of Composite FOS-SA/EP
The FT-IR spectra of SA, FOS, EP, FOS-SA and FOS-SA/EP-3 are shown in Fig. 2. The FTIR spectrum of pure SA showed peaks at 2918 and 2849 cm−1 (C−H stretching), 1689 cm−1(C=O stretching), 1467 cm−1 (C−H bending), 1300 and 1100 cm−1 (C−O stretching), and 936, 723, and 685 cm−1 (C−H bending) [29]. The main absorption bands of EP [30] were 3485, 1633, 1024, 789 and 469 cm−1. The peaks at 3485 and 1633 cm−1 were respectively assigned to the stretching and bending modes of the hydroxyl groups which were attached to the surface of EP (mainly Si–OH groups) and the adsorbed water molecules. The peaks positioned at 1024 and 789 cm−1 were ascribed to Si–O stretching vibrations of Si–O–Si and Si–O–Al, respectively. O–Si–O bending vibration was observed at about 469 cm−1. On the FOS spectrum, the characteristic peaks of FOS were 2968 cm−1 (C−H stretching), 1700 cm−1 (C=O stretching), 1250 cm−1 (P=O stretching) and 1020 cm−1 (P-O-C asymmetric stretching), respectively. Compared with FOS-SA, there were no new characteristic peaks appearing in the spectrum of FOS-SA/EP-3, indicating that there is no chemical interaction between FOS-SA and EP. The infrared spectra of FOS-SA/EP-3 showed the characteristic peaks of FOS at 2959, 1700, 1250 and 1020 cm−1, respectively. It can be determined that FOS has been loaded in EP.
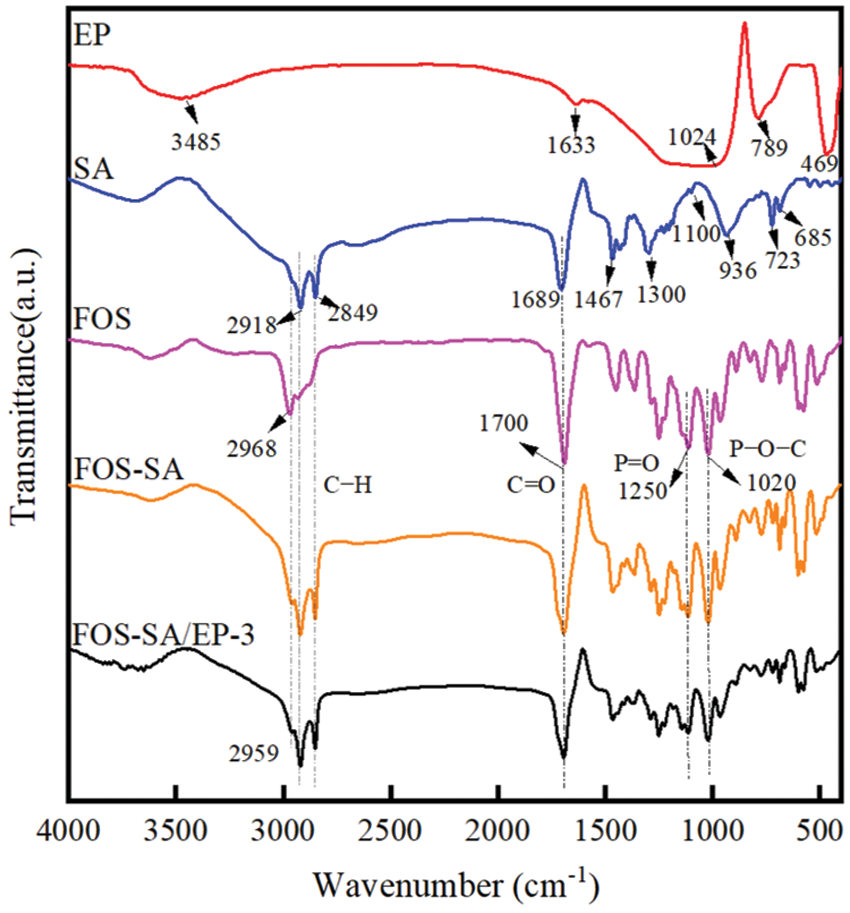
Figure 2: FT-IR of FOS, SA, EP and FOS-SA/EP
3.3 TG Analysis of Composite FOS-SA/EP
Figs. 3a and 3b show the TG and DTG curves of FOS, SA and different FOS-SA/EP samples, respectively. It was evident that FOS and SA had one mass loss stage, the decomposition temperature of FOS is 140∼250°C, and the mass loss is 66.42%; The decomposition temperature of SA is 160∼280°C and the mass loss is 99.6%, indicating that SA can be completely decomposed at this temperature [31]. The thermogravimetric curves of different proportions of FOS-SA/EP showed two stages. The stage I is 140∼240°C, mainly due to the decomposition of FOS. The stage II is 240∼290°C, mainly the decomposition of SA. As can be seen from the Fig. 3b, the decomposition temperature of FOS-SA/EP sample is higher than that of pure FOS. With the increase of SA content in FOS-SA/EP system, the decomposition temperature of FOS gradually moved to the right. This indicated that the addition of SA made FOS-SA/EP system have better thermal stability and higher decomposition temperature.
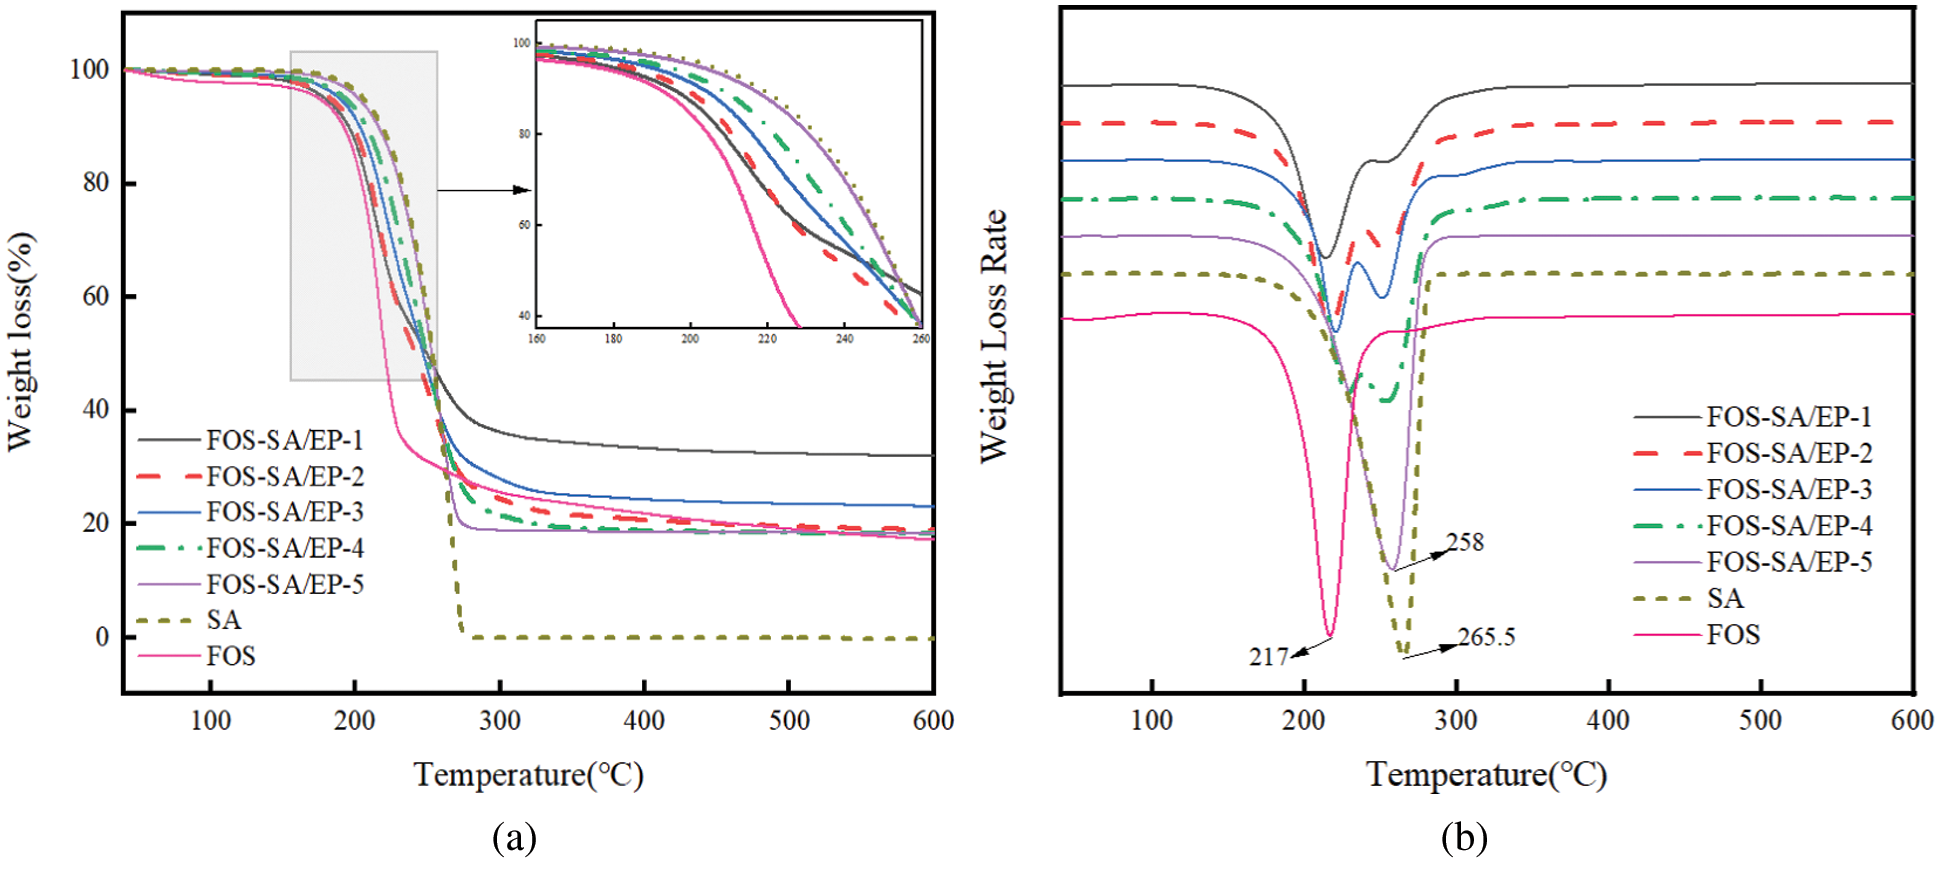
Figure 3: (a) TGA and (b) DTG curves of FOS, SA and different FOS-SA/EP samples
3.4 XRD Analysis of Composite FOS-SA/EP
The XRD patterns of EP, SA, SA/EP and different FOS-SA/EP samples are shown in Fig. 4. In the XRD pattern of SA, the characteristic peaks appear at 21.64° and 24° [32]. EP had no obvious and sharp diffraction peaks, indicating that it was an amorphous material with an amorphous structure [28]. Due to the relatively low diffraction intensity of EP, it was not observed in the XRD pattern of the composite, but only two characteristic peaks of SA were observed. In addition, no new diffraction peaks were found in the XRD patterns of the composites, indicating that no new substances were formed after mixing SA and EP, SA and FOS, and FOS-SA and EP, which further proved that there was no chemical reaction between them. In the FOS-SA/EP composite, diffraction peaks with different intensities are displayed. In addition, with the increase of SA content, the peak intensity of the FOS-SA/EP samples became stronger, which means that the crystallinity of the sample became higher [31].
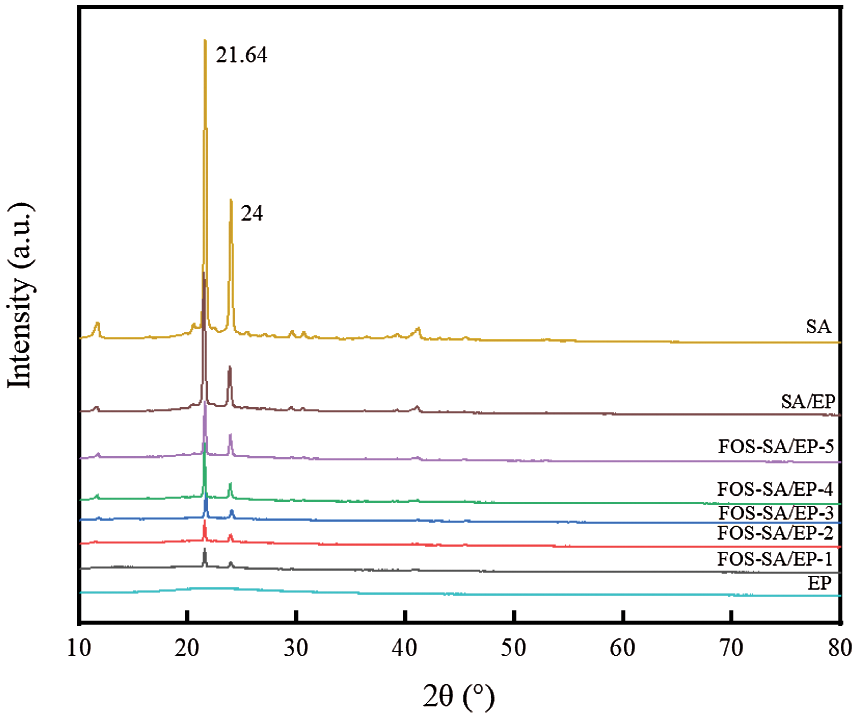
Figure 4: XRD patterns of EP, SA, SA/EP and different FOS-SA/EP samples
3.5 DSC Analysis of Composite FOS-SA/EP
Fig. 5 shows the DSC curves of SA and different FOS-SA/EP samples. The melting temperature of single component and composite system was further studied. At the same heating rate, the melting peak of SA appeared at 59.06°C. The melting temperatures of FOS-SA/EP-1, FOS-SA/EP-2, FOS-SA/EP-3, FOS-SA/EP-4 and FOS-SA/EP-5 were 44.19°C, 46.52°C, 49.44°C, 51.74°C and 53.06°C, respectively. The results in Table 1 show that with the addition of SA, the Tm and ΔHm of the samples increased gradually. There was no melting peak of FOS in DSC. With the increase of FOS content, the crystallinity and melting point of FOS-SA/EP system decreased. This is because the addition of FOS destroys the crystallization process of SA, destroys the regularity of SA molecular structure and decreases the melting point. With the increase of crystallinity, the molecules in the FOS-SA/EP system were more closely aligned and the permeability resistance was stronger.
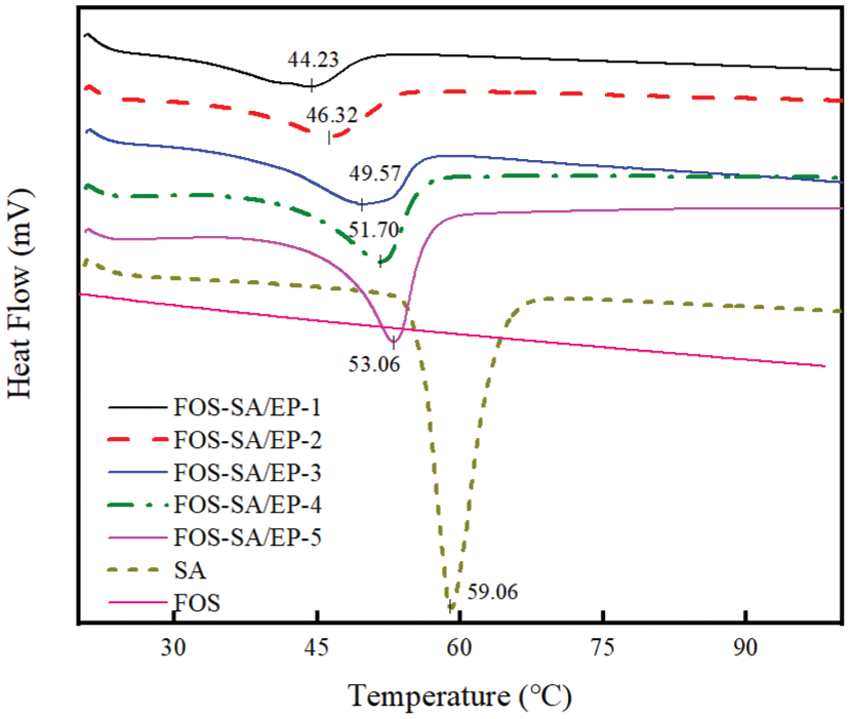
Figure 5: DSC curves of FOS, SA and different FOS-SA/EP samples
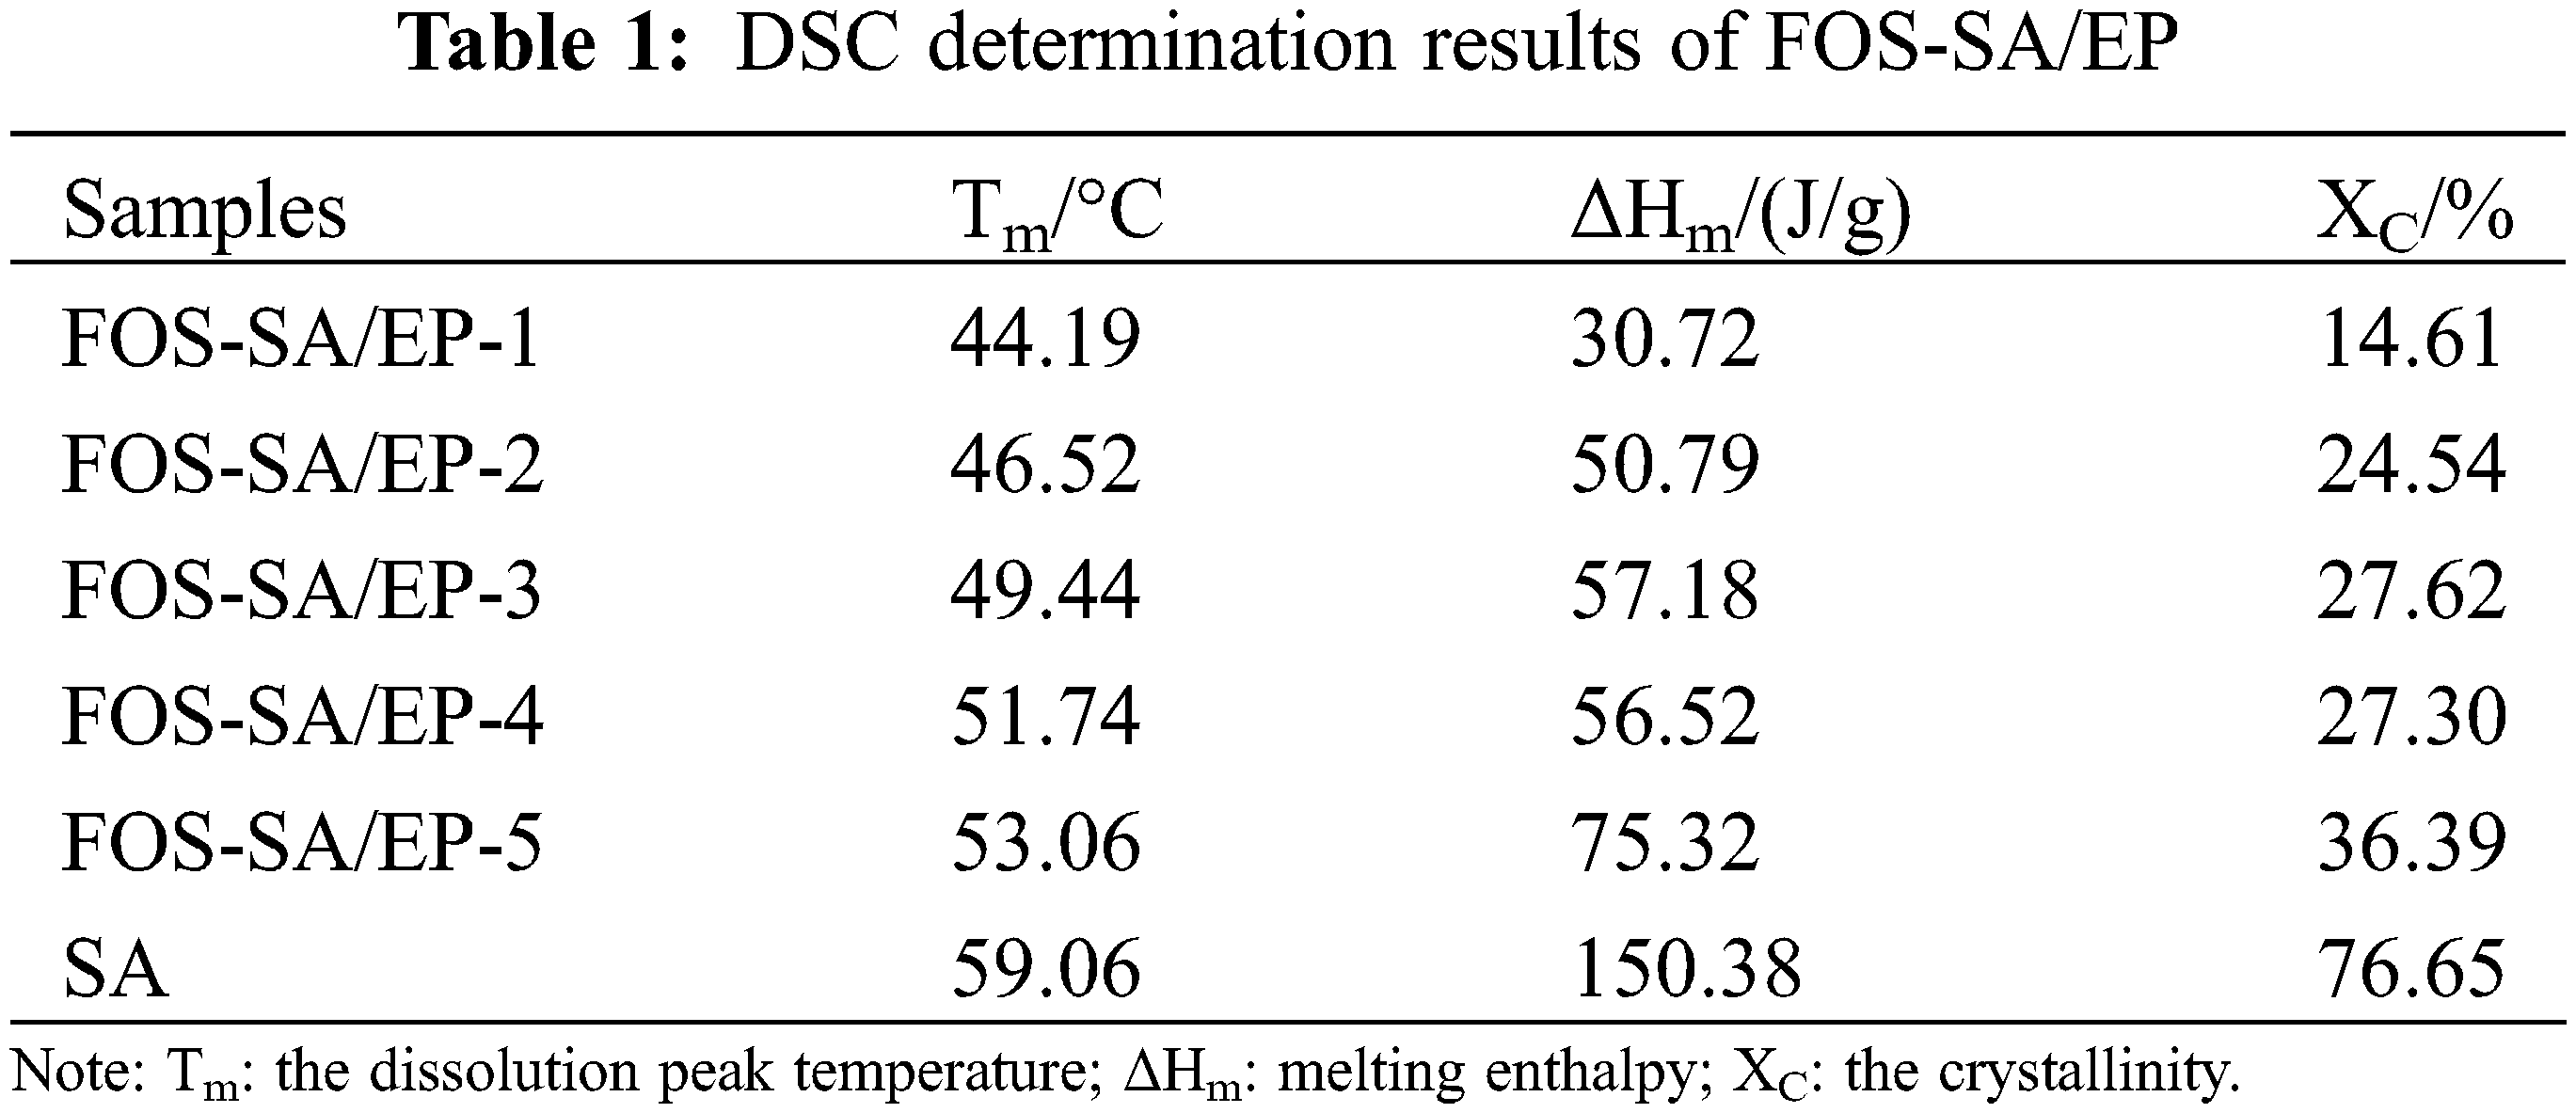
3.6 SEM Analysis of Composite FOS-SA/EP
Figs. 6a–6e show the SEM images of EP, SA/EP and FOS-SA/EP-3. Fig. 6a describes the SEM micrographs of EP. EP does not show a specific shape or crystal structure, but looked like a thin sheet. The interior of EP material had a well-defined polygonal honeycomb structure (sometimes referred to as “popcorn” structure) surrounded by a relatively smooth outer surface (sometimes referred to as “eggshell”) [17]. These characteristics were considered to be caused by the high internal pressure generated by the water vapor in the original perlite minerals at the EP transition temperature (850°C). The porous structure of EP made it a good material for absorbing molten SA and FOS-SA.
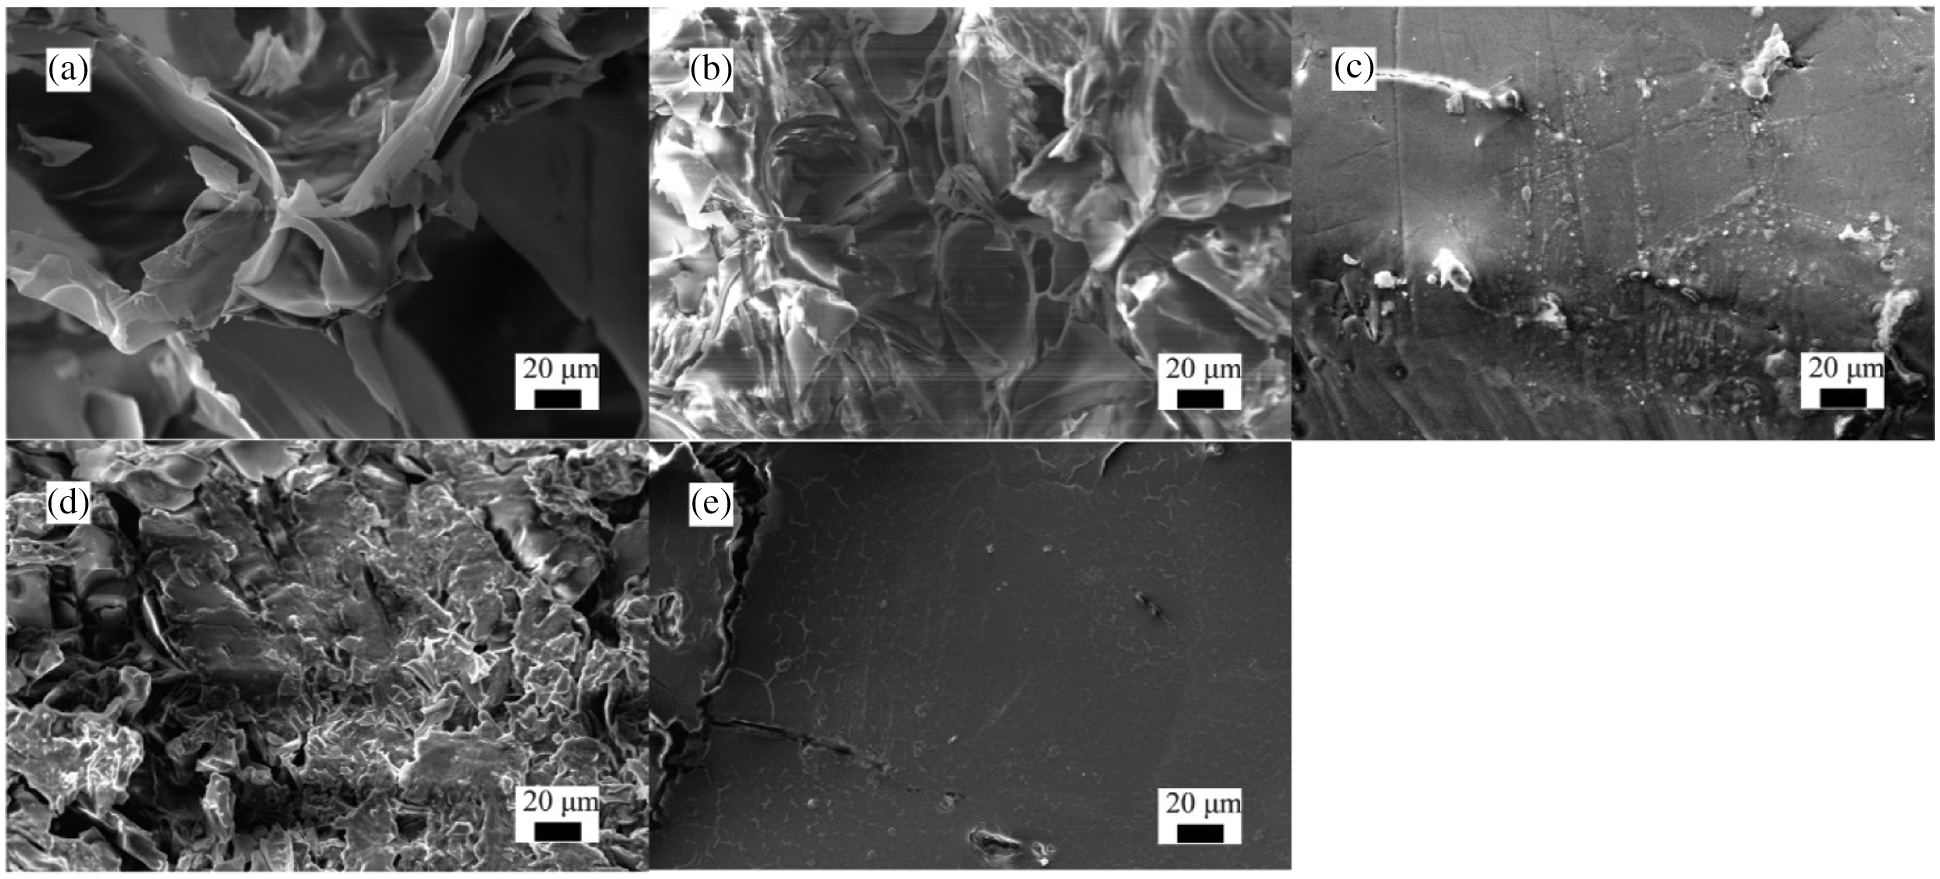
Figure 6: SEM images of (a) EP, (b) Sectional view of SA/EP, (c) Surface map of SA/EP, (d) Sectional view of FOS-SA/EP-3, (e) Surface map of FOS-SA/EP-3
Fig. 6b shows the section of the SA/EP particles. It can be observed from Fig. 6b that the edge of EP became smooth, the honeycomb structure was not obvious, and the pores became smaller, indicating that SA was uniformly distributed in the pores of EP. The surface of SA/EP is shown in Fig. 6c. It can be seen from Fig. 6c that the surface of EP loaded with SA became smooth and flat, indicated that SA was uniformly coated on the surface of EP, and the holes on the surface of EP were closed.
Fig. 6d reveals the section morphology of FOS-SA/EP-3 particles. The cross section of FOS-SA/EP-3 was similar to Fig. 6b, the edges were smooth, and the sheet structure was not obvious, which indicating that FOS-SA has been loaded in the pores of EP. Fig. 6e shows the surface of the FOS-SA/EP-3 particles. The surface of FOS-SA/EP-3 was relatively smooth, the honeycomb structure was not visible, and no pores appeared. This means that water molecules need to dissolve the FOS on the surface and generate holes before they can enter the interior of the EP to dissolve the internal drug and take it out. Therefore, FOS-SA/EP-3 has a certain sustained release ability.
3.7 Effect of Mass Ratios of FOS to SA on Drug Loading and 24 h Release Rate
Fig. 7 examines the drug loading and 24 h release rate of FOS in FOS-SA/EP at different ratios of FOS to SA. It was speculated that the addition of hydrophobic inclusions can act as additional physical barriers to slow down drug release and delay water infiltration and drug diffusion [33]. As expected, with the mass ratios of FOS to SA decreasing from 7:3 to 3:7, the 24 h release rate of FOS decreased from 18.77% to 8.05%, and the absorption capacity of FOS decreased from 461.32 to 130.99 mg/g. The results showed that the 24 h release rate and drug loading of FOS in FOS-SA/EP gradually decreased with the increase of SA. One of the reasons for this results may be that SA plays a hydrophobic role in FOS-SA/EP, and the increase of SA will reduce the contact area between water molecules and effective drugs, thus slowing down the drug release rate and playing a slow-release role. Another reason may be that the internal space of EP is limited. As the amount of SA increases, the drug loading will decrease, resulting in slow release rate. Fig. 6 shows that the drug loading and 24 h release of different FOS-SA ratios change regularly. In practical production and application, different FOS-SA ratios can be selected according to the demand. FOS-SA/EP-3 (FOS:SA = 5:5) was selected for the experiment below.
Figure 7: Drug loading and 24 h release rate of different FOS-SA/EP samples
3.8 Effect of Temperature on Sustained Release Performance
Fig. 8 shows the drug release curves of FOS-SA/EP at different temperatures. The drug release rate was 35°C > 30°C > 25°C. With the increase of temperature, the release rate of FOS-SA/EP increased, and the sustained release effect became worse. The increase of temperature, on the one hand, increases the solubility of FOS, and on the other hand, accelerates the diffusion rate of FOS, leading to easier release of drugs into sustained-release media. The release rate was fast in the first 24 h, and then gradually slowed down, and the CCR were 17.04%, 22.94% and 30.57% at 25°C, 30°C and 35°C for 24 h, respectively. After 200 h of continuous release, the CCR were 33.38%, 41.50% and 51.17%, respectively. Since then, the release is very slow. FOS-SA is loaded inside EP through physical capillary action without chemical reaction. Theoretically, FOS will eventually be released completely from EP.
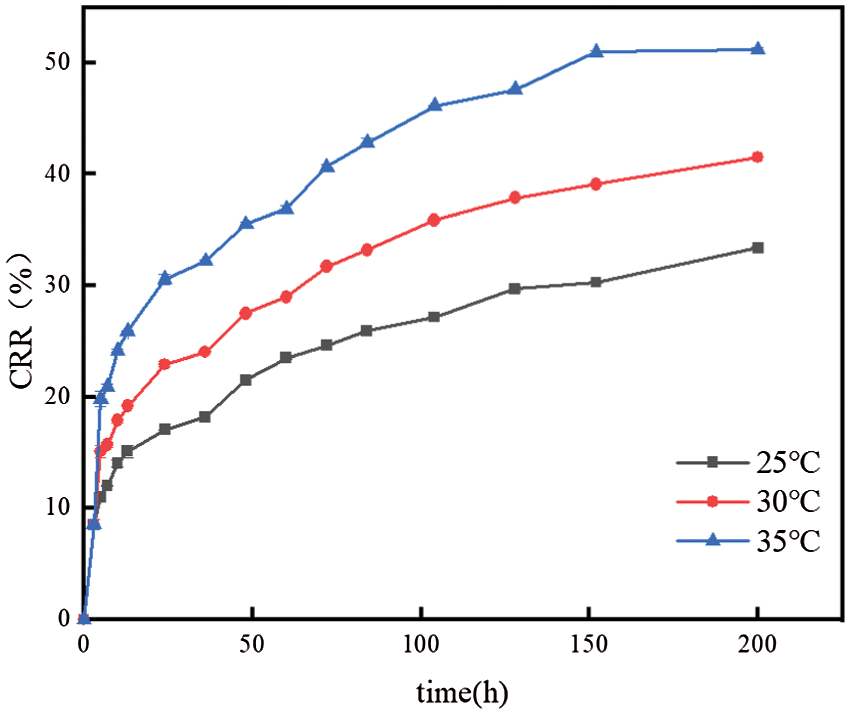
Figure 8: Effect of temperatures on sustained release performance of FOS
3.9 Effect of pH Value on Sustained Release Performance
According to the literature [34], the half-life of FOS in soil with pH > 7 is only 14.1∼20.7 d, which was easy to decompose in alkaline environment. Therefore, the paper only carried out experiments in neutral and acidic environment. As can be seen from Fig. 9, the release rate was pH = 5 > pH = 7. After 200 h, the CRR were 49.01% and 30.12%, respectively. Under acidic conditions, the drug release rate is relatively fast, indicating that the FOS-SA/EP sustained-release system was acid-responsive.
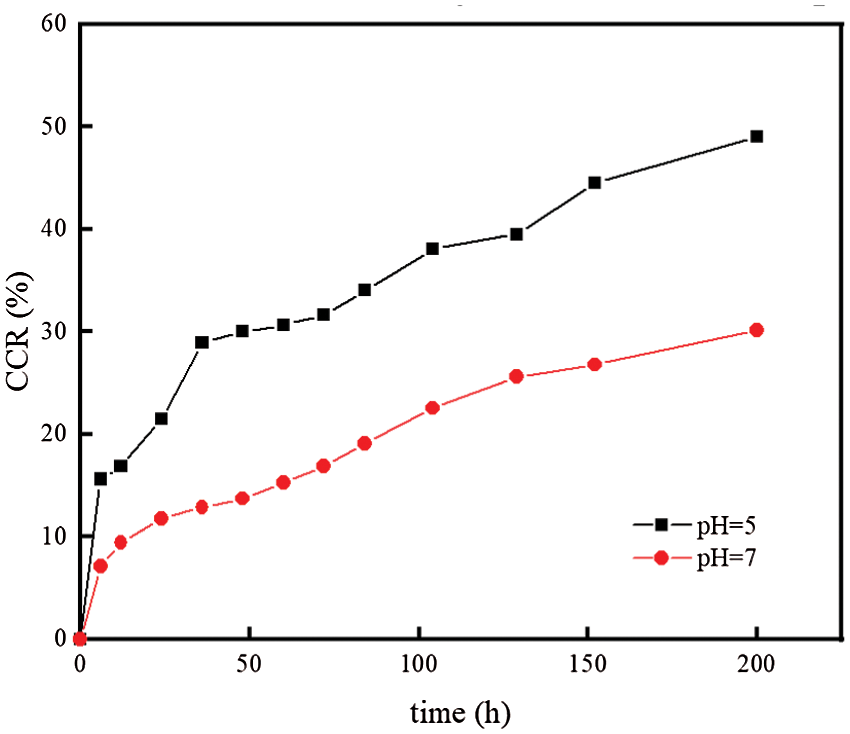
Figure 9: Effect of pH on sustained release performance of FOS
The release mechanisms of FOS from FOS-SA/EP at 25°C, 30°C and 35°C were studied. The Zero-order, First-order, Higuchi and Korsmeyer-Peppas models [35] were used to fit the release curve data, and the results were shown in Table 2 and Fig. 10. When the temperatures were 25°C, 30°C and 35°C, the sustained release data were consistent with the Korsmeyer-Peppas model, and the regression coefficients (R2) were 0.9958, 0.9901 and 0.9751, respectively. In the Korsmeyer-Peppas model, n was the release index. When n ≤ 0.45, drug release corresponds to Fickian diffusion mechanism [36]. When the temperature of the sustained-release medium is 25°C, 30°C and 35°C, its release index n is 0.3070, 0.3055 and 0.2932, respectively. All satisfy n ≤ 0.45, indicating that the drug release is carried out by the Fickian mechanism, which means the release process slower and longer [37]. Based on the above results, the release process of FOS in particles can be divided into two stages: (1) In the initial stage, sudden release. When the water-soluble medium moistens the particles, the free drug ( FOS ) in the outer layer is rapidly dissolved. (2) After the outer FOS dissolves in water, holes are generated on the particle surface, and water enters the inside of the particle. The bound FOS molecules are dissolved and migrated. Due to the long diffusion path, the release is slow [38].
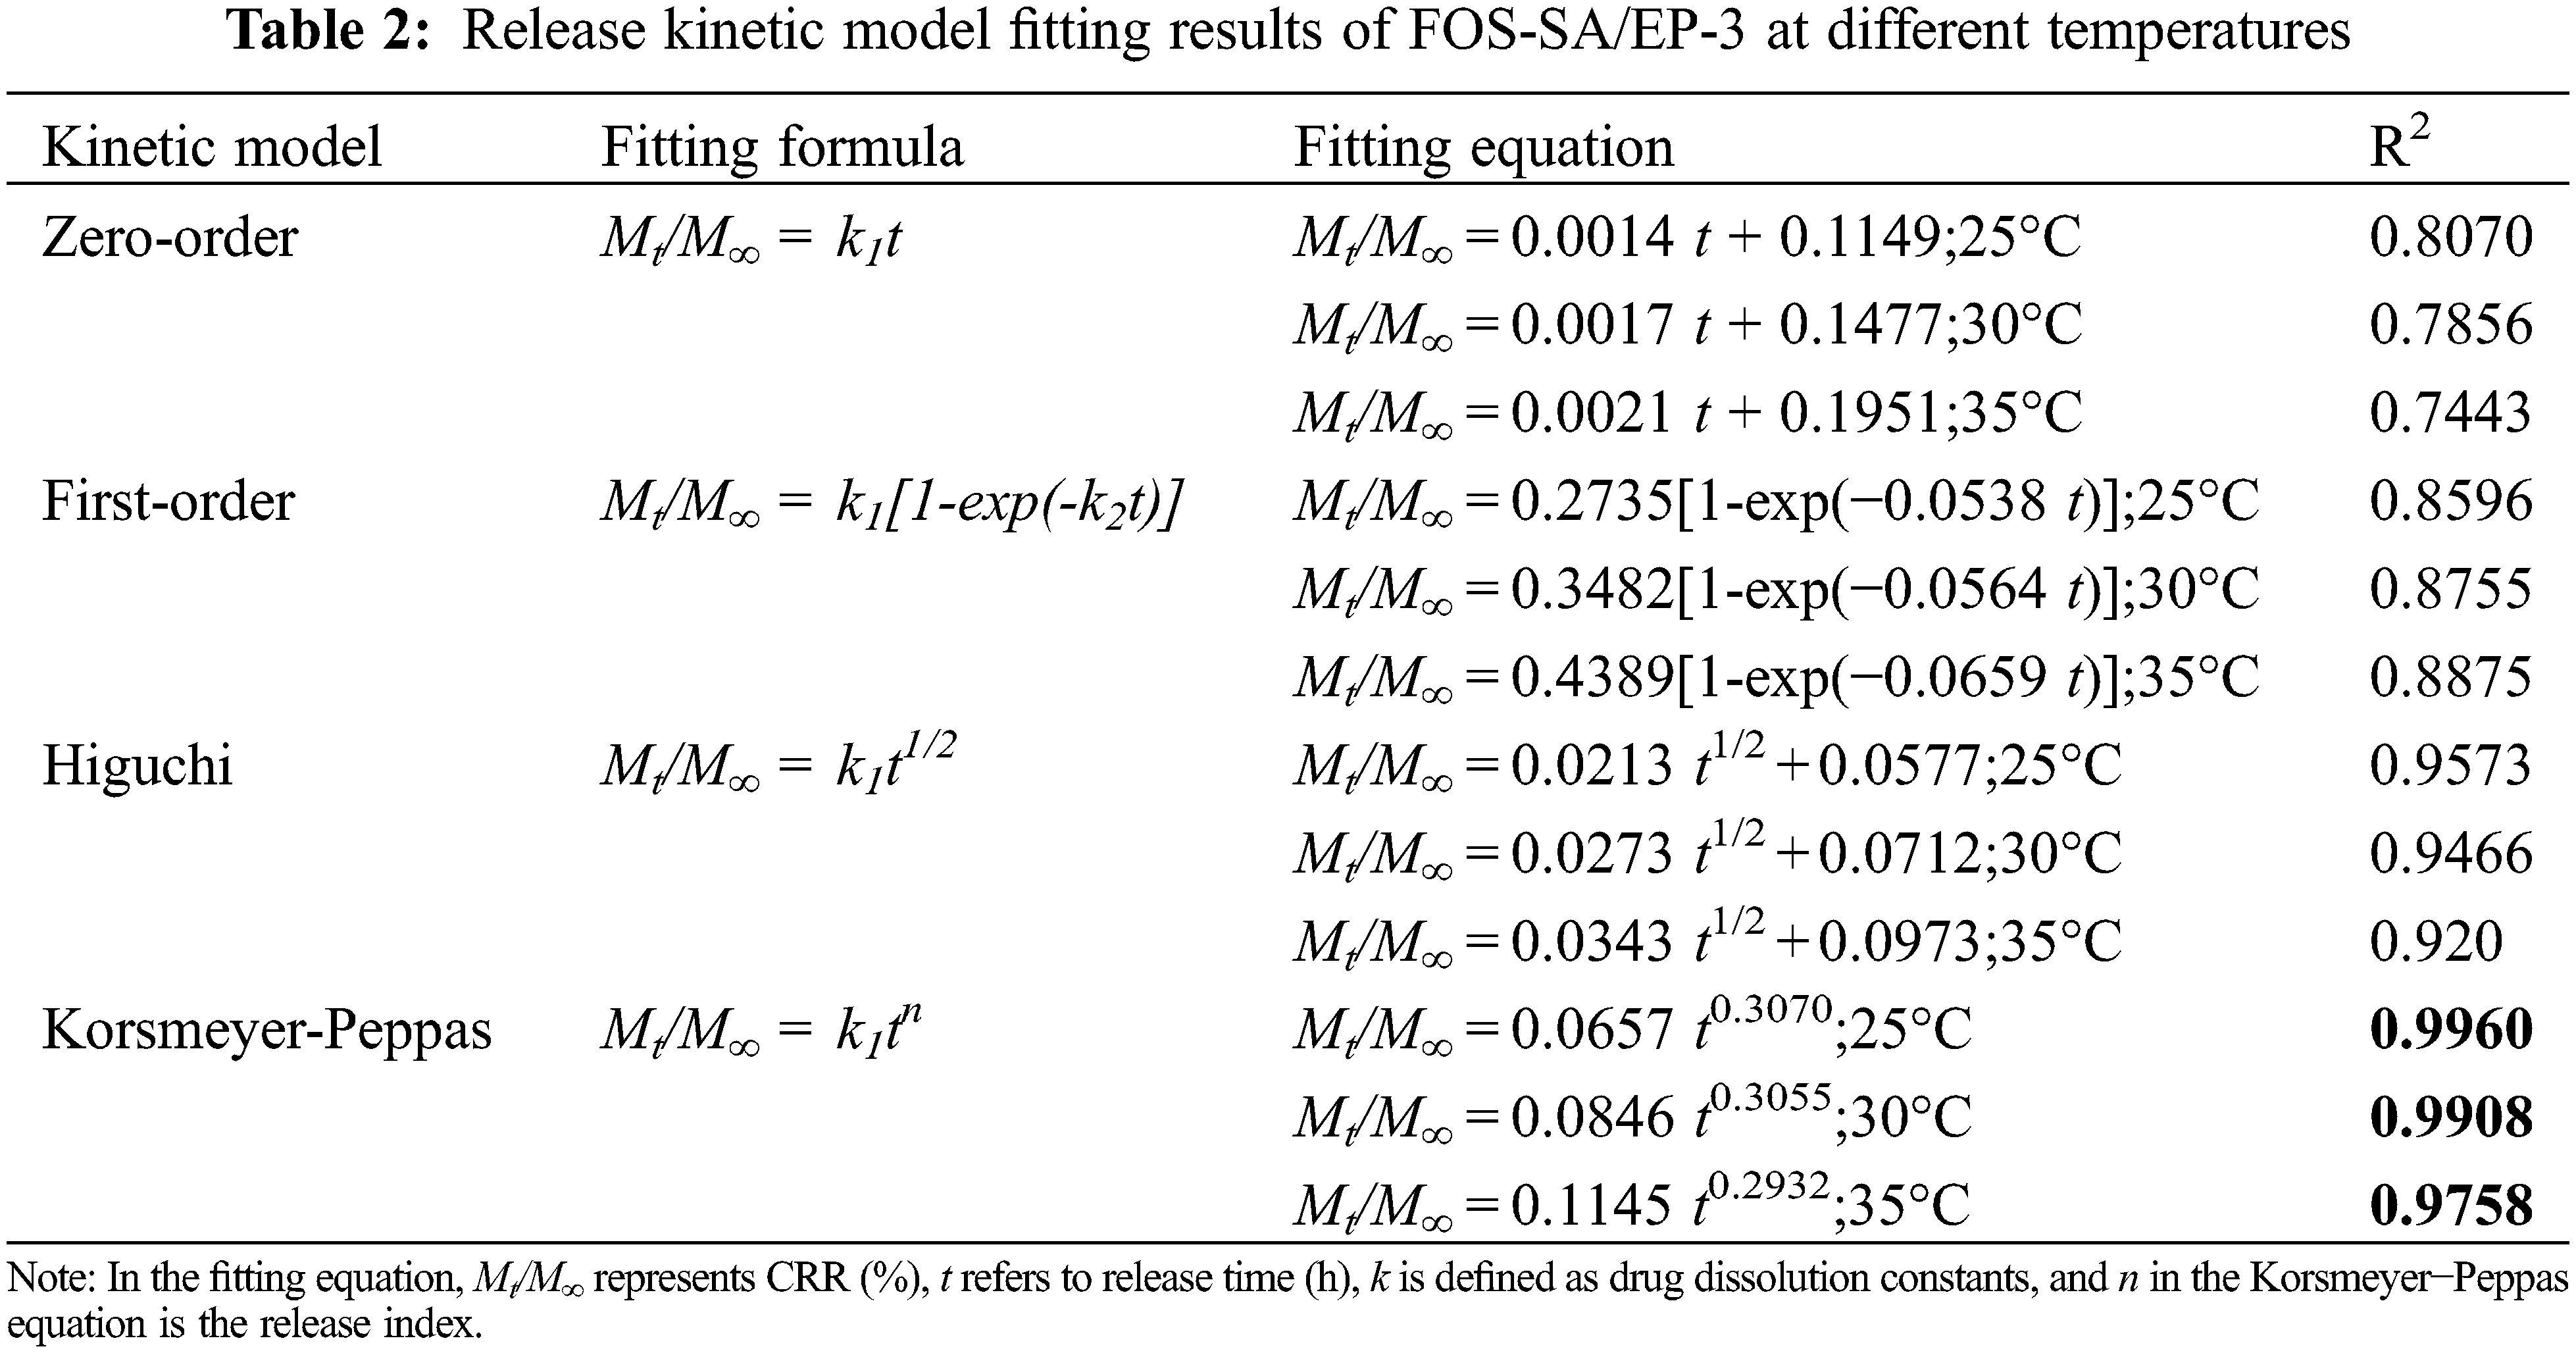
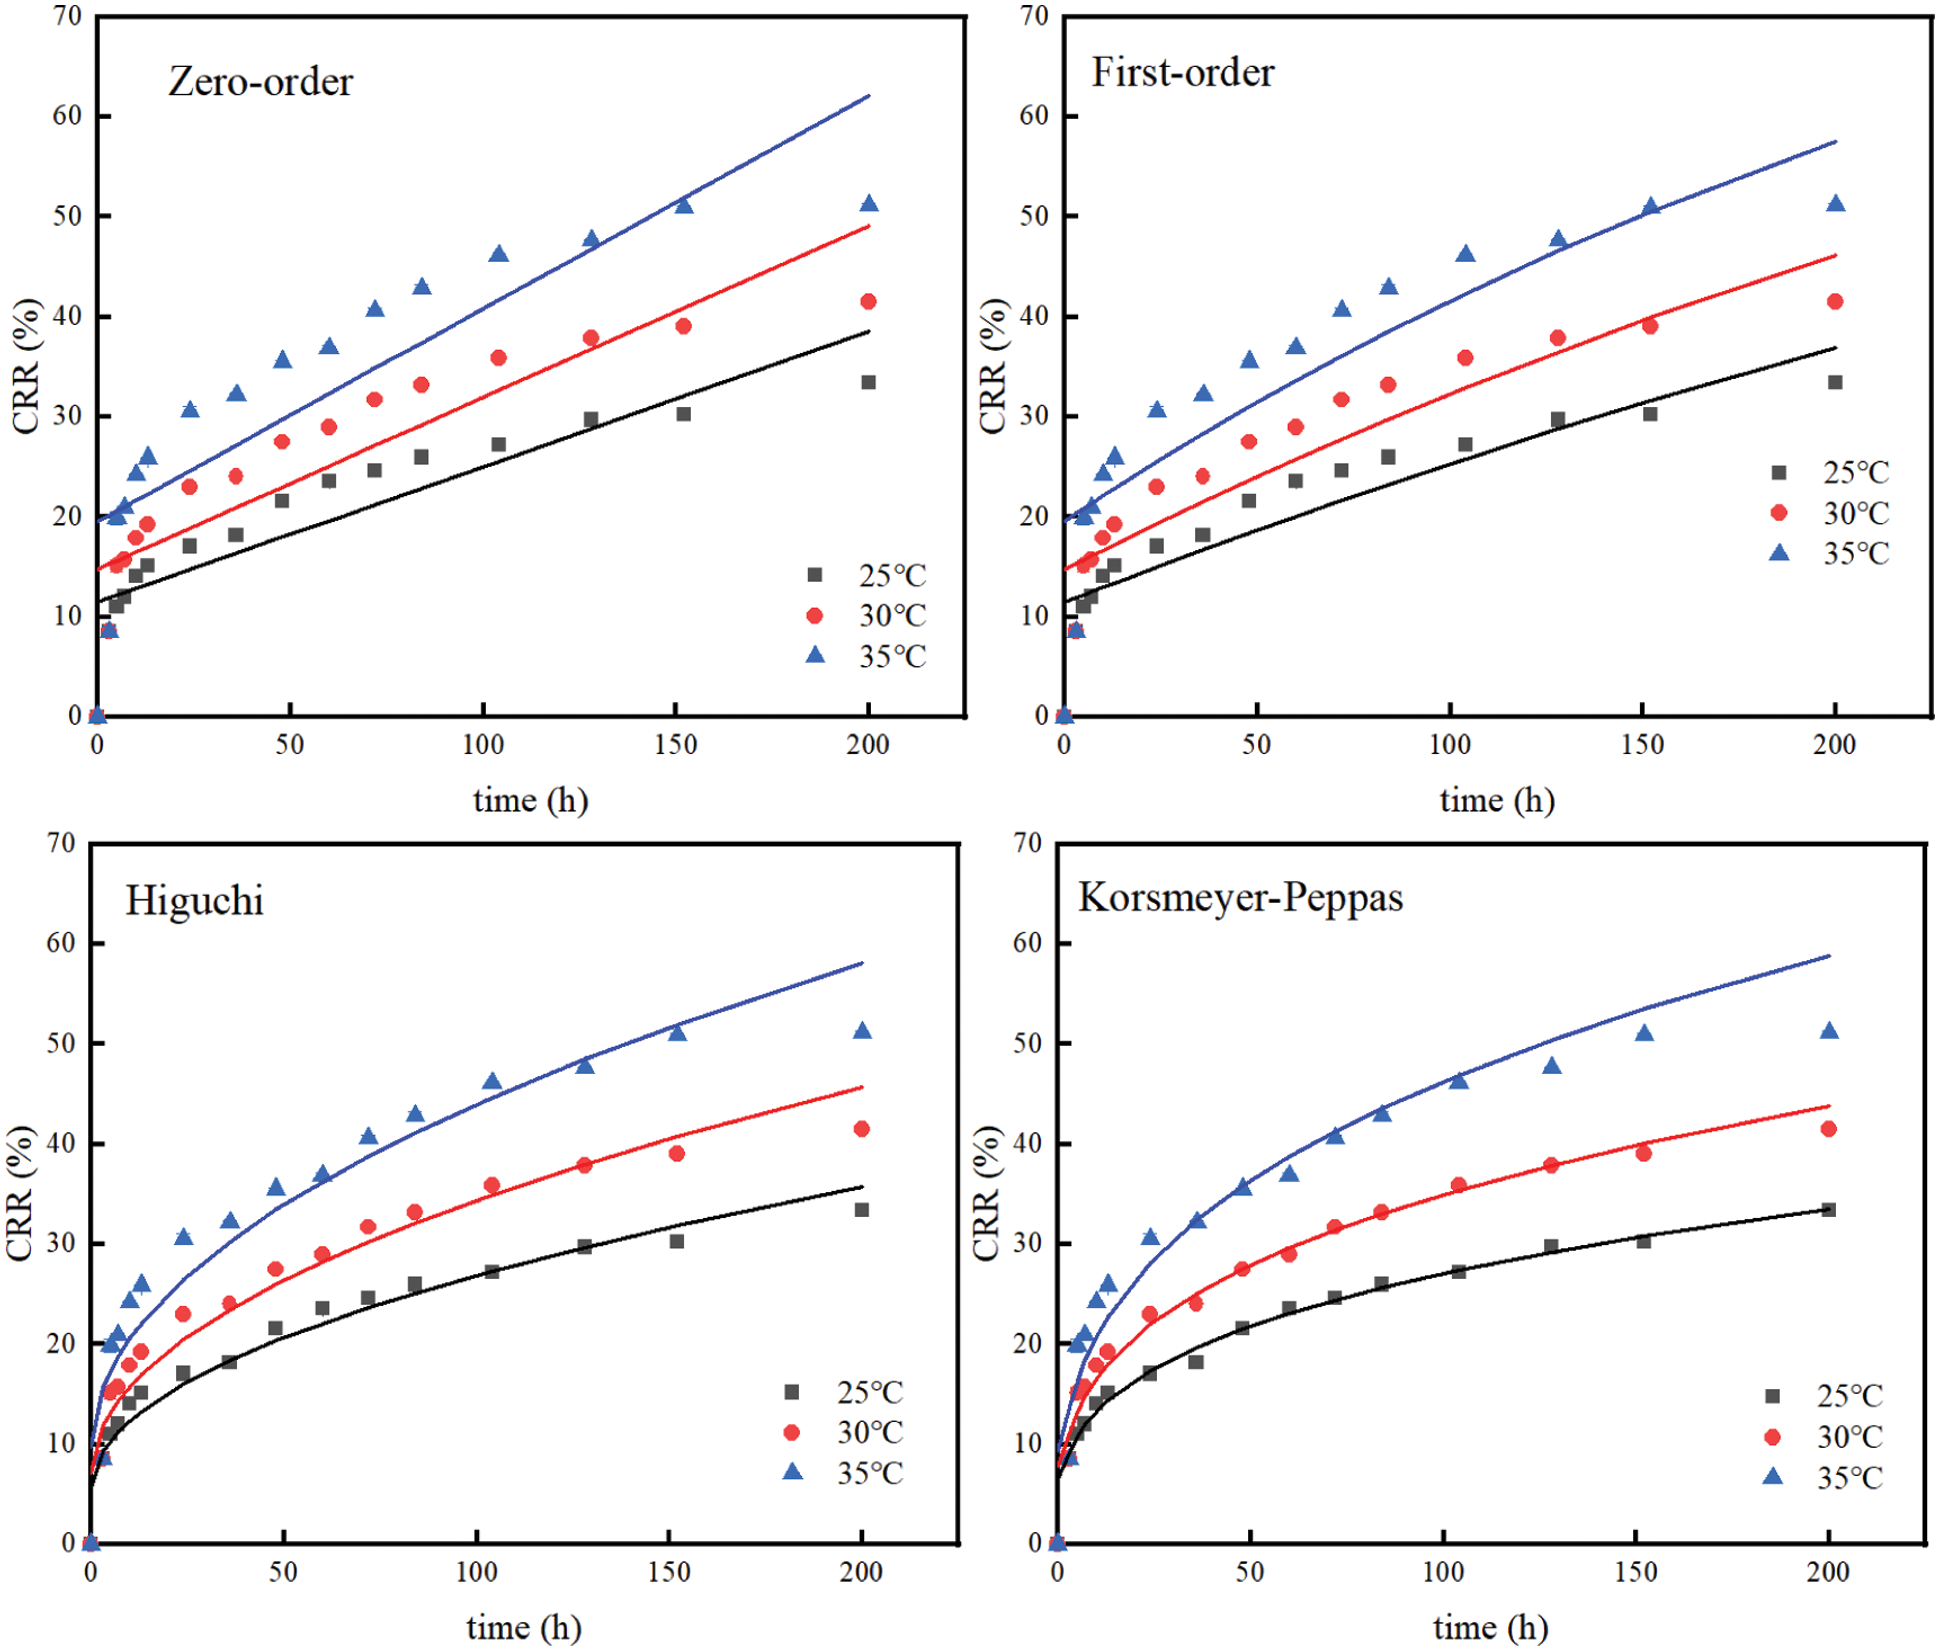
Figure 10: Model fitting of data of sustained release profiles at varying temperatures
In order to further explore the drug release behavior of FOS-SA/EP under different pH conditions, zero-order, first-order, Higuchi and Korsmeyer-Peppas kinetic models were fitted for drug release data of its drug delivery system. The results are shown in Table 3 and Fig. 11. The above-mentioned FOS-SA/EP release curve at pH = 5 has the highest degree of fit with the Korsmeyer-Peppas kinetic model, with R2 being 0.9888 and n being 0.3508. Since n ≤ 0.45, indicating that the drug release in FOS-SA/EP at pH = 5 is performed by Fickian mechanism. The drug release curves at pH = 7 fit well with Higuchi and Korsmeyer-Peppas kinetic models, R2 being 0.9834 and 0.9823, and n = 0.4770. Since 0.45 < n < 0.89, drug release corresponds to non-Fickian diffusion mechanism [36], it indicated that the diffusion mechanism is dominant and dissolution mechanism is secondary under the pH = 7 condition.
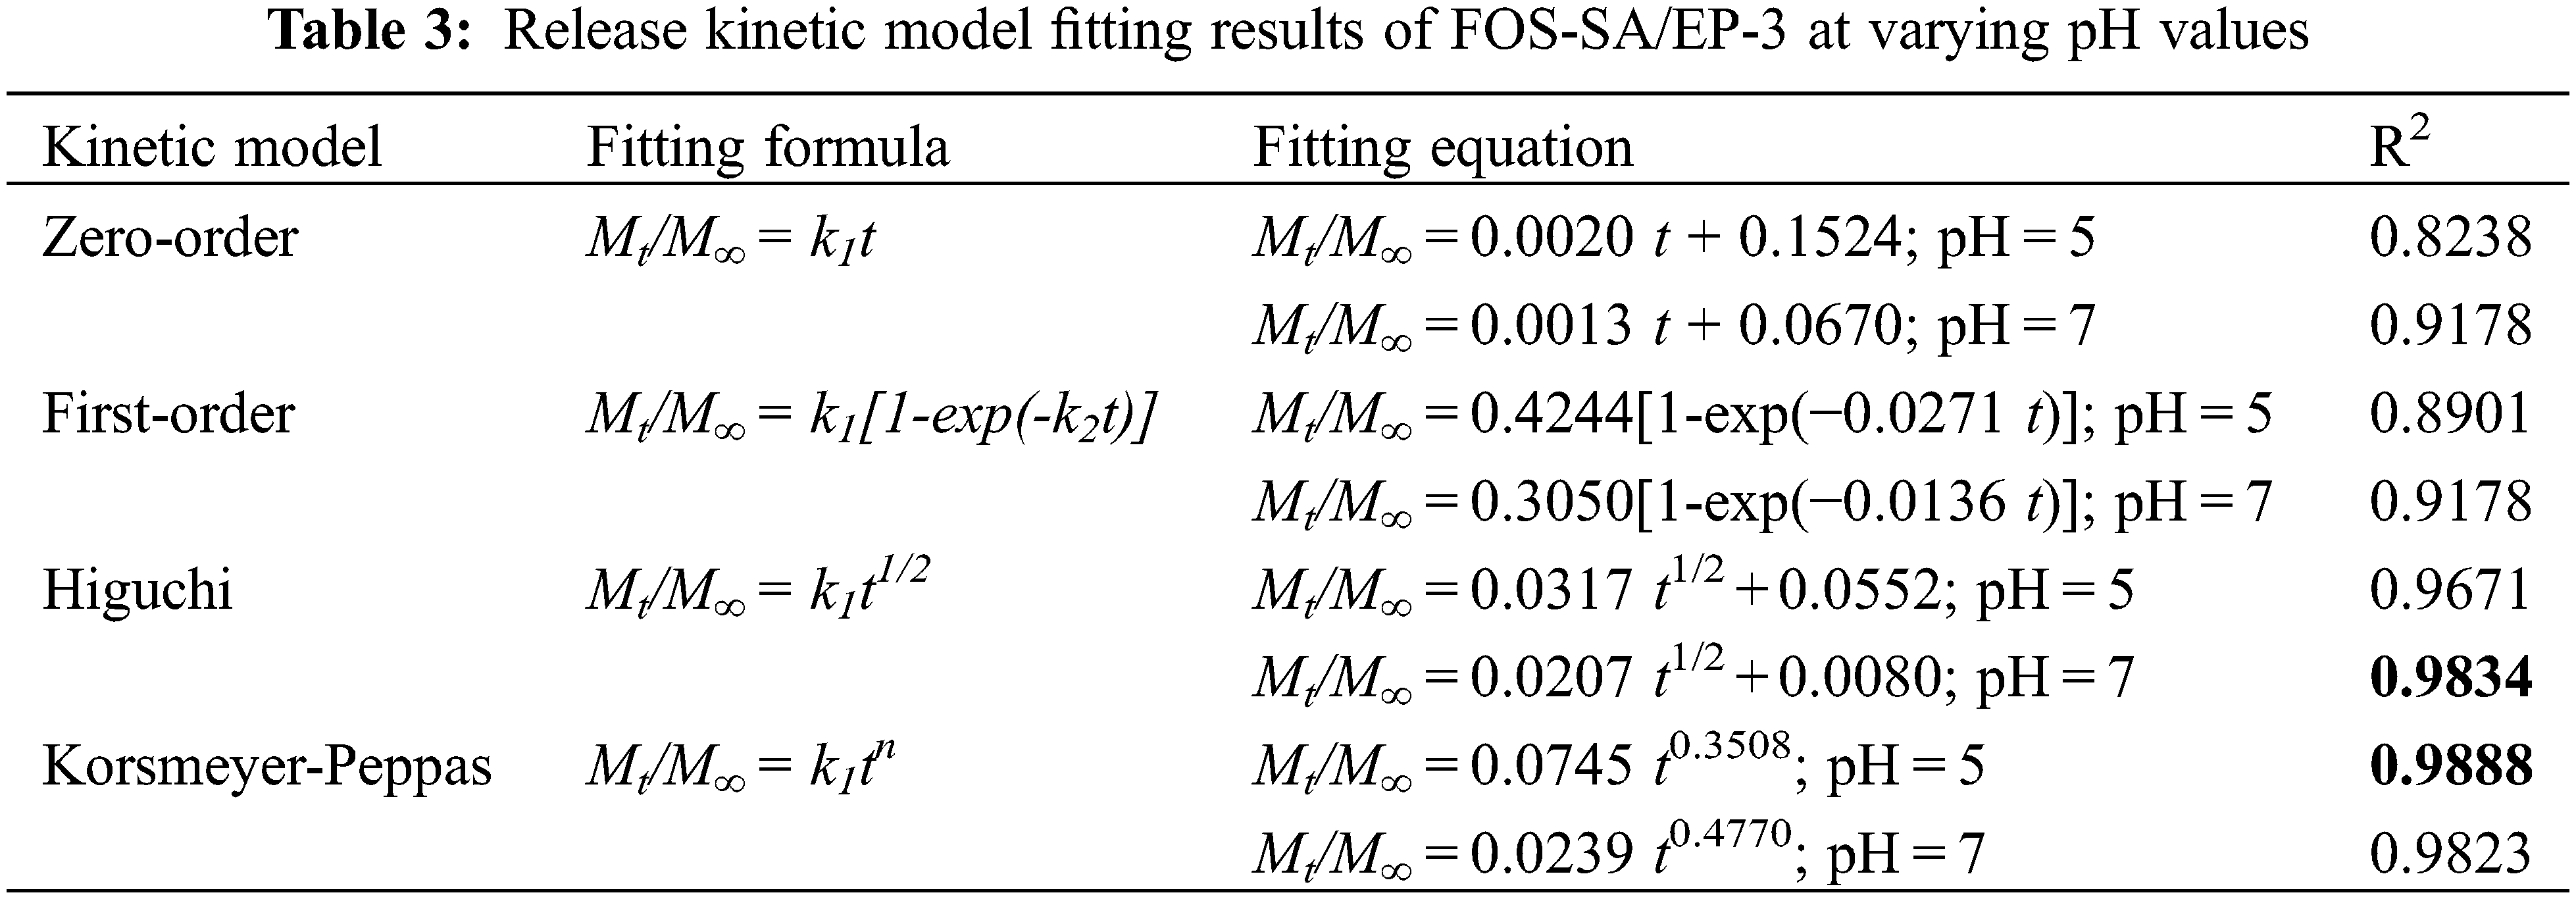
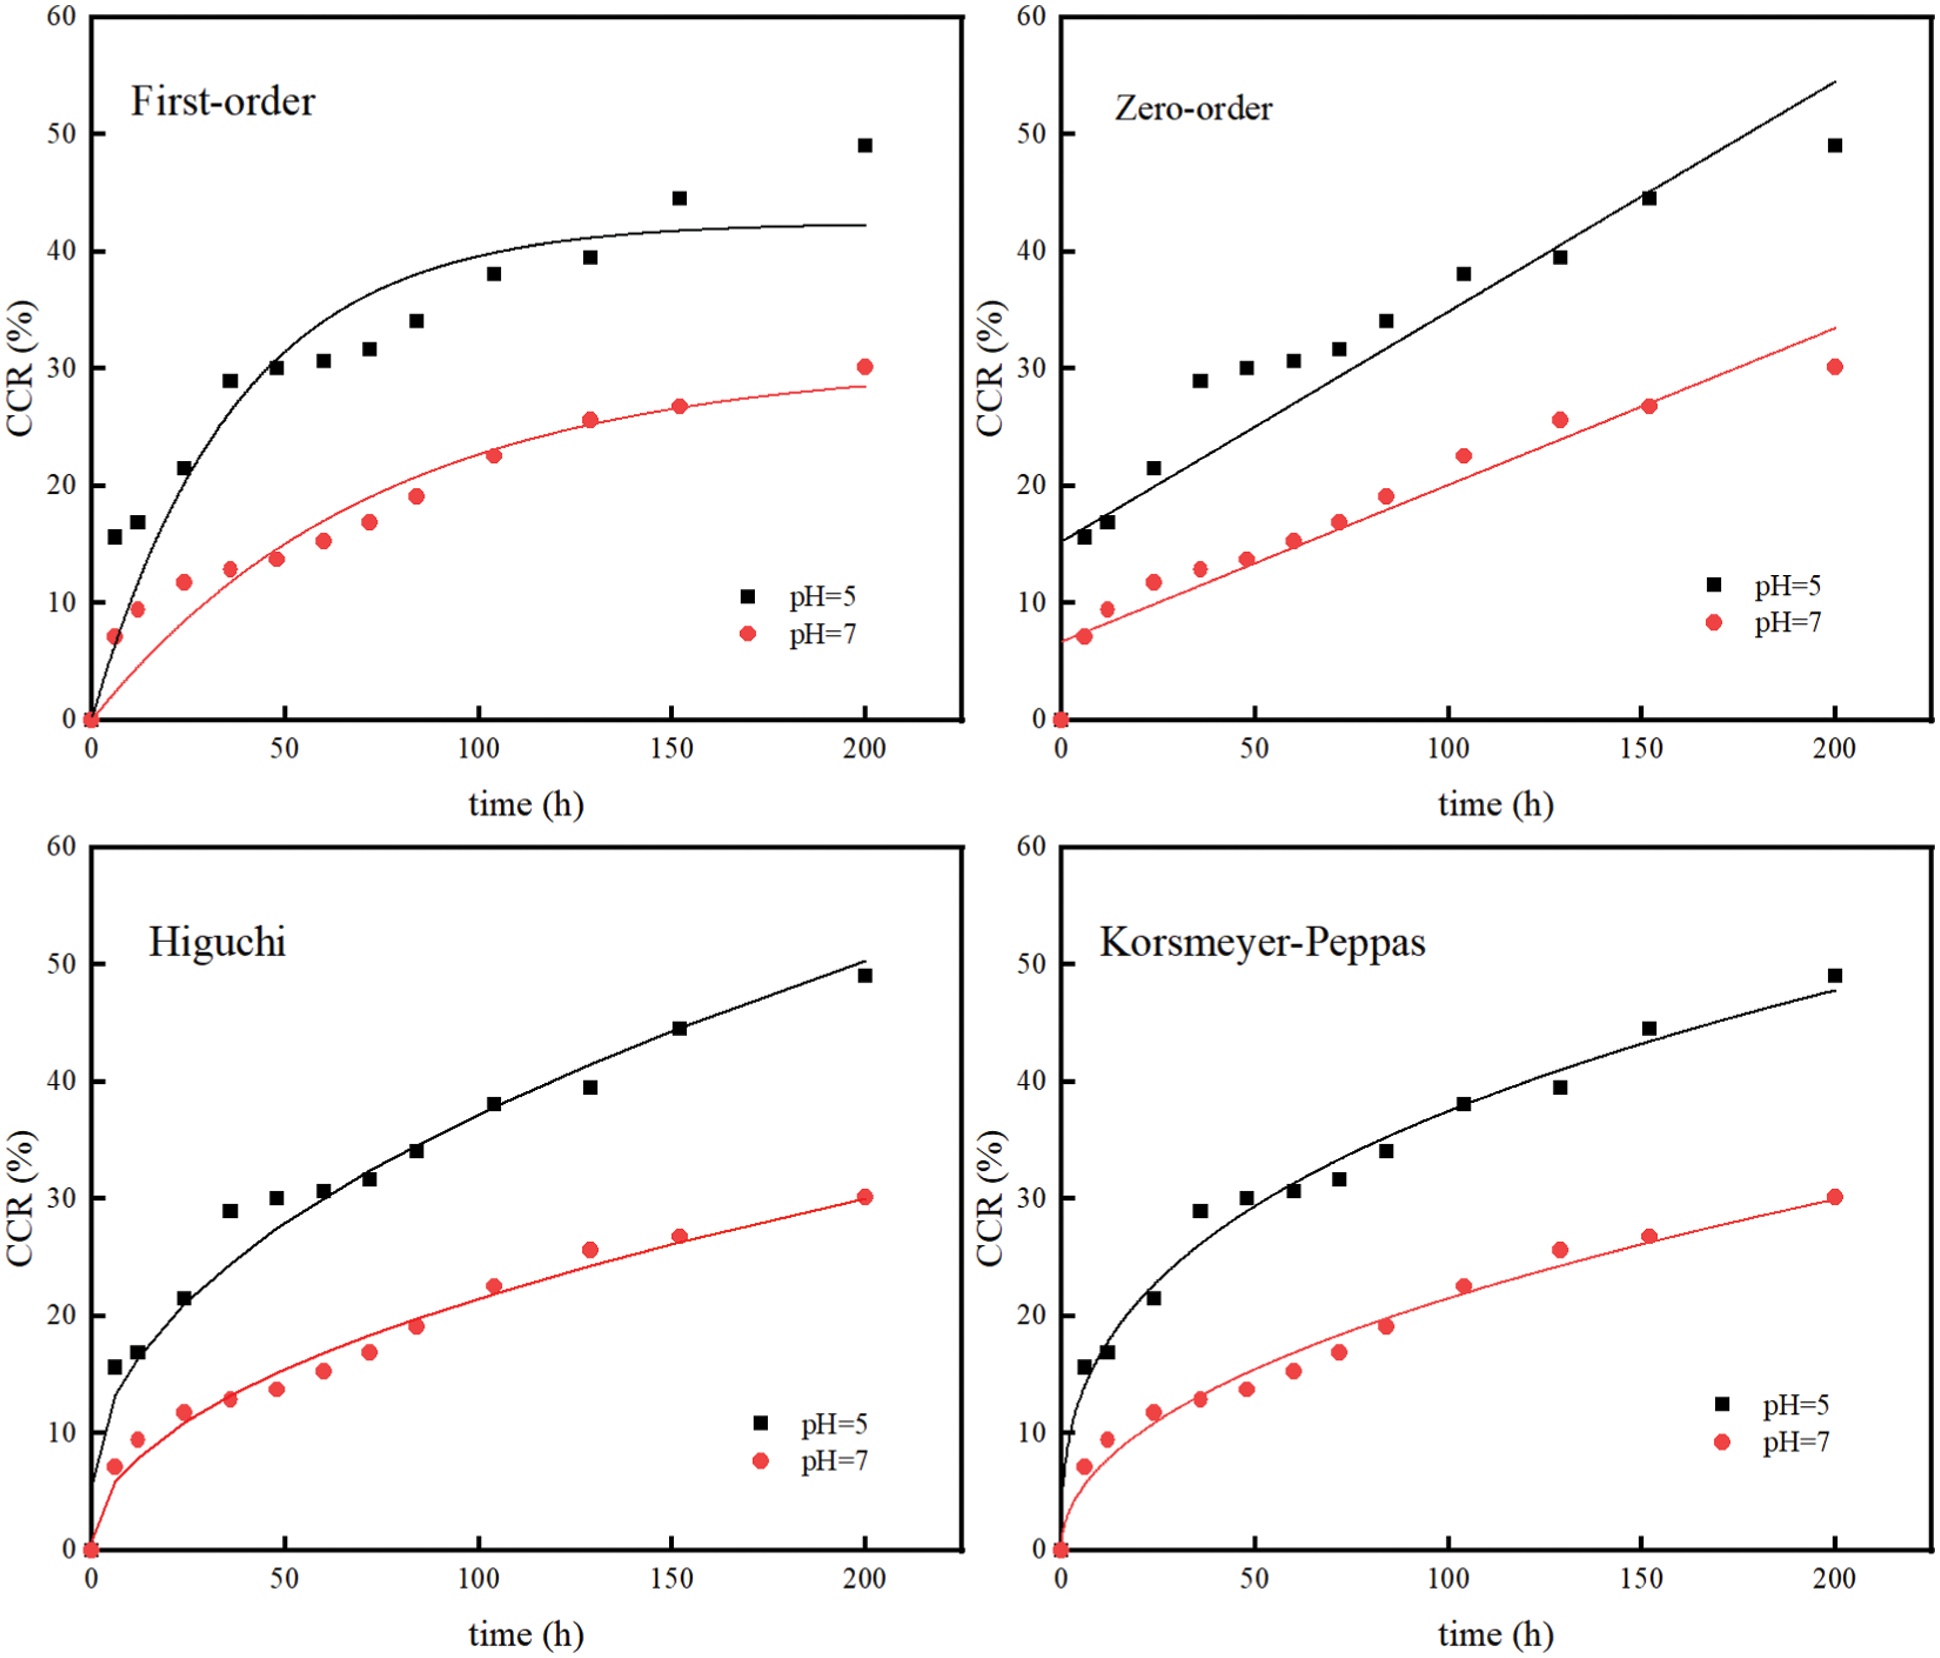
Figure 11: Model fitting of data of sustained release profiles at varying pH values
The results showed that the sustained-release particles with different drug loading and sustained-release performance could be obtained by changing the mass ratios of FOS to SA, and the sustained-release rate and drug loading of FOS-SA/EP decreased with the increase of SA ratio. The release rate of FOS-SA/EP was 35°C > 30°C > 25°C, pH = 5 > pH = 7, which indicates that FOS-SA/EP is a temperature-responsive and acid-responsive sustained-release system. The release curves of FOS-SA/EP at different temperatures and pH = 5 conformed to the Korsmeyer-Peppas kinetic model, and the drug release conformed to the Fickian diffusion mechanism. The fitting results showed that FOS-SA/EP was dominated by diffusion mechanism and supplemented by corrosion mechanism in the environment of pH = 7. In general, in this study, FOS-SA/EP sustained-release particles were prepared by vacuum impregnation method with EP as the FOS sustained-release carrier and SA as the hydrophobic matrix. The method is simple, solvent-free, good release performance and environmentally friendly, which provides an effective and promising method for EP as the pesticide sustained-release carrier.
Funding Statement: This work was supported by the Guangdong Provincial Science and Technology Project (No. 2015B020215012), State Key Laboratory of Woody Oil Resource Utilization, Co-Built by Provincial and Ministry of China (No. GZKF202108) and National Natural Science Foundation of China (32101475).
Conflicts of Interest: We declare that we do not have any commercial or associative interest that represents a conflict of interest in connection with the work submitted.
References
1. Song, S., Wan, M., Feng, W., Zhang, J., Shen, J. (2021). Graphene oxide as the potential vector of hydrophobic pesticides: Ultrahigh pesticide loading capacity and improved antipest activity. ACS Agricultural Science & Technology, 1(3), 182–191. DOI 10.1021/acsagscitech.1c00002. [Google Scholar] [CrossRef]
2. Zhong, T., Yu, X., Xiao, Y., Wang, L., Tan, L. et al. (2021). Incorporating lipid microparticles into carboxymethyl cellulose films as secondary carriers for stable loading and sustained releasing of carvacrol. Results in Materials, 11(4), 100205–100210. DOI 10.1016/j.rinma.2021.100205. [Google Scholar] [CrossRef]
3. Mao, T., Lu, G., Chi, J. H., Xu, Z. Y., Yang, H. B. et al. (2019). Preparation and properties of PVP-Cu2O microcapsule antifouling coating. Surface Technology, 48(2), 246–252. DOI 10.16490/j.cnki.issn.1001-3660.2019.02.035. [Google Scholar] [CrossRef]
4. Zhang, S., Ye, T. (2021). Preparation of natural composite microcapsules containing orchid black currant fragrance and its sustained-release properties on hair bundle. Journal of Polymers and the Environment, 30, 136–150. DOI 10.1007/s10924-021-02173-8. [Google Scholar] [CrossRef]
5. Nuruzzaman, M., Liu, Y., Rahman, M. M., Dharmarajan, R., Duan, L. et al. (2019). Nanobiopesticides: composition and preparation methods. Nano-Biopesticides Today and Future Perspectives, pp. 69–131. USA: Academic Press. [Google Scholar]
6. Song, S., Jiang, X., Shen, H., Wu, W., Shen, J. (2021). MXene (Ti3C2) based pesticide delivery system for sustained release and enhanced pest control. ACS Applied Bio Materials, 4(9), 6912–6923. DOI 10.1021/acsabm.1c00607. [Google Scholar] [CrossRef]
7. Song, S., Wang, Y., Xie, J., Sun, B., Shen, J. (2019). Carboxymethyl chitosan modified carbon nanoparticle for controlled emamectin benzoate delivery: Improved solubility, pH-responsive release, and sustainable pest control. ACS Applied Materials & Interfaces, 11(37), 34258–3426. DOI 10.1021/acsami.9b12564. [Google Scholar] [CrossRef]
8. Wu, J., Ding, S. J., Chen, J., Liu, C., Huang, J. J. (2014). Effects of attapulgite on sustained release performance of chitosan/sodium alginate microspheres. Gao Xiao Hua Xue Gong Cheng Xue Bao/Journal of Chemical Engineering of Chinese Universities, 28(3), 648–653. DOI 10.3969/j.issn.1003-9015.2014.03.033. [Google Scholar] [CrossRef]
9. Martín, S., Pérez, I., Rivera, A. (2021). Hosting of the antibiotic vancomycin by bentonite: Characterization and slow release study. Applied Clay Science, 202, 105965–105974. DOI 10.1016/j.clay.2020.105965. [Google Scholar] [CrossRef]
10. Maqueda, C., Afonso, M., Morillo, E., Sanchez, R. M. T., Perez-Savaeo, M. et al. (2013). Adsorption of diuron on mechanically and thermally treated montmorillonite and sepiolite. Applied Clay Science, 72(2), 175–183. DOI 10.1016/j.clay.2012.10.017. [Google Scholar] [CrossRef]
11. Liu, Y., Zhang, J., Sheng, X., Li, N., Ping, Q. (2020). Adsorption and release kinetics, equilibrium, and thermodynamic studies of hymexazol onto diatomite. ACS Omega, 5(45), 29504–29512. DOI 10.1021/acsomega.0c04449. [Google Scholar] [CrossRef]
12. Bakhtiary, S., Shirvani, M., Shariatmadari, H. (2013). Adsorption-desorption behavior of 2, 4-D on NCP-modified bentonite and zeolite: Implications for slow-release herbicide formulations. Chemosphere, 90(2), 699–705. DOI 10.1016/j.chemosphere.2012.09.052. [Google Scholar] [CrossRef]
13. Shang, Q., Zheng, T., Zhang, Y., Yin, J., Shi, Y. (2012). Preparation of abamectin-loaded porous acrylic resin and controlled release studies. Iranian Polymer Journal, 21(10), 731–738. DOI 10.1007/s13726-012-0076-4. [Google Scholar] [CrossRef]
14. Chen, H., Zhan, J., Zhou, H., Hao, L., Xu, H. et al. (2020). Triazolone/alginate-zinc (II)-montmorillonite sustained release system with improved adsorption capacity and pH-sensitivity. SN Applied Sciences, 2(12),1–11. DOI 10.1007/s42452-020-03897-3. [Google Scholar] [CrossRef]
15. Hua, X. U., Wen, H., Lin, J., Zhou, H., Chen, H. et al. (2019). Adsorption performance of CTS-g-PAA/ATP composite on chlorpyrifos. Chemical Industry and Engineering Progress, 38(73332–3340. DOI 10.16085/j.issn.1000-6613.2019-0227. [Google Scholar] [CrossRef]
16. Wu, W., Wan, M., Fei, Q., Tian, Y., Song, S. et al. (2021). PDA@Ti3C2Tx as a novel carrier for pesticide delivery and its application in plant protection: NIR-responsive controlled release and sustained antipest activity. Pest Management Science, 77, 4960–4970. DOI 10.1002/ps.6538. [Google Scholar] [CrossRef]
17. Mathew, R. T., Cooney, R. P., Zujovic, Z., Doyle, C. S., Silva, K. D. (2018). A sustained release anchored biocide system utilising the honeycomb cellular structure of expanded perlite. ACS Applied Bio Materials, 1(6), 1959–1971. DOI 10.1021/acsabm.8b00495. [Google Scholar] [CrossRef]
18. Mahkam, M., Vakhshouri, L. (2010). Colon-specific drug delivery behavior of pH-responsive PMAA/Perlite composite. International Journal of Molecular Sciences, 11(4), 1546–1556. DOI 10.3390/ijms11041546. [Google Scholar] [CrossRef]
19. Mathew, R. T., Cooney, R. P., Zujovic, Z., Doyle, C., Wheelwright, W. et al. (2018). A sustained release anchored biocide system utilizing the honeycomb cellular structure of expanded perlite. ACS Applied Bio Materials, 1(6), 1959–1971. DOI 10.1021/acsabm.8b00495. [Google Scholar] [CrossRef]
20. Al-Shammari, A., Abood, M. A., Hamdi, G. J. (2018). Effect of perlite on reducing water stress for three genotypes of tomatoes solanum lycopersicum L. 1. vegetative growth. Journal of Plant Production, 9(1), 153–157. DOI 10.21608/jpp.2018.35274. [Google Scholar] [CrossRef]
21. Ma, A., Spa, B., Pma, C., Xga, C. (2020). Analysis of urban agriculture solid waste in the frame of circular economy: Case study of tomato crop in integrated rooftop greenhouse. Science of the Total Environment, 734, 139375–139384. DOI 10.1016/j.scitotenv.2020.139375. [Google Scholar] [CrossRef]
22. Koyanagi, T., Imai, O., Yoshida, K. (1998). Development of a new nematicide, fosthiazate. Journal of Pesticide Science, 23(2), 174–183. DOI 10.1584/jpestics.23.174. [Google Scholar] [CrossRef]
23. Huang, B., Qian, W., Guo, M., Fang, W., Wang, X. et al. (2019). The synergistic advantage of combining chloropicrin or dazomet with fosthiazate nematicide to control root-knot nematode in cucumber production. Journal of Integrative Agriculture, 18(9), 2093–2106. DOI 10.1016/S2095-3119(19)62565-7. [Google Scholar] [CrossRef]
24. Santos, B. M., Gilreath, J. P., Motis, T. N., Noling, J. W., Jones, J. P. et al. (2006). Comparing methyl bromide alternatives for soilborne disease, nematode and weed management in fresh market tomato. Crop Protection, 25(7), 690–695. DOI 10.1016/j.cropro.2005.09.015. [Google Scholar] [CrossRef]
25. Hou, D., Wu, T., Yang, W., Mei, B. (2018). Determination of fosthiazate by HPLC. Agrochemicals, 57(8), 573–574. DOI 10.16820/j.cnki.1006-0413.2018.08.008. [Google Scholar] [CrossRef]
26. Zhang, J., Guan, X., Song, X., Hou, H., Yang, Z. et al. (2015). Preparation and properties of gypsum based energy storage materials with capric acid–palmitic acid/expanded perlite composite PCM. Energy and Buildings, 92, 155–160. DOI 10.1016/j.enbuild.2015.01.063. [Google Scholar] [CrossRef]
27. Asrar, J., Ding, Y., Monica, R. L., Ness, L. C. (2004). Controlled release of tebuconazole from a polymer matrix microparticle: Release kinetics and length of efficacy. Journal of Agricultural and Food Chemistry, 52(15), 4814–4820. DOI 10.1021/jf0306385. [Google Scholar] [CrossRef]
28. Wang, X., Wang, W., Wang, X., Zhang, J., Zhao, J. et al. (2015). Synthesis, structural characterization and evaluation of floating B-N codoped TiO2/expanded perlite composites with enhanced visible light photoactivity. Applied Surface Science, 349, 264–271. DOI 10.1016/j.apsusc.2015.05.002. [Google Scholar] [CrossRef]
29. Jain, P., Bhagat, S., Tunki, L., Jangid, A. K., Kulhari, H. (2020). Serotonin-stearic acid bioconjugate coated completely biodegradable Mn3O4 nanocuboids for hepatocellular carcinoma targeting. ACS Applied Materials & Interfaces, 12(9), 10170–10182. DOI 10.1021/acsami.0c00331. [Google Scholar] [CrossRef]
30. Esmaielpour, M., Akhlaghinia, B., Jahanshahi, R. (2017). Green and efficient synthesis of aryl/alkylbis(indolyl)methanes using expanded perlite-PPA as a heterogeneous solid acid catalyst in aqueous media. Journal of Chemical Sciences, 129(3), 313–328. DOI 10.1007/s12039-017-1246-x. [Google Scholar] [CrossRef]
31. Dai, J., Ma, F., Fu, Z., Li, C., Wang, W. (2021). Applicability assessment of stearic acid/palmitic acid binary eutectic phase change material in cooling pavement. Renewable Energy, 175(5), 748–759. DOI 10.1016/j.renene.2021.05.063. [Google Scholar] [CrossRef]
32. Yuan, H., Bai, H., Zhang, X., Zhang, J., Zhang, Z. et al. (2018). Synthesis and characterization of stearic acid/silicon dioxide nanoencapsules for solar energy storage. Solar Energy, 173, 42–52. DOI 10.1016/j.solener.2018.07.049. [Google Scholar] [CrossRef]
33. Hiew, T. N., Tan, D. L. H., Tiang, Y. L., Heng, P. W. S. (2019). Understanding the release performance of pellets with hydrophobic inclusions in sustained-release coating. International Journal of Pharmaceutics, 557, 229–237. DOI 10.1016/j.ijpharm.2018.12.061. [Google Scholar] [CrossRef]
34. Pantelelis, I., Karpouzas, D. G., Menkissoglu-Spiroudi, U., Tsiropoulos, N. (2006). Influence of soil physicochemical and biological properties on the degradation and adsorption of the nematicide fosthiazate. Journal of Agricultural & Food Chemistry, 54(18), 6783–6789. DOI 10.1021/jf061098p. [Google Scholar] [CrossRef]
35. Costa, P. P., Lobo, J. (2001). Modeling and comparison of dissolution profiles. European Journal of Pharmaceutical Sciences, 13(2), 123–133. DOI 10.1016/S0928-0987(01)00095-1. [Google Scholar] [CrossRef]
36. Ritger, P. L., Peppas, N. A. (1987). A simple equation for description of solute release I. Fickian and non-fickian release from non-swellable devices in the form of slabs, spheres, cylinders or discs. Journal of controlled release, 5(1), 23–36. DOI 10.1016/0168-3659(87)90034-4. [Google Scholar] [CrossRef]
37. Guan, M., Hao, L., Chen, L., Gao, F., Qiu, S. et al. (2020). Facile mechanical-induced functionalization of hexagonal boron nitride and its application as vehicles for antibacterial essential oil. ACS Sustainable Chemistry and Engineering, 8(40), 15120–15133. DOI 10.1021/acssuschemeng.0c03781. [Google Scholar] [CrossRef]
38. Zhao, M., Zhou, H., Chen, L., Hao, L., Zhou, X. (2020). Carboxymethyl chitosan grafted trisiloxane surfactant nanoparticles with pH sensitivity for sustained release of pesticide. Carbohydrate Polymers, 243, 116433–116466. DOI 10.1016/j.carbpol.2020.116433. [Google Scholar] [CrossRef]