| Journal of Renewable Materials |
DOI: 10.32604/jrm.2022.021167
ARTICLE
Numerical Simulation and Experimental Study of the Stress Formation Mechanism of FDM with Different Printing Paths
1Faculty of Printing, Packaging Engineering and Digital Media Technology, Xi’an University of Technology, Xi’an, 710000, China
2Shaanxi Beiren Printing Machinery Co., Ltd., Weinan, 714000, China
*Corresponding Author: Yang Yue. Email: yueyang1511@163.com
Received: 30 December 2021; Accepted: 28 March 2022
Abstract: Environmental contamination has been caused by petroleum-based polymeric materials in the melt deposition process. Nowadays biodegradable materials have been widely used in the fused deposition modeling (FDM) industry, such as polylactic acid (PLA). However, internal complex thermal stress and deformations in part caused by an uneven distribution of PLA filament deposition temperatures during FDM, which will seriously affect the geometric accuracy of the printed part. In order to reduce material waste and environmental pollution during the printing process, the accuracy of PLA part can be improved. Herein, numerical simulation was carried out to investigate the temperature field and stress field during the building and cooling process of cuboid specimens. The effects of printing path on the thermal stress and temperature field during the building process were mainly studied. The results show that the printing path has a significant effect on the stress distribution. The most uniform stress distribution and the smallest deformation were obtained using the Zig Zag printing path. Finally, the residual stress during the cooling process was collected using strain gauges embedded at the mid-plane of the FDM built cuboid specimens. The simulation results are consistent with the experimental results.
Keywords: Fused deposition molding; numerical simulation; strain gauges; stress measurement
Fused deposition modeling (FDM) has been widely used as an addictive manufacturing (AM) technology in the molding of polymeric materials. FDM technology begins by creating a CAD model of the part to be printed and slicing it into STL files using specific software [1]. The cylindrical print filament is then extruded through the extrusion motor to the nozzle, where it is heated to a molten state and extruded. The molten filament is printed by the nozzle in the x-y plane according to the printing speed, printing path, printing temperature and other parameters set in the STL file [2]. The final 3D model is formed by overlaying the layered information along the z-axis of the printer [3]. FDM technique is widely used because of its advantages such as adaptability of printing materials [4,5], easy maintenance of printing devices [6], low environmental pollution [7], and space-saving [8]. By 2027, FDM technology can contribute to a financial forecast growth of $14.54 billion [9]. It can be seen that the fused deposition industry has a broad development prospect and will become one of the pillar industries in the field of 3D printing in the future [10].
Most of the materials used in FDM technology are amorphous thermoplastics such as acrylonitrile butadiene styrene (ABS) and polylactic acid (PLA) [11–13]. Fast and clean prototypes and functional components are produced by FDM technology [14]. The demand for dimensional accuracy of FDM manufactured parts has been increased in modern manufacturing industries such as machinery, telecommunications, aerospace and medical [15–18]. FDM technology has continued to develop in recent years, and the role of its processed products has changed significantly. FDM products are gradually changing from prototypes to final products [19]. However, the application of FDM technology is limited to a certain extent by the low molding accuracy of FDM compared to other rapid prototyping technologies [20]. Meanwhile, the decrease in yield rate is caused by low part molding accuracy when using FDM [21]. With the goal to reduce this negative impact on the environment, the accuracy of the part need to be improved. This not only can lead to a green environment, but also can reduce the cost of 3D printing [22,23]. In the FDM molding process, defects such as dimensional shrinkage and warpage of the parts are closely related to the nature of the PLA material themselves [24,25]. The temperature gradients and the drastic changes in thermal stress inside the FDM part are dependent on the printing parameters, which causes complex changes in the part dimensions and the shape accuracy of the part [26,27]. In which, the printing path in the FDM is one of the main factors affecting the molding performance.
In terms of printing parameters, Zhang et al. [28] developed finite element analysis models to simulate mechanical and thermal phenomena in FDM, which were further used for residual stress and part deformation simulation. The model was also used to study the effect of the printing path on the FDM process. The printing path affects the magnitude of residual stress and the distribution of stress concentration. Measurements on the experimental model showed that the center of deformation of the part changed significantly due to the different print paths. Wang et al. [29] quantitatively analyzed the deformation of parts with different number of deposited layers, length of stacking section, and chamber temperature. A radial deformation model was established to provide a reasonable explanation for some problems and phenomena in the FDM process. In addition, an improved method (material and molding process) to reduce the warpage deformation of the prototype is proposed and applied with better results. Zhou et al. [30] investigated the effects of nozzle temperature, platform temperature, extrusion speed, and layer thickness on the deformation and thermal stress of rectangular molded parts. Simulation results showed that lowering the printing temperature and printing speed is beneficial for reducing vertical deformation and residual thermal stress. Yang et al. [31] simulated a thin plate model with an infill percentage of 25% using four different printing paths and found that the honeycomb-shaped printing path had the most uniform stress distribution and the smallest deformation. Zhang et al. [32] applied the boundary-tuned finite element method to propose a three-dimensional transient mathematical model of the FDM molding process as well as the temperature variation during the cooling process. The effect of parameters such as printing path, layer thickness and printing speed on the temperature field of rectangular part was investigated by numerical simulation. Zhou et al. [33] investigated the effects of layer thickness and printing speed on thermal stress. The simulation results showed that great thermal stress fluctuation were formed by smaller layer thickness and printing speed. A larger layer thickness should be used in actual manufacturing. Cattenone et al. [34] investigated the effect of mesh size, material model, and time step on the simulation results, and verified the simulation results by measuring experimental deformation. Samy et al. [35] found that the mechanical properties of polymers are temperature dependent by thermodynamic modeling of the FDM molding process. According to the simulation results, it was observed that the warpage decreases and the residual stress decrease when the layer thickness is reduced. The warpage is very consistent with simulated and experimental results under different printing conditions. In the area of temperature research, El Moumen et al. [36] studied the effect of printing temperature on residual stress and found that if the printing temperature changes too rapidly, residual thermal stress can lead to interlayer bond failure. de Macedo et al. [37] proposed a model to simulate the FDM process which is able to calculate the temperature and stress during filament deposition. The printing process without a heated print bed generates higher stress. The parts are subjected to rapid temperature changes, which generate higher stress. Xia et al. [38] focused on modeling the fluid flow, the cooling and solidification, as well as volume change and residual stress, using a relatively simple viscoelastic constitutive model. And test its accuracy by refining the Grid. The results showed that the method is shown to produce convergent solutions for the shape of the filament, the temperature distribution, the shrinkage and the solid stress. In print material strength, Bellehumeur et al. [39] reported the modeling of bond formation in the FDM extrusion process. Thermal modeling and cooling temperature profiles of the extruded filament were obtained. The effect of temperature on the bond strength of the printed filaments during deposition was predicted. The results suggest that better control of the cooling conditions may strongly influence the mechanical properties of FDM parts. Domingo-Espin et al. [40] investigated the mechanical properties of FDM polycarbonate specimens. By linking the numerical simulations with the results of physical tests, a model capable of simulating FDM parts was developed. Fitzharris et al. [41] investigated the warpage of FDM parts made from the high-performance semicrystalline polymer polyphenylene sulfide (PPS) by numerical simulation. The effect of material parameters on warpage was studied by changing the printed filament material to polypropylene (PP), including coefficient of thermal expansion (CTE), thermal conductivity, heat capacity and Young’s modulus. The simulation model shows that the CTE has the greatest effect on the warpage of the FDM part. Other parameters have less influence.
In summary, the existing simulation studies about the stress field in FDM process are still in the qualitative stage. The selection strategy of time step and printing path still needs to be studied. Secondly, the research about the effect of layer thickness and printing path on the temperature field and stress field in the FDM process are still relatively limited. Finally, the accuracy of the simulation results about temperature and stress has yet to be verified experimentally. During the formation of internal stress in FDM parts, the printing path of the nozzle has a great effect on the heat source movement, load sequence, filament deposition, and causes the formation of nonlinear transient thermal stress. In this paper, three element-activation sequences were selected, i.e., Concentric, Zig Zag, and Grid, corresponding to the actual printing path. The filament temperature and print time step when it was extruded out the nozzle during the actual FDM printing process are measured, based on which the thermodynamic coupling finite element model of the FDM process was established to analyze the stress-forming mechanism in the printed rectangular parts. At the end of the article, the temperature and stress of the FDM molding process were measured by embedded temperature sensors and strain gauges inside the part, and the numerical simulation results were compared with the measured results to verify the rationality of the numerical simulation. The stress formation pattern of the rectangular part was analyzed from the point of view of temperature gradient distribution and stress distribution of the FDM model. The stress in the FDM molding process was measured by embedded strain gauges inside the part, and the numerical simulation results were compared with the measured results to verify the reasonableness of the numerical simulation.
Through finite element analysis and experimental studies, the patterns of part temperature and stress were investigated with key process parameters (printing path). The actual manufacturing parameter settings for PLA parts are directed by the conclusions. The melt deposition process of PLA has been further improved, and the accuracy and yield of the parts have been increased. Therefore, fused deposition of biodegradable materials (PLA) can be more widely used to drive fused deposition toward a sustainable industry.
2 Numerical Simulation Theory Analysis
2.1 Finite Element Heat Transfer Theory Analysis
In the numerical simulation of temperature and stress distribution of FDM parts, to obtain accurate temperature and stress calculation results, a mathematical model of heat transfer in the molding process of FDM parts is required [42]. It is assumed that the PLA filament is isotropic material. In any micro-element of the model, the net heat of the unit is determined by the difference between the heat input and heat output [43].
where dQ1 is the heat imported and exported from the unit, dQ2 is heat generation of the unit itself, dQ0 is the increase in unit enthalpy.
Since the heat flow density is a vector, the net heat in the x, y, z direction is:
According to Fourier’s law, the net heat imported into (or exported out) the unit in the x, y, z direction can be determined as:
Substituting Eqs. (3)–(5) into Eq. (2):
The principle of FDM shows that the printed filament and the molded portion of the part are heated by the nozzle at a fixed temperature throughout the printing process. The heated printing filament flows out of the nozzle, which has certain temperature and thermophysical properties, so the nozzle can be regarded as a heat source in the process of numerical simulation. The intensity of the heat source is qv, that is, the heat generation in unit time and unit volume is qv, the unit is W/m3, then the heat generation of the unit in time dτ is:
the enthalpy change of the unit in time dτ is:
where cp and ρ denote specific heat capacity and density of the unit, and their unit are J/(kg ⋅ K) and kg/m3, respectively.
Substituting Eqs. (6)–(8) into Eqs. (1) and (9) can be derived. When the thermal conductivity of the FDM filament is a constant that does not vary with temperature, Eq. (8) becomes a three-dimensional unsteady differential equation of heat conduction with a printed heat source under constant properties, i.e., the equation describing the three-dimensional transient heat transfer process of the filament during deposition is:
where t is temperature, τ is time, qv is the latent heat of melting released by the silk forming process, ρ is the material density, and c is the specific heat capacity of the material.
To solve the above differential equations, the corresponding initial and boundary conditions need to be given [44]. The initial condition of the three-dimensional temperature distribution of the FDM part can be expressed as:
The boundary conditions need to be considered in the numerical simulation process, and the convective heat transfer boundary conditions are mainly considered in the FDM molding process. It gives the temperature of the ambient medium
where h is the integrated heat transfer coefficient,
In addition to the boundary conditions of heat exchange with the external environment, for the first layer on the printed substrate the thermal conductivity condition is the first type of boundary condition. The temperature of the lower bottom surface of the part varies with time when the lower bottom surface of the part is in contact with the thermostatic table.
When τ > 0, tw = f1(τ).
Since the table temperature can be treated as the same everywhere and does not vary with time. So,
During the molding of FDM parts, the filament is heated by the nozzle and deposited on the platform or deposited layer. If FDM parts are regarded as a system, heat is transferred among the deposited filament and dissipated out of the system by heat convection and heat radiation. The temperature field of FDM parts with three-dimensional heat transfer can be obtained by solving the heat transfer differential equations under given geometric conditions, physical conditions, boundary conditions, and time conditions.
2.2 Finite Element Simulation Method
ANSYS APDL 19.0 method was used to analyze the transient thermal behavior and stress changes during the FDM molding process [45]. The deformation mechanism of the part can be analyzed from microstructure [46]. In this method, the building of the part and the movement of the nozzle (heat source) were simulated, and the changes in the temperature field during the building process were calculated [47], and the obtained temperature field was used as the load of the stress field simulation [48]. As shown in Fig. 1, the process of material addition in FDM was achieved by using the “birth-death element” method [49], i.e., the elements of the mold are killed at first, and then activated in sequence.

Figure 1: Thermal-mechanical coupling finite element simulation flow chart of FDM forming process
2.3 Physical Parameters of the Material and the Associated Thermal Analysis Unit Type
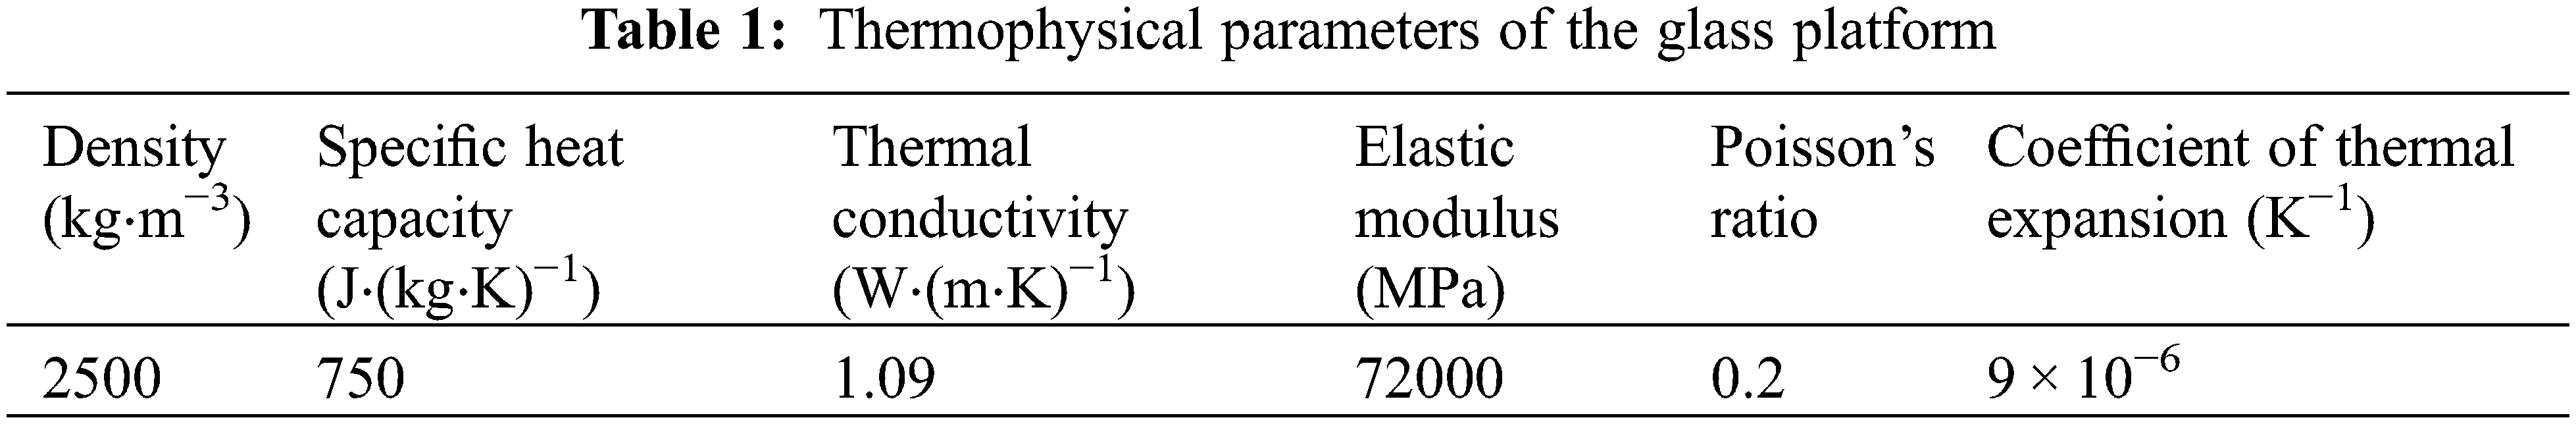
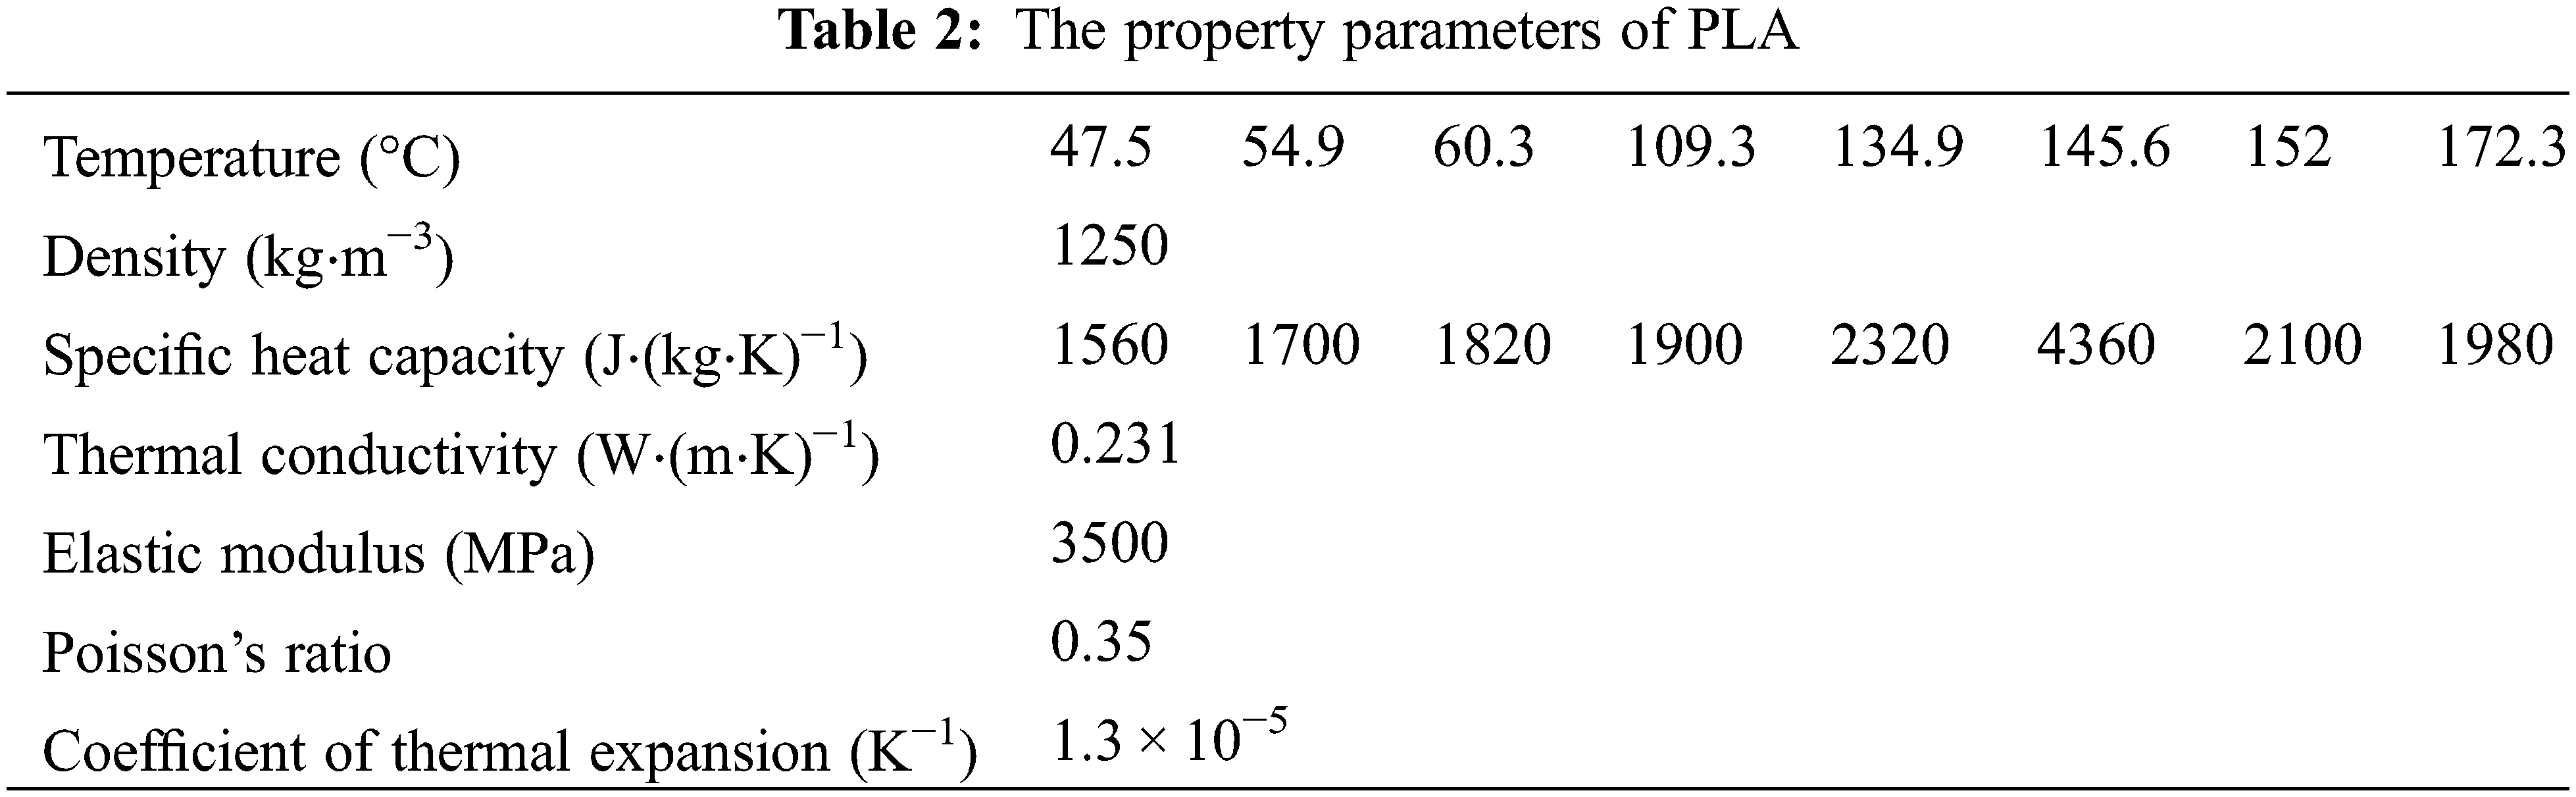
The material chosen for the FDM parts in this paper is Ultimaker PLA RAL 9006 filament. Since the effect of the latent heat of phase change needs to be considered, the abrupt change in specific heat capacity method was used to deal with the latent heat of phase change. The material of the FDM printer base plate is tempered glass, and the material parameters are shown in Table 1 [50]. The material parameters of PLA are shown in Table 2 [31].
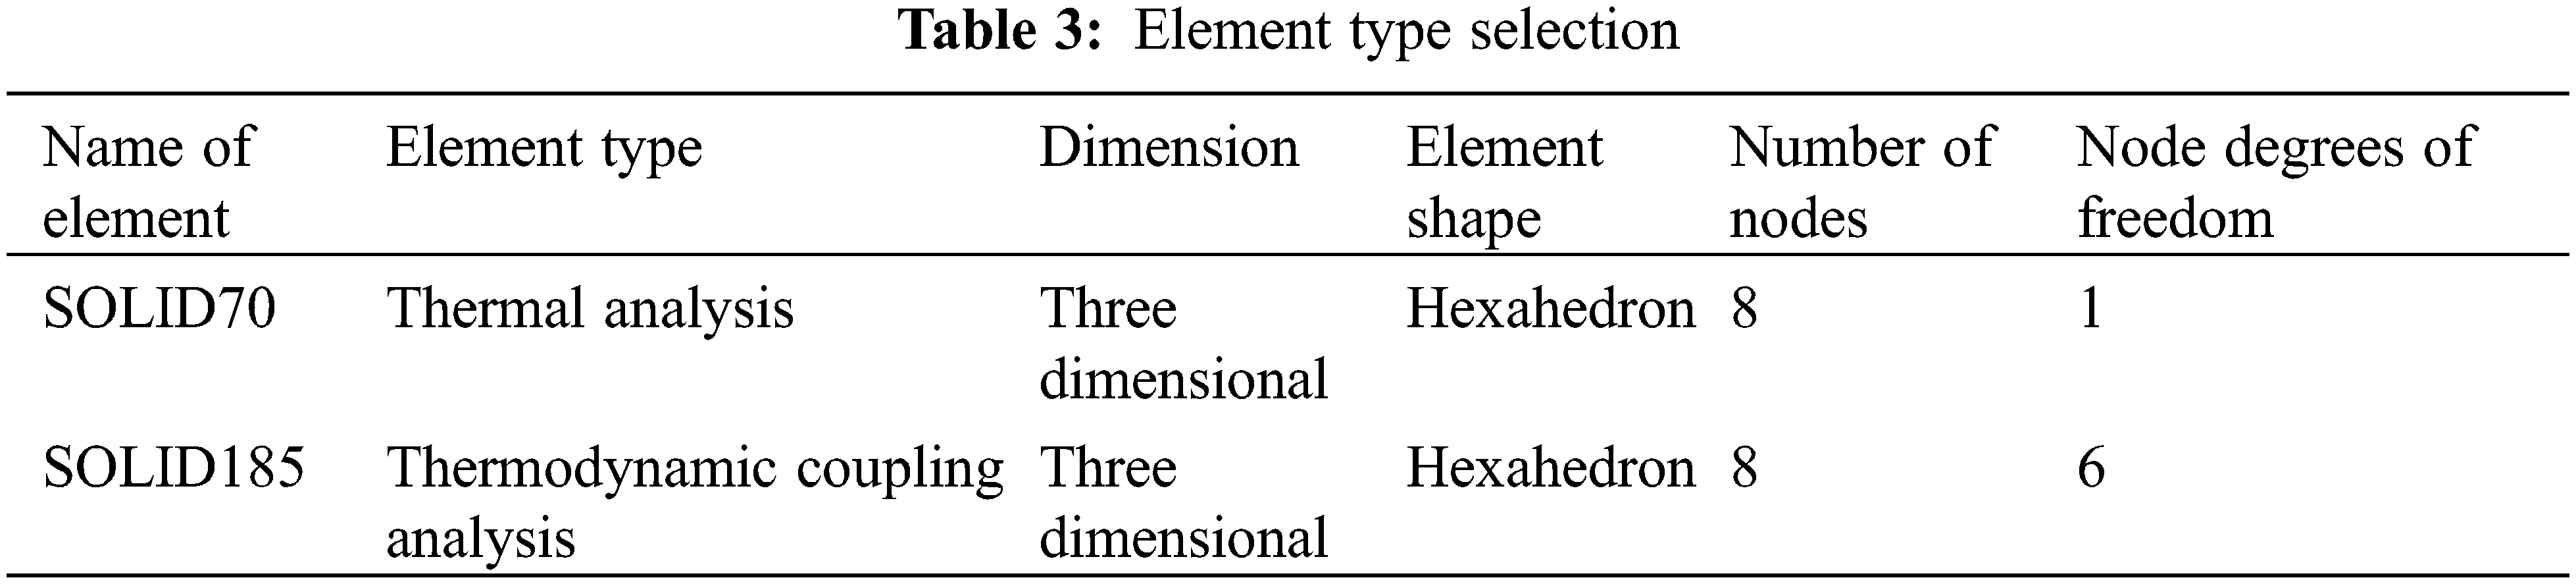
A rectangular part with a dimension of 30 mm × 30 mm × 5 mm was used for simulation. As in Table 3, in the simulation of the temperature field, a SOLID70 type element was used, which has a stable three-dimensional heat transfer capacity [51]. They can be converted to SOLID185 structural elements in the stress field simulations, which can meet the needs of the thermal stress coupled field analysis. All other simulation parameters are the same as the actual printing process, where the infill percentage was set to 100%, the ambient temperature was set to 25°C, the platform temperature was set to 70°C, and the convective heat transfer coefficient was set as 72 W/(m2⋅K).
Different printing parameters were selected for numerical simulation to extract the temperature and stress profiles of the parts. The Mise equivalent stress of the part along transverse direction L1, height direction L2, and oblique L3 (L1, L2, and L3 paths are shown in Fig. 2) were extracted, and the coordinates of the starting point of L1, L2, and L3 are (0, 15, 2.5), (0, 0, 0) and (0, 30, 5), respectively. The effect of the printing path and layer thickness on the temperature field and stress field was analyzed.

Figure 2: Element node selection path for stress analysis
3.1 Temperature and Stress Simulation under Different Printing Paths
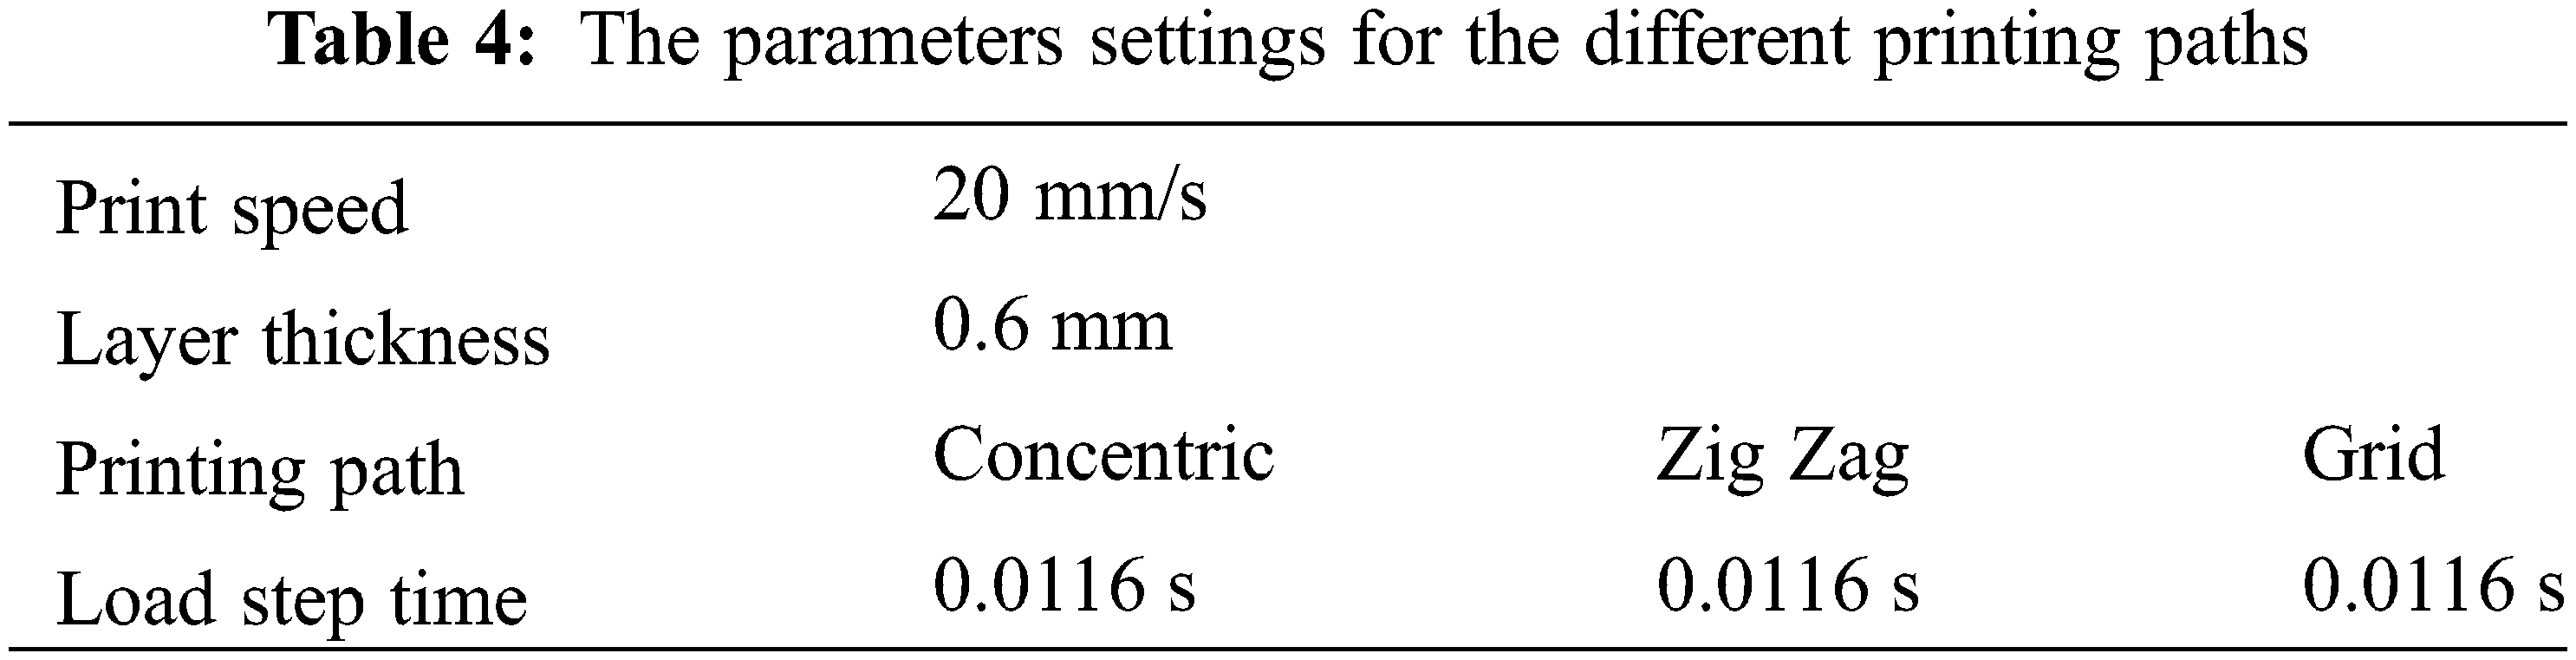
The three representative printing paths are Zig Zag, Concentric, and Grid. As shown in Figs. 3 to 5, the activation sequence of the elements under different printing paths is the same as the nozzle movement path, where the red element is the starting point for each layer, and the blue element is the end point for each layer. Other parameters are shown in Table 4.

Figure 3: Odd layer (a) and even layer (b) of Zig Zag nozzle trajector

Figure 4: Concentric nozzle trajectory

Figure 5: Grid nozzle trajectory
3.1.1 Analysis of the Temperature Field
Fig. 6 shows the temperature profiles along L1, L2, and L3 at the end of printing using three different printing paths. Fig. 6a shows that the maximum temperature fluctuation in the horizontal direction of L1 is 114.845°C for the Grid path. Whereas the temperature fluctuates within 12.915°C along the L1 direction for the Concentric and Zig Zag paths. It can be seen that a uniform temperature distribution can be obtained by printing the Concentric path in a straight line, and also by the reciprocal crossing oblique motion of the Zig Zag. Fig. 6b indicates that the temperature fluctuation for all three printing paths on the L2 direction are within 12.021°C, so the effect of the printing path on the temperature field along height direction can be neglected. In Fig. 6c, for the Concentric path, the nozzle moves from outside to inside in a straight line, and temperature distributes in a circular pattern. The maximum temperature of 178.937°C appears at the center of each layer, and the wall temperature has cooled to 75.542°C. While the temperature change is more dramatic for the Grid path, but the average temperature is 26.723°C lower than that for the Concentric path.

Figure 6: Temperature curves at the time of printing completion under different printing paths (DIST is the distance between the index position and the starting position of L1, L2, and L3)
3.1.2 Analysis of the Stress Field
Figs. 7a–7c show the overall Mise equivalent stress cloud map for the different path parts at the completion of printing. It can be seen from Fig. 7a that when the printing path is Concentric, the average stress in the linear motion area of the nozzle is only 2.14 Mpa. However, this path creates stress concentrations at the diagonal nozzle turns of the part. As the nozzle makes a rectangular movement from the outside to the inside, the side surface cools down the fastest after molding, thus leading to a large stress on the side surface of the part reaching 17.1 Mpa. Fig. 7b shows no significant stress concentration inside the part, with an average stress of 6.96 Mpa. The reason for it is that when the printing path is Zig Zag, the nozzle does an oblique scan without turning inside the part. Fig. 7c found that the center of the part has an elliptical region with a high stress of 8.78 Mpa. The print nozzle exhibits uniform stress distribution within the cross-motion part layer, but there are elliptical regions with high stress at their centers due to the repeated heating of the internal part by the Grid path.

Figure 7: Equivalent stress cloud map at the time of printing completion under different printing paths
Fig. 8 shows the Mises stress curves along L1, L2, and L3 at the end of printing using three different printing paths. Fig. 8a shows that the lateral stress values along L1 are similar for different printing paths. The upward and downward fluctuation in stress along L1 are caused by the nozzle turning at the side of the part for the Zig Zag path, which leads to large fluctuation in stress on the surface of the part. For the Concentric path, the nozzle moves in a straight line, so the overall stress is uniform along L1. After filament deposition begins along L1, the filament is rapidly solidified from the highly elastic state to the glassy state, creating large stress fluctuation due to better heat dissipation conditions. Fig. 8b shows that the stress in the height direction of the part L2 is little affected by the different printing paths. The overall stress in the height direction from the bottom to the top of the part exhibits a decreasing trend and stress concentration occurs at the bottom of the part with a maximum stress of 26.43 MPa. As the increase of the layer number, the filament at the bottom is in a high elastic state (>60°C) on the platform at 70°C, resulting in large internal stress caused by the serious deformation of the bottom filament. And as the increase of layer number, the top filaments can become glassy, causing the stress in the height direction to drop to 6.606 MPa. Fig. 8c shows the stress distribution along L3, the highest stress appears in the Concentric path, reaching a mean value of 8.248 MPa. For the Concentric path, the nozzle moves in a square centripetal way in each layer of the part. The filament is in an unstable state when the internal temperature of the part rises rapidly, causing it to have a high-stress level. The mean value of stress in the Grid path is 6.866 MPa, and the overall temperature in the Grid path is lower than that in the Concentric path, so its overall stress is lower than that in the Concentric path. However, for the Grid path, the nozzle moves in a rectangular reciprocating way, which leads to a high-stress concentration at its diagonal. The overall stress level is only 5.447 MPa when the printing path is Zig Zag, and the stress distribution is more uniform. Because for this path, the nozzle moves in oblique line, and does not turn inside the part. The filament is softened and infiltrated evenly because there is great heat dissipation and no heat build-up in each run. Therefore, there is no significant internal stress concentration.

Figure 8: The equivalent stress of different printing paths L1, L2, L3
4.1 Experimental Protocol and Test Method
An Ultimaker 3D printer was used to print a rectangular body with a dimension of 30 mm × 30 mm × 5 mm. PLA filament was selected as the printing material. The infill percentage, nozzle temperature, and platform temperature were set as 100%, 70°C, and 210°C, respectively.
To verify the reasonableness of the stress simulation results of FDM parts, a corresponding stress measurement system was developed. Fig. 9 shows the constitution of the stress acquisition system. As shown in Fig. 9, the system consist of four BA120-3AA strain gauges used to form a full-bridge circuit, one strain gauge as working gauge, and three strain gauges as temperature compensation gauges. The strain gauges are connected to the YF-3 strain amplifier through a bridge box to release the bridge signal, and finally, the voltage signal is recorded through the USB3106A signal acquisition card. A printed specimen with the same size as the simulation model was built for stress measurement, and an empty slot of 6 mm × 4 mm × 1 mm was reserved at the stress measurement point inside the model. As shown in Fig. 10, when the filament was deposited to the height of the empty slot, printing was paused briefly, and the strain gauge was fixed to the empty slot quickly by 502 glue, after that printing was restarted again.

Figure 9: Stress acquisition system

Figure 10: Strain gauge embedding
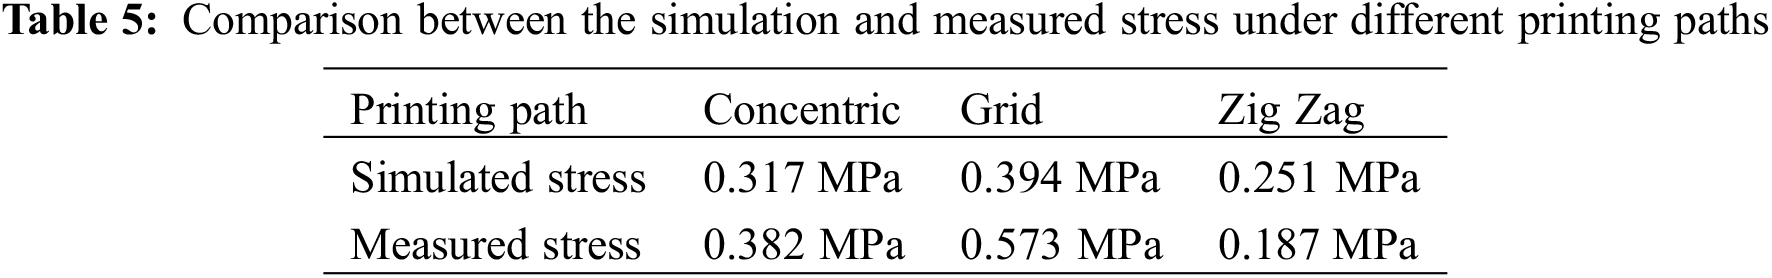
The center point (point A) in the third layer of the FDM printed part was selected as the measurement point. Fig. 11 shows the stress in the simulation model at point A compared with the measured stress for different printing paths. From the figure, it can be seen that the simulated residual stress are stable at 1.433, 1.429, and 1.392 MPa, and the measured residual stress are stable at 0.866, 1.984, and 1.667 MPa after the cooling is completed for Concentric, Grid, and Zig Zag path. The overall trend of stress in the three paths is upward, from negative to positive values. During the printing process of the part, the stress at point A appears to be tensile stress, while after the molding is completed the stress changes to compressive stress, and the part starts the cooling shrinkage process. As the comparison between the simulated and tested average stress under the three printing paths shown in Table 5, it can be found that the average stress in the Zig Zag path is optimal. Therefore, it can be inferred that the Zig Zag printing path is optimal based on the simulation and test results.

Figure 11: Comparison between the simulation and test data under different printing paths
The temperature and stress fields of the FDM forming process of rectangular parts were investigated by simulation and experiment. The effect of different printing paths on the stress formation mechanism in the FDM parts was discussed, and the reasonableness of the numerical simulation results was verified by experimental measurement.
(1) Printing paths have little effect temperature felid along the height direction, and the temperature difference is within 12.096°C. The average internal temperature of the part in Concentric path is higher than that in Zig Zag path. The higher temperature at the center of the part is caused by the accumulation of temperature inside the part during the printing process, reaching a maximum of 178.937°C. Therefore, the heat dissipation at the center of the part should be enhanced during the printing process.
(2) The printing path is the main factor that affects the stress distribution of the part. The simulation test results show that the mean stress is the lowest (0.187 MPa) and most uniform at Zig Zag path compared with those at Concentric and Grid paths. The FDM nozzle will pause at the turn, and stress concentration is caused by the continuously extruded material, so the stress generated at the turn is higher than when printing straight lines. Therefore, it is suggested to reduce the number of turns during the printing process of the part to avoid internal stress imbalance.
(3) In the path planning, the overall heating uniformity should be considered, the nozzle should not stay in a certain area for too long, otherwise, it will cause stress to increase. The oblique scanning path reduces the accumulation of internal stress.
Acknowledgement: This work was supported by Shanxi Province Technology Innovation Guidance Special Project, Shanxi Province Printing and Packaging Key Laboratory Project.
Funding Statement: This work was funded by Shanxi Province Technology Innovation Guidance Special Project (2020QFY03-05), Shanxi Province Printing and Packaging Key Laboratory Project (16JS081).
Conflicts of Interest: The authors declare that they have no conflicts of interest to report regarding the present study.
References
1. Singamneni, S., Roychoudhury, A., Diegel, O., Huang, B. (2012). Modeling and evaluation of curved layer fused deposition. Journal of Materials Processing Technology, 212(1), 27–35. DOI 10.1016/j.jmatprotec.2011.08.001. [Google Scholar] [CrossRef]
2. Aslani, K. E., Kitsakis, K., Kechagias, J. D., Vaxevanidis, N. M., Manolakos, D. E. (2020). On the application of grey taguchi method for benchmarking the dimensional accuracy of the PLA fused filament fabrication process. SN Applied Sciences, 2(6), 1–11. DOI 10.1007/s42452-020-2823-z. [Google Scholar] [CrossRef]
3. Huang, J., Ware, H. O. T., Hai, R., Shao, G., Sun, C. (2021). Conformal geometry and multimaterial additive manufacturing through freeform transformation of building layers. Advanced Materials, 33(11), 2005672. DOI 10.1002/adma.202005672. [Google Scholar] [CrossRef]
4. Tan, D. K., Maniruzzaman, M., Nokhodchi, A. (2018). Advanced pharmaceutical applications of hot-melt extrusion coupled with fused deposition modelling (FDM) 3D printing for personalised drug delivery. Pharmaceutics, 10(4), 203. DOI 10.3390/pharmaceutics10040203. [Google Scholar] [CrossRef]
5. Shahrubudin, N., Lee, T. C., Ramlan, R. (2019). An overview on 3D printing technology: Technological, materials, and applications. Procedia Manufacturing, 35, 1286–1296. DOI 10.1016/j.promfg.2019.06.089. [Google Scholar] [CrossRef]
6. Lee, J., Kim, H. C., Choi, J. W., Lee, I. H. (2017). A review on 3D printed smart devices for 4D printing. International Journal of Precision Engineering and Manufacturing-Green Technology, 4(3), 373–383. DOI 10.1007/s40684-017-0042-x. [Google Scholar] [CrossRef]
7. Khosravani, M. R., Reinicke, T. (2020). On the environmental impacts of 3D printing technology. Applied Materials Today, 20, 100689. DOI 10.1016/j.apmt.2020.100689. [Google Scholar] [CrossRef]
8. Vyavahare, S., Teraiya, S., Panghal, D., Kumar, S. (2020). Fused deposition modelling: A review. Rapid Prototyping Journal, 26 (1), 176–201. DOI 10.1108/RPJ-04-2019-0106. [Google Scholar] [CrossRef]
9. Aguilar-Duque, J. I., Balderrama-Armendáriz, C. O., Puente-Montejano, C. A., Ontiveros-Zepeda, A. S., García-Alcaraz, J. L. (2021). Genetic algorithm for the reduction printing time and dimensional precision improvement on 3D components printed by fused filament fabrication. The International Journal of Advanced Manufacturing Technology, 115(11), 3965–3981. DOI 10.1007/s00170-021-07314-w. [Google Scholar] [CrossRef]
10. Jiménez, M., Romero, L., Domínguez, I. A., Espinosa, M. D. M., Domínguez, M. (2019). Additive manufacturing technologies: An overview about 3D printing methods and future prospects. Complexity, 2019, 1–30. DOI 10.1155/2019/9656938. [Google Scholar] [CrossRef]
11. Drummer, D., Cifuentes-Cuéllar, S., Rietzel, D. (2012). Suitability of PLA/TCP for fused deposition modeling. Rapid Prototyping Journal, 18(6), 500–507. DOI 10.1108/13552541211272045. [Google Scholar] [CrossRef]
12. Mazzanti, V., Malagutti, L., Mollica, F. (2019). FDM 3D printing of polymers containing natural fillers: A review of their mechanical properties. Polymers, 11(7), 1094. DOI 10.3390/polym11071094. [Google Scholar] [CrossRef]
13. Valino, A. D., Dizon, J. R. C., Espera Jr, A. H., Chen, Q., Messman, J. et al. (2019). Advances in 3D printing of thermoplastic polymer composites and nanocomposites. Progress in Polymer Science, 98, 101162. DOI 10.1016/j.progpolymsci.2019.101162. [Google Scholar] [CrossRef]
14. Khorasani, M., Ghasemi, A., Rolfe, B., Gibson, I. (2022). Additive manufacturing a powerful tool for the aerospace industry. Rapid Prototyping Journal, 28(1), 87–100. DOI 10.1108/RPJ-01-2021-0009. [Google Scholar] [CrossRef]
15. Qi, X., Chen, G., Li, Y., Cheng, X., Li, C. (2019). Applying neural-network-based machine learning to additive manufacturing: Current applications, challenges, and future perspectives. Engineering, 5(4), 721–729. DOI 10.1016/j.eng.2019.04.012. [Google Scholar] [CrossRef]
16. Deswal, S., Narang, R., Chhabra, D. (2019). Modeling and parametric optimization of FDM 3D printing process using hybrid techniques for enhancing dimensional preciseness. International Journal on Interactive Design and Manufacturing, 13(3), 1197–1214. DOI 10.1007/s12008-019-00536-z. [Google Scholar] [CrossRef]
17. Cano-Vicent, A., Tambuwala, M. M., Hassan, S. S., Barh, D., Aljabali, A. A. et al. (2021). Fused deposition modelling: Current status, methodology, applications and future prospects. Additive Manufacturing, 47, 102378. DOI 10.1016/j.addma.2021.102378. [Google Scholar] [CrossRef]
18. Mohamed, O. A., Masood, S. H., Bhowmik, J. L. (2015). Optimization of fused deposition modeling process parameters: A review of current research and future prospects. Advances in Manufacturing, 3(1), 42–53. DOI 10.1007/s40436-014-0097-7. [Google Scholar] [CrossRef]
19. Rahim, T. N. A. T., Abdullah, A. M., Md Akil, H. (2019). Recent developments in fused deposition modeling-based 3D printing of polymers and their composites. Polymer Reviews, 59(4), 589–624. DOI 10.1080/15583724.2019.1597883. [Google Scholar] [CrossRef]
20. Rajpurohit, S. R., Dave, H. K. (2018). Effect of process parameters on tensile strength of FDM printed PLA part. Rapid Prototyping Journal, 24(8), 1317–1324. DOI 10.1108/RPJ-06-2017-0134. [Google Scholar] [CrossRef]
21. Dey, A., Yodo, N. (2019). A systematic survey of FDM process parameter optimization and their influence on part characteristics. Journal of Manufacturing and Materials Processing, 3(3), 64. DOI 10.3390/jmmp3030064. [Google Scholar] [CrossRef]
22. Mani, M., Lyons, K. W., Gupta, S. K. (2014). Sustainability characterization for additive manufacturing. Journal of Research of the National Institute of Standards and Technology, 119, 419–428. DOI 10.6028/jres.119.016. [Google Scholar] [CrossRef]
23. Attaran, M. (2017). The rise of 3-D printing: The advantages of additive manufacturing over traditional manufacturing. Business Horizons, 60(5), 677–688. DOI 10.1016/j.bushor.2017.05.011. [Google Scholar] [CrossRef]
24. Yaman, U. (2018). Shrinkage compensation of holes via shrinkage of interior structure in FDM process. The International Journal of Advanced Manufacturing Technology, 94(5), 2187–2197. DOI 10.1007/s00170-017-1018-2. [Google Scholar] [CrossRef]
25. Nazan, M. A., Ramli, F. R., Alkahari, M. R., Abdullah, M. A., Sudin, M. N. (2017). An exploration of polymer adhesion on 3D printer bed. IOP Conference Series: Materials Science and Engineering, 210(1), 012062. DOI 10.1088/1757-899X/210/1/012062. [Google Scholar] [CrossRef]
26. Bento, J. B., Lopez, A., Pires, I., Quintino, L., Santos, T. G. (2019). Non-destructive testing for wire + arc additive manufacturing of aluminium parts. Additive Manufacturing, 29, 100782. DOI 10.1016/j.addma.2019.100782. [Google Scholar] [CrossRef]
27. Lefsky, M. A., Cohen, W. B., Parker, G. G., Harding, D. J. (2002). Lidar remote sensing for ecosystem studies: Lidar, an emerging remote sensing technology that directly measures the three-dimensional distribution of plant canopies, can accurately estimate vegetation structural attributes and should be of particular interest to forest, landscape, and global ecologists. BioScience, 52(1), 19–30. DOI 10.1641/0006-3568(2002)052[0019:LRSFES]2.0.CO;2. [Google Scholar] [CrossRef]
28. Zhang, Y., Chou, Y. K. (2006). Three-dimensional finite element analysis simulations of the fused deposition modelling process. Proceedings of the Institution of Mechanical Engineers, Part B: Journal of Engineering Manufacture, 220(10), 1663–1671. DOI 10.1243/09544054JEM572. [Google Scholar] [CrossRef]
29. Wang, T. M., Xi, J. T., Jin, Y. (2007). A model research for prototype warp deformation in the FDM process. The International Journal of Advanced Manufacturing Technology, 33(11), 1087–1096. DOI 10.1007/s00170-006-0556-9. [Google Scholar] [CrossRef]
30. Zhou, X., Hsieh, S. J., Sun, Y. (2017). Experimental and numerical investigation of the thermal behaviour of polylactic acid during the fused deposition process. Virtual and Physical Prototyping, 12(3), 221–233. DOI 10.1080/17452759.2017.1317214. [Google Scholar] [CrossRef]
31. Yang, H., Zhang, S. (2018). Numerical simulation of temperature field and stress field in fused deposition modeling. Journal of Mechanical Science and Technology, 32(7), 3337–3344. DOI 10.1007/s12206-018-0636-4. [Google Scholar] [CrossRef]
32. Zhang, J., Wang, X. Z., Yu, W. W., Deng, Y. H. (2017). Numerical investigation of the influence of process conditions on the temperature variation in fused deposition modeling. Materials & Design, 130, 59–68. DOI 10.1016/j.matdes.2017.05.040. [Google Scholar] [CrossRef]
33. Zhou, Y. R., Qiu, X. L., Hu, M., Li, J. (2018). The thermal stress simulation of the part caused by layer thickness and deposition velocity in FDM process. Key Engineering Materials, 764, 115–122. DOI 10.4028/www.scientific.net/KEM.764.115. [Google Scholar] [CrossRef]
34. Cattenone, A., Morganti, S., Alaimo, G., Auricchio, F. (2019). Finite element analysis of additive manufacturing based on fused deposition modeling: Distortions prediction and comparison with experimental data. Journal of Manufacturing Science and Engineering, 141(1), 011010. DOI 10.1115/1.4041626. [Google Scholar] [CrossRef]
35. Samy, A. A., Golbang, A., Harkin-Jones, E., Archer, E., McIlhagger, A. (2021). Prediction of part distortion in fused deposition modelling (FDM) of semi-crystalline polymers via COMSOL: Effect of printing conditions. CIRP Journal of Manufacturing Science and Technology, 33, 443–453. DOI 10.1016/j.cirpj.2021.04.012. [Google Scholar] [CrossRef]
36. El Moumen, A., Tarfaoui, M., Lafdi, K. (2019). Modelling of the temperature and residual stress fields during 3D printing of polymer composites. The International Journal of Advanced Manufacturing Technology, 104(5), 1661–1676. DOI 10.1007/s00170-019-03965-y. [Google Scholar] [CrossRef]
37. de Macedo, R. Q., Ferreira, R. T. L. (2017). Residual thermal stress in fused deposition modelling. Proceedings of the 24th ABCM International Congress of Mechanical Engineering, pp. 3–8. Curitiba, Brazil. [Google Scholar]
38. Xia, H., Lu, J., Tryggvason, G. (2018). Fully resolved numerical simulations of fused deposition modeling. Part II–solidification, residual stresses and modeling of the nozzle. Rapid Prototyping Journal, 24(6973–987. DOI 10.1108/RPJ-11-2017-0233. [Google Scholar] [CrossRef]
39. Bellehumeur, C., Li, L., Sun, Q., Gu, P. (2004). Modeling of bond formation between polymer filaments in the fused deposition modeling process. Journal of Manufacturing Processes, 6(2), 170–178. DOI 10.1016/S1526-6125(04)70071-7. [Google Scholar] [CrossRef]
40. Domingo-Espin, M., Puigoriol-Forcada, J. M., Garcia-Granada, A. A., Llumà, J., Borros, S. et al. (2015). Mechanical property characterization and simulation of fused deposition modeling polycarbonate parts. Materials & Design, 83, 670–677. DOI 10.1016/j.matdes.2015.06.074. [Google Scholar] [CrossRef]
41. Fitzharris, E. R., Watanabe, N., Rosen, D. W., Shofner, M. L. (2018). Effects of material properties on warpage in fused deposition modeling parts. The International Journal of Advanced Manufacturing Technology, 95(5), 2059–2070. DOI 10.1007/s00170-017-1340-8. [Google Scholar] [CrossRef]
42. Gurrala, P. K., Regalla, S. P. (2014). Part strength evolution with bonding between filaments in fused deposition modelling. Virtual and Physical Prototyping, 9(3), 141–149. DOI 10.1080/17452759.2014.913400. [Google Scholar] [CrossRef]
43. Sang, X., Yuan, Z., Yu, X., Xiao, G., Sadiq, M. T. et al. (2021). Simultaneous stable control of temperature field distribution uniformity and consistency for multi-temperature zone systems. Transactions of the Institute of Measurement and Control, 43(9), 2069–2080. DOI 10.1177/0142331221989849. [Google Scholar] [CrossRef]
44. Agmon, S., Douglis, A., Nirenberg, L. (1964). Estimates near the boundary for solutions of elliptic partial differential equations satisfying general boundary conditions II. Communications on Pure and Applied Mathematics, 17(1), 35–92. DOI 10.1002/(ISSN)1097-0312. [Google Scholar] [CrossRef]
45. Guo, X. (1997). Prediction of selected mechanical properties of ferrous alloys through computational modeling of solidification (Ph.D. Thesis). The University of Alabama, USA. [Google Scholar]
46. Rinaldi, M., Ghidini, T., Cecchini, F., Brandao, A., Nanni, F. (2018). Additive layer manufacturing of poly (ether ether ketone) via FDM. Composites Part B: Engineering, 145, 162–172. DOI 10.1016/j.compositesb.2018.03.029. [Google Scholar] [CrossRef]
47. Bikas, H., Stavropoulos, P., Chryssolouris, G. (2016). Additive manufacturing methods and modelling approaches: A critical review. The International Journal of Advanced Manufacturing Technology, 83(1–4), 389–405. DOI 10.1007/s00170-015-7576-2. [Google Scholar] [CrossRef]
48. Liu, Z., Wang, Y., Wu, B., Cui, C., Guo, Y. et al. (2019). A critical review of fused deposition modeling 3D printing technology in manufacturing polylactic acid parts. The International Journal of Advanced Manufacturing Technology, 102(9), 2877–2889. DOI 10.1007/s00170-019-03332-x. [Google Scholar] [CrossRef]
49. Solomon, I. J., Sevvel, P., Gunasekaran, J. (2021). A review on the various processing parameters in FDM. Materials Today: Proceedings, 37, 509–514. DOI 10.1016/j.matpr.2020.05.484. [Google Scholar] [CrossRef]
50. Huang, T. T., Zhang, D. W., Zhao, Y. X., Liu, J. J., Li, J. H. (2019). Comprehensive appraisal of the safety of hidden frame glass curtain wall based on fuzzy theory. Journal of Building Engineering, 26, 100863. DOI 10.1016/j.jobe.2019.100863. [Google Scholar] [CrossRef]
51. Prasanna, P., Rao, B. S., Rao, G. (2010). Finite element modeling for maximum temperature in friction stir welding and its validation. The International Journal of Advanced Manufacturing Technology, 51(9), 925–933. DOI 10.1007/s00170-010-2693-4. [Google Scholar] [CrossRef]