Materials
| Journal of Renewable Materials |
DOI: 10.32604/jrm.2021.015536
ARTICLE
An Experimental and Analytical Study on Cross-Laminated Bamboo Rocking Walls with Friction Dampers
1Key Laboratory of Concrete and Prestressed Concrete Structures of the Ministry of Education, Southeast University, Nanjing, 210096, China
2Key Laboratory of Deep Underground Science and Engineering (Ministry of Education), College of Architecture and Environment, Sichuan University, Chengdu, 610065, China
*Corresponding Author: Ye Liu. Email: liu.ye@scu.edu.cn
Received: 25 December 2020; Accepted: 14 February 2021
Abstract: Cross-laminated bamboo (CLB) have a high strength to weight ratio and stable bidirectional mechanical properties. Inspired by the investigation on cross-laminated timber (CLT) rocking walls, CLB rocking walls with conventional friction dampers (CFDs) are studied in this paper. To investigate the mechanical properties of the CLB rocking wall, seven tests are conducted under a cyclic loading scheme, and different test parameters, including the existence of the CFDs, the moment ratio, and the loading times, are discussed. The test results show a bilinear behavior of the CLB rocking wall. The small residual displacements of the CLB rocking wall demonstrate an idealized self-centering capacity. The cumulative energy dissipation curves indicate that the energy dissipation capacity of the CLB rocking wall can be greatly improved with CFDs. The limit states of the CLB rocking wall under a lateral force are proposed based on the strains, stress, and damage level of the CLB material and posttensioned rebar. In addition, an analytical model of the CLB rocking wall is developed based on the proposed limit states of the CLB rocking wall to evaluate the hysteretic response of the CLB rocking wall, and the model is validated by the experimental data. The comparison results show the potential value of the analytical model for engineering design.
Keywords: Cross-laminated bamboo (CLB); rocking wall; friction dampers; self-centering; posttensioned rebar
Due to the advantages of a small residual deformation and good energy dissipation ability, self-centering structures have become popular among existing seismic structures. The self-centering structure is designed to return to its initial position after the external loading is removed and achieve a flag-shaped hysteretic behavior. The self-centering mechanism is usually achieved through “rocking”, which was first introduced by Priestley [1]. The rocking wall (a kind of self-centering structure) is fulfilled by relaxing restraints between the wall and foundation, and was first used in concrete structures. EI-Sheikh et al. [2] investigated a type of unbonded posttensioned precast concrete wall and demonstrated the good self-centering capacity of the structure. Furthermore, Kurama [3] addressed the use of supplemental viscous damping to reduce the drift of rocking walls without losing the self-centering capacity. Holden et al. [4] and Restrepo et al. [5] also conducted tests on concrete rocking walls. Tests of the precast concrete rocking walls and a comprehensive discussion of the mechanical properties have demonstrated the effectiveness of such structural forms for seismic resistance. Perez et al. [6] introduced a design-oriented analytical model that used simple formulae to estimate the behavior of unbonded posttensioned precast concrete walls. The finite element model of the unbonded posttensioned concrete walls has been developed [7], and the performance-based design approach based on the tests and mechanical model was applicable for dynamic time-history analysis [8−10]. Furthermore, there have recently been several experimental and numerical studies using different dampers to improve the energy dissipation capacity of concrete rocking wall systems and reduce wall damage [11−13].
In addition to concrete rocking walls, cross-laminated timber (CLT) rocking walls, which mainly use coniferous wood or hardwood as the raw material, have also been deeply studied. In the test of CLT rocking walls conducted by Sarti et al. [14], the rocking walls showed good self-centering capacities, with only small damage observed in the CLT walls. To improve the energy dissipation capacity, slip-friction dampers were adopted by Fitzgerald et al. [15] in the CLT rocking wall. The test results showed that slip-friction dampers were reliably designed to dissipate energy while protecting the CLT rocking wall from damage. Furthermore, the combination of self-centering resilient slip friction (RSF) dampers and rocking walls was proposed by Hashemi et al. [16] Large-scale tests on a rocking CLT wall with RSF dampers were also tested by Hashemi et al. [17], which confirmed that the RSF damper has the potential to be used in earthquake-resistant low- and mid-rise CLT structures. It was determined that the residual displacements of CLT rocking walls were at most 50% of that of conventional CLT shear walls under a seismic load, resulting in smaller damage of the CLT rocking walls than the conventional CLT shear walls [18]. To examine the dynamic behavior of a mass-timber building system with CLT rocking walls at full scale, Blomgren et al. [19] and Pei et al. [20] at the Natural Hazards Engineering Research Infrastructure (NHER) program conducted a series of shake table tests. The test results showed that the building was able to recenter with no unintended structural damage.
As a traditional structural material, bamboo [21−23] is convenient to obtain locally and is usually utilized in local houses in China, with such advantages as a high strength, a low water swelling ratio, a low cost, environmental friendliness, and recyclability [24−26]. However, the mechanical properties of raw and unprocessed bamboo are unstable. To utilize the advantages and eliminate the discreteness of the mechanical properties of bamboo, cross-laminated bamboo [27−29] (CLB), which was inspired by CLT research, is proposed. The CLB is made from layers of bamboo laminates glued together in an orthogonal pattern, which has a high strength to weight ratio and stable bidirectional mechanical properties. Additionally, the products of bamboo flattening—A type of imperfection-free bamboo boards [30] can also be used as the raw material for CLB. Such attributes make CLB suitable for seismic structures, especially self-centering structures.
To the best of the authors’ knowledge, the study of CLB rocking walls is still limited. To improve the understanding of the CLB rocking structure, seven tests of the CLB rocking wall were conducted. The test parameters included the existence of conventional friction dampers (CFDs), the moment ratio, and the loading times. The hysterical curves, energy dissipation capacity, self-centering capacity, and prestressed force of posttensioned rebars were discussed. Furthermore, the limit states of the CLB wall were defined, and the analytical model of the CLB wall was established based on the proposed limit states.
The CLB rocking wall, with dimensions of 1500 mm × 1000 mm × 100 mm (length × width × height), was made of five layers of bamboo laminates (see Fig. 1). Each layer of bamboo laminate had a thickness of 20 mm. The CLB rocking wall was glued with resorcinol adhesive and cold-pressed for 4 hours under a pressure of 1.5 MPa. The grain directions of the adjacent bamboo laminates were orthogonal. The grains of the outer and center bamboo laminates ran vertically, which consisted of 10 bamboo scrimber strips with dimensions of 1500 mm × 100 mm × 20 mm (length × width × thickness). The other layers of the bamboo laminates were in the transverse direction, which consisted of 15 bamboo scrimber strips with dimensions of 1000 mm × 100 mm × 20 mm. A rectangular channel with a cross-section size of 200 mm × 24 mm was reserved at the center of the wall (see Fig. 1b). The CLB rocking wall was mounted on a 2000 mm × 350 mm × 400 mm steel base beam via two posttensioned high-strength threaded rebars with a diameter of 18 mm passing through the rectangular channel (see Fig. 1c). The bottom corners of the CLB rocking wall were cut away at a size of 150 mm by 340 mm for the installation of two conventional friction dampers (CFDs).
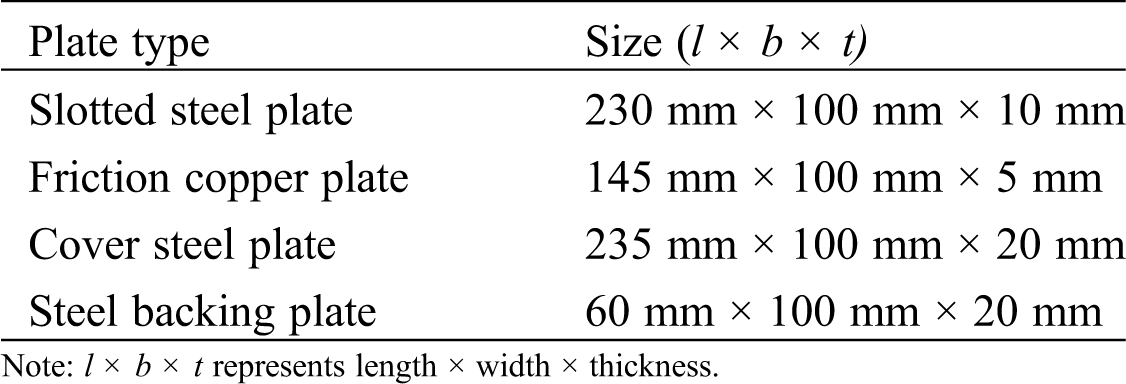
The CFD was comprised of a slotted steel plate, two friction copper plates, two cover steel plates, a steel backing plate, and high strength bolts (see Fig. 2). The dimensions of all plates are listed in Tab. 1. The displacement limit of the friction damper was 20 mm, i.e., the length of the slotted hole. Overhanging plates were welded to the steel bracket of the CLB rocking wall to clamp the CFDs, and the connecting plates were attached to the steel base beam to clamp the cover steel plates (see Fig. 1d).
When the overturning moment resistance at the base of the wall provided by the initial prestressed force of the posttensioned rebar and gravity load was overcome by the applied overturning moment (that is, the CLB wall began to rock), the posttensioned rebars worked as the source for structural self-centering by providing the restoring force, and the CFDs provided the energy dissipation capacity for the structure by the friction forces caused by the relative movement between the slotted plate and the friction copper plates.
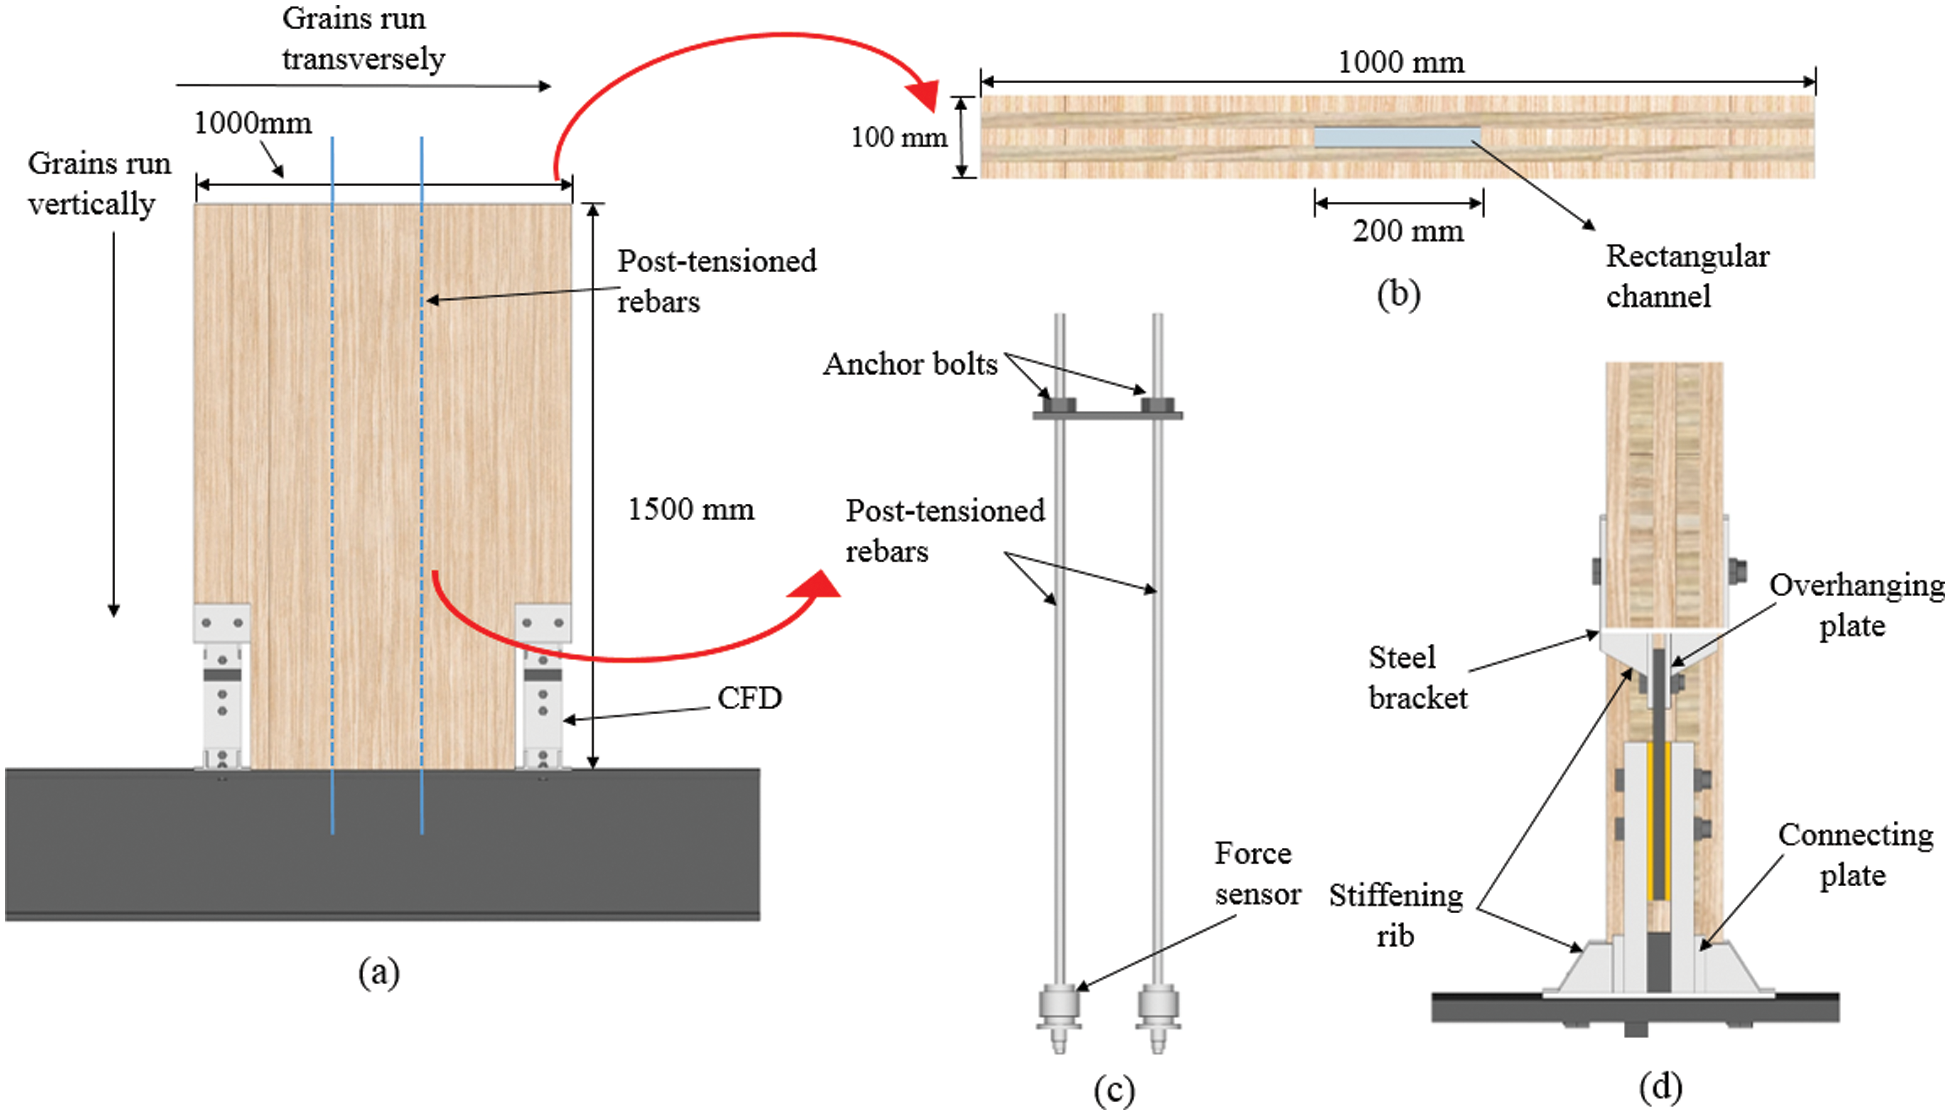
Figure 1: Diagram of the CLB rocking wall and the connection details
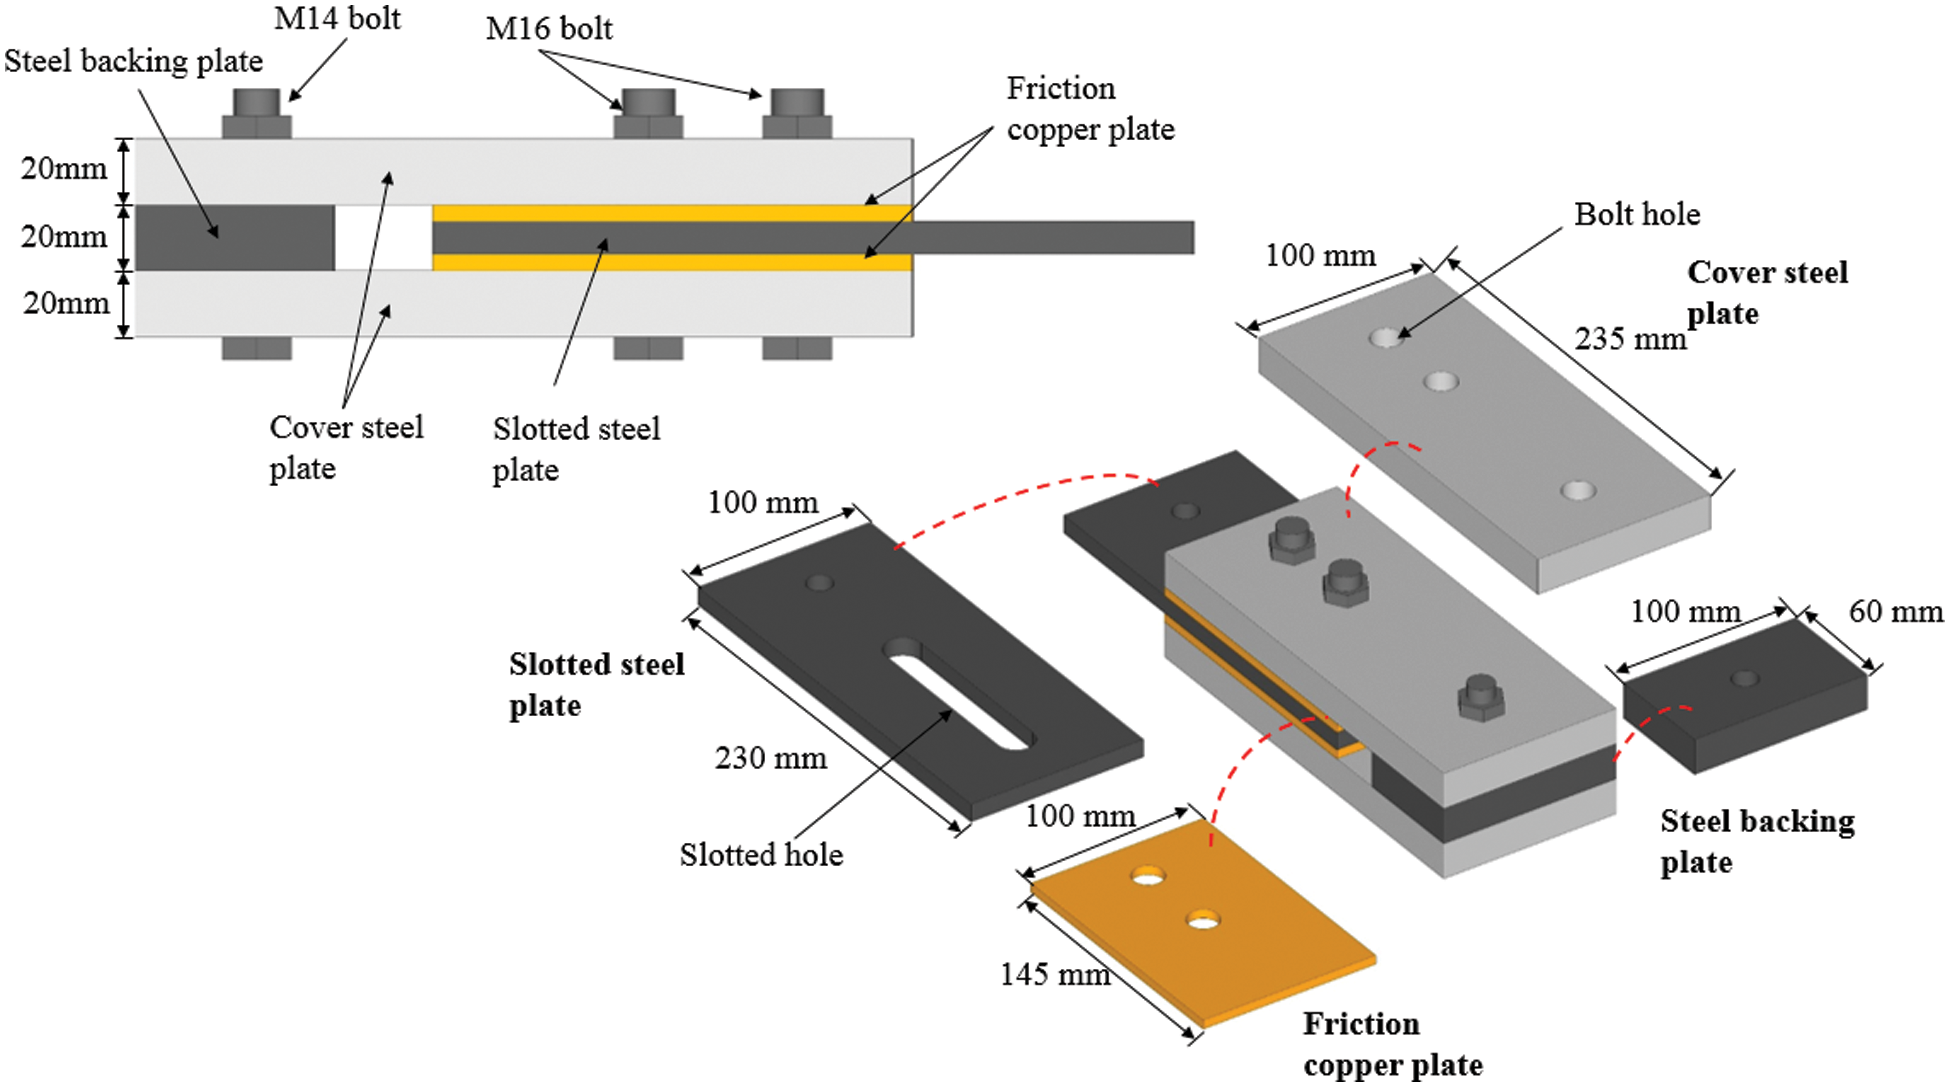
Figure 2: Details of the friction damper
Table 1: Dimensions of the CFD
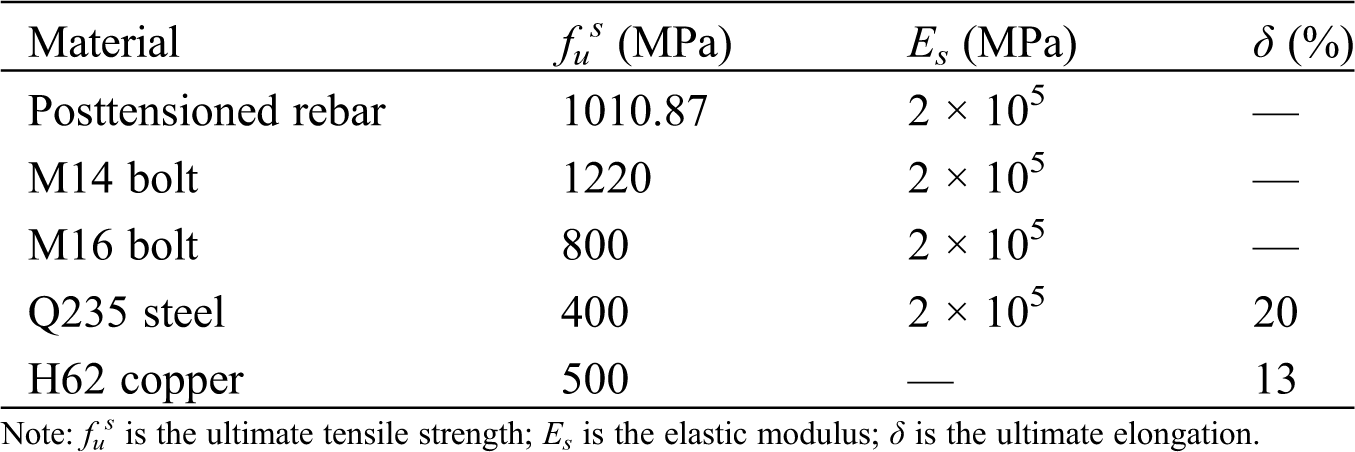
The laminate with dimensions of 1500 mm × 1000 mm × 20 mm (length × width × thickness) in the wall was made of bamboo scrimber with a moisture content of 9%, measured by the water content measuring instrument before the test, and a density of 1.15 g/cm3, provided by the manufacturer. Material tests were performed on the bamboo scrimber samples and other specimens used in the test, including posttensioned high-strength threaded rebars, M14 bolts, and M16 bolts. The bending elastic modulus parallel to grain E and the ultimate strength parallel to grain fu of the bamboo scrimber were estimated from the three-point bending test on bamboo scrimber specimens with dimensions of 20 mm × 20 mm × 180 mm, per Chinese timber standards GB/T 1936.2-2009 [31] and GB/T 1936.1-2009 [32], respectively, since no current bamboo standards could be referred to. In addition, the bending elastic modulus perpendicular to grain E’ and the modulus of elasticity in compression perpendicular to grain E90 were estimated as E/10 and E0/30, respectively [33]. The modulus of elasticity in compression parallel to grain E0 of the bamboo scrimber was estimated from compression tests on bamboo scrimber specimens with dimensions of 20 mm × 20 mm × 60 mm per Chinese timber standard GB/T 15777-2017 [34]. The shear modulus parallel to the grain G of the bamboo scrimber was calculated by adopting the method of separating rigidity [35]. The shear modulus perpendicular to grain G’ was estimated as G/10 [33]. Tension tests were conducted on the posttensioned rebars and bolts per GB/T 22315-2008 [36] and GB/T 20065-2006 [37]. The material test results are shown in Tabs. 2 and 3. Q235 steel and H62 copper were used in the CFD, and the material properties of the CFD plates provided by the manufacturer are listed in Tab. 3.
Table 2: Material properties of the bamboo scrimber

Table 3: Material properties of the posttensioned rebar, bolts, and CFD
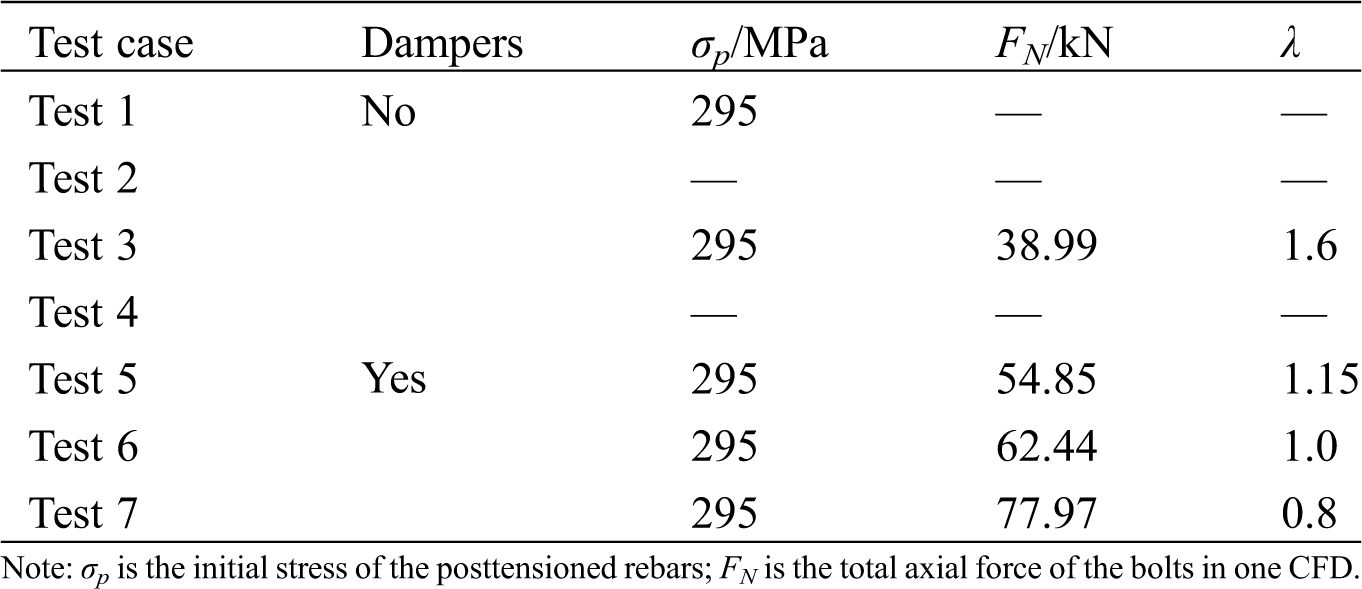
A total of seven test cases were performed on the CLB rocking wall under a cyclic loading scheme. The test matrix is shown in Tab. 4. The test parameters included the existence of friction dampers, the moment ratio, and the loading times. To investigate the effect of the relation between the bending moments provided by the posttensioned rebars and the CFDs, the moment ratio λ proposed in the New Zealand standard NZS-3101 [38] is used, as expressed in Eq. (1).
where Mpt is the moment contribution of the prestressed force in posttensioned rebars; MN is the moment contribution of the axial load, i.e., the gravity load of the CLB wall panel; and MS represents the moment contribution of the energy dissipation device, i.e., the CFDs. In this test, the moment ratio was changed by controlling the axial force of the high-strength bolts in the CFDs. The total axial force of the bolts in one CFD, FN, is shown in Tab. 4. The New Zealand standard [38] considers the superstrength of materials and indicates that the moment ratio of the concrete self-centering connections should be greater than 1.15 to ensure the self-centering capacity.
Tests 1 and 2 were conducted with no CFDs, while tests 3–7 were conducted with CFDs. Tests 3 and 5 were designed to satisfy the New Zealand standard, where the values of λ were set as 1.6 and 1.15, respectively. Tests 6 and 7 were designed to explore the limit value of the moment ratio, which ensures the self-centering capacity of the CLB rocking wall. In addition, the initial prestressed force of the posttensioned rebar was controlled to be consistent under tests 1, 3, 5, 6, and 7 by the supplementary tension for the posttensioned rebar at the beginning of each test, whereas supplementary tension was not conducted in tests 2 and 4 to explore the variation in the mechanical properties of the CLB rocking wall under repeated loading.
Table 4: Design parameters of the CLB rocking wall
2.4 Test Setup and Data Collection
The testing device for the low-cycle loading of the CLB rocking wall is shown in Fig. 3. The lateral load was applied to the CLB rocking wall via an MTS electronic hydraulic actuator at a height of 1.34 m from the top of the base beam. To minimize the potential out-of-plane movement of the CLB wall during the test and to keep the wall in the vertical position, lateral supports were set on the two sides of the CLB rocking wall (see Fig. 3a).
The forces of the posttensioned rebar were measured via force sensors with a measurement range of 300 kN positioned at the bottom of the wall. A linear variable differential transformer (LVDT) (D1) was placed at the same height as the centerline of the hydraulic actuator to measure the lateral displacement of the wall, and another LVDT (D2) was placed on the side of the steel base beam to monitor the possible lateral rigid displacement of the CLB rocking wall system. All forces and displacements were collected at a frequency of 1 Hz using the TEST data acquisition instrument.
Displacement-controlled loading was adopted throughout the test. To check the workability of the equipment and testing device, story drifts of 0.07%, 0.1%, and 0.13% were first applied to the CLB rocking wall, and each story drift level was conducted once. Three repeated cycles were performed for story drifts of 0.2%, 0.27%, 0.4%, 0.6%, 0.8%, 1%, and 1.3%. To avoid the plasticity of posttensioned rebar during loading, the maximum story drift was designed as 1.3% in this study. The loading speed was 0.2 mm/s, and the cyclic loading pattern is shown in Fig. 4.
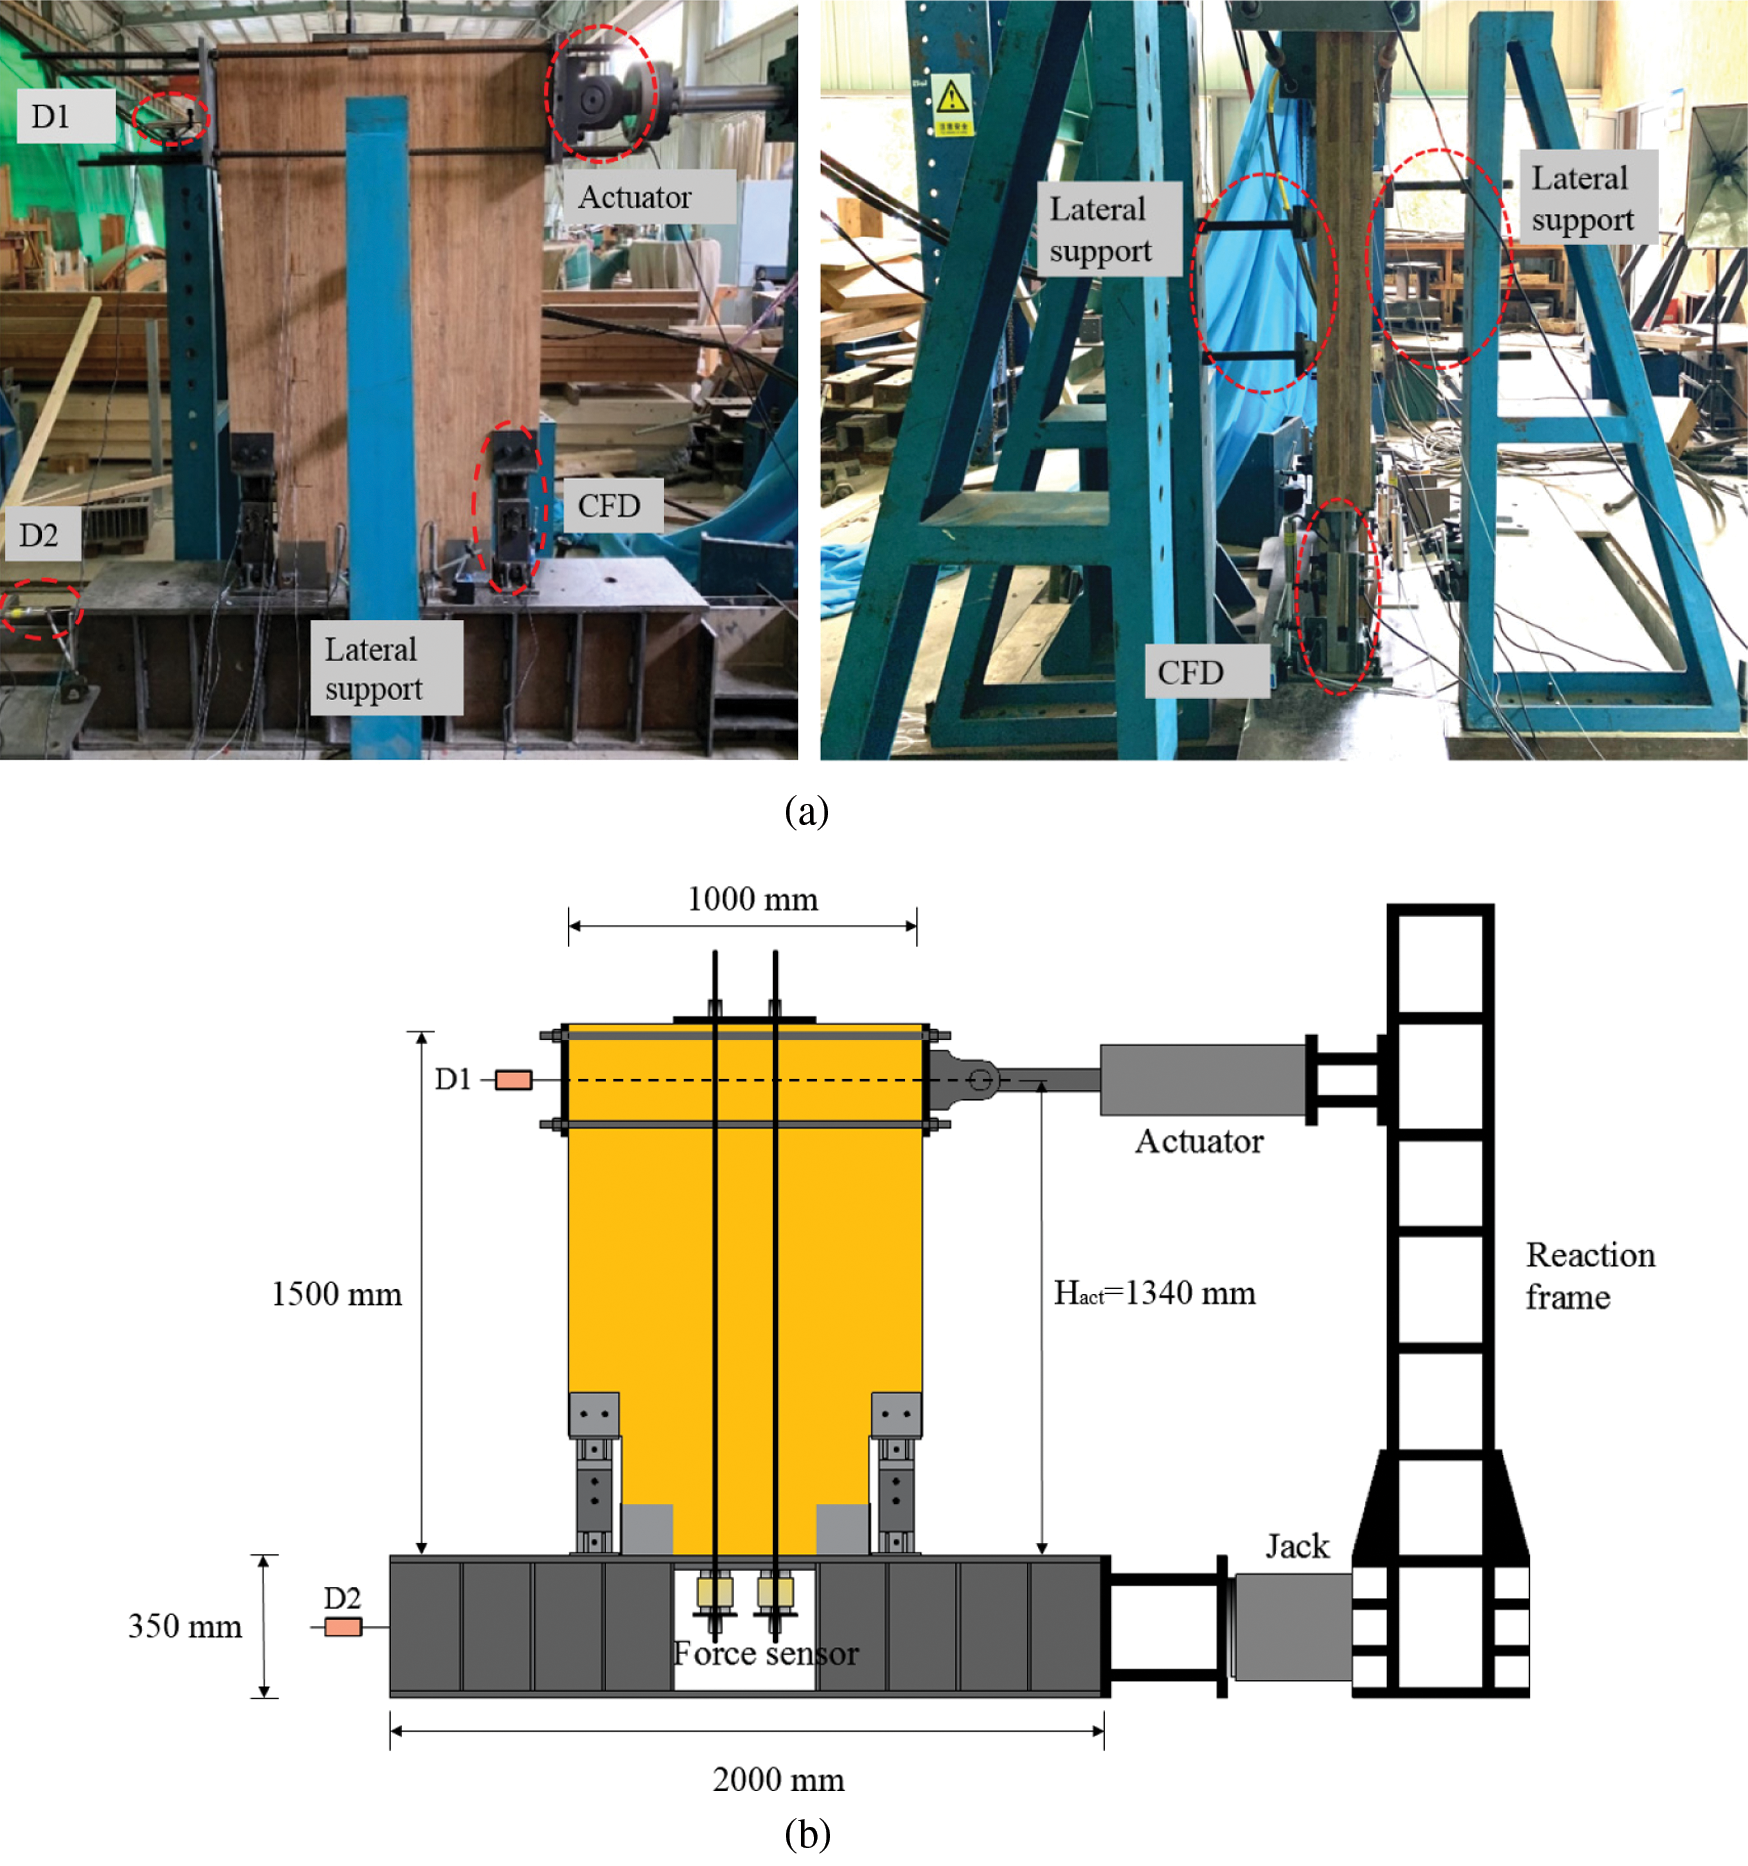
Figure 3: Diagram of the testing device and instrumentation arrangement (a) Testing device (b) Instrumentation arrangement
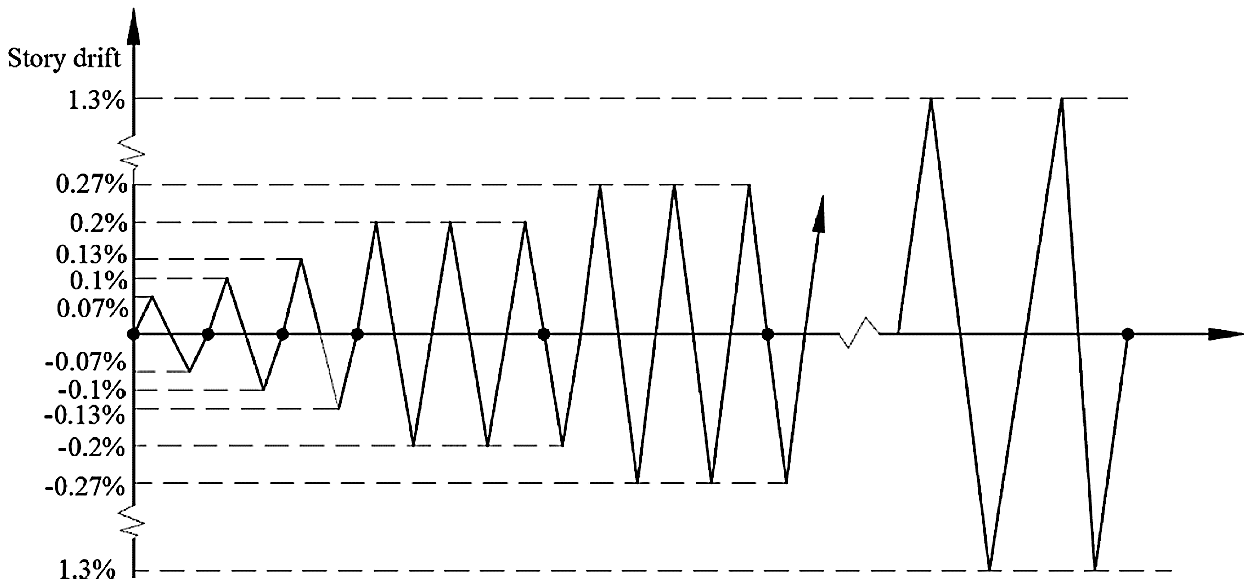
Figure 4: Loading pattern
3.1 Hysteretic Curves of the CLB Walls
The load-displacement responses of all tested CLB walls are shown in Fig. 5. In the graphs shown, the readings from the actuator are plotted against the displacements measured by D1 (at the actuator level). Fig. 5 shows that the behavior of the CLB wall was stable over multiple cycles of loading, and no stiffness degradation occurred. A bilinear behavior was observable for all tests, and the displacements of the stiffness turning points O1 were approximately consistent in tests 1–7, which had a 0.45% story drift. Additionally, the hysteretic curves were non-centrosymmetric in the first quadrant with curves in the third quadrant due to the installation error of the CFDs. The CLB rocking wall exhibited a flag-shaped hysteretic behavior in tests 3–7, resulting from the energy dissipation capacity of the system provided by CFDs. The flag-shaped hysteretic curves became plumper as the moment ratio decreased to 0.8 (test 7). This was achieved by respecting the fact that the increase in the moment contribution of the CFDs resulted in a higher energy dissipation capacity for the system.
The maximum lateral forces of tests 1–7 are shown in Tab. 5, in which Pmax+ represents the maximum force in the positive direction, corresponding to a maximum story drift of 1.3% (left), and Pmax- represents the maximum force in the negative direction (right). It can be seen in Tab. 5 that the CFDs provided a bearing capacity improvement of 16% for the system by comparing the Pmax+ values of tests 1 and 3. Pmax+ in test 2 was equal to that in test 1, while the difference in Pmax+ of test 4 and test 3 was no more than 5%, which demonstrated that repeated loading had hardly any effect on the bearing capacity of the CLB wall. The greatest Pmax+ and Pmax- were observed in test 7, which were 5% and 13% larger than those of test 3, respectively, indicating that a smaller moment ratio improved the bearing capacity of the system.
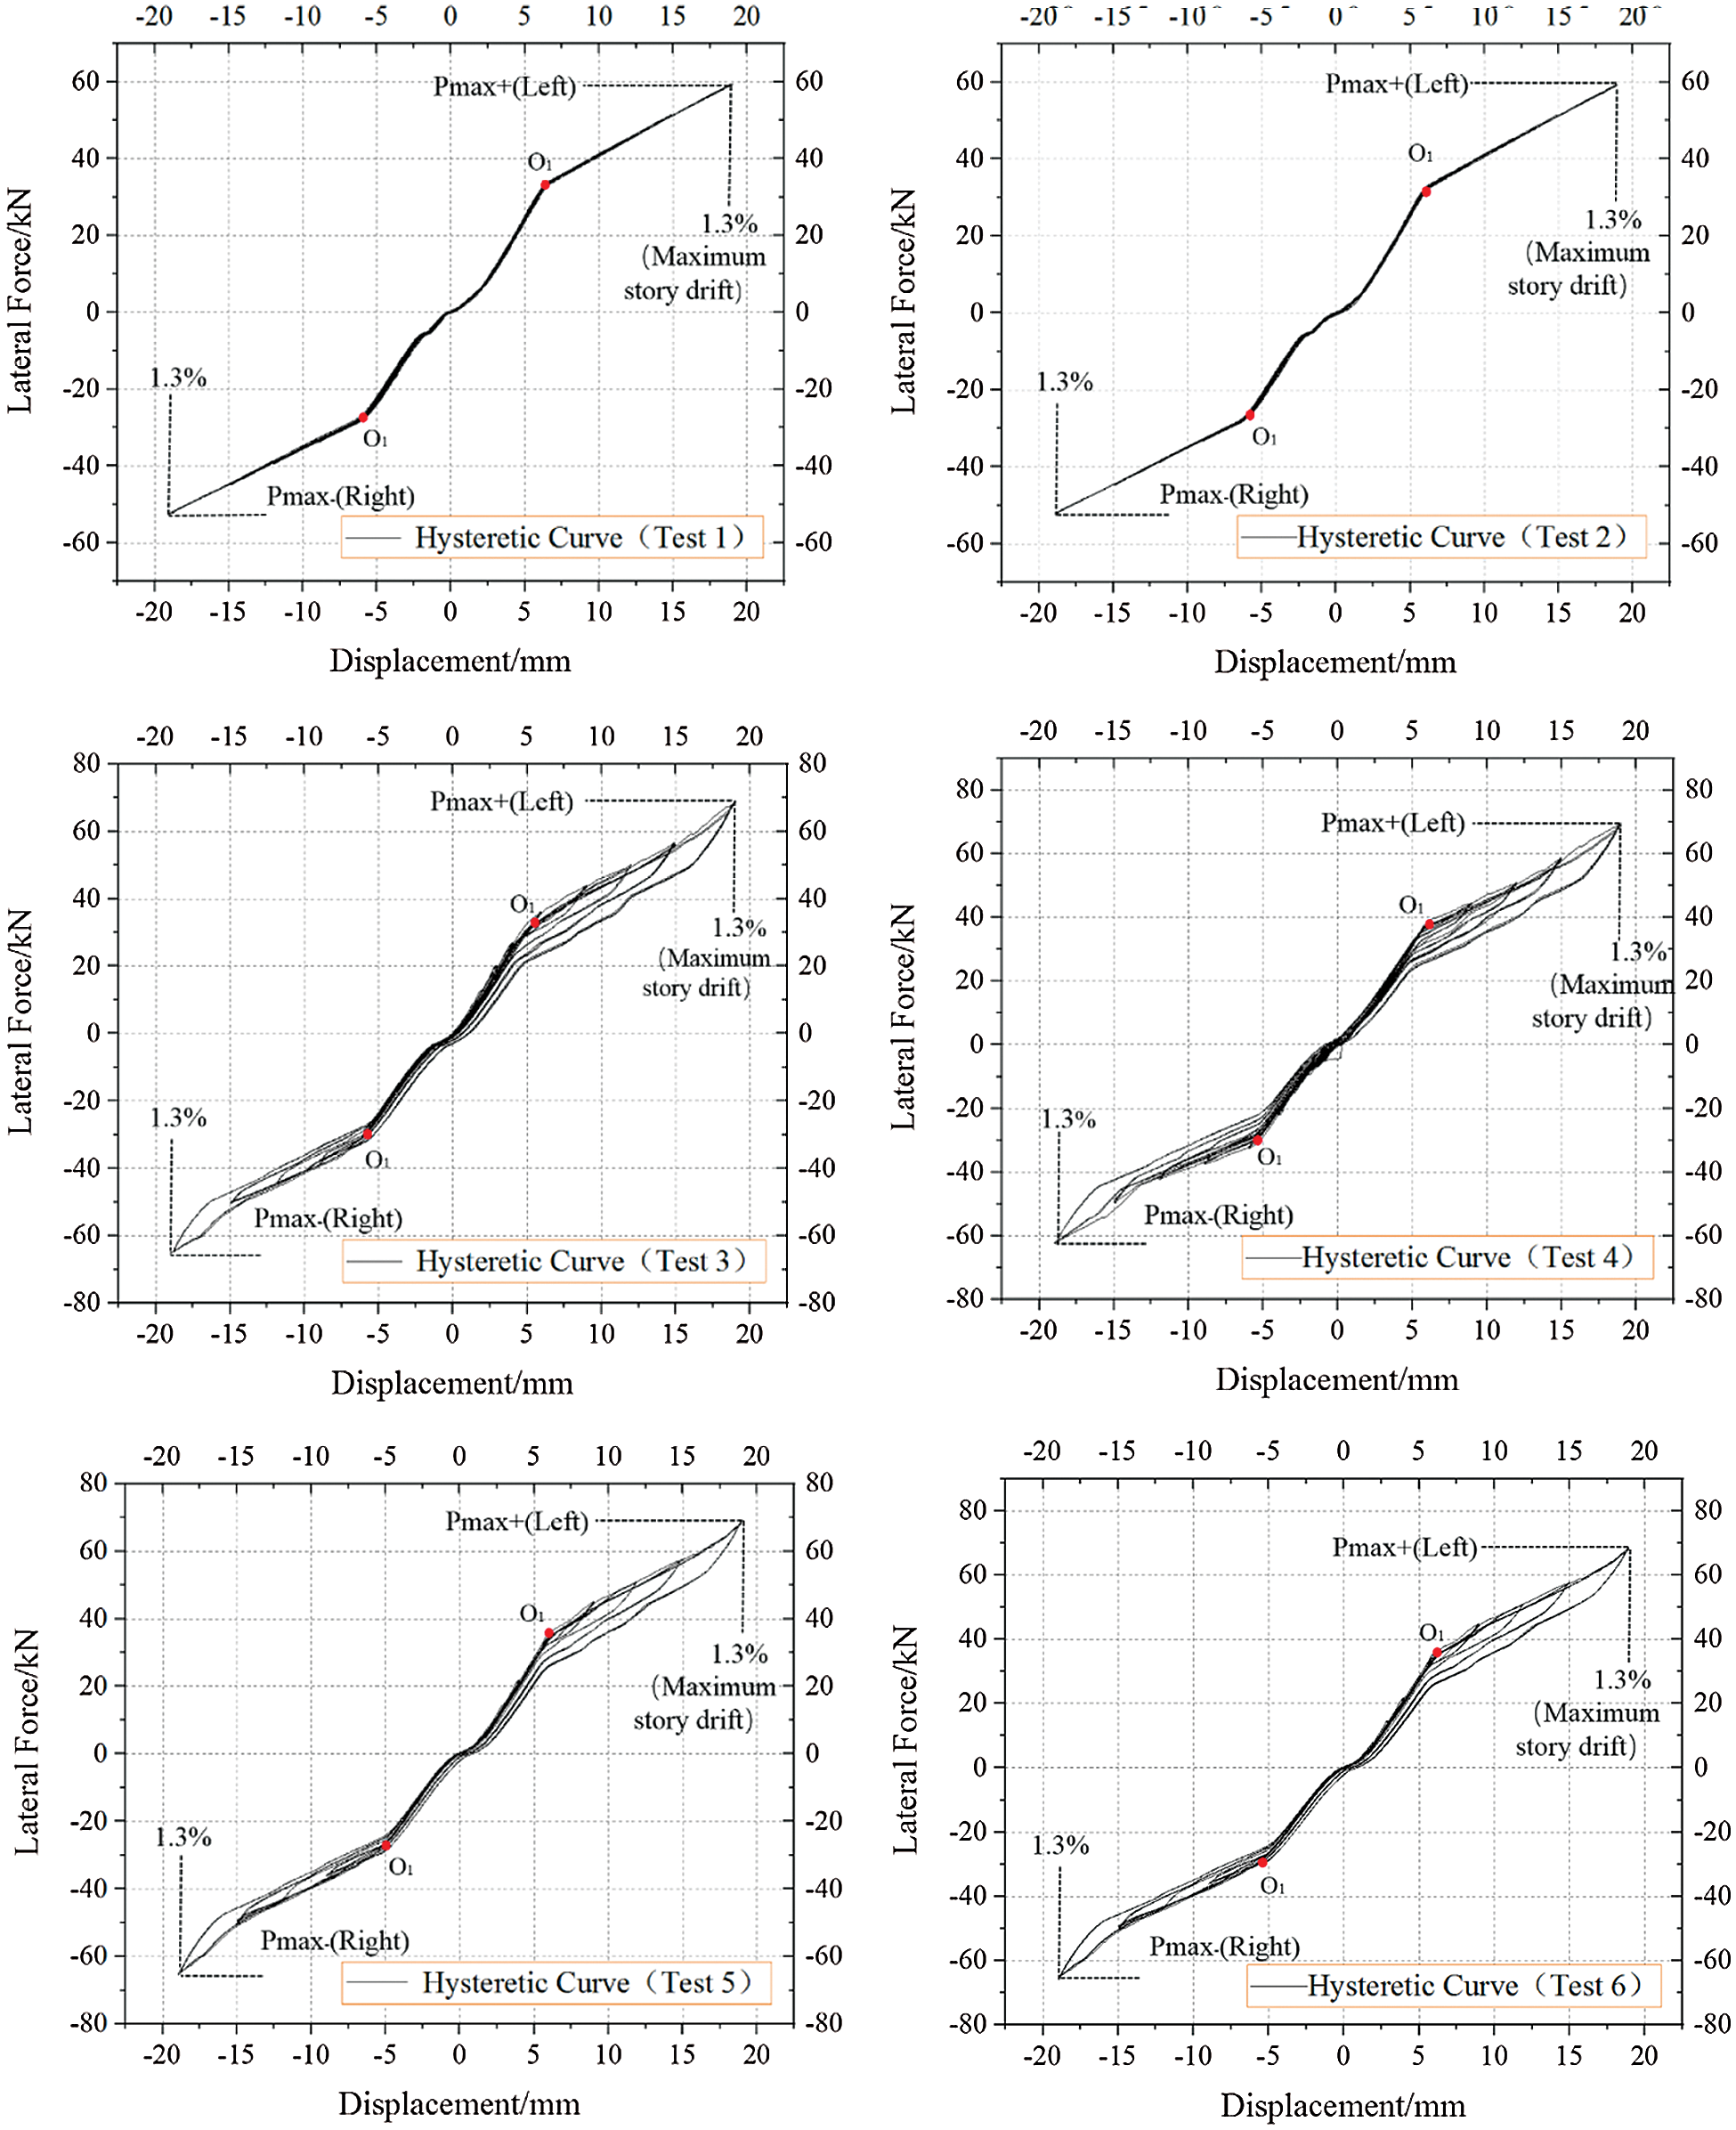
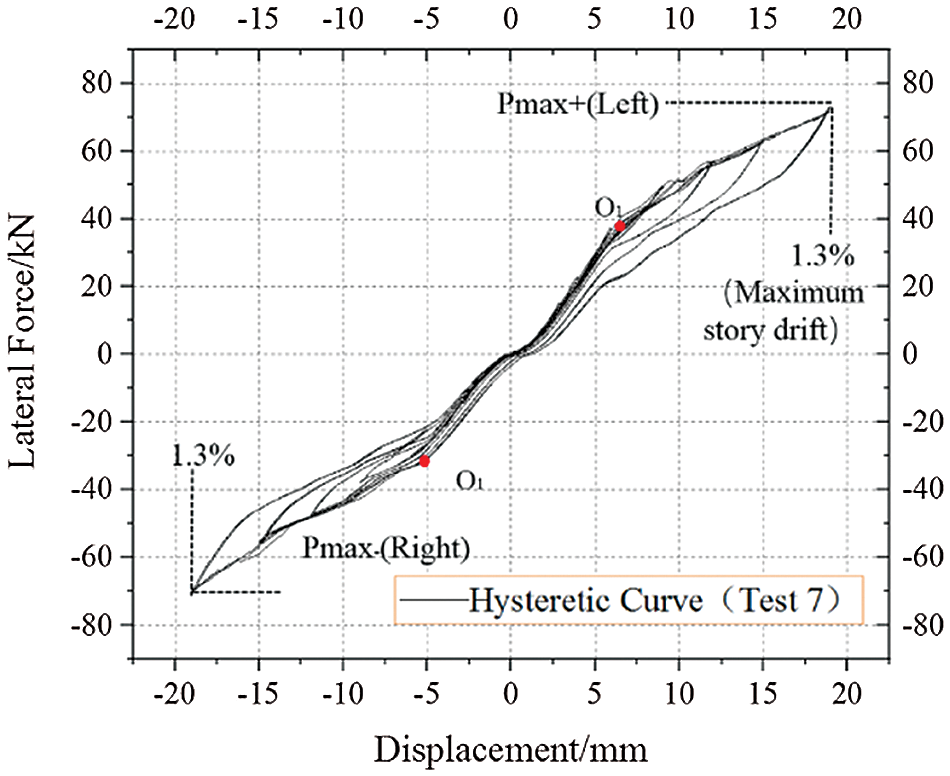
Figure 5: Hysteretic curves of the system
Table 5: Maximum forces of all tests
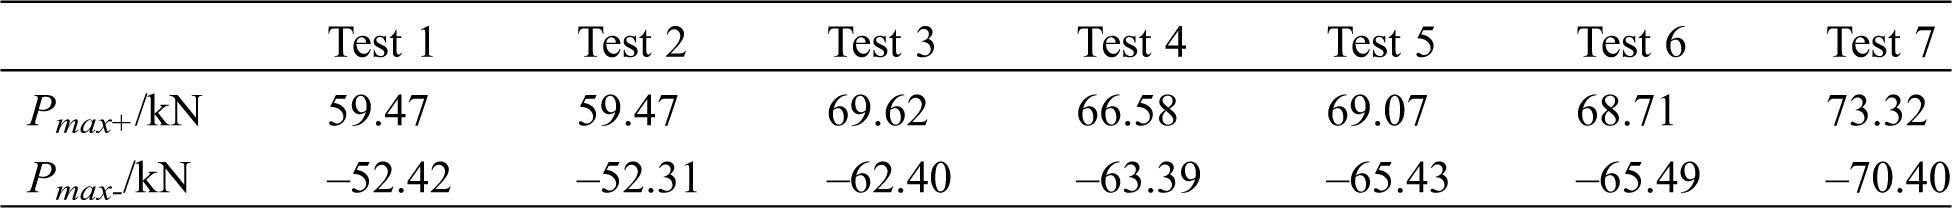
The self-centering capacity of the CLB rocking wall is quantified through the relative self-centering efficiency (RSE), which expresses the percentage of the peak displacement that is recoverable [39]. The RSE is defined as Eq. (2).
where ures+ and ures- are the positive and negative residual displacements, respectively. umax+ and umax- are the positive and negative maximum displacements, respectively. The ures+ and umax+ took positive values while the ures- and umax- took negative values. RSE = 1 represents a complete self-centering capacity of the system, while RSE = 0 represents no self-centering capacity. The RSE values versus the story drift curves for tests 1–7 are shown in Fig. 6. In the initial loading stage where umax+ and umax- were small, the existence of ures+ and ures- resulted in relatively small RSE values. The RSE values of tests 1 and 2 were 0.988 at the 1.3% story drift, which demonstrated an almost complete self-centering capacity of the CLB wall without CFDs. The RSE values of tests 3–7 ranged between 0.965 and 0.976 at the 1.3% story drift, demonstrating that the CFDs slightly weakened the self-centering capacity as the friction force affected the unloading process. The RSE value of test 7 was 0.965, which was smaller than that of tests 3–6, showing that a greater moment ratio reduced the self-centering capacity of the system. However, the self-centering capacity in test 7 is also acceptable. It was also determined that the loading times did not affect the self-centering capacity, as the RSE value of test 2 was equal to that of test 1, and only a 0.4% difference could be observed between test 3 (0.970) and test 4 (0.974) at the 1.3% story drift. The RSE value of test 6 and test 7 were 0.976 and 0.965, respectively, which demonstrated that the moment ratio 1.0 and 0.8 could also ensure the self-centering capacity of the CLB rocking wall. In general, the RSE values of tests 1–7 were greater than 0.96, which confirmed the excellent self-centering capacity of the CLB walls in the present study.
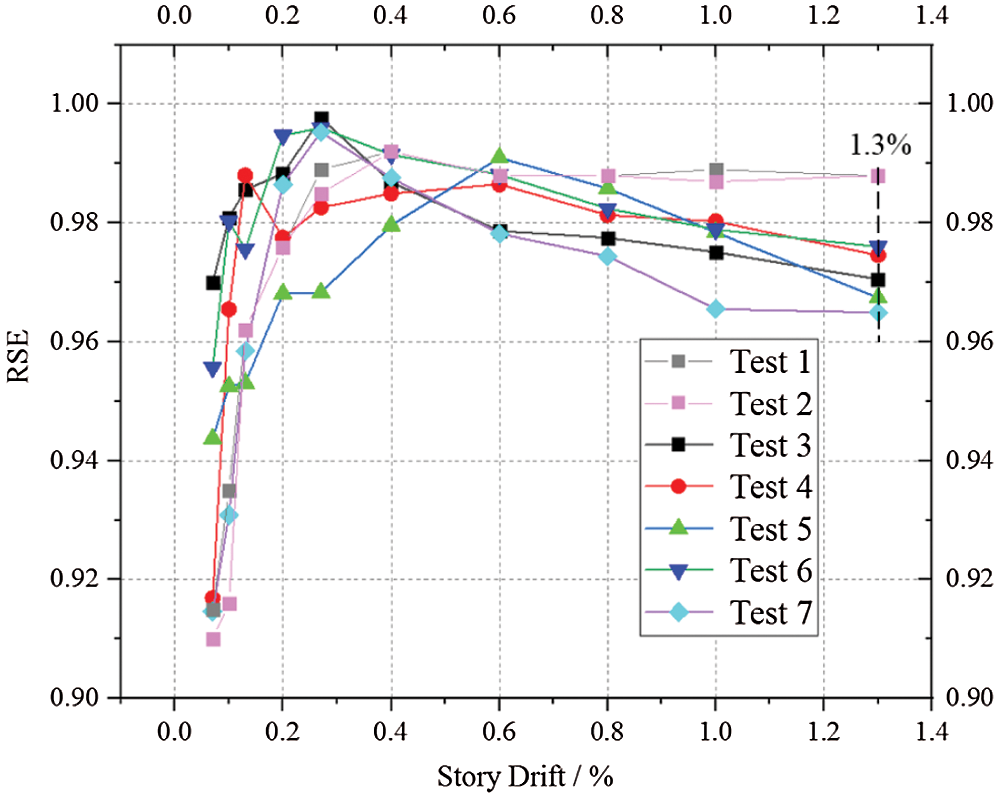
Figure 6: Relative self-centering efficiency of all tests
3.3 Energy Dissipation Capacity
The cumulative energy dissipation (CED) is defined as the area enclosed by the hysteretic loops, reflecting the energy dissipation capacity of the system. The CEDs of tests 1–7 are shown in Fig. 7. The CED versus the story drift curves of tests 1 and 2 were approximately horizontal lines. This phenomenon indicated an extremely small energy dissipation capacity of the system without CFDs. The energy dissipation of the posttensioned rebar in test 1 was 14.57 N•m, while the total energy dissipation of test 1 was 125 N•m at a 1.3% story drift. It is obvious that the energy dissipation capacity of the CLB rocking wall without CFDs was mainly provided by the deformation of the rocking wall. The CED of test 3 was 11 times larger than that of test 1 at a 1.3% story drift, affirming that CFDs played a major role in the contribution of energy dissipation. The loading times affected the energy dissipation capacity of the system, to a certain degree, as the CEDs of tests 3 and 4 were 1420 N•m and 1316 N•m at 1.3% story drift, respectively. The energy dissipation capacity of the system reached a peak when the moment ratio decreased to 0.8, as the CED of test 7 was over 2000 N•m, 45% larger than that of test 3.
The curves of tests 3-7 were approximately horizontal when the story drift was below 0.2%. It can be reasonably assumed that the rocking of the CLB wall was initiated until the 0.2% story drift. Furthermore, the CEDs of tests 3-7 increased sharply after a story drift of 0.8%, especially in test 7.
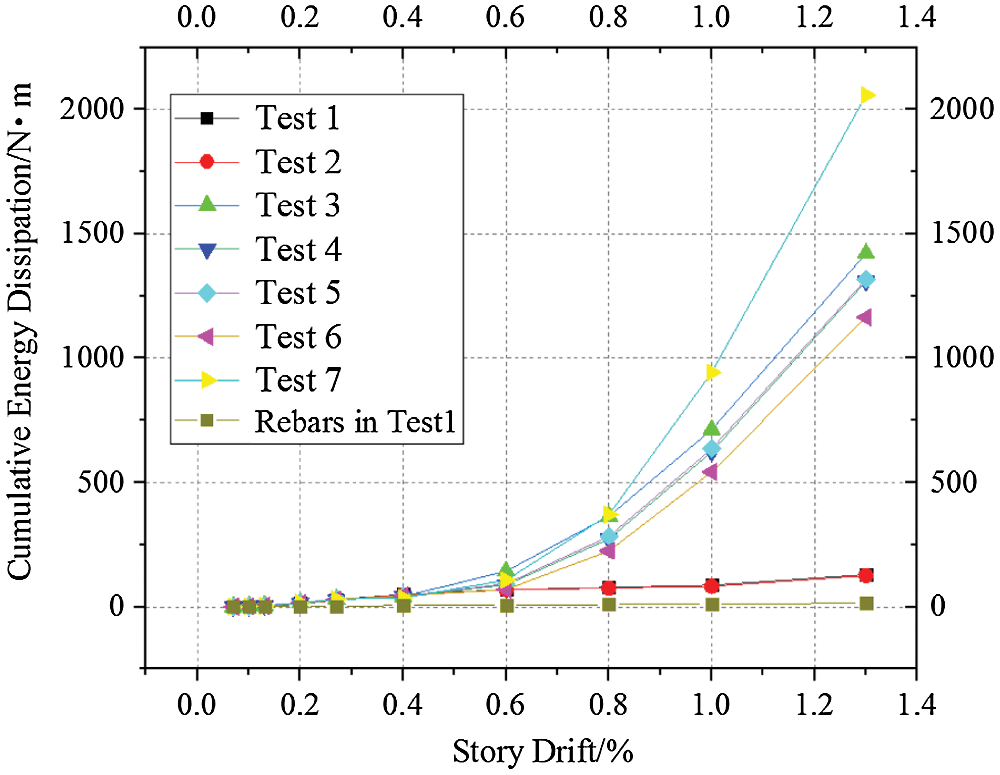
Figure 7: Cumulative energy dissipation versus story drift curves
3.4 Relationship between the Posttensioned Rebar Force and Story Drift
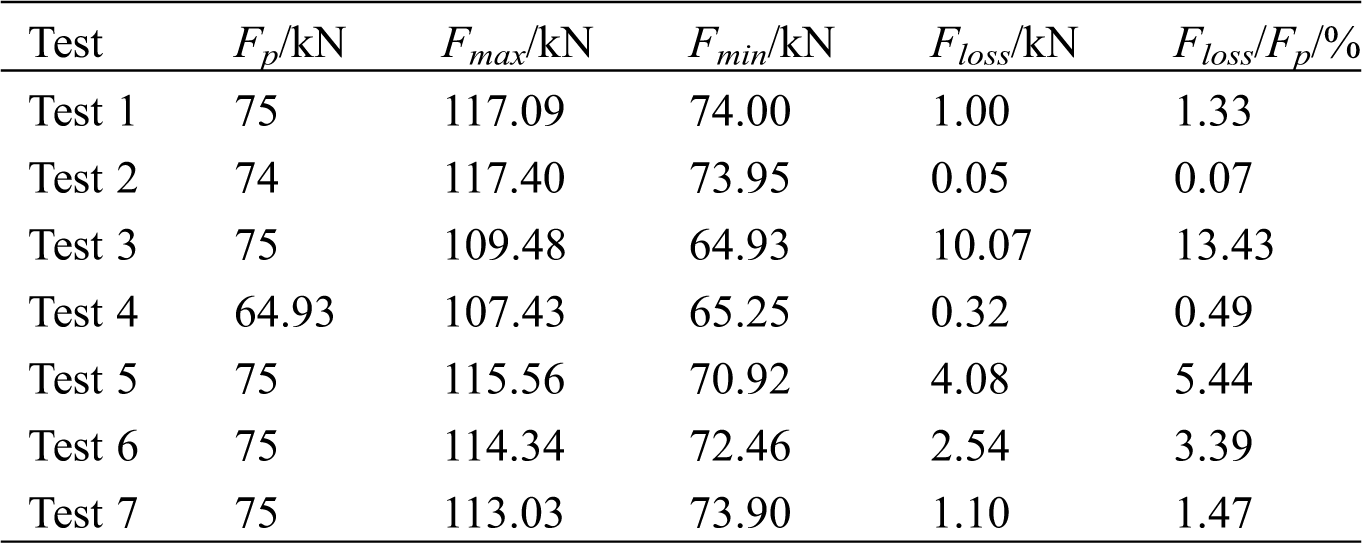
Tab. 6 shows the prestressed forces of the posttensioned rebars measured by force sensors in tests 1–7, in which Fp is the initial prestressed force, Fmax and Fmin are the maximum and minimum of the prestressed forces measured during the test, respectively, and Floss represents the prestressed force loss, which is calculated as Fp minus Fmin. The posttensioned rebar remained elastic in the test, as Fmax was far less than the yield force of the posttensioned rebar (201 kN). The Floss ranged from 0.05 kN to 10.07 kN in the test, which was caused by the deformation of the anchorage bolts and the steel plate (see Fig. 8). Floss/Fp in test 3 was 13.43%, and in other tests, it ranged from 0.07% to 5.44%. The largest Floss was observed in test 3 (10.07 kN), whereas the CFDs, loading times, and moment ratio did not affect the prestressed force loss. This phenomenon is explained as follows. Test 3 was first conducted in all tests, where the greatest deformation of the anchorage bolts and the steel plate was developed. The prestressed force loss decreased obviously after the first loading test (test 3), which indicated a relatively small deformation development of the anchorage bolts and the steel plate in the subsequent tests.
The prestressed force during the entire loading process in test 1 is plotted against the story drift (see Fig. 9). The prestressed force grew rapidly after the story drift of 0.2% due to the uplift in the CLB rocking wall. The relative sliding between the posttensioned rebars and the anchorage bolts mainly occurred at unloading point O2, resulting in a significant decrease in the prestressed force. The small area enclosed by the hysteretic loops of the curve demonstrates the small energy dissipation capacity provided by the posttensioned rebar, corresponding to the discussion in Section 3.3.
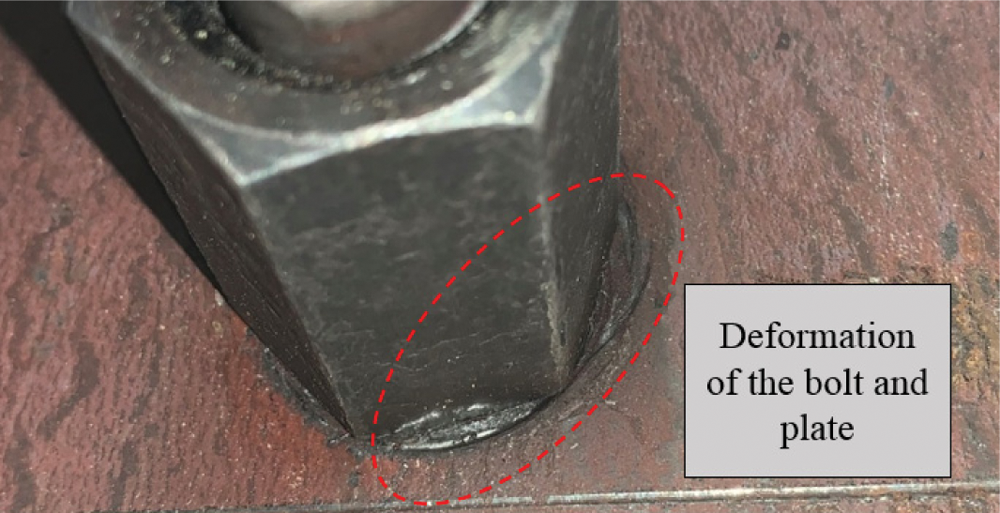
Figure 8: Deformation of the anchorage bolts and the plate
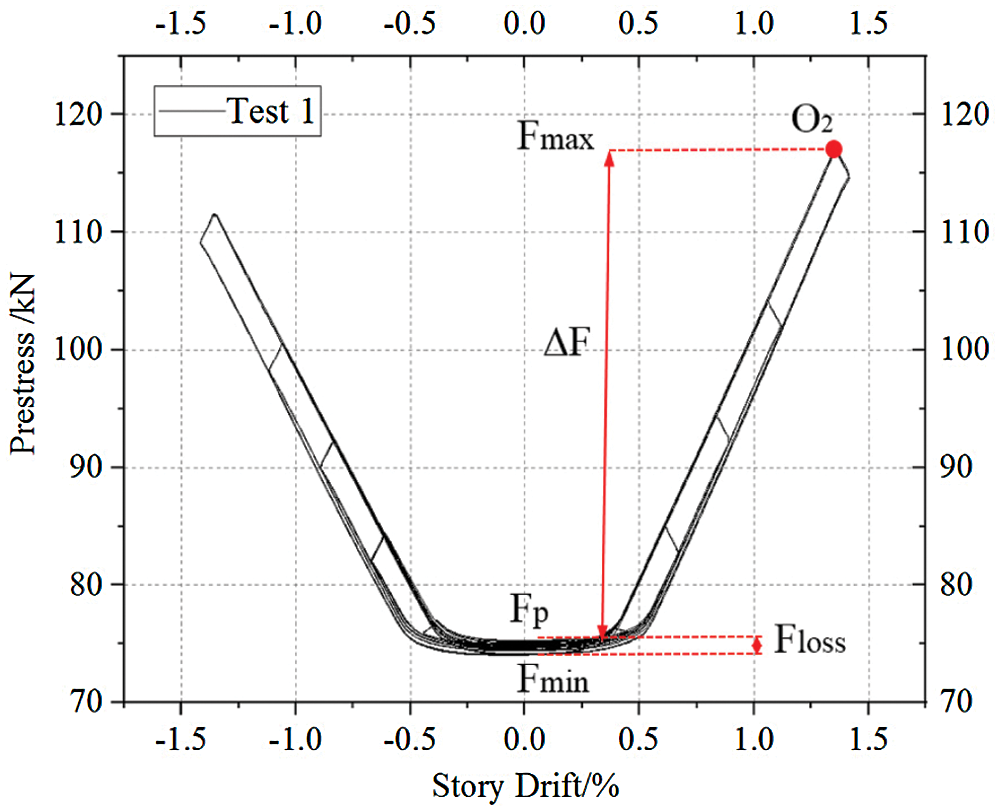
Figure 9: Prestressed force-story drift curves of test 1
Table 6: Analysis of the prestressed forces
4 Analytical Model of CLB Rocking Walls with CFDs
4.1 Limit States of CLB Walls under a Lateral Load
To characterize the lateral-load response, a series of structural limit states for CLB rocking walls are defined, referring to the definition of the CLT rocking walls [40] based on the strains, stress, and level of damage in the CLB material and posttensioned rebar. Based on the three assumptions, i.e., the plane section assumption, in-plane moment assumption, and elasticity assumption of the wall, the limit states of the CLB rocking wall under a lateral load can be described as follows: (1) Decompression of the base of the wall (DEC), (2) Effective limit of the linear-elastic response of the wall (ELL), and (3) Yielding of the posttensioned rebar (YP).
DEC is the limit state when the overturning moment resistance at the base of the wall provided by the initial posttensioned rebar prestressed force, Fp, and gravity load, Gg, acting on the wall, is overcome by the applied overturning moment. The base shear force, Vw, the base overturning moment, Mw, and the story drift ratio, θr, at the DEC are denoted as Vw,dec, Mw,dec, and θr,dec, respectively. The stress is linearly distributed at the base CLB wall, and the lateral displacement only includes the elastic deformation of the CLB wall. After the DEC, a gap appears between the base of the CLB wall and the foundation at the wall edge under the applied overturning moment. However, the lateral load response is essentially linear-elastic until the gap opening spreads over a certain length of the wall under the increasing lateral load.
The ELL is the limit state at which the reduced contact length due to the increasing gap opening along the base of the wall or the nonlinear behavior of the CLB material in compression near the base of the wall reduces the lateral stiffness of the wall, corresponding to point O1 in the hysteretic curves (see Fig. 5). The stiffness of the CLB wall is assumed to be constant before the ELL. The strain is linearly distributed at the contact edge of the wall, while the lateral displacement includes the elastic deformation and the small rigid displacement of the wall due to the rotation of the CLB wall. Vw, Mw, and θr at the ELL are denoted as Vw,ell, Mw,ell, and θr,ell, respectively.
YP is the limit state at which the posttensioned rebar reaches its yield strain, εy, as a result of elongation due to the gap opening and rocking of the CLB wall. The contact length between the CLB wall and the foundation decreases further, and the strain is linearly distributed at the contact edge of the wall. The stiffness of the CLB wall between the ELL and YP is assumed to be constant. The lateral displacement includes the elastic deformation and the rigid displacement of the wall. Vw, Mw, and θr at YP are denoted as Vw,yp, Mw,yp, and θr,yp, respectively.
4.2 Bearing Capacity of the Limit States
The calculation sketch and the stress and strain diagrams at the bottom edge of the CLB wall at DEC are shown in Fig. 10. The applied lateral force F is assumed at the center of the actuator, and the force point of Fdec is assumed to be lw/3 from the wall edge [40]. At DEC, the bearing capacity is calculated as Eqs. (3) and (4), which is derived from the moment balance of point O.
where Fp is the initial prestressed force; Gg is the gravity load of the CLB wall; lw represents the length of the bottom edge.
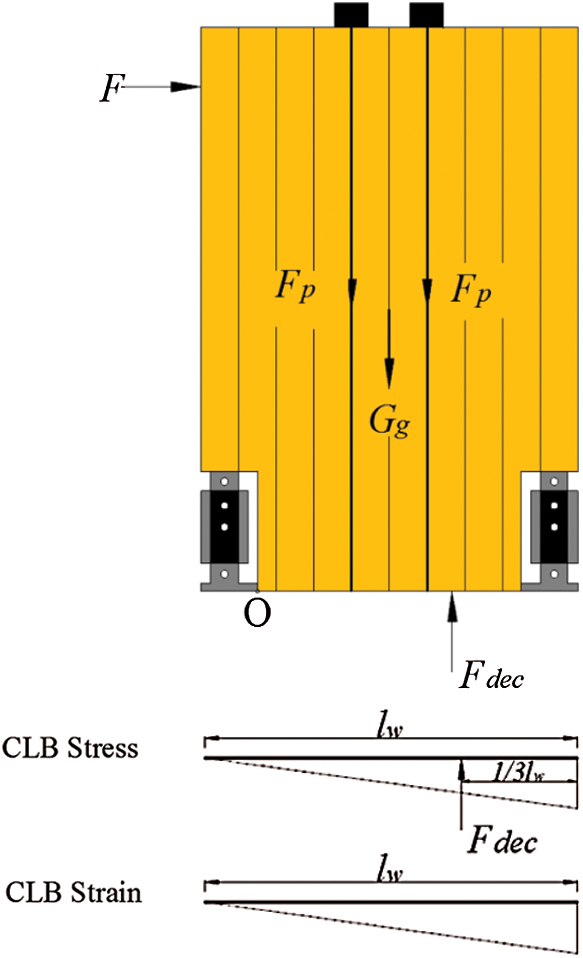
Figure 10: Calculation sketch and the stress and strain diagrams at DEC
The calculation sketch and the stress and strain diagrams at the ELL are shown in Fig. 11. The cell represents the contact length between the CLB rocking wall and the foundation, and the force point of Fell is assumed to be cell/3 [40] from the wall edge. At the ELL, the bearing capacity is calculated as Eqs. (5) and (6).
where Fcfd is the friction force of the CFDs and l0 is the distance of the centerlines of the CFDs, as shown in Fig. 11. Mw,ell1 indicates that the stiffness degradation of the system is caused by the nonlinear behavior of the CLB material in compression near the base of the wall, while Mw,ell2 indicates that the stiffness degradation is caused by the gap opening along the wall base [6]. The cell is assumed to be 3/8 lw in Mw,ell1 [40].
Figure 11: Calculation sketch and the stress and strain diagrams at ELL
The calculation sketch and the stress and strain diagrams at YP are shown in Fig. 12. cyp is the contact length at YP, and the force point of Fyp is assumed to be cyp/3 [40] from the wall edge. At YP, the bearing capacity is calculated as Eqs. (7) and (8).
where Fp,y is the yield force of the posttensioned rebar. The geometrical relationship of cyp is shown in Fig. 13, and cyp is calculated by solving Eqs. (9)–(12).
where Hpt is the length of the posttensioned rebar and εyp is the compressive strain of the bottom of the CLB wall. Considering the nonuniform deformation of the CLB wall and (for a convenient calculation) assuming the strain of the CLB wall is equal to εyp in a definite area, the length of the area is assumed to be Hcr [40]; l1 is the distance between the right posttensioned rebar and the CLB wall edge (see Fig. 13); εi represents the initial strain of the posttensioned rebars; A is the compression area of the bottom of the CLB wall; b is the thickness of the CLB wall. The deformation of the CLB wall equals Hcr × εyp. The calculation of the modulus of elasticity in compression parallel to the grain of CLB Ec is given in the appendix [33].
Figure 12: Calculation sketch and the stress and strain diagrams
Figure 13: Geometrical relationship of cyp
The shear force of the CLB wall is calculated as Eq. (13):
where Hact is the height from the top of the base beam to the centerline of the actuator.
4.3 Deformation Response at the Limit States
Based on the three assumptions and the bearing capacity of the limit states, the deformation response at the limit states can be calculated as follows. At the DEC, the deformation calculation model of the CLB wall is simplified as a cantilever beam. The lateral displacement at the DEC equals the elastic deformation of the CLB wall under Vw,dec, which is calculated as Eq. (14).
where k1 is the shearing-shape coefficient.
Due to the small uplift of the CLB wall at ELL, the small rigid displacement caused by the rotation of the CLB wall can be neglected. The lateral displacement of the CLB wall can be calculated as Eq. (15).
At YP, the ultimate displacement includes the elastic deformation Δdec and the rigid displacement Δc, which is calculated as Eqs. (16) and (17), respectively.
where δs is the yielding elongation of the posttensioned rebar and δi is the initial elongation of the posttensioned rebar.
The stiffness of the CLB wall before and after the ELL can be calculated when the lateral force and displacement of each limit state are obtained from the above equations, as shown in Eqs. (18) and (19), respectively.
4.4 Comparison between the Analytical and Experimental Results
No plastic behavior of the CLB wall itself was monitored during tests 3–7. As a result, the stiffness degradation of the CLB rocking wall was caused by the gap opening along the wall base and the bearing capacity at ELL was Mw,ell2 according to the discussion in Section 4.2. Additionally, based on the assumption of the constant stiffness after ELL, the shear force at 1.3% story drift was calculated as Eq. (20).
where Vw,1.3% is the shear force at 1.3% story drift. Vw,ell is the shear force at ELL. Δ1.3% is the lateral displacement at 1.3% story drift. Δell is the lateral displacement at ELL. K2 is the stiffness of the CLB rocking wall after ELL.
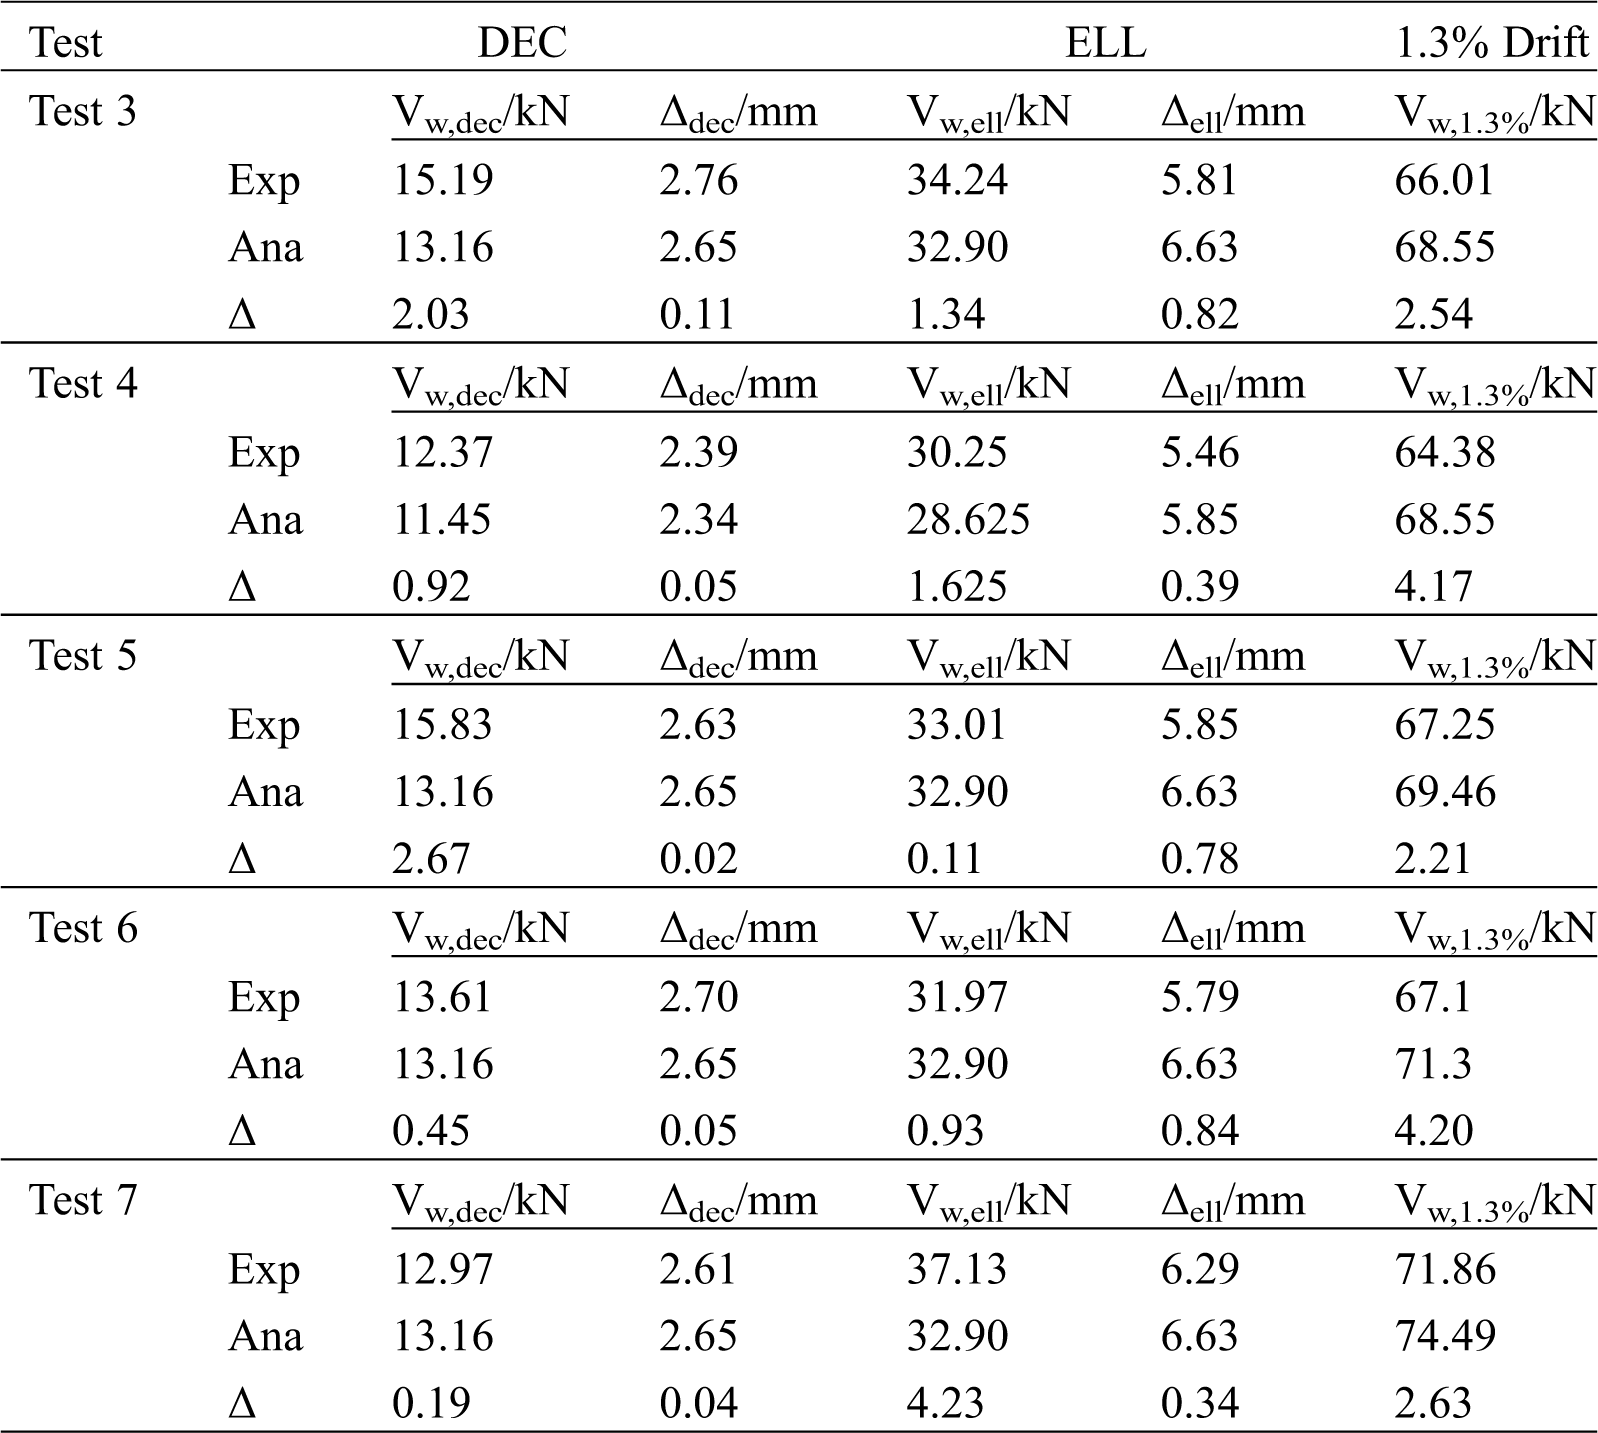
As shown in Figs. 14 and 15, the skeleton curves calculated by the analytical model fit well with the experimental skeleton curves. Considering the non-centrosymmetric hysteretic curves caused by the installation error of CFDs, the shear force and lateral displacements of each limit state in the tests were obtained by averaging the values of the corresponding points in the first quadrant and the third quadrant, as shown in Tab. 7. The lateral displacements at the DEC calculated by the analytical model differed by no more than 4% from the experimental results, and the difference between the shear forces obtained from the analytical model and the experimental results was smaller than 2.67 kN, which indicates that the DEC is estimated reasonably well by the analytical model.
At the ELL, the difference in the shear forces calculated by the analytical model and obtained from the test ranged from 0.11 kN to 4.23 kN, while the difference in displacements ranged from 0.34 mm to 0.84 mm, indicating that the ELL is also estimated closely by the analytical model. K2 is used for the calculation of the shear force at a 1.3% story drift. The difference in the shear force between the experimental and analytical curves at a 1.3% story drift was no more than 4.2 kN, affirming the accuracy of the calculation of the shear forces and lateral displacements in the YP limit state by the analytical model.
In conclusion, the shear force and lateral displacement at each limit state calculated by the analytical model fit well with the experimental data. The maximum difference in the shear force was at the ELL in test 7 (4.23 kN), and the relative error was 11.39%. The maximum difference in the lateral displacement was at the ELL in test 6 (0.84 mm), and the relative error was 12.67%. The proposed analytical model can be a good reference for the design of CLB rocking walls.
Figure 14: Experimental hysteretic curves and the analytical skeleton curves (a) Test 3 (b) Test 4 (c) Test 5 (d) Test 6 (e) Test 7
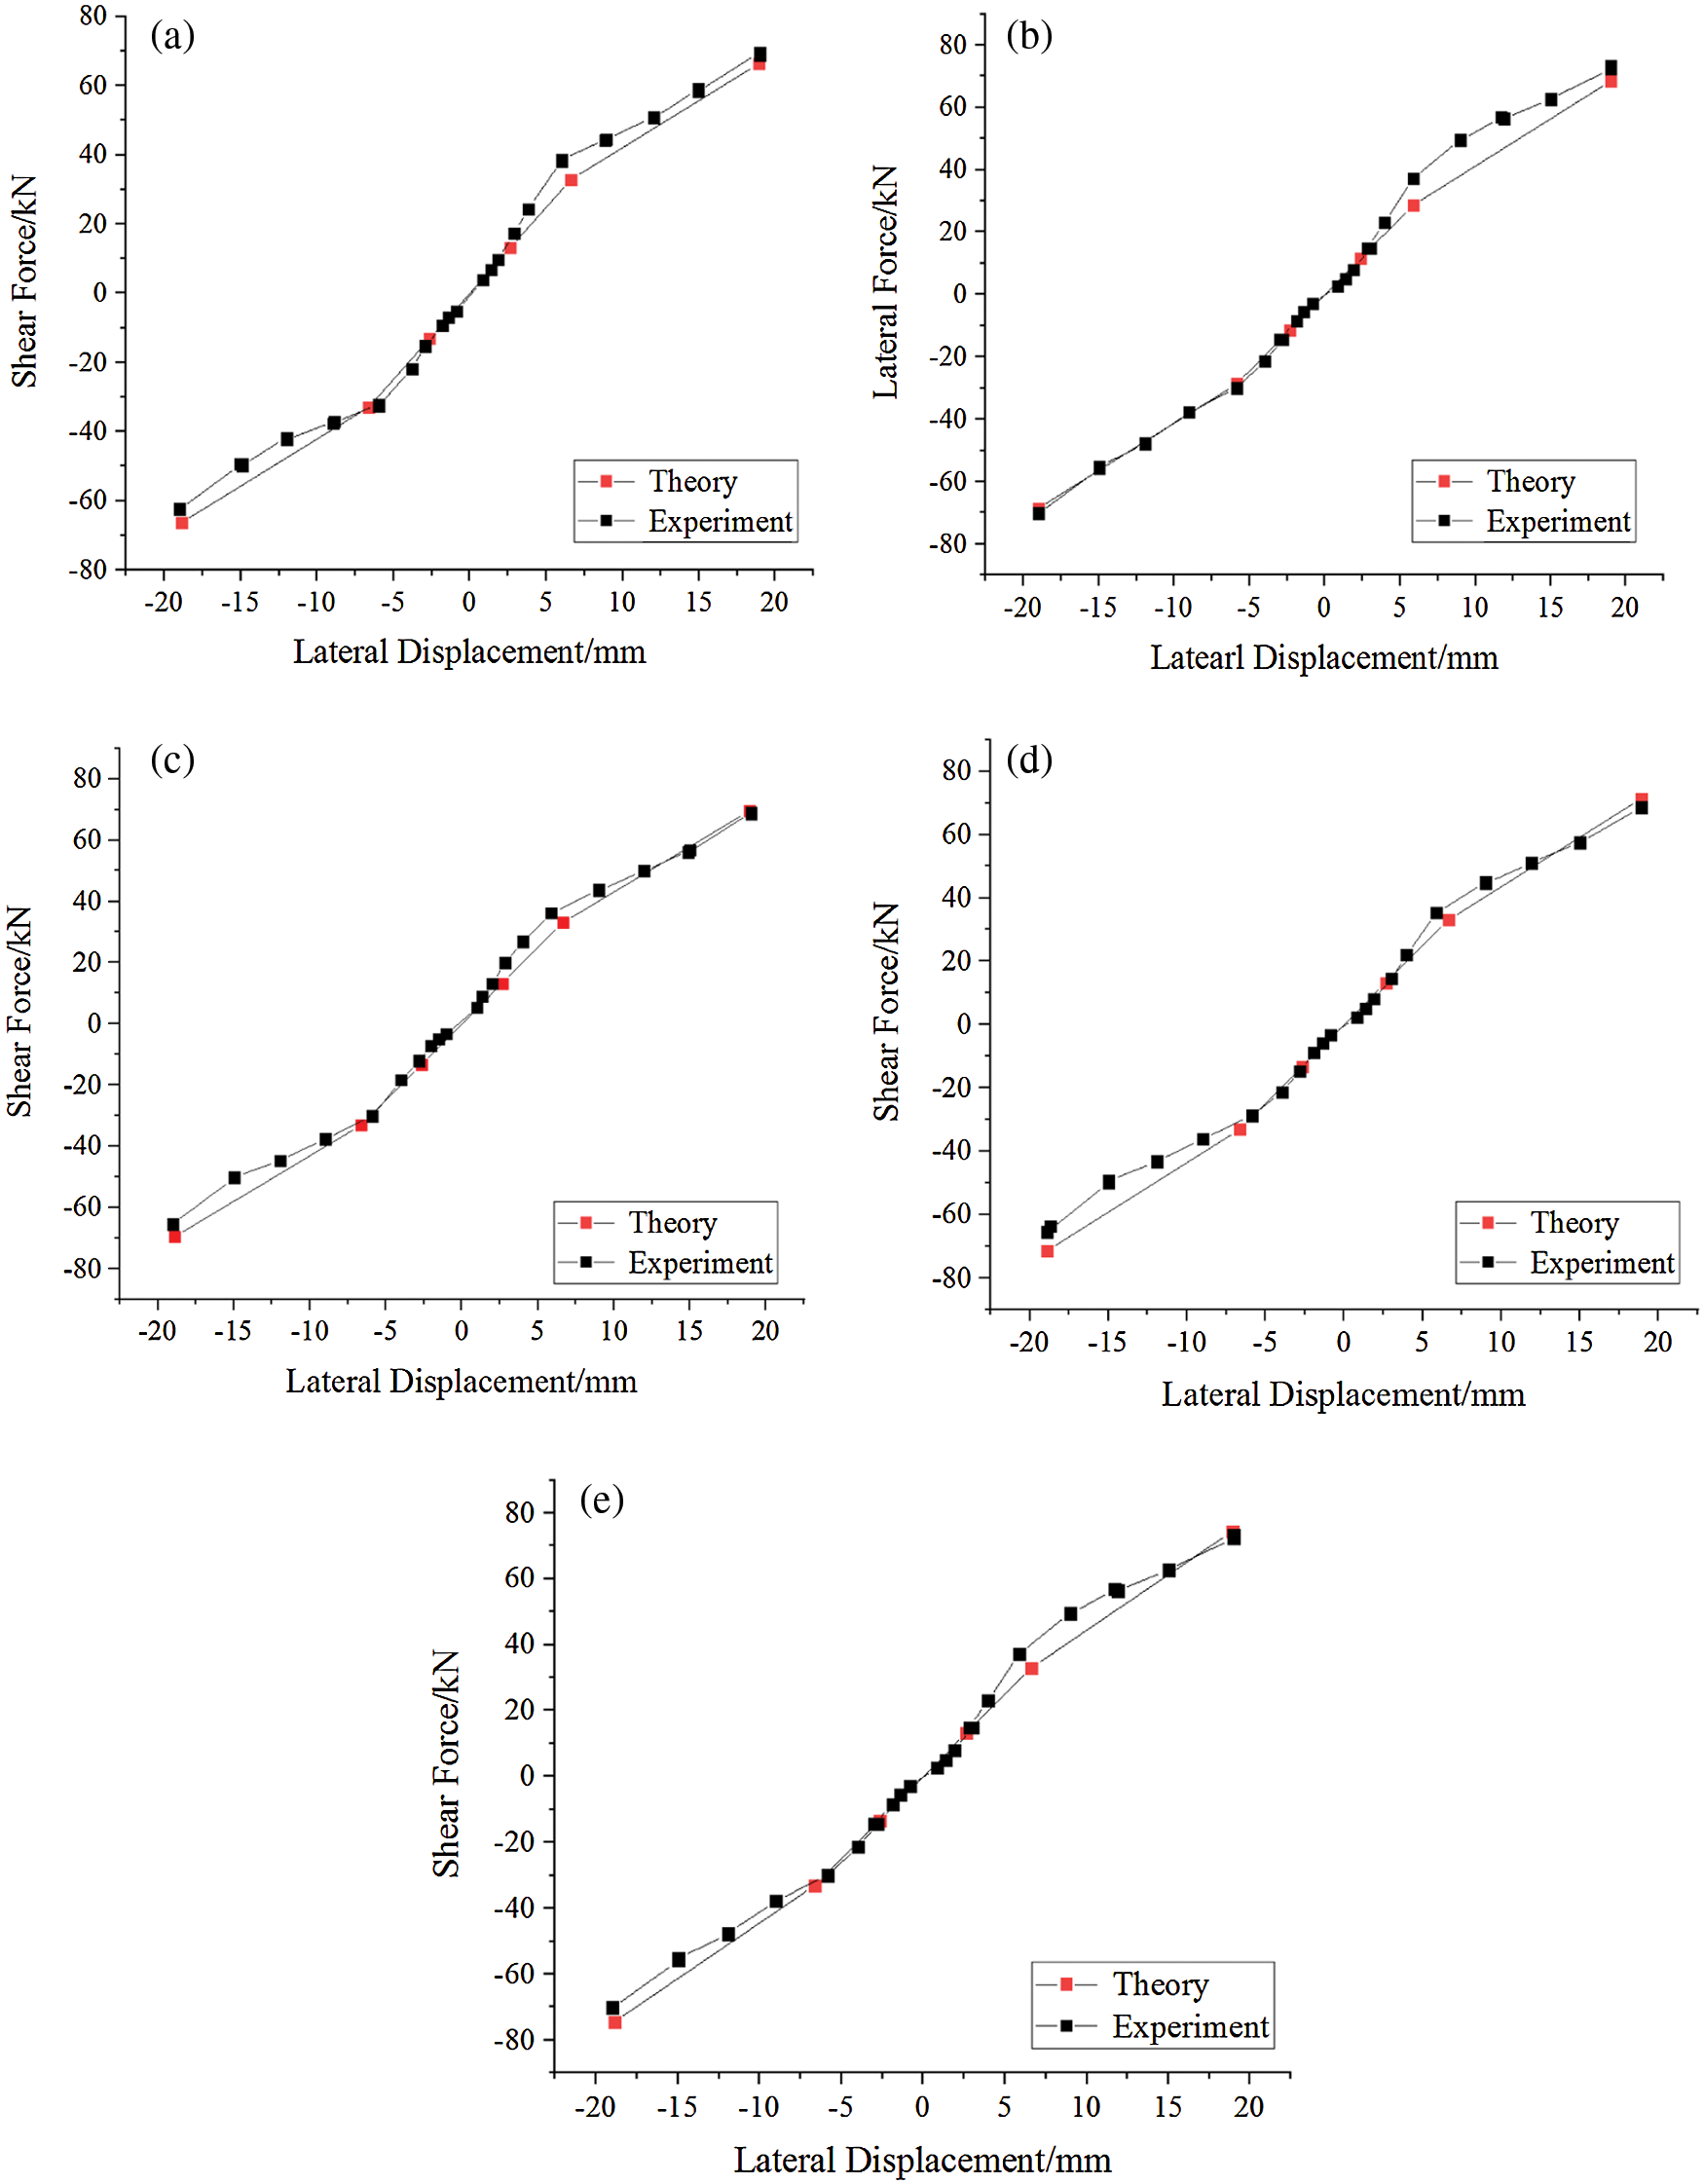
Figure 15: Comparison between the experimental and analytical skeleton curves (a) Test 3 (b) Test 4 (c) Test 5 (d) Test 6 (e) Test 7
Table 7: Comparison of the experimental and analytical results
In this study, experimental and analytical investigations were conducted on the seismic performance of CLB rocking walls. The mechanical properties of the CLB rocking wall were discussed. The shear force and lateral displacement of each limit state were calculated using the analytical model and then compared with the experimental results. The skeleton curves were further obtained from the analytical model and compared with the experimental curves. The main conclusions can be drawn as follows:
1. The hysterical curves showed the bilinear behavior of the CLB rocking wall. The displacements of the stiffness turning points in the seven tests were approximately consistent, and the CLB wall remained elastic during the loading process, which indicated that the stiffness turning point was caused by a decrease in the contact length of the CLB wall and the foundation.
2. The comparison of the CEDs between tests 1–2 and tests 3–7 demonstrates that the energy dissipation capacity of the CLB wall was primarily provided by the CFDs. The CEDs of the posttensioned rebar demonstrate a feeble energy dissipation capacity, indicating that the energy dissipation capacity of the CLB rocking wall without CFDs is mainly provided by the deformation of the CLB wall.
3. The RSE values in the seven tests show the excellent self-centering capacity of the CLB rocking wall, especially in the tests without CFDs, which realizes almost zero residual displacements under a lateral load. The prestressed force loss of the posttensioned rebar was derived from the deformation of the anchorage bolts and plates.
4. The curves obtained from the analytical model based on the three limit states, i.e., DEC, ELL, and YP, coincided well with the experimental curves, and the installation error of CFDs caused the main differences. The comparison results indicated that the proposed analytical model is applicable for the prediction of the CLB rocking wall behavior under cyclic loading. The findings can serve as tools to facilitate a better comprehension of the design and implementation of CLB rocking wall structural systems.
Funding Statement: The authors would like to extend their sincere gratitude for the financial support from the Integrated Key Precast Components and New Wood-bamboo Composite Structure Foundation of China (2017YFC0703502), the National Natural Science Foundation of China (51978152), and the Fundamental Research Funds for the Central Universities (YJ202061).
Conflicts of Interest: The authors declare that they have no conflicts of interest to report regarding the present study.
1. Priestly, M. J. N. (1991). An overview of PRESSS research program. PCI Journal, 36(4), 50–57. DOI 10.15554/pcij.07011991.50.57. [Google Scholar] [CrossRef]
2. EI-Sheikh, M. T., Sause, R., Pessiki, S., Lu, L. W. (1999). Seismic behavior and design of unbonded post−tensioned precast concrete walls. PCI Journal, 44(3), 72–89. [Google Scholar]
3. Kurama, Y. C. (2000). Unbonded post−tensioned precast concrete walls with supplemental viscous damping. Aci Structural Journal, 97(4), 648–658. [Google Scholar]
4. Holden, T., Restrepo, J., John, B. (2003). Seismic performance of precast reinforced and prestressed concrete walls. Journal of Structural Engineering, 129(3), 286–296. [Google Scholar]
5. Restrepo, J. I., Rahman, A. (2007). Seismic performance of self−centering structural walls incorporating energy dissipators. Journal of Structural Engineering, 133(11), 1560–1570. [Google Scholar]
6. Perez, F. J., Sause, R., Pessiki, S. (2007). Analytical and experimental lateral load behavior of unbonded posttensioned precast concrete walls. Journal of Structural Engineering, 133(11), 1531–1540. [Google Scholar]
7. Li, X., Kurama, Y. C., Wu, G. (2020). Experimental and numerical study of precast posttensioned walls with yielding−based and friction−based energy dissipation. Engineering Structures, 212, 110391. [Google Scholar]
8. Xu, G., Li, A. Q. (2020). Seismic performance and design approach of unbonded post−tensioned precast sandwich wall structures with friction devices. Engineering Structures, 204, 110037. [Google Scholar]
9. Bedriñana, L. A., Zhang, K., Nishiyama, M. (2018). Evaluation of the behavior and ultimate capacity of unbonded monostrand−anchorage systems under concentric and eccentric inelastic cyclic loading. Engineering Structures, 176(5), 632–651. DOI 10.1016/j.engstruct.2018.09.036. [Google Scholar] [CrossRef]
10. Chen, Y., Li, Q. Q., Zhang, H. Y., Cai, K. J., Zhou, M. et al. (2019). Optimum design for unbonded posttensioned precast split shear wall system using genetic algorithm. Structural Design of Tall and Special Buildings, 28(5), 1582. [Google Scholar]
11. Twigden, K. M., Sritharan, S., Henry, R. S. (2007). Cyclic testing of unbonded post−tensioned concrete wall systems with and without supplemental damping. Engineering Structures, 140, 406–420. [Google Scholar]
12. Nazari, M., Sritharan, S. (2020). Influence of different damping components on dynamic response of concrete rocking walls. Engineering Structures, 212, 110458. [Google Scholar]
13. Guo, T., Zhang, G. D., Chen, C. (2014). Experimental study on self−centering concrete wall with distributed friction devices. Journal of Earthquake Engineering, 18(2), 214–230. [Google Scholar]
14. Sarti, F., Palermo, A., Pampanin, S. (2015). Development and testing of an alternative dissipative posttensioned rocking timber wall with boundary columns. Journal of Structural Engineering, 142(4), E4015011. [Google Scholar]
15. Fitzgerald, D. M., Miller, T. H., Sinha, A., Nairn, J. A. (2020). Cross−laminated timber rocking walls with slip−friction connection. Engineering Structures, 220, 110973. [Google Scholar]
16. Hashemi, A., Zarnani, P., Masoudnia, R., Quenneville, P. (2018). Experimental testing of rocking cross−laminated timber walls with resilient slip friction joints. Journal of Structural Engineering, 144(1), 04017180. [Google Scholar]
17. Hashemi, A., Quenneville, P. (2020). Large−scale testing of low damage rocking Cross Laminated Timber (CLT) wall panels with friction dampers. Engineering Structures, 206(C), 11066. [Google Scholar]
18. Sun, X. F., He, M. J., Li, Z., Lam, F. (2019). Seismic performance assessment of conventional CLT shear wall structures and post−tensioned CLT shear wall structures. Engineering Structures, 196, 109285. [Google Scholar]
19. Blomgren, H., Pei, S., Jin, Z. B., Powers, J., Dolan, J. D. (2019). Full−scale shake table testing of cross−laminated timber rocking shear walls with replaceable components. Journal of Structural Engineering, 145(10), 04019115. [Google Scholar]
20. Pei, S., van de Lindt, J. W., Barbosa, A. R., Berman, J. W., Wichman, S. et al. (2019). Experimental seismic response of a resilient 2−story mass−timber building with post−tensioned rocking walls. Journal of Structural Engineering, 145(11), 04019120. [Google Scholar]
21. Wang, Z., Li, H. T., Fei, B. H., Mahmud, A., Xiong, Z. H. et al. (2021). Axial compressive performance of laminated bamboo column with aramid fiber reinforced polymer. Composite Structures, 258, 113398. [Google Scholar]
22. Li, H. T., Su, J. W., Xiong, Z. H., Mahmud, A., Corbi, I. et al. (2020). Evaluation on the ultimate bearing capacity for laminated bamboo lumber columns under eccentric compression. Structures, 28, 1572–1579. [Google Scholar]
23. Yang, D., Li, H. T., Xiong, Z. H., Mimendi, L., Lorenzo, R. et al. (2020). Mechanical properties of laminated bamboo under off−axis compression. Composites Part A, 138, 106042. [Google Scholar]
24. Li, H. T., Qiu, Z. Y., Wu, G. (2019). Slenderness ratio effect on eccentric compression properties of parallel bamboo strand lumber columns. Journal of Structural Engineering, 145(8), 04019077. [Google Scholar]
25. Li, H. T., Zhang, H. Z., Qiu, Z. Y. (2020). Mechanical properties and stress strain relationship models for bamboo scrimber. Journal of Renewable Materials, 8(1), 13–27. [Google Scholar]
26. Wei, Y., Tang, S. F., Ji, X. W. (2020). Stress−strain behavior and model of bamboo scrimber under cyclic axial compression. Engineering Structures, 209, 110279. [Google Scholar]
27. Lv, Q. F., Wang, W. Y., Liu, Y. (2019). Study on thermal insulation performance of cross−laminated bamboo wall. Journal of Renewable Materials, 7(11), 1231–1250. [Google Scholar]
28. Lv, Q. F., Wang, W. Y., Liu, Y., Mazzotti, C. (2019). Flexural performance of Cross−Laminated Bamboo (CLB) slabs and CFRP grid composite CLB slabs. Advances in Civil Engineering, 2019, 6980782. [Google Scholar]
29. Lv, Q. F., Ding, Y., Liu, Y. (2019). Study of the bond behaviour between basalt fibre−reinforced polymer bar/sheet and bamboo engineering materials. Advances in Structural Engineering, 22(14), 3121–3133. [Google Scholar]
30. Lou, Z. C., Yuan, T. C., Wang, Q. Y., Wu, X. W., Hu, S. H. et al. (2021). Fabrication of crack−free flattened bamboo and its macro−/micro− morphological and mechanical properties. Journal of Renewable Materials, 2021. [Google Scholar]
31. Standardization Administration of the People’s Republic of China (SAC) GB/T 1936.2−2009: Method for determination of the modulus of elasticity in static bending of wood (2009). Beijing. [Google Scholar]
32. Standardization Administration of the People’s Republic of China (SAC) GB/T 1936.1 (2009). Method of testing in bending strength of wood. Beijing. [Google Scholar]
33. Gagnon, S., Pirvu, C. (2011). Cross−Laminated timber handbook. Canada: Canadian Edition. [Google Scholar]
34. Standardization Administration of the People’s Republic of China (SAC) GB/T (2017). Method for determination of the modulus of elasticity in compression parallel to grain of wood. [Google Scholar]
35. Wei, P. X., Wang, Q. Z., Zhou, D. G. (2012). Shear modulus’s measurement of laminated veneer lumber from poplar through separating rigidity. Journal of Civil and Environmental Engineering, 34, 177–180. [Google Scholar]
36. Standardization Administration of the People’s Republic of China (SAC) GB/T (2018). Metallic materials−Determination of modulus of elasticity and Poisson’s ratio. Beijing. [Google Scholar]
37. Standardization Administration of the People’s Republic of China (SAC) GB/T (2006). Steel standard for prestressed concrete. Beijing. [Google Scholar]
38. New Zealand Standard Council (NZSC) NZS−3101 (2006). Concrete structures standard Part 1−The design of concrete structures. Auckland. [Google Scholar]
39. Sideris, P., Amjad, J., Andre, A. (2014). Quasi−static cyclic testing of a large−scale hybrid sliding−rocking segmental column with slip−dominant joints. Journal of Bridge Engineering, 19(10), 04014036. [Google Scholar]
40. Akbas, T., Sause, R., James, M. (2017). Analytical and experimental lateral−load response of self−centering posttensioned CLT walls. Journal of Structural Engineering, 143(6). [Google Scholar]
Appendix
The calculation methods of the CLB modulus of elasticity in compression Ec, the effective bending stiffness (EI)eff, and the effective shear stiffness (GA)eff are provided in this section, referring to the Canadian cross-laminated timber handbook [33].
The composite theory-k method is adopted for the calculation of Ec:
where the definitions of E0 and E90 are given in Section 2.2.
The shear analogy method is adopted for the calculation of (EI)eff and (GA)eff:
where Ei is the bending elastic modulus of each bamboo strip. The bamboo strip bending elastic modulus parallel to the grain is E, while the bamboo strip bending elastic modulus perpendicular to the grain is E’. The definitions of E and E’ are given in Section 2.2. ti is the thickness of each bamboo strip. w is the width of the rocking wall. Ai equals ti × w. zi represents the distance between the neutral axis of each strip and the neutral axis of the cross-section. Gi is the shear modulus of each bamboo strip. The bamboo strip shear modulus parallel to the grain is G, while the bamboo strip shear modulus perpendicular to the grain is G’. The definition of G and G’ are given in Section 2.2.
 | This work is licensed under a Creative Commons Attribution 4.0 International License, which permits unrestricted use, distribution, and reproduction in any medium, provided the original work is properly cited. |