Materials
| Journal of Renewable Materials |
DOI: 10.32604/jrm.2021.015973
ARTICLE
The Arrangement and Size of Cellulose Microfibril Aggregates in the Cell Walls of Sclerenchyma Fibers and Parenchyma Tissue in Bamboo
1Institute of New Bamboo and Rattan Based Biomaterials, International Center for Bamboo and Rattan, Beijing, 100102, China
2College of Material Engineering, Fujian Agriculture and Forestry University, Fuzhou, 350108, China
3NFGA and Beijing Co-Built Key Laboratory of Bamboo and Rattan Science & Technology, National Forestry and Grassland Administration, Beijing, 100102, China
*Corresponding Author: Yan Yu. Email: yuyan9812@outlook.com
Received: 28 January 2021; Accepted: 20 February 2021
Abstract: Understanding the assembly and spatial arrangement of bamboo cell wall components is crucial for its optimal utilization. Bamboo cell walls consist of aggregates of cellulose microfibrils and matrix. In the present study, the size and arrangement of cellulose microfibril aggregates in the cell walls of sclerenchyma fibers and parenchyma cells in moso bamboo were investigated with NMR and FE-SEM. The NMR measurement showed that the characteristic sizes of the microfibril aggregates of fibers and parenchyma cells were approximately 25.8 nm and 18.8 nm, respectively. Furthermore, high-resolution SEM showed the size of microfibril aggregates varied little across the cell wall of sclerenchyma fiber. However, there were significant size differences between the broad and narrow lamellae both in fiber and parenchyma cells, which is thought to be closely related to the orientation of microfibrils in these layers. The microfibril aggregates in the fibers mainly appear in a random arrangement, although occasionally in a radial or tangential arrangement in individual cell. Parenchyma cells have a relatively thinner cell wall layers, in which microfibril aggregates appear in a concentric lamellar arrangement.
Keywords: Bamboo fiber; parenchyma cell; microfibril aggregate; size; arrangement
Plant cell wall has a supramolecular structure formed by the assembly of cellulose, hemicellulose and lignin. Cellulose molecular chains assemble into microfibrils with diameter of 3 nm–4 nm, which is in turn aggregated to form larger cellulose fibrils or microfibril aggregates with a diameter of 15 nm–25 nm [1]. Within the secondary cell wall, the polymers were reported to have a segmented lamella structure [2]. The physical and chemical properties of plant cell walls are largely determined by the structure and their three-dimensional assembly of these cell wall components.
Studies of the mechanical interactions among cellulose, glocumannan and xylan suggested that xylan is more closely related to lignin, while glucomannan is more closely attached to cellulose for softwood [3]. On a larger scale, there is still no consensus on the laminar arrangement of microfibril aggregates and matrix materials. Fahlén et al. [4] believed that the radial aggregate observed on the fracture surface was the result of energy release during the fracturing process, and the undeformed wood has a concentric layered structure on a smaller structural level. An alternative radial aggregate model was reported based on the field emission scanning electron microscopy (FE-SEM) study of the fractured wood surface [5]. In contrast, Atomic Force Microscope (AFM) studies reported a random arrangement of cellulose microfibril aggregates without any pattern in the secondary wall of wood [6,7]. Such a random texture was further supported by AFM phase contrast images of embedded and polished samples [8]. Casdorff et al. [9] investigated the cross section of spruce wood with different cutting angles (0°–30°). The results showed that the structural appearance of S2 layer changed from reticular structure to obvious concentric layered structure with the increase of cutting angles. It was suggested that the secondary cell wall of the frequently visible lamellar tissue may not be the result of a continuous internal circular pattern, but the appearance of the specific surface cross section of the cellulose aggregates at a larger cutting angle.
The size of cellulose aggregates is also affected by preparation methods and testing techniques. In moist state, the average diameter of the microfibril aggregates of black spruce was 15 nm, while under air-drying or freeze-drying, the diameters of the cellulose microfibril aggregates increased to 25 nm and 35 nm, respectively [10]. It indicated that the drying process could lead to further aggregation of cellulose microfibril aggregates [10]. The content of hemicellulose and pectin is another factor affecting the size of microfibril [11]. An AFM was used to observe the microfibrils of celery parenchyma cell wall before and after pectin extraction. The average size of the microfibril aggregates increased when the pectin was selectively removed [12]. Fahlén et al. [13] reported the size of microfibril aggregates from Norway spruce tracheid to be 15 nm-25 nm using AFM. Wood derived cellulose microfibril aggregates have been studied extensively, but there is limited information on the structural arrangement of microfibril aggregates in bamboo, especially considering the different types of cells in bamboo.
Bamboo has been exploited as wood substitute with a short harvest rotation of 3–4 years and excellent mechanical properties [14–16]. It is mainly composed of sclerenchyma fibers and parenchyma cells, which differ in their biological functions. Sclerenchyma fibers with high rigidity provide mechanical support, while the parenchymal cells store nutrients such as starch. These cells with different biological function have different anatomical structures and chemical compositions [17]. To the best of our knowledge, limited work has been done on the size and arrangement differences of microfibril aggregates between bamboo fibers and parenchyma cells.
In the present study, field emission scanning electron microscope (FE-SEM) and cross-polarized magic angle spinning 13C nuclear magnetic resonance (CP/MAS 13C NMR) were jointly used to determine the arrangement of microfibril aggregates, and the size variation of cellulose aggregates in bamboo fibers and parenchyma cells.
Mature culms of moso bamboo (Phyllostachys pubescens), aged 4–5 years were collected from Sanming, Fujian Province, China in August 2019. Samples of fresh bamboo blocks from moso bamboo were collected and stored in refrigerator.
After removing the thin epidermal and endodermal layers, the bamboo blocks were put into a water bath and softened at 60°C for 48 h. The softened bamboo blocks were sectioned in the transverse plane using a rotary microtome (LEICA RM2165, Germany) with a thickness of 40 µm. Sections were clamped between two microscope slides to prevent curling before drying at room temperature for 24 h. Bamboo sections were sputter-coated with an ultra-thin layer of Platinum before being observed with FE-SEM (SU8020, Hitachi, Japan) using an acceleration voltage of 3–5 kV.
Image Processing. Image Pro Plus was used to evaluate the FE-SEM images (Fig. 1) based on the binarization algorithm and watershed algorithm. This method was found to be more accurate than either to segment the SEM image directly, due to local variations in image contrast that prevent accurate segmentation, or to manually marking of the edges of each microfibril aggregate. At least fifty microfibril aggregates were randomly chosen and measured for each of five different fibers or parenchyma cells.
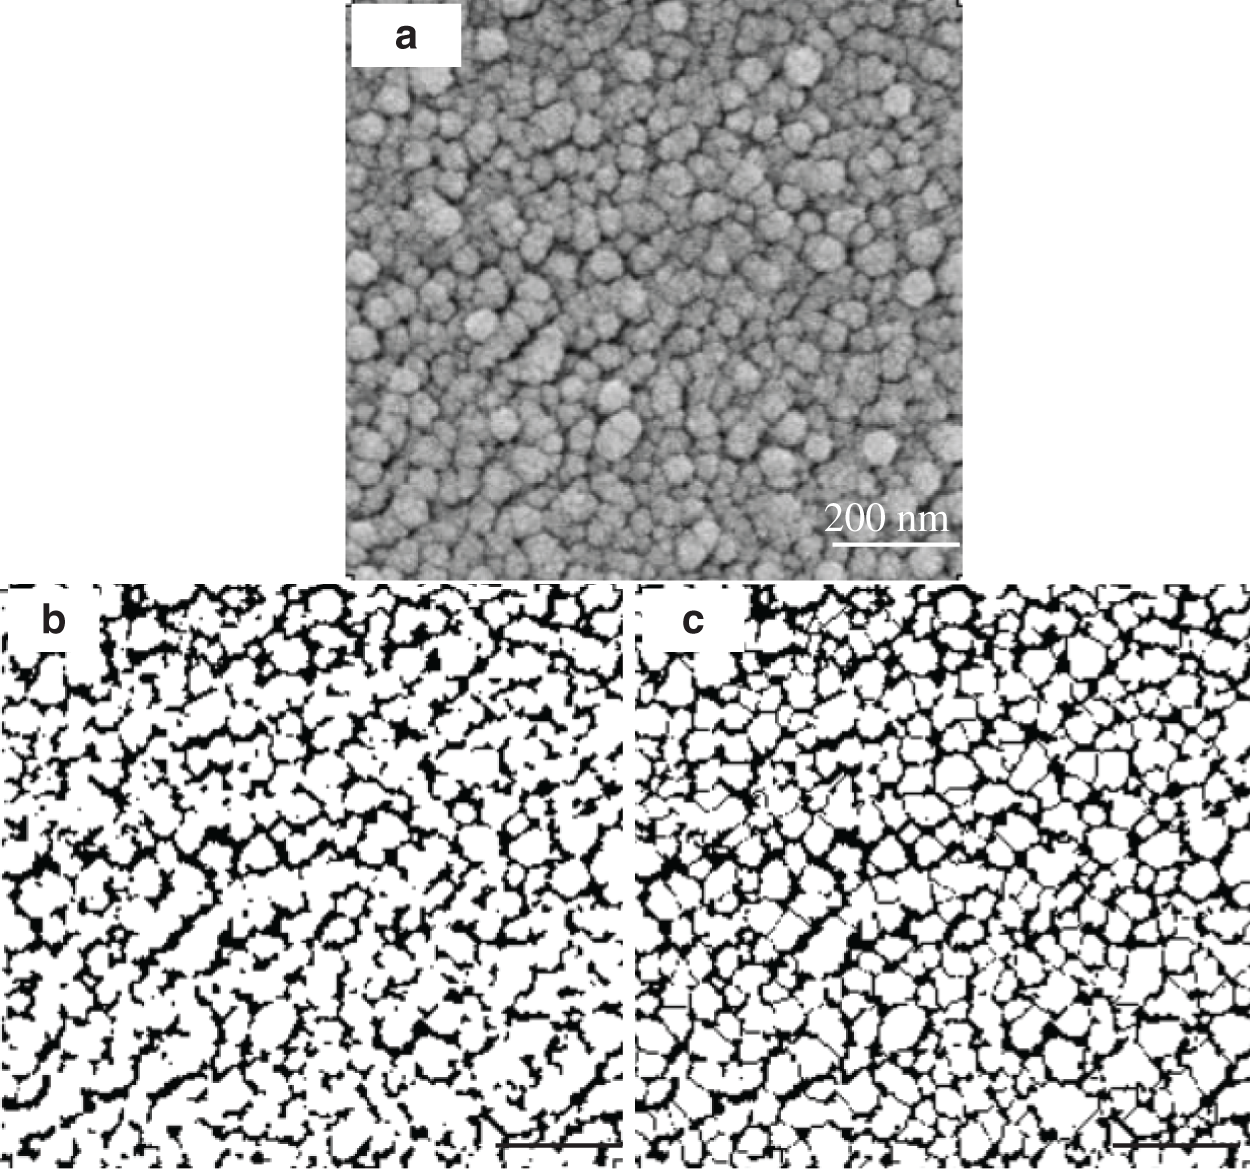
Figure 1: Original SEM contrast image captured from the fiber (a). The same image in binary form, where the microfibril aggregate structures are visualized in the white structures (b). The same image after image processing with the software based on the watershed algorithm, where all individual cellulose fibril aggregates have been encircled (c)
Sample preparation. The procedure described in our previous studies was employed to physically separate fibers and parenchyma cells [18]. The bamboo blocks were ground into powder and then the powder between 30 and 60 mesh was collected. The obtained powder was placed in a beaker containing 10–20 times the volume of water. After stirring and standing for a period, the parenchyma cells will float up due to lower density than water, and the fibers will sink due to higher density. The fibers and parenchyma cells were delignified in a solution of acidified sodium chlorite at 75°C for 5 h followed by treatment with 2 wt % potassium hydroxide at 80°C for 2 h in order to remove interfering signals from lignin and hemicellulose. After each step, the samples were washed with deionized water till to neutral. The cellulose-rich samples were frozen in liquid nitrogen followed by drying for 48 h in a freeze dryer (Labconco Freezone 2.5 µs, Labconco Corporation, USA).
NMR spectroscopy. The CP/MAS 13C-NMR spectra were recorded on a JNM-ECZ600R spectrometer. The rotor diameter was 3.2 mm. The MAS rate was 10 KHz. Acquisition was performed with a CP pulse sequence using a 2 ms contact pulse and a 3 s delay between repetitions. Each spectrum was obtained with 2000 scans.
Spectral fitting. A method based on non-linear least square fitting of the cellulose C4 region of the CP/MAS 13C-NMR spectra was applied in order to quantify the states of order found within cellulose I fibrils. The method given by Larsson et al. [19] was used to perform spectral fitting.
Estimation of microfibril aggregate size. The microfibril aggregates are assumed to have square cross sections. For these models, the fraction of the accessible fibril surfaces signal intensity (represented by q) is given by the formula
3.1 The Size of Microfibril Aggregates Estimated by CP/MAS 13C-NMR
The supramolecular structure of cellulose isolated from bamboo was determined by CP/MAS 13C-NMR. Fig. 2 shows the results of the spectral fitting for the cellulose C4 region of the NMR spectra of bamboo fibers and parenchyma cells. In the region (86–92 ppm) assigned to ordered and crystalline cellulose, the composite cellulose Ι(α+β) signal was visible, together with the signal from para-crystalline cellulose. In the region from 80 ppm to 86 ppm, a signal assigned to accessible fibril surfaces was visible together with the signal assigned to the inaccessible fibril surfaces. The spectrum of bamboo cellulose is typical for a cellulose of low order. Compared with the spectra of high crystalline cellulose such as Valonia [15], the spectrum of bamboo cellulose only showed a large peak in the C1 region without other small peaks in the region from 101 ppm to 107 ppm (Fig. 2a), which is consistent with the spectrum of wood [20].
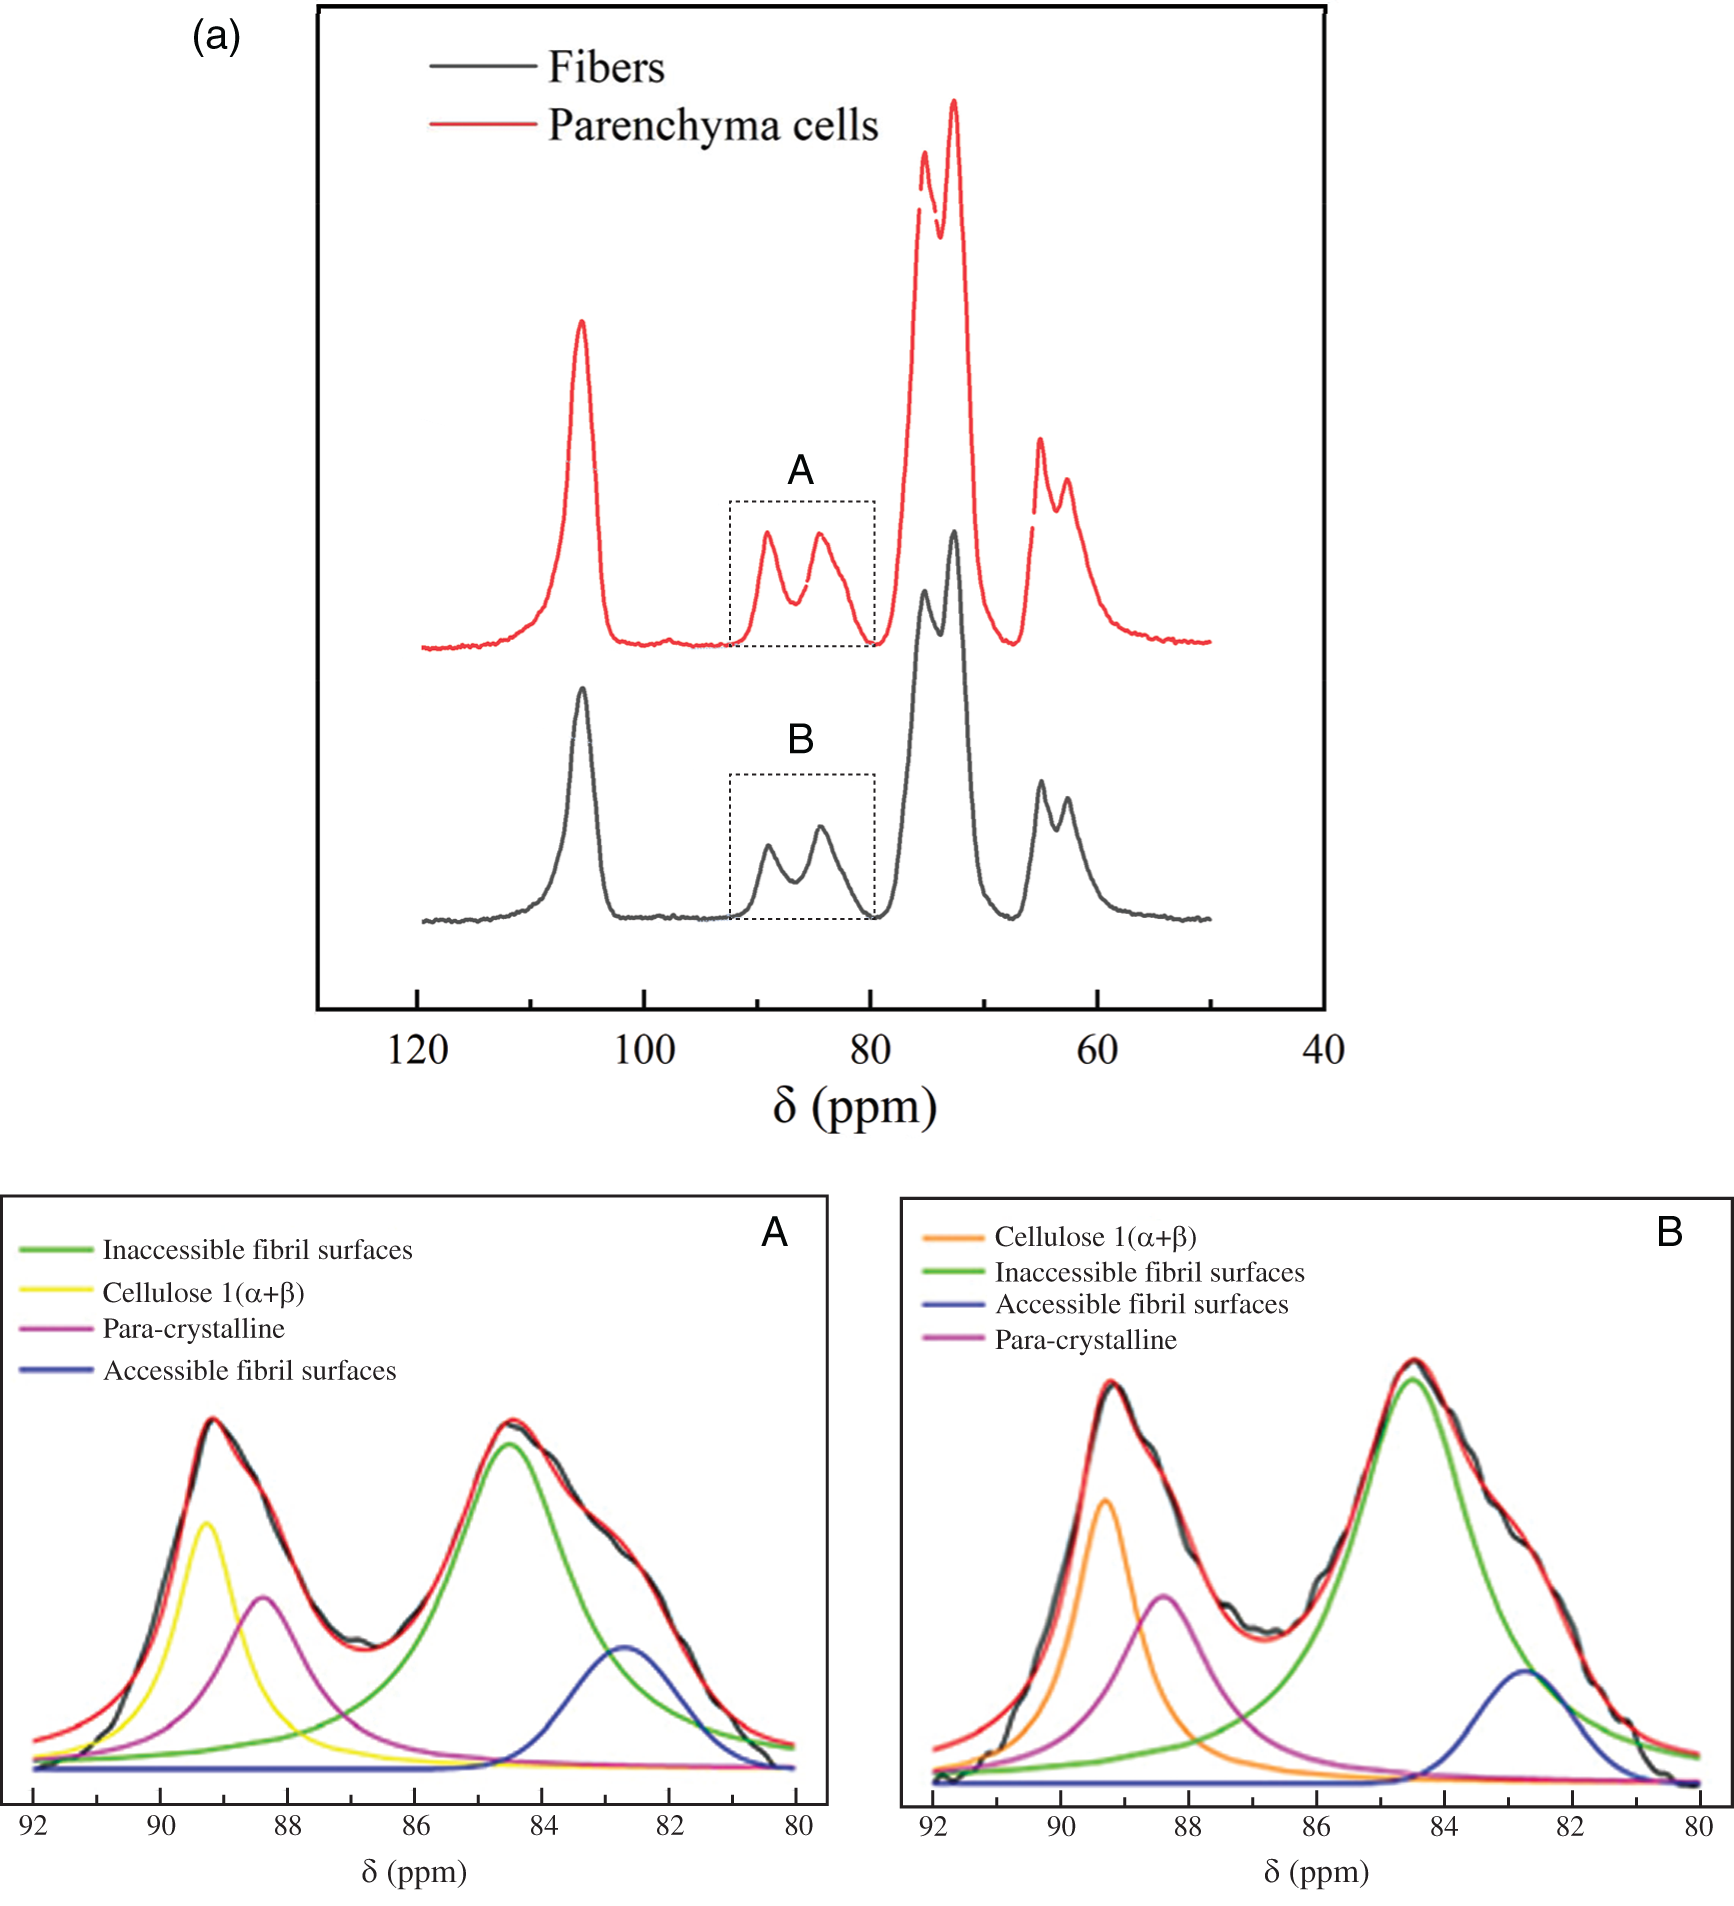
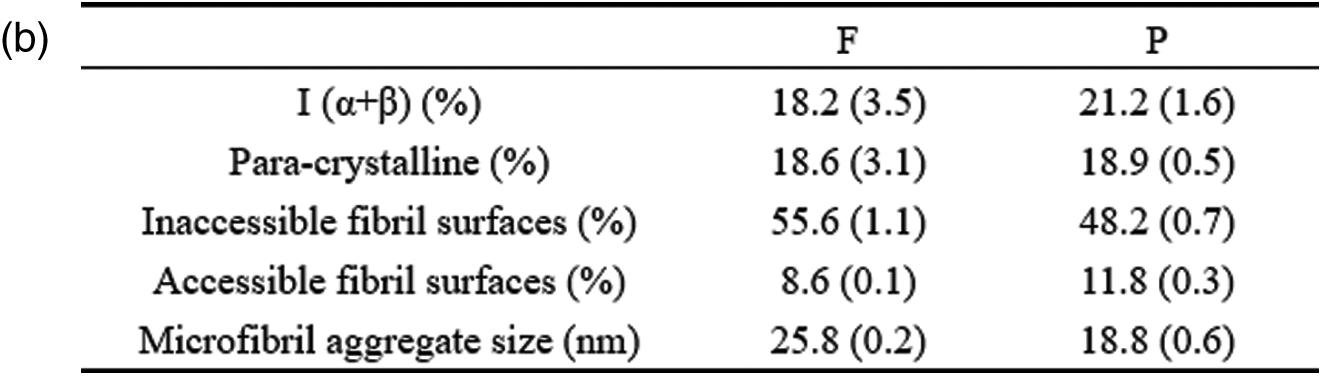
Figure 2: (a) CP/MAS 13C-NMR spectra of fibers and parenchyma cells cellulose and spectral fitting of the cellulose C4-region of the CP/MAS 13C-NMR spectra and (b) The average microfibril aggregate size of fibers and parenchyma cells calculated based on spectral fitting
The average microfibril aggregate sizes of bamboo fibers and parenchyma cells estimated by CP/MAS 13C-NMR were ca. 25.8 nm and 18.8 nm, respectively (Fig. 2b). This value is slightly higher than the previous one of ca. 15–20 nm reported by Abe [22] based on scanning electron microscopy (SEM), which may be related to the difference in measurement technology. In the present study, due to the need to remove the interference signals of hemicellulose and lignin, delignification and alkali hydrolysis were carried out on the samples when calculating the size of microfibril aggregates. The dissolution of lignin and hemicellulose may lead to the increase of cellulose microfibril aggregates [11]. But this increase is unlikely a simple combination of adjacent cellulose microfibril aggregates, otherwise a much greater value will be obtained. Here, the size increase of microfibril aggregates was only 5–6 nm. This may be due to the removal of the matrix material, resulting in the expansion of the microfibril aggregates, or the existence of the microfibril bridge proposed by Boyd et al. [23] combined with the microfibril aggregates to form a 5–6 nm larger structure, which is consistent with our results (Fig. 2b). Furthermore, the size of microfibril aggregates between bamboo fibers and parenchyma cells were compared and found that there is a significant difference between them. One might think that the difference in size of moso bamboo fiber and parenchyma cell microfibril aggregates is caused by the accumulation of cellulose during the drying process. However, the same difference was observed by AFM [24]. Abe [25] also found that there were differences in microfibril aggregates among wood, rice straw and potato tuber, suggesting that size of microfibril aggregates depends on the plant source. Thus, it is plausible that the aggregation patterns of cellulose microfibril differ among different cell types.
3.2 The Size of Microfibril Aggregates Measured by FE-SEM
CP/MAS 13C-NMR measures the average values of the entire cell wall. In contrast, FE-SEM illustrates the localized ultrastructure of the cell walls of bamboo fiber and parenchyma tissue. Fig. 3 shows the image which reveal the whole moso bamboo fiber from the fiber cell wall surface side to the lumen side. Microfibril aggregates were readily observed in the broad lamellae. Visual comparison of the three images suggested that there was no significant difference in the size of the microfibril aggregates in the broad wall layers of the fiber cell wall. However, the broad and narrow lamella exhibited drastically different cellulose fibril aggregate size, implying that the microfibril angle in the narrow lamellae might be significantly larger than that in the broad lamellae.
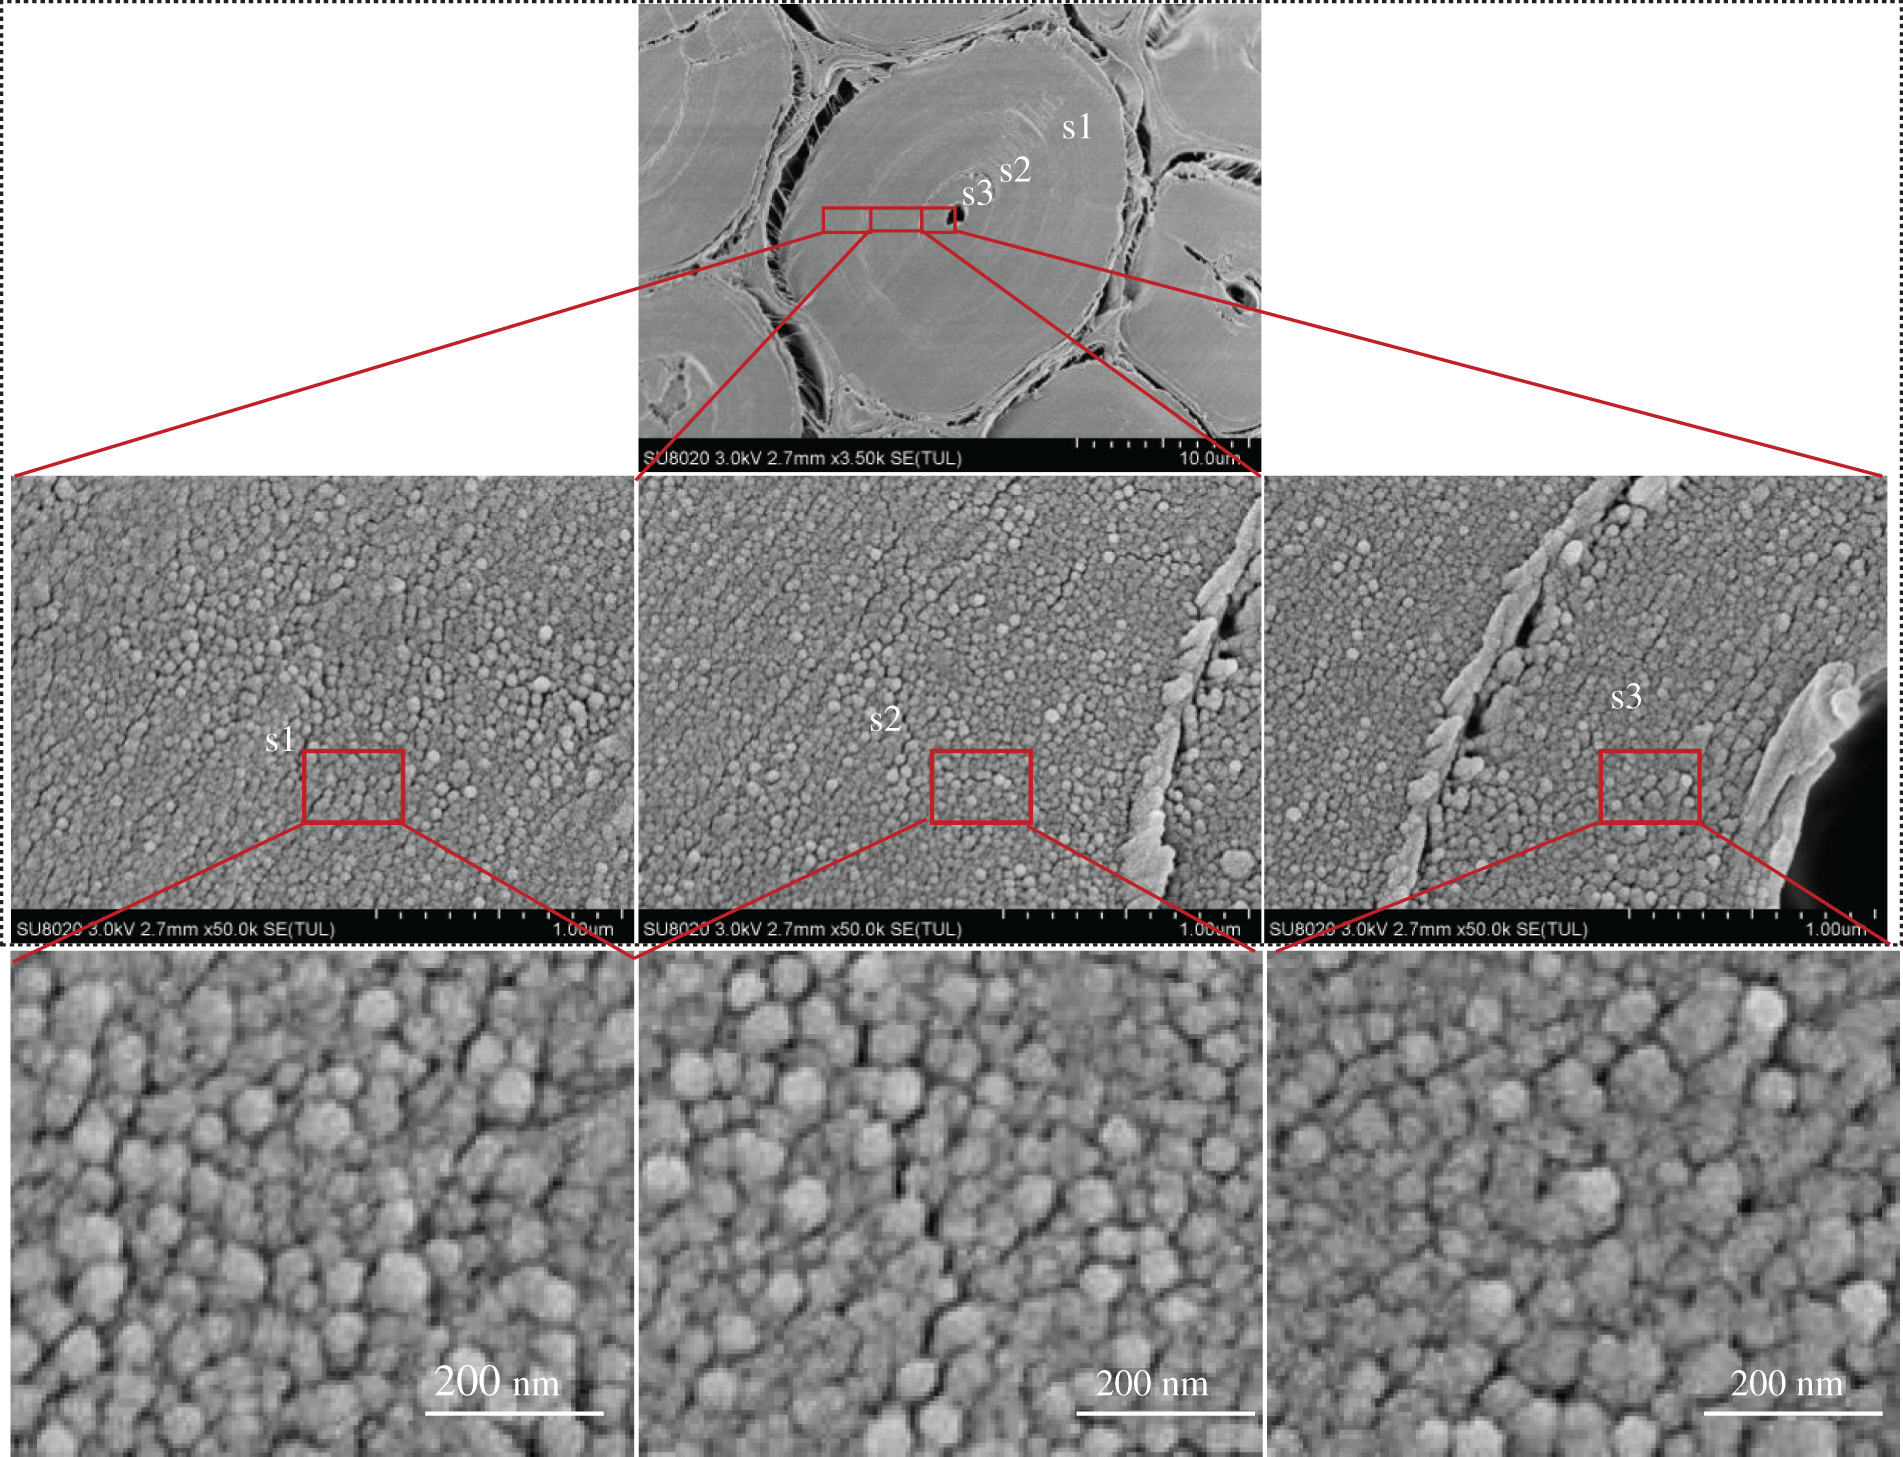
Figure 3: Images taken across the complete cross-section of the moso bamboo fiber wall in the transverse direction; from the middle lamella to the lumen side of fiber
In order to further explore the changes of microfibril aggregate size in the cell wall layer, SEM images were analyzed to measure the microfibril aggregate size. From each sample, five different cells were analyzed. The fiber cell wall of moso bamboo consists of 3 broad layers, namely s1, s2, and s3 (as see Fig. 3). The size of microfibril aggregates in each layer were measured using Image Pro Plus. The average sizes of the cellulose aggregates of different wall layers of fiber are shown in Fig. 4. The bamboo fiber microfibril aggregates had sizes of 26.50 nm, 26.42 nm and 25.49 nm for s1, s2 and s3, respectively. The sizes of microfibril aggregates in bamboo fiber determined by SEM in Fig. 4 were slightly higher than the results obtained using AFM [4]. It was probably due to the microfibril aggregates observed by SEM include cellulose, lignin, and hemicellulose, and it is difficult for SEM to distinguish microfibril aggregates from the matrix. A comparison of the average values of different wall layers of the same fiber unit confirmed that there was no significant difference in the size of the microfibril aggregates of different wall layers of the fiber. Chen et al. [26] found that the size of cellulose microfibril aggregates did not change much in different layers of a cell wall in bamboo fibers, in agreement with a study on wood cell walls [1].
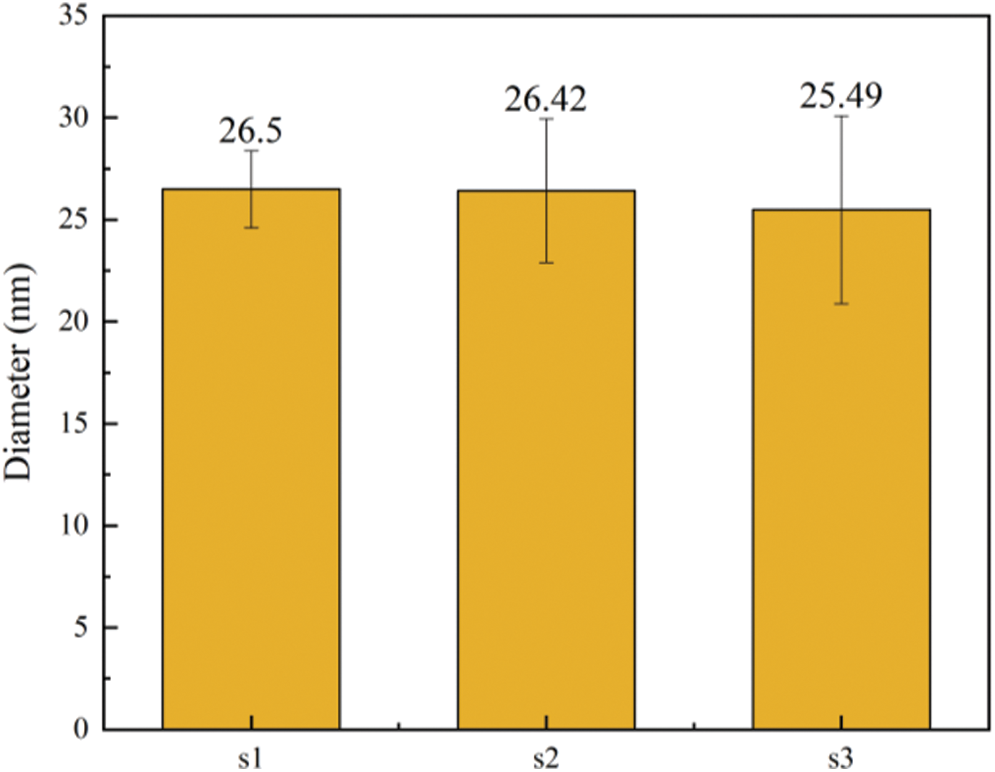
Figure 4: The size distribution of cellulose aggregates of fiber in moso bamboo (a), The average microfibril aggregate size of different cell wall layers (b)
Fig. 5 shows the image of different wall lamellae of a whole moso bamboo parenchyma cell wall. The thickness of each sub-layer of parenchyma cells was almost the same, which is consistent with the observation of Lian et al. [27]. Each sub-layer contains a broad lamellae and a narrow lamellae, and there is a significant difference in the size of the microfibril aggregates of the broad and narrow lamellaes. This result could be interpreted that the orientation of microfibrils is alternating in broad-narrow lamellae of parenchyma cells. Fig. 6 takes a large angle of 60° and a small angle of 10° as examples to show the influence of different microfibril orientations on the size of microfibril aggregates. The narrow lamellae had larger microfibril aggregates while the broad lamellae had smaller microfibril aggregates, which may imply that there are different microfibril orientations in broad-narrow lamellae of parenchyma cells.
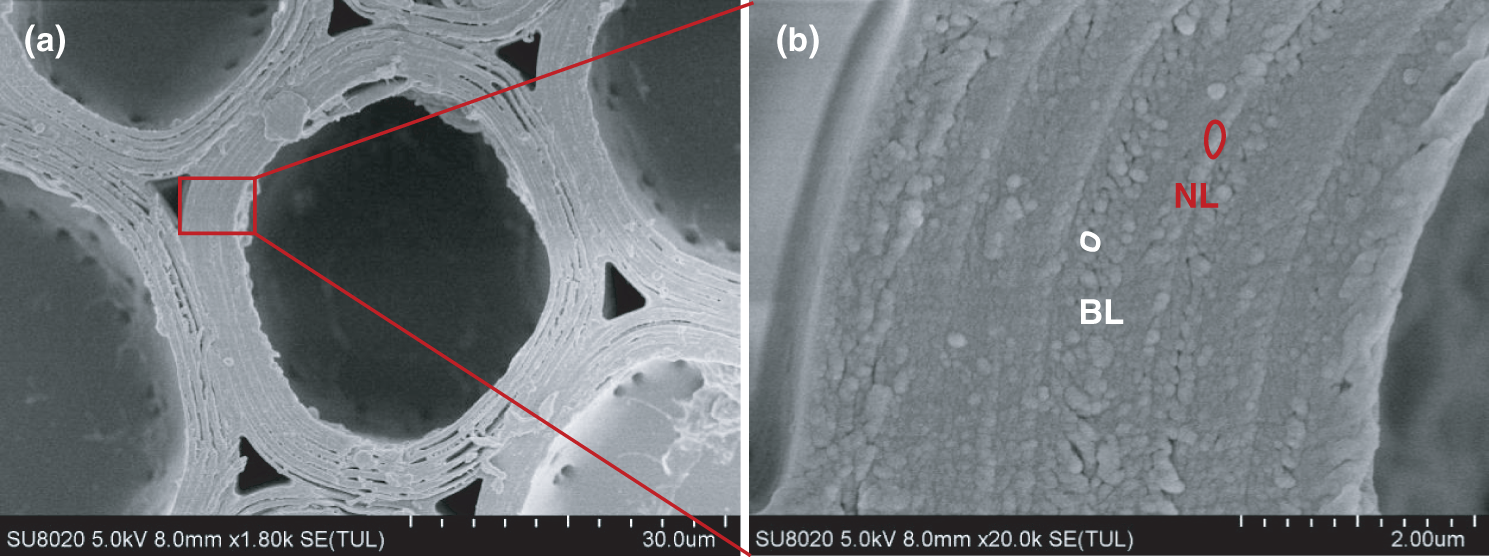
Figure 5: (a) SEM image taken on the cross-section of the parenchyma cell wall of moso bamboo; (b) Partial magnification of (a): Alternating structure of broad (BL) and narrow (NL) lamellae
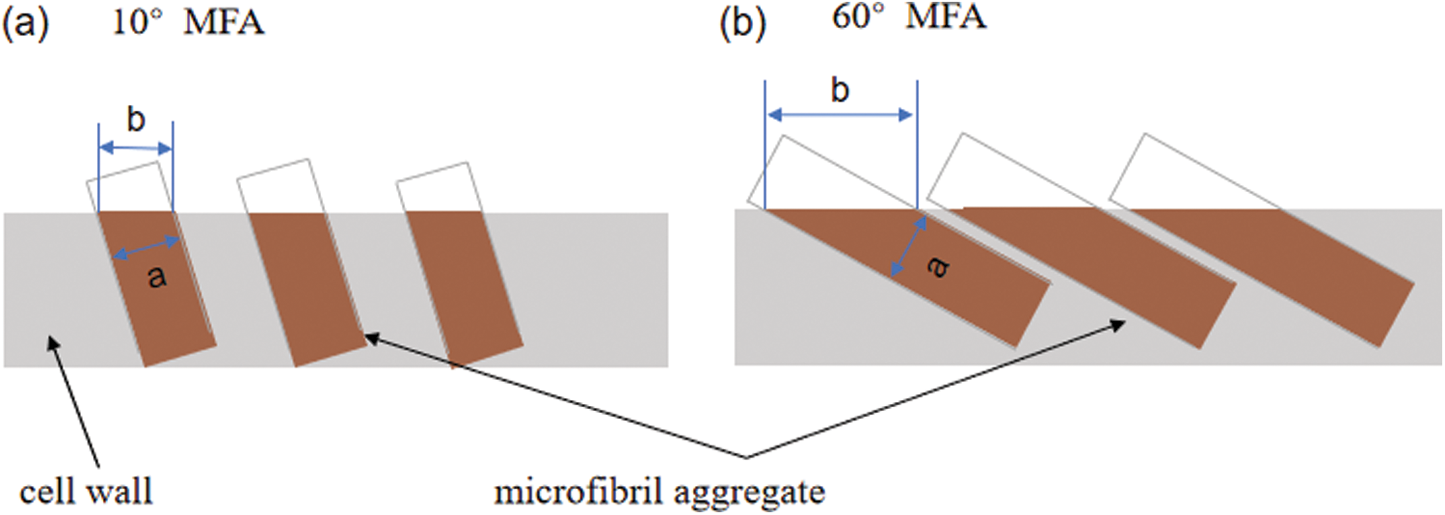
Figure 6: Schematic diagram of a cell showing how the cellulose aggregates change in surface crosssection, a represents the characteristic size of the microfibril aggregates, and b represents the size observed on the cross-section by SEM. (a) 10° MFA, (b) 60° MFA
Each sublayer of parenchyma cells is much thinner (0.2–0.8 µm) compared to bamboo fibers [27]. Since the image analysis is carried out in a larger area, which is larger than the width of the parenchyma cell sublayer, IPP was used to mark the edges of each microfibril aggregate to calculate the size of microfibril aggregates in the broad and narrow lamellae of parenchyma cells and the results was shown in Fig. 7. The size of microfibril aggregates in the broad lamellae and the narrow lamellae varies greatly, ranging from 40 nm to 130 nm. The mean microfibril aggregate sizes were 49.58 (±10.99) nm and 121.69 (±20.19) nm for the broad and the narrow lamellae, respectively. The diameters of the microfibril aggregates of parenchyma cells measured by SEM were significantly greater than the results measured by NMR. This large difference is impossibly caused by the matrix material removed before NMR measurements. In contrast, the size of the microfibril aggregates observed by SEM is mainly affected by the orientation of the microfibrils and the content of the matrix material.
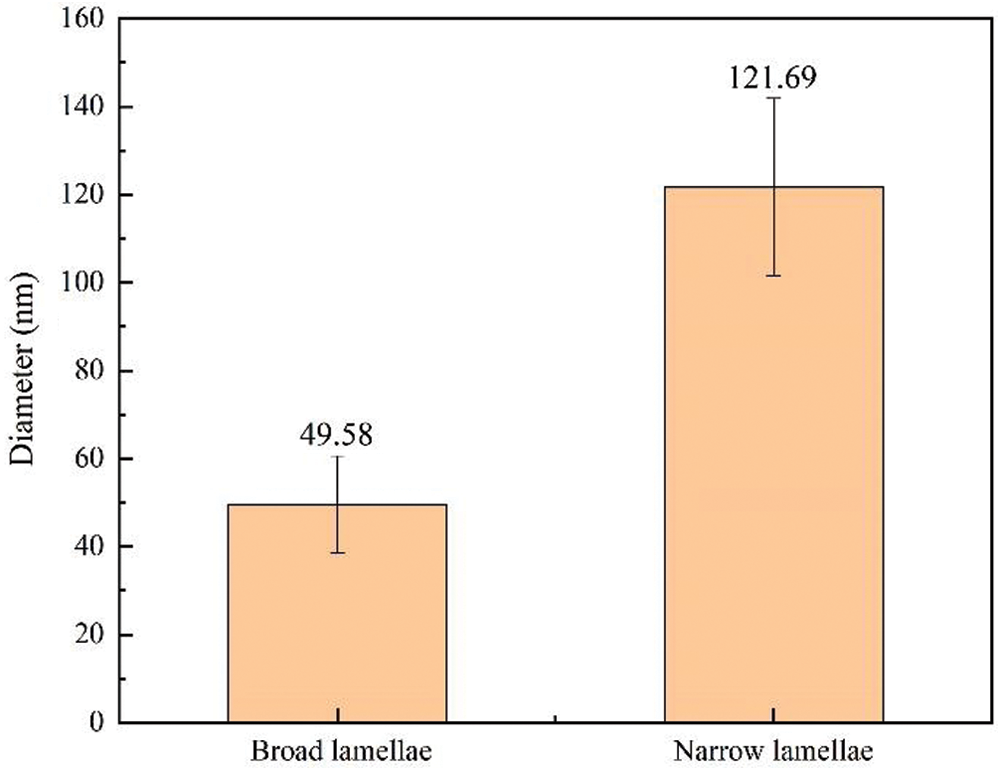
Figure 7: The average sizes of microfibril aggregates in broad and narrow lamellae of parenchyma cell walls
3.3 Arrangement of Microfibril Aggregates in Bamboo
Fig. 8 shows a cross section SEM image of native bamboo fibers and parenchyma cells from moso bamboo. The fiber cell wall had a typical alternating structure of broad and narrow lamellae (Fig. 8a). Fig. 8b shows the enlarged image of the secondary wall layer of a bamboo fiber. Microfibril aggregates were readily observed in the broad lamellae. However, for the narrow lamellae, microfibril aggregates are not obvious in the cross section, which may be caused by the large microfibril angles in these lamellae. For the parenchyma cells, the structure of alternating broad and narrow lamellae can also be observed (Figs. 8c–8d).
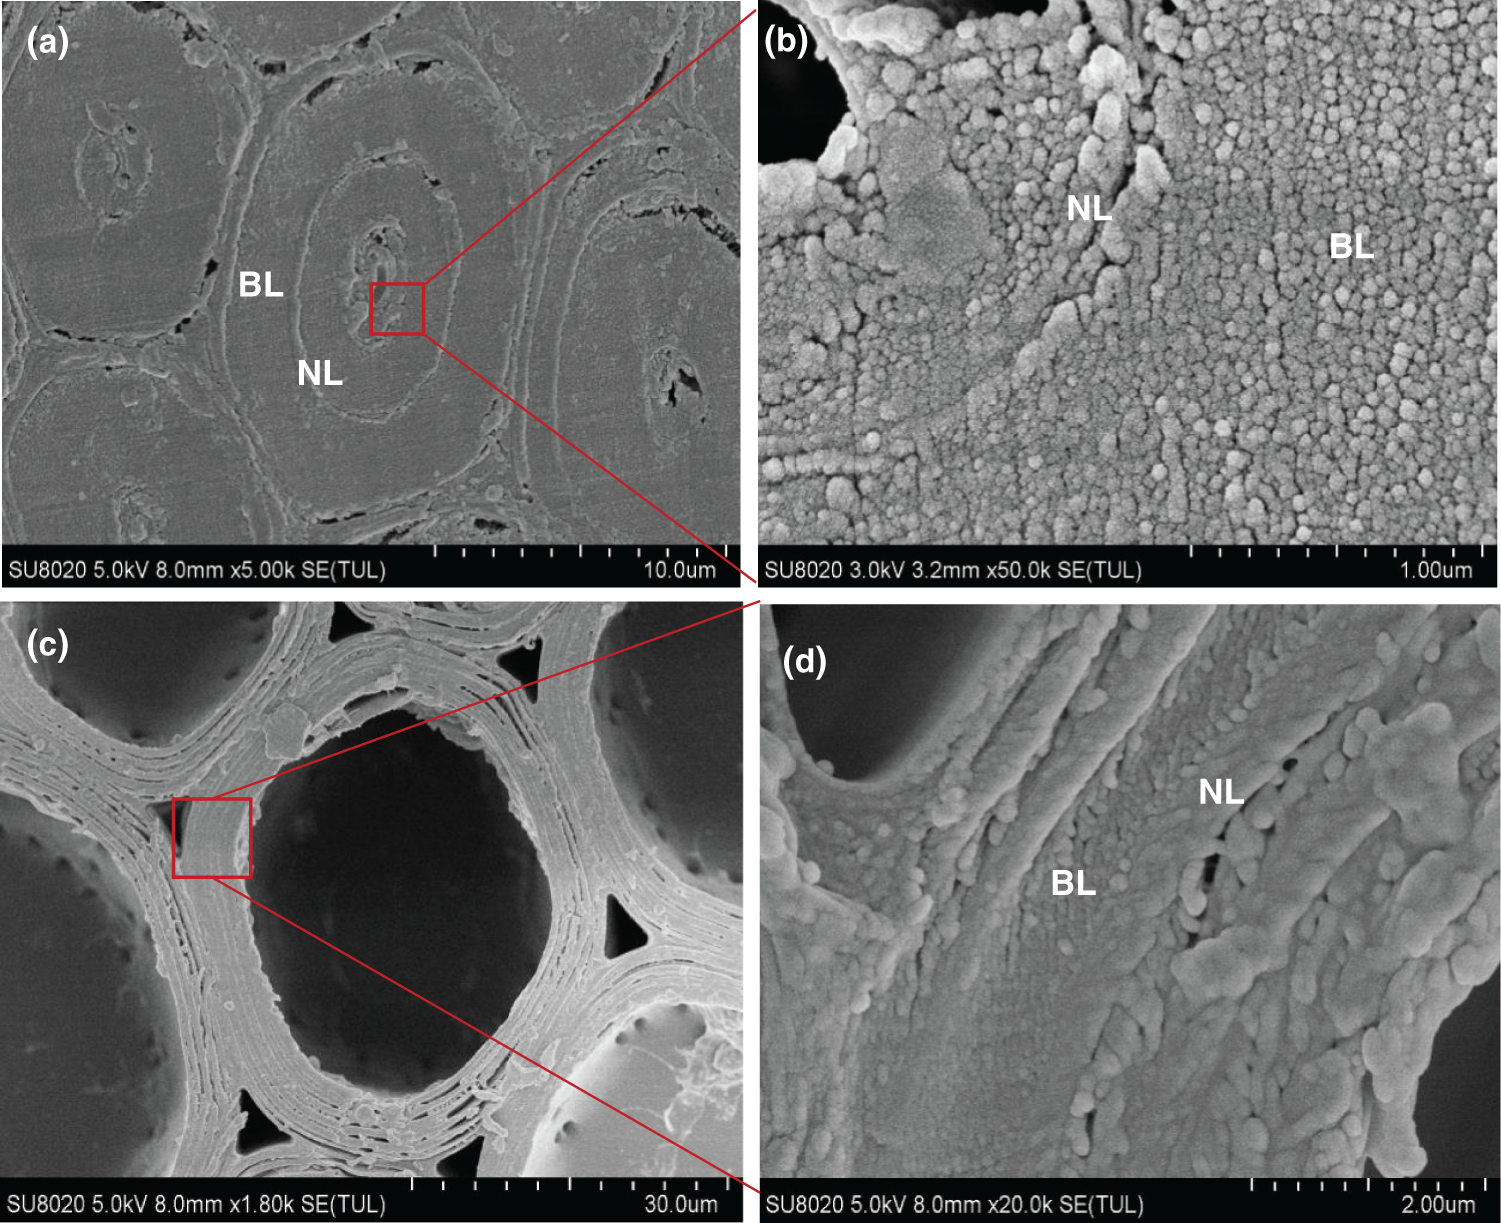
Figure 8: The SEM images of fiber (a, b), and parenchyma cell (c, d) in moso bamboo. BL: Broad Lamellae, NL: Narrow Lamellae
It is widely accepted that the cell wall is composed of microfibril aggregates, but there are still divergences on whether the microfibril aggregates are arranged randomly in the cross section. In this study, most of the microfibril aggregates of the fiber from moso bamboo are arranged randomly (Fig. 8b), but the segmented laminar arrangement can also be seen in individual cells, which may be caused by blade scratches. During sample preparation, cutting or rupture may cause slight distortions, changing the random arrangement of microfibril aggregates to a distinct tangential or radial arrangement. Chen et al. [26] also found random arrangement of bamboo fibers through AFM. However, Parameswaran and Liese [28,29] found radial lamellar structures in bamboo fiber after tensionloaded fracturing. However, there was concentric lamellar patterns on the parenchyma cells (Fig. 8d), which was more pronounced than fibers. The observed lamella patterns of microfibril aggregates could be related to the relatively thinner cell wall layers of parenchyma cells with each sublayer containing only 2–3 microfibril aggregates in the radial direction. This will cause the visual impression of concentric lamella structure arrangement in the parenchyma cells.
The characteristics of microfibril aggregates of fibers and parenchyma cells were observed and measured using field emission scanning electron microscopy (FE-SEM) combined with cross-polarized magic angle spinning 13C nuclear magnetic resonance (CP/MAS 13C-NMR). Microfibril aggregates were clearly visible both in fibers and parenchyma cells. The microfibril aggregates in the fiber were mainly arranged in a random manner, and occasionally show alignment in the tangential direction. However, parenchyma cells have a relatively thinner cell wall layers, which cause the visual impression of concentric lamellar arrangement of microfibril aggregates. NMR spectroscopy found that the average size of microfibril aggregate of the fiber was 25.8 nm, and that of the parenchyma cells was 18.8 nm. In contrast, analysis of SEM images provides details of the surface structure of microfibril aggregates. It was found that the size of the microfibril aggregates in the fiber broad lamellae had little variation, ranging from 25.5 nm to 26.5 nm, indicating that the inherent size of the microfibril aggregates is similar in the different wall layers of the fiber. However, the microfibril aggregate sizes in the broad and narrow lamellae in the fibers and parenchyma cells were distinct, which may be caused by the different orientations of the microfibrils in these layers. These finding furthered our understanding of microfibril aggregates of fibers and parenchyma cells in bamboo.
Author Contributions: Methodology, W. R. and M. L.; Data Analysis, W. R., H. W. and H. X.; Writing-Original Draft Preparation, W. R.; Writing-Review & Editing, F. G. and Y. Y.; Funding Acquisition, Y. Y. All authors have read and agreed to the published version of the manuscript.
Funding Statement: The authors gratefully acknowledge the National Natural Science Foundation (31770600) for its financial support.
Conflicts of Interest: The authors declare that there is no conflict of interest and that the manuscript has been approved by all authors.
1. Fahlén, J., Salmén, L. (2005). Pore and matrix distribution in the fiber wall revealed by atomic force microscopy and image analysis. Biomacromolecules, 6(1), 433–438. DOI 10.1021/bm040068x. [Google Scholar] [CrossRef]
2. Keplinger, T., Konnerth, J., Aguie-Beghin, V., Ruggeberg, M., Gierlinger, N. et al. (2014). A zoom into the nanoscale texture of secondary cell walls. Plant Methods, 10(1), 1. DOI 10.1186/1746-4811-10-1. [Google Scholar] [CrossRef]
3. Åkerholm, M., Salmén, L. (2001). Interactions between wood polymers studied by dynamic FT-IR spectroscopy. Polymer, 42(3), 963–969. DOI 10.1016/S0032-3861(00)00434-1. [Google Scholar] [CrossRef]
4. Fahlén, J., Salmén, L. (2002). On the lamellar structure of the tracheid cell wall. Plant Biology, 4(3), 339–345. DOI 10.1055/s-2002-32341. [Google Scholar] [CrossRef]
5. Singh, A. P., Daniel, G. (2001). The s2 layer in the tracheid walls of picea abies wood: inhomogeneity in lignin distribution and cell wall microstructure. Holzforschung, 55(4), 373–378. DOI 10.1515/HF.2001.062. [Google Scholar] [CrossRef]
6. Donaldson, L. (2007). Cellulose microfibril aggregates and their size variation with cell wall type. Wood Science and Technology, 41(5), 443–460. DOI 10.1007/s00226-006-0121-6. [Google Scholar] [CrossRef]
7. Donaldson, L., Frankland, A. (2004). Ultrastructure of iodine treated wood. Holzforschung, 58(3), 219–225. DOI 10.1515/HF.2004.034. [Google Scholar] [CrossRef]
8. Zimmermann, T., Thommen, V., Reimann, P., Hug, H. J. (2006). Ultrastructural appearance of embedded and polished wood cell walls as revealed by atomic force microscopy. Journal of Structural Biology, 156(2), 363–369. DOI 10.1016/j.jsb.2006.06.007. [Google Scholar] [CrossRef]
9. Casdorff, K., Keplinger, T., Markus, R., Burgert, I. (2018). A close-up view of the wood cell wall ultrastructure and its mechanics at different cutting angles by atomic force microscopy. Planta, 247(5), 1123–1132. DOI 10.1007/s00425-018-2850-9. [Google Scholar] [CrossRef]
10. Thimm, J. C., Burritt, D. J., Melton, D. L. D. (2000). Celery (apium graveolens l.) parenchyma cell walls examined by atomic force microscopy: Effect of dehydration on cellulose microfibrils. Planta, 212(1), 25–32. DOI 10.1007/s004250000359. [Google Scholar] [CrossRef]
11. Duchesne, I., Hult, E., Molin, U., Daniel, G., Iversen, T. et al. (2001). The influence of hemicellulose on fibril aggregation of kraft pulp fibres as revealed by FE-SEM and CP/MAS 13C-NMR. Cellulose, 8(2), 103–111. DOI 10.1023/A:1016645809958. [Google Scholar] [CrossRef]
12. Thimm, J. C., Burritt, D. J., Ducker, W. A., Melton, L. D. (2009). Pectins influence microfibril aggregation in celery cell walls: an atomic force microscopy study. Journal of Structural Biology, 168(2), 337–344. DOI 10.1016/j.jsb.2009.06.017. [Google Scholar] [CrossRef]
13. Fahlén, J., Salmén, L. (2003). Cross-sectional structure of the secondary wall of wood fibers as affected by processing. Journal of Materials Science, 38(1), 119–126. DOI 10.1023/A:1021174118468. [Google Scholar] [CrossRef]
14. Jiang, Z. H. (2007). Bamboo and rattan in the world. Beijing: China Forestry Publishing House. [Google Scholar]
15. Wang, X., Keplinger, T., Gierlinger, N., Burgert, I. (2014). Plant material features responsible for bamboo’s excellent mechanical performance: a comparison of tensile properties of bamboo and spruce at the tissue, fibre and cell wall levels. Annals of Botany, 114(8), 1627–1635. DOI 10.1093/aob/mcu180. [Google Scholar] [CrossRef]
16. Shu, B. Q., Xiao, Z. P., Hong, L., Zhang, S. J., Li, C. et al. (2020). Review on the application of bamboo-based materials in construction engineering. Journal of Renewable Materials, 8(10), 1215–1242. [Google Scholar]
17. Burton, R. A., Gidley, M. J., Fincher, G. B. (2010). Heterogeneity in the chemistry, structure and function of plant cell walls. Nature Chemical Biology, 6(10), 724–732. DOI 10.1038/nchembio.439. [Google Scholar] [CrossRef]
18. Zhang, X. F., Huang, H. X., Qing, Y., Wang, H. K., Li, X. G. (2020). A comparison study on the characteristics of nanofibrils isolated from fibers and parenchyma cells in bamboo. Materials, 13(1), 237. DOI 10.3390/ma13010237. [Google Scholar] [CrossRef]
19. Larsson, P. T., Wickholm, K., Iversen, T. (1997). A CP/MAS 13C-NMR investigation of molecular ordering in celluloses. Carbohydrate Research, 302(1–2), 19–25. DOI 10.1016/S0008-6215(97)00130-4. [Google Scholar] [CrossRef]
20. Newman, R. H. (1999). Estimation of the lateral dimensions of cellulose crystallites using 13C-NMR signal strengths. Solid State Nuclear Magnetic Resonance, 15(1), 21–29. DOI 10.1016/S0926-2040(99)00043-0. [Google Scholar] [CrossRef]
21. Heiner, A. P., Kuutti, L., Teleman, O. (1998). Comparison of the interface between water and four surfaces of native crystalline cellulose by molecular dynamics simulations. Carbohydrate Research, 306(1–2), 205–220. DOI 10.1016/S0008-6215(97)10053-2. [Google Scholar] [CrossRef]
22. Abe, K., Yano, H. (2010). Comparison of the characteristics of cellulose microfibril aggregates isolated from fiber and parenchyma cells of Moso bamboo (phyllostachys pubescens). Cellulose, 17(2), 271–277. DOI 10.1007/s10570-009-9382-1. [Google Scholar] [CrossRef]
23. Boyd, J. D., Foster, R. C. (1975). Microfibrils in primary and secondary wall growth develop trellis configurations. Canadian Journal of Botany, 53(23), 2687–2701. DOI 10.1139/b75-297. [Google Scholar] [CrossRef]
24. Jin, K. X., Kong, L. Y., Liu, X. E., Tian, G. L., Yang, S. M. et al. (2019). Understanding the xylan content for enhanced enzymatic hydrolysis of individual bamboo fiber and parenchyma cells. ACS Sustainable Chemistry & Engineering, 7(22), 18603–18611. DOI 10.1021/acssuschemeng.9b04934. [Google Scholar] [CrossRef]
25. Abe, K., Yano, H. (2009). Comparison of the characteristics of cellulose microfibril aggregates of wood, rice straw and potato tuber. Cellulose, 16(6), 1017–1023. DOI 10.1007/s10570-009-9334-9. [Google Scholar] [CrossRef]
26. Chen, H., Tian, G. L., Wu, Z. H., Fei, B. H. (2016). Cellulose microfibril aggregates in cross–Section of bamboo fiber and parenchyma cell wall with Atomic Force Microscopy. Scientia Silvae Sinicae, 52(2), 99–105. [Google Scholar]
27. Lian, C. P., Liu, R., Zhang, S. Q., Yuan, J., Luo, J. J. et al. (2020). Ultrastructure of parenchyma cell wall in bamboo (phyllostachys edulis) culms. Cellulose, 27(13). DOI 10.1007/s10570-020-03265-9. [Google Scholar] [CrossRef]
28. Parameswaran, N., Liese, W. (1976). On the fine structure of bamboo fibers. Wood Science and Technology, 10(4), 231–246. [Google Scholar]
29. Parameswaran, N., Liese, W. (1980). Ultrastructural aspects of bamboo cells. Cellulose Chemistry and Technology, 14, 587–609. [Google Scholar]
 | This work is licensed under a Creative Commons Attribution 4.0 International License, which permits unrestricted use, distribution, and reproduction in any medium, provided the original work is properly cited. |