DOI: 10.32604/jrm.2021.013377
ARTICLE
Numerical Simulation of Sludge Combustion in TTF Precalciner
College of Materials Science and Engineering, Nanjing Tech University, Nanjing, 211816, China
*Corresponding Author: Hongtao Kao. Email: kaoht@163.com
Received: 04 August 2020; Accepted: 16 September 2020
Abstract: The research method of computational fluid dynamics (CFD) is used to study the technology of burning sludge in cement precalciner. The simulation results show that the flow field in the TTF precalciner is stable, the spray effect is good, and no raw meal collapse occurs. The special structure of the TTF (Trinal-sprayed) precalciner allows the pulverized coal and sludge to fully exchange heat with the flue gas and burn. When there is no sludge burning in the furnace, the decomposition rate can reach 92.1%, and the maximum temperature of the precalciner can reach 1600 K. When the moisture content of the sludge is constant, as the amount of sludge increases, the overall furnace temperature shows a downward trend and the minimum temperature at the precalciner outlet can be reduced to 1080 K. The phenomenon shows that sludge has a great influence on furnace temperature. In order to ensure that the decomposition rate of the raw meal is not less than 85%, the decomposition rate of the raw meal under different conditions is calculated. It was found that the sludge input can be about S-20% when the mositure content of the sludge is 50%. Moreover, when the water content of the sludge is 60%, the burning amount of sludge cannot be higher than S-20%, which ensures the normal decomposition of cement. The addition of sludge reduces the temperature in the precalciner and further inhibits the generation of thermal NOx. The reduction of CO content produced by incomplete combustion of pulverized coal indicates that CO suppresses the production of fuel-type NOx. The NOx concentration at the gooseneck is as low as 522 mg/Nm3. Additionally, it was also found that when the sludge input is fixed, the NOx concentration decreases with the moisture content of the sludge increasing, indirectly proving the inhibitory effect of H2O on NOx.
Keywords: Sludge combustion; numerical simulation; TTF precalciner; NOx reduction
In recent years, with the acceleration of urbanization in China, various types of urban industries have rapidly developed, such as paper mills, breeding plants and power plants, producing huge amounts of sludge. The quantity of municipal sludge in 2020 have reached up to 52.92 million tons and the national investment in sludge treatment will reach 86.6 billion yuan in 2023. Thus, it is necessary to seek an effective and economical sludge treatment method [1]. Incineration is an effective approach of sludge treatment. It can reduce the volume of sludge and recover its energy. Sludge combustion will release NOx and SO2 after combustion, and inorganic substances cannot be recovered and used [2]. In the process of cement burning, the use of precalciner to burn sludge can solve this problem. However, the precalciner is at high temperature and high pressure during operation, and it is difficult to study this process by setting up experiments. Therefore, the use of computer simulation has become an valid method [3].
Research on sludge combustion disposal has already begun in some developed countries, such as the United States, Switzerland, Japan and other countries as early as 1959, and the technology is very mature today [4]. However, in the incineration treatment technology, sludge incinerators and fluidized bed incinerators are mainly studied. The first fluidized bed for burning sludge in the world was built in Lynnword, Washington, USA in 1962 and is still in use [5]. Most of the large-scale sewage treatment plants in Japan now use the combustion method to treat sludge. With the increasing environmental protection requirements of the various countries in sludge treatment, the sludge combustion method has become more and more popular because of its maximum volume reduction and harmless effect [6]. Sludge combustion treatment in China started relatively late, and the proportion of sludge combustion is not high. However, sludge combustion has received more and more attention recently [7]. There are basically two technical routes for domestic sludge combustion: One is to build an independent sludge combustion and disposal system, the other is to rely on the original equipment of power plants and cement plants to incinerate sludge after certain transformations on above basis. The cement production volume of China ranks first in the world and cement production lines are spread all over the country. Hence, the government has started to attach importance to the joint treatment of sludge in the cement industry in 2016. But due to the complex composition of the sludge, the high water content and the release of atmospheric pollutants from combustion, it is necessary to be controlled and treated in a harmless manner. Lin et al. [8] studied the combustion of sewage sludge and municipal solid waste in an incinerator via numerical simulation, and the results showed that the mixture of semi-dry sludge and solid waste is more suitable for combustion in an incinerator. Liu et al. [9] compared the amount of greenhouse gas produced during the combustion process of biologically dried and dried sludge. Studies have revealed that the combination of biological drying and combustion produces about half of the greenhouse gas emissions compared with dry combustion. Therefore, biological drying treatment of sludge before combustion is more conducive to environmental protection. Analysis of the above research shows that the research on sludge combustion is mainly to achieve harmless and green treatment. Although there are many studies on the treatment of sludge in incinerators, and the technology is also very mature, its establishment cost is high. Moreover, as a large manufacturing country, China produces a large amount of sludge, and the processing capacity of sludge incinerators is very limited. In this way, it is very promising to utilize the coordinated combustion of sludge in the cement industry. This research is to discuss the technology of burning sludge in the precalciner. It is mainly through simulation research to analyze the distribution of temperature and flow field in the furnace when sludge with different moisture content is input at different amounts. At the same time, the distribution and content of the gas-solid field in the furnace were analyzed and compared with the actual collected data. Through the temperature field and calculating the decomposition rate of the raw meal in the precalciner, the sludge treatment capacity under different conditions can be obtained. The relationship between CO, CO2, CaCO3, CaO and the input of sludge the distribution as well as change of pollutant NOx can be obtained through the distribution of gas-solid concentration field. The results and data obtained from these work provide a basis for the transformation of sludge burning equipment in cement plants.
Herein, mathematical and physical models and computational fluid dynamics (CFD) software (ANSYS FLUENT) is used to simulate the combustion of sludge in the TTF precalciner, mainly discussing the distribution of the temperature and gas-solid concentration field of the precalciner under different sludge input [10]. The selection criteria for the input sludge volume are built on the input of the pulverized coal. When the moisture content of the sludge is 50%, the input of the sludge is 10%, 20%, 30% and 40% of the input of pulverized coal, respectively. These are defined as S-10%, S-20%, S-30% and S-40%.When the moisture content of the sludge increases to 60%, 70% and 80%, sludge input remains at S-10%, S-20%, S-30% and S-40%. The sludge used throughout the present study is under a moisture content of 50%–80%, and a calorific value of approximately 2,000 kJ/kg (the bituminous coal calorific value is generally above 20,000 kJ/kg) [11–13]. In realistic applications, the results obtained through using simulation software to simulate fuel combustion and raw meal decomposition are not reliable. Therefore, the data collected on the production site were compared with the simulation results to ensure the rationality of the simulation results. Furthermore, the research on the quality of the reaction mechanism for the precalciner is also beneficial to determine reasonable control parameters and can improve the accuracy of the simulation.
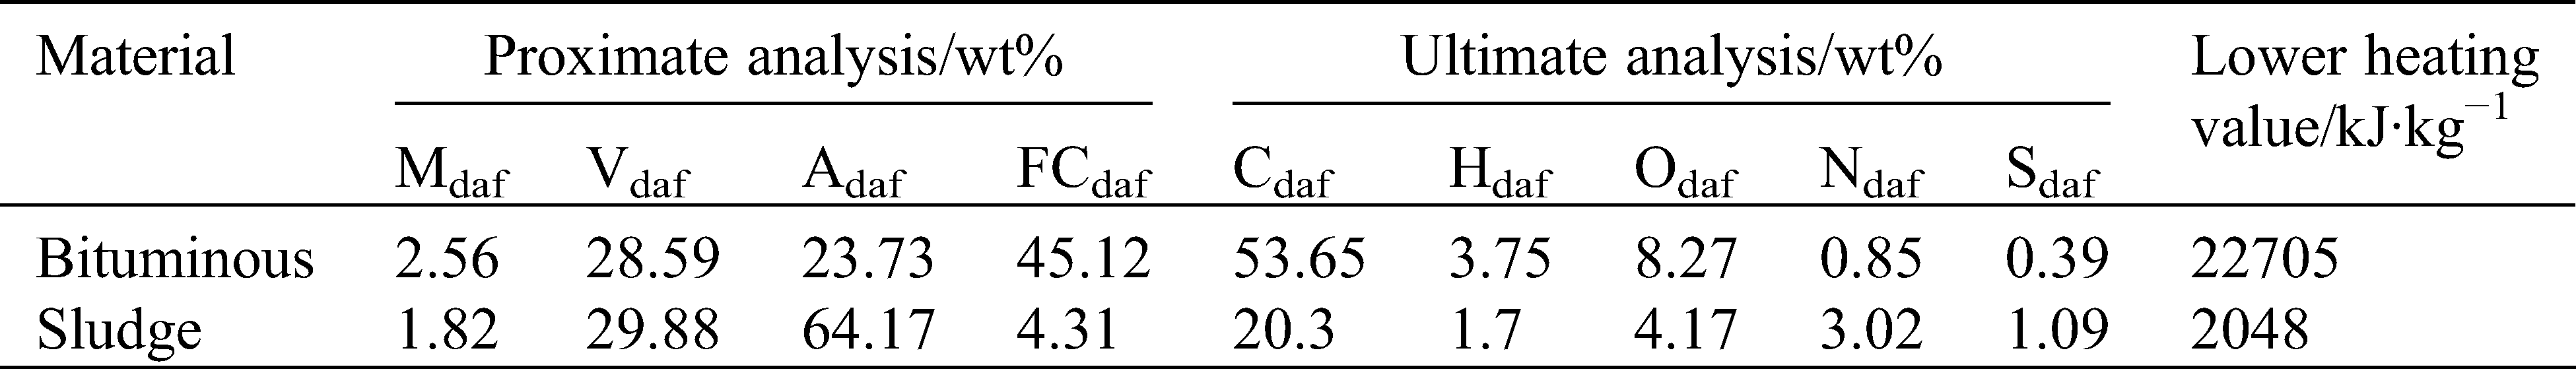
The pulverized coal sample was bituminous coal [14,15]. The sludge sample collected was sludge treated by a sewage treatment plant in Yunnan. According to the analysis of the sludge composition in Tab. 1. The main components of sludge are SiO2, Al2O3, Fe2O3 and H2O. Among them, SiO2, Al2O3, Fe2O3 accounted for 49.47%. Therefore, SiO2, Al2O3, Fe2O3 and H2O can be used to replace the main inorganic composition of sludge. However, SiO2, Al2O3, Fe2O3 are not defined in the fluent material library. Therefore, the fluent user-defined (UDF) interface was used to define the physical properties of the material, and define the new material, while introducing a heat source to simulate the heat release of sludge [16,17]. Comparing the burning loss of raw meal and sludge, it is found that the sludge content is higher, and the sludge loss is as high as 41.36%. Research conducted by Houdkova [18] showed that the nitrogen content of the sludge is higher than that in pulverized coal. It can also be known from the proximate analysis and ultimate analysis in Tab. 2 that the N element content of sludge is higher than that of pulverized coal. Therefore, the control of NOx during sludge combustion is also particularly important.
Table 1: The chemical composition analysis of raw meal, clinker and sludge
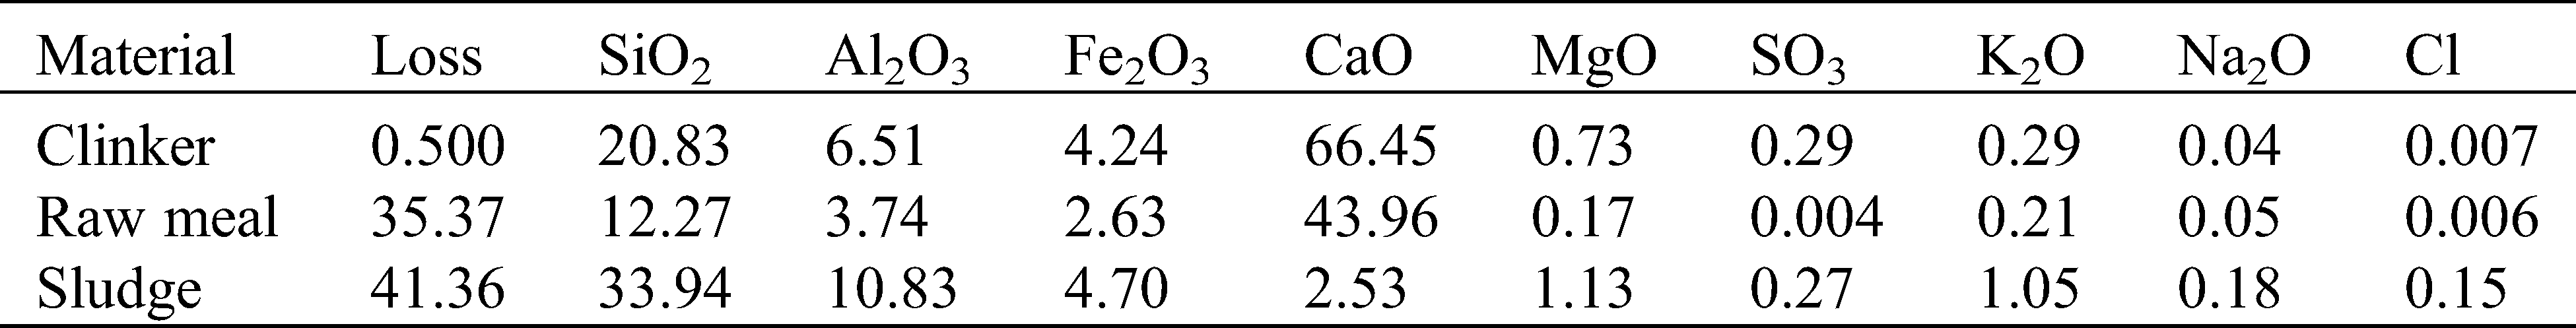
Table 2: Proximate analysis and ultimate analysis of the data of coal and sludge
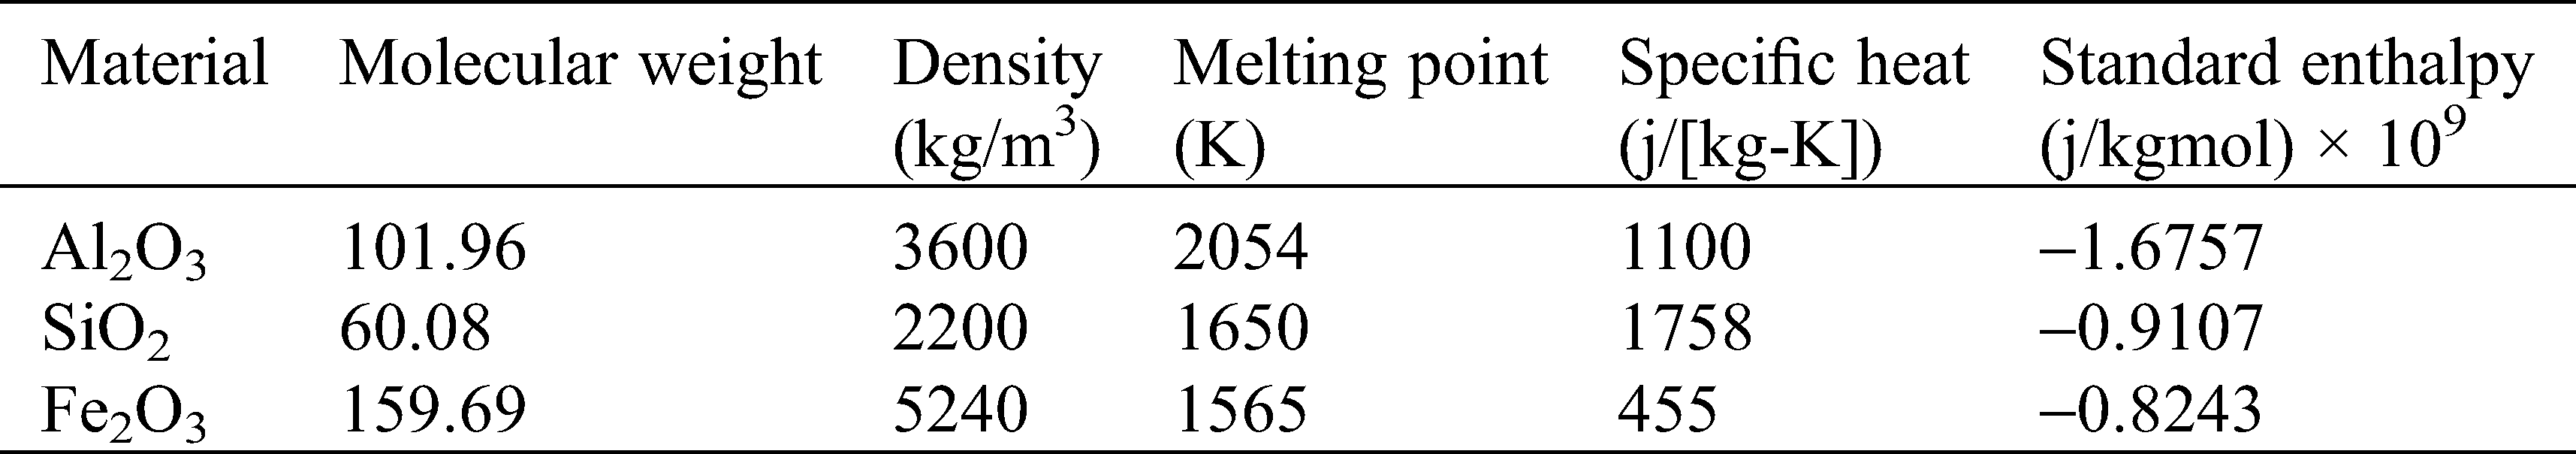
The physical property parameters of SiO2, Al2O3 and Fe2O3 in the sludge particles are listed in Tab. 3.
Table 3: Physical property parameters of various components in sludge
The specific heat should be based on the calculation study of Robie et al. [19], as showed in Eq. (1).

where:  is the specific heat (J/(g × K)),
  is the enthalpy of solid materials at temperature
 ,
,  is the enthalpy of solid materials at temperature 298 K, and
  is the molar mass that corresponds to the solid matter.
3 Geometric Model and Numerical Theory
Fig. 1 presents the structure and mesh of the TTF precalciner. As presented in Fig. 1a, the main body size of the precalciner is 57.5 m and the maximum diameter is 7.1 m. The model can be divided into the lower cone, the first combustion chamber, the middle of the precalciner, the upper part of the precalciner and the gooseneck. ICEM commercial meshing software was used for the discretion of the structural hexahedral meshes of the model, resulting in 975,392 meshes. As demonstrating in Fig. 1b.

Figure 1: TTF precalciner structure and mesh. (a) Structure. (b) Mesh
3.2 Mathematical Governing Equation
3.2.1 Turbulence Governing Equation
The turbulence control equation adopts the  standard two-equation model. Turbulence governing equations such as Eqs. (2)–(7).


In order to close the equations, continue to model  .
.


where  and
and  are the production terms of turbulent kinetic energy
  and turbulence dissipation
  ,
,  and
and  are the dissipation terms of
  and
and  , respectively.
  is the molecular viscosity coefficient.
  is the eddy viscosity coefficient.
  and
and  are correction factors, which were 1.44, 1.92.
3.2.2 Species Transport and Discrete Term Equation
(1) Species transport equation
In the turbulence calculation domain, the transportation of chemical reaction species needs to be solved by solving the species transport equation. The general form of the species transport equation is as Eqs. (8)–(9)


where  is the net rate of production of species i by chemical reaction and
  is the rate of creation by addition from the dispersed phase plus any user defined sources.
  is the turbulent schmidt number. The default
  is 0.7.
(2) Discrete term equation
The discrete phase model is used to introduce coal particles and track their trajectories. The distribution of pulverized coal particles conforms to the rosin-rammler distribution function. The average particle size is 16.38  . Eqs. (10) and (11) are the particle force balance equations. The trajectory of particles in the turbulent flow field is predicted by the average fluid velocity in the equation. Combining Eq. (12) can be coupled to solve the ordinary differential equations to obtain the particle trajectory.


where  is an additional acceleration term,
  is the droplet or particle relaxation time,
  is the fluid phase velocity,
  is the particle velocity,
  is the molecular viscosity of the fluid,
  is the fluid density,
  is the density of the particle, and
  is the relative reynolds number.
In the precalciner, radiation heat exchange accounts for more than 95% of the heat transfer in the furnace, and considering the limitation of calculation conditions, the  radiation model is selected. The radiation heat transfer equations are as Eqs. (13)–(16).


The transport equation for G is


where  is absorption rate,
  is reflectivity,
  is transmittance,
  is radiation flux,
  is the absorption.
  is the scattering coefficient,
  is the incident radiation,
  is the linear-anisotropic phase function coefficient,
  is the refractive index of the medium,
  is the Stefan-Boltzmann, and
  is user-define radiation source.
3.3 Fundamental Governing Equations of Fluid Mechanics
Fluid flow is governed by the laws of conservation of physics. The Eqs. (17)–(21) are the equations of conservation of mass, conservation of energy and conservation of momentum. In turbulent and multi-component states, the conservation of components and additional turbulent transport equations must also be followed. Such as Eq. (22).
(1) Mass conservation equation

(2) Momentum conservation equation


(3) Energy conservation equation

(4) Component conservation equation

where  is density and
  is time.
  is the velocity vector, and
  is dynamic viscosity.

 is the generalized source term of the momentum conservation equation.
  is the specific heat capacity,
  is the temperature,
  is the heat transfer coefficient, and
  is viscous dissipation term.
  is the volume concentration of component s,
  is the diffusion coefficient of the component, and
  is the productivity.
3.4 Reaction Kinetic Mechanism
3.4.1 CaCO3 Decomposition Reaction Kinetics
As shown in Eq. (23), the CaCO3 decomposition reaction equation indicates that CaCO3 decomposes into an endothermic reaction. The decomposition reaction of CaCO3 is a heterogeneous chemical reaction based on volume reaction [20,21]. The kinetic parameters are obtained through the reaction kinetic equation established by Eqs. (24)–(26), namely the pre-exponential factor  and activation energy
  , which are 156 kJ/mol and
  respectively. This value is used as an input parameter during simulation to control the decomposition of CaCO3.


where Eq. (24) is arrhenius equation, which is an empirical formula.  is the gas constant, and the value is 8.314 J/(mol·K).
  is the equation related to the reaction order, where
  is the conversion rate.
3.4.2 Combustion Mechanism of Pulverized Coal and Sludge
Pulverized coal goes through three stages in the combustion process. That is, the volatilization of water, the release of volatiles and the combustion of coke [22–24]. The combustion equation of coal volatiles and the reaction process of carbon combustion are as showed in Eqs. (27) and (28), respectively. Where  represents the mechanism factor, and it is between 1 and 2. When the temperature is around 900 K, carbon is burned to produce CO. While below 900 K, CO2 is mainly produced [25–27].


The combustion process of sludge is similar to that of pulverized coal particles. That is, the volatilization of moisture, the release of volatiles, and the combustion of organic matter and coke. When these sludge particles are heated, the sludge is in the pyrolysis stage before the volatiles and organic matter are not burned, and the sludge is converted into Coke, bio-oil and tar [28]. The heat produced by the combustion of pulverized coal is transferred to the sludge particles through thermal radiation, the moisture begins to separate out. As the temperature continues to rise, volatiles are released. The release of volatiles generally starts at around 573 K, and the temperature can reach up to 673 K to complete the devolatilization [29–31]. When the volatile matter is completely released, the residual coke starts to burn in the form of a surface reaction. The reaction process of coke is showed in Eq. (29), where:  is defined as the mass of the oxidant per the mass of char.

Combustion characteristics of mixed combustion of sludge and pulverized coal are different from that of sludge single combustion [32,33]. The combustion kinetics of co-combusting sludge and pulverized coal can be investigated through the non-isothermal conversion rate integration method in the Ozawa-Flynn-Wall model. The activation energy and pre-exponential factor of the reaction can be calculated from the experimental data. The advantage of this method is that the pre-exponential factor and activation energy can be calculated without knowing the reaction order. The dynamic equation of the Ozawa-Flynn-Wall model is showed in Eqs. (30) and (31). The sludge combustion dynamic parameters were derived from a literature [34,35].


where:  is the heating rate,
  is the pre-exponential factor,
  is the activation energy,
  is the gas constant,
  is the weight-loss ratio of the sample,
  is the absolute temperature that corresponds to the value of
  , and
, and  is the power series expansion for the integration of the exponential term of Eq. (30).
3.5 Boundary Conditions and Grid Independence Test
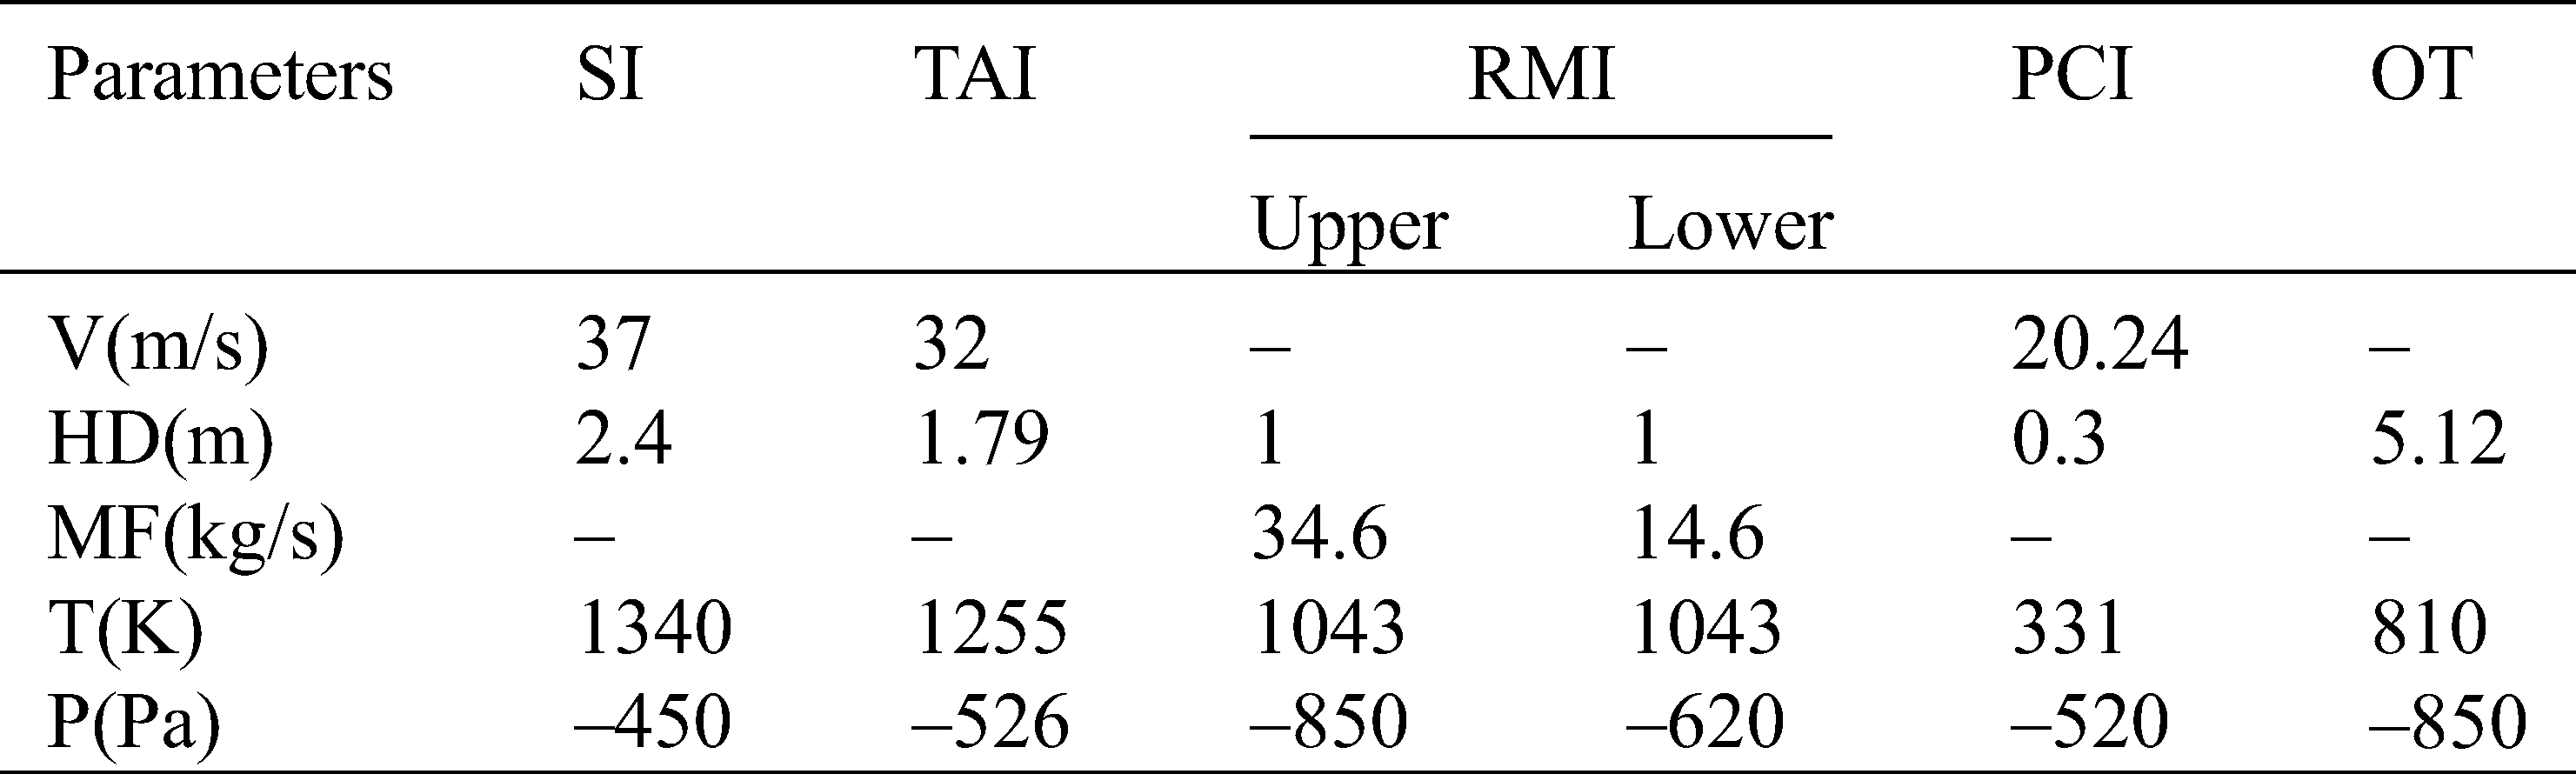
According to the data obtained from the thermal calibration of cement, the PR (parameters) of the boundary conditions for the numerical simulation are given in Tab. 4. SI (smoke inlet), TAI (tertiary air inlet) and PCI (pulverized coal inlet) are the velocity inlets. RMI (raw meal import) is configured on MF (mass flow). OT (outlet) adopts the P (pressure) outlet. The particle phase is set to escape at the exit, and the remaining inlet boundary and wall surface are placed to reflect. That is, particle phase rebounds at this boundary. The HD (hydraulic diameter) and T (temperature) parameters of each inlet and outlet are listed below.
Table 4: Boundary condition parameter setting of the precalciner inlet and outlet
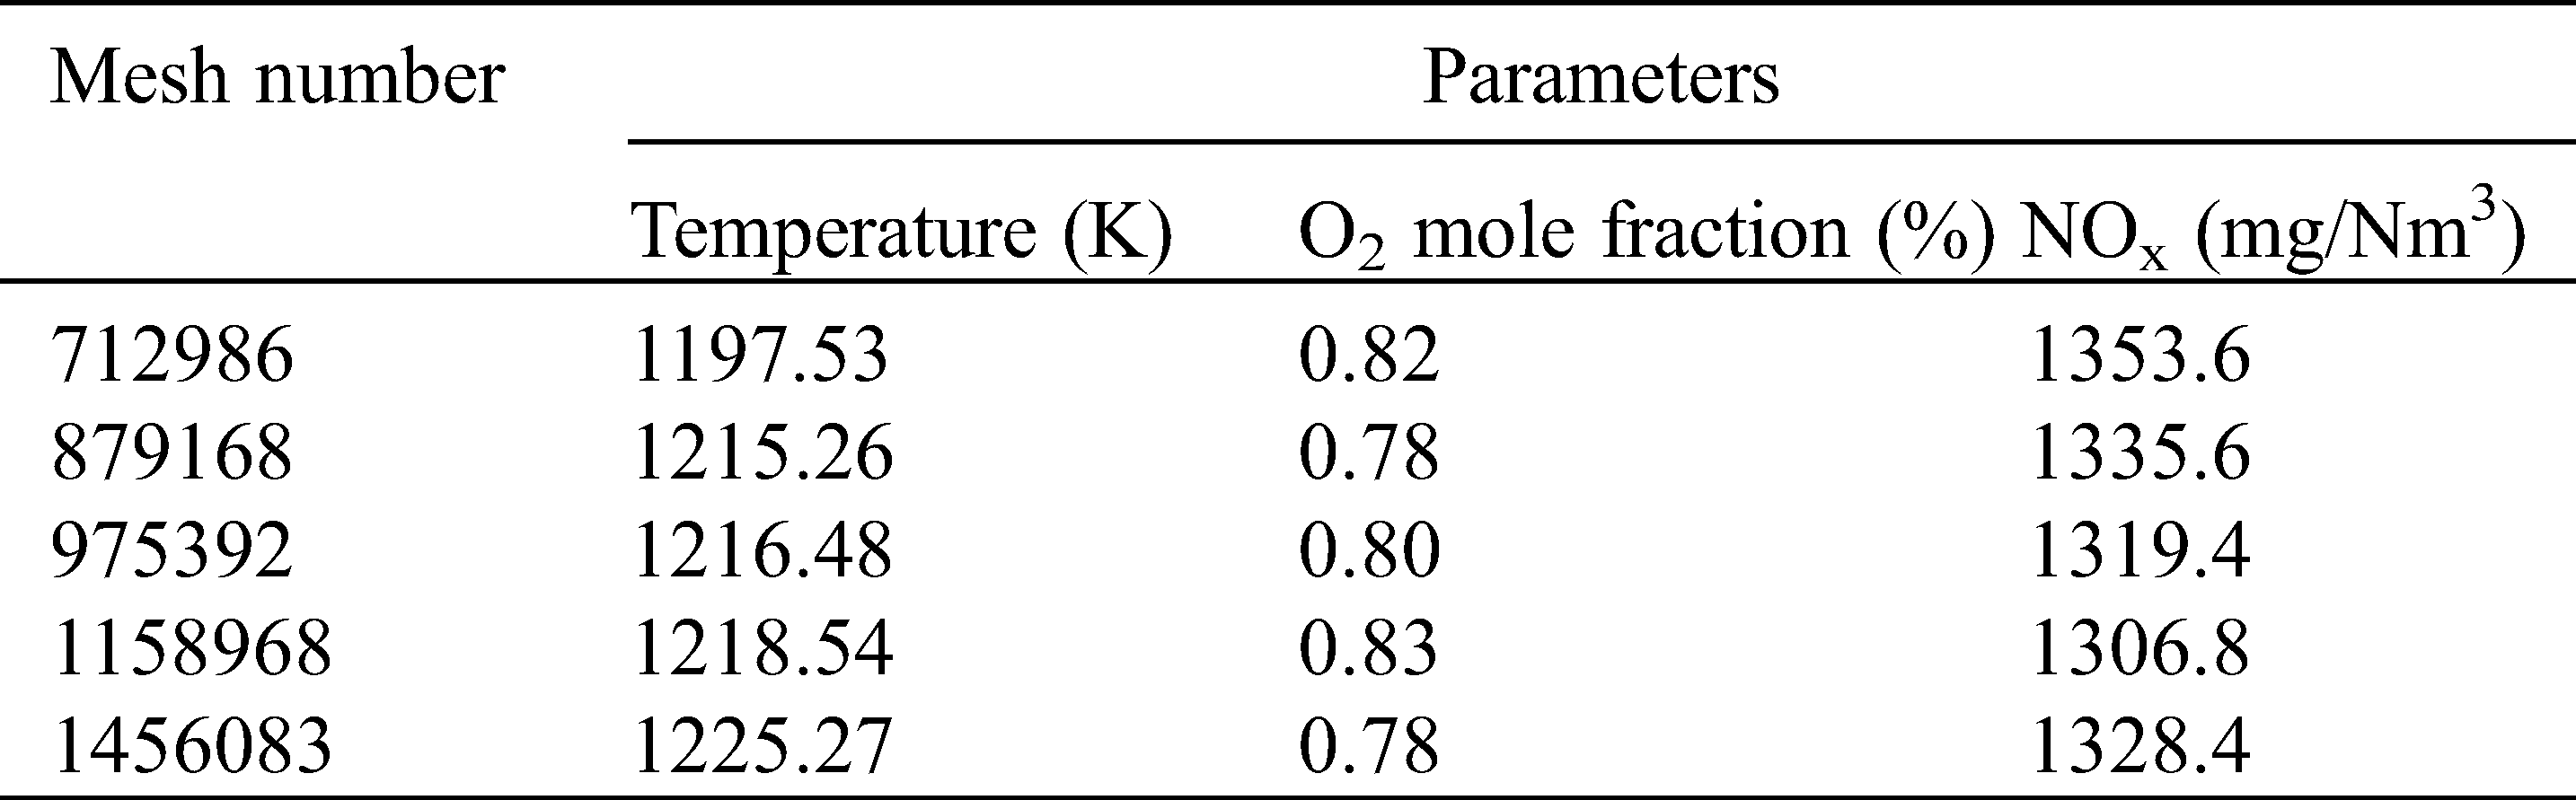
The mesh is a combination of computational units generated by mathematical discretization based on the finite volume method. In ANSYE ICEM meshing software, the topological structure of the model needs to be divided to obtain the computational grid. In the process of grid establishment, the difference in the topological structure and the number of grids may lead to different calculation accuracy. Therefore, mesh-independent has to be tested. Tab. 5 shows the temperature, O2 and NOx content under five grid numbers (712986 cells, 879168 cells, 975392 cells, 1158968 cells, and 1456083 cells) for sludge-free input. According to the data obtained from Tab. 5, the sensitivity and dependence of the mesh are analyzed, and the results show that the number of grids (975392 cells) has no effect on the results in this study.
Table 5: Mesh-independent verification without sludge input
4.1 Flow Field and Temperature Field Analysis
Fig. 2 is the flue gas and tertiary air streamlines in the precalciner. Fig. 2a shows the tertiary air encounters at Y = 7 m after the lower flue gas is injected, which enhances the swirling flow and provides favorable conditions for material transportation. Fig. 2c is a partial enlarged image. Fig. 2b is a velocity vector illustration. Between Y = 1 m and Y = 5 m, the flue gas swirls upward with the flow field. When Y = 7 m, the overall velocity increases to about 34 m/s, which is due to the spurt effect caused by the encounter of the two wind, resulting in an increase in the flue gas velocity. This is also in line with the design effect in the TTF precalciner. Additionally, there are two necks on the main body of the precalciner. The function of the necking is to improve the spray effect in the furnace. The main body of the precalciner is relatively high, and the transportation of materials in the furnace requires power. When the material passes through the necking, the speed of the material will increase owing to spray. The hierarchical design of the necking makes it easier for materials to be transported to the precalciner.

Figure 2: Flue gas and tertiary air streamline in the precalciner. (a) Gas and tertiary streamlines. (b) Vector illustration. (c) Enlarged image
Fig. 3 is a streamlined diagram of coal wind and raw meal flow. The lower raw meal pipe and pulverized coal pipe are located near the tertiary air. It can be observed from Fig. 3a that the raw meal and pulverized coal are transported upward under the swirl formed by tertiary air and lower flue gas after entering the precalciner. As shown in Fig. 3c, the flow field was stable and no raw meal collapse occurred. It is also found that pulverized coal first contacts with flue gas to preheat near the wall when it enters the precalciner and then fully mixed with the raw meal conveyed upward through the vortex formed by the lower flue gas. The oxygen carried by the tertiary air also provides a good oxygen-rich environment for the combustion of pulverized coal, which is conducive to the full combustion of pulverized coal. Analyzing the lower heating of pulverized coal and sludge provided in Tab. 2, the lower heating of pulverized coal is 22705 kJ/kg and the lower heating of sludge is 2048 kJ/kg. Although the sludge contains a certain calorific value, it is very low relative to pulverized coal. Furthermore, sludge and pulverized coal enters the precalciner from the same point. Therefore, short-term preheating of pulverized coal and sludge in contact with high-temperature flue gas can reduce the impact of sludge combustion heat absorption on pulverized coal combustion. The oxygen-rich environment also increases the apparent activation energy of the sludge combustion reaction, which is also contributes to the progress of the sludge combustion reaction [36]. From the velocity distribution contour diagram in Fig. 3b, we found the low-velocity region (indicated by the red arrow) formed inside. This is due to the low-pressure and low-velocity region formed by the back mixing of the material after entering the precalciner, which is beneficial to the full mixing of the material. After reaching the first combustion chamber, the pulverized coal begins to be heated and burned to provide heat for decomposing the raw meal.

Figure 3: Streamlined diagram of coal wind and raw meal flow in the precalciner. (a) Raw meal and coal streamline. (b) Velocity contour. (c) Enlarged image
The temperature contour is shown in Fig. 4. When the sludge moisture content is 50% and the sludge input is 10% of the pulverized coal input (S-10%), the temperature of the first combustion chamber can reach up to 1500 K. As shown in Figs. 2 and 3, this is the main place were pulverized coal is burned, so the temperature is highest here. The temperature at the middle and outlet of the precalciner is about 1109 K. The average temperature of the gooseneck is 1100 K, which is relatively low. This is mainly because a large amount of raw meal enters from the raw meal tube and the raw meal decomposes and absorbs heat, contributing to the drop of the temperature. Besides, the study compared the temperature distribution in Fig. 4 without any sludge input. The temperature of the first combustion chamber can reach 1600 K, the overall temperature of the decomposition precalciner is very high, and the temperature of the outlet achieves 1216 K. The phenomenon manifests that the input of sludge will result in the decrease of the overall temperature of the precalciner. With the increase of the sludge combustion volume, it increases to S-20%, S-30%, and S-40% respectively. The maximum temperature of the precalciner is maintained at 1500 K, but the temperature near the outlet drops to 1080 K. Further analyses shows that the sludge can still burn stably under the present circumstances. Nevertheless, the temperature near the outlet will decrease with increasing sludge input. It has a greater impact on the decomposition rate of raw meal and will be further calculated in the following analysis.

Figure 4: When the moisture content of the sludge is 50%, the temperature contour on the XY section under different firing amounts
Fig. 5 shows the temperature contour on the YZ section under different firing amounts when the moisture content of the sludge is 60%. When there is no sludge burning, the temperature at the outlet of the precalciner is 1221 K, and the temperature in the middle of the precalciner is 1200 K. After the sludge is burned, the temperature at the outlet drops to 1082 K and the temperature in the middle drops to 1100 K. Comparing the results in Fig. 4, it is found that the water content of the sludge increases from 50% to 60% and the temperature in the middle of the precalciner is relatively stable under the same firing amounts. After sludge burning volume exceeds S-20%, the outlet temperature will decrease greatly. It can be seen from Fig. 1 that there are upper raw meal pipes distributed at Y = 22 m. In order to ensure that the raw meal here is normally decomposed after entering the precalciner, the temperature must be high enough, so it is very important to maintain the stability of the temperature in the middle of the precalciner. Moreover, it is found that the temperature of the precalciner also decreases with the increase of the moisture content when the firing amounts are the same, which is also consistent with the actual physical effect.

Figure 5: When the moisture content of the sludge is 60%, the temperature contour on the YZ section under different firing amounts
In order to study the rationality of the SV (simulated value), the actual MV (measured value) of the precalciner was collected when the cement plant combustion sludge had a 70% moisture content. As shown in Tab. 6, four MS (measuring position) were taken, followed by GI (Gas inlet), MP (middle part of precalciner), OP (outlet of the precalciner) and GO (gooseneck outlet). The simulation value is the simulation result under different sludge input ratios when the moisture content is 70% and 80% respectively.
Table 6: The precalciner temperature and measured values at different moisture contents of sludge
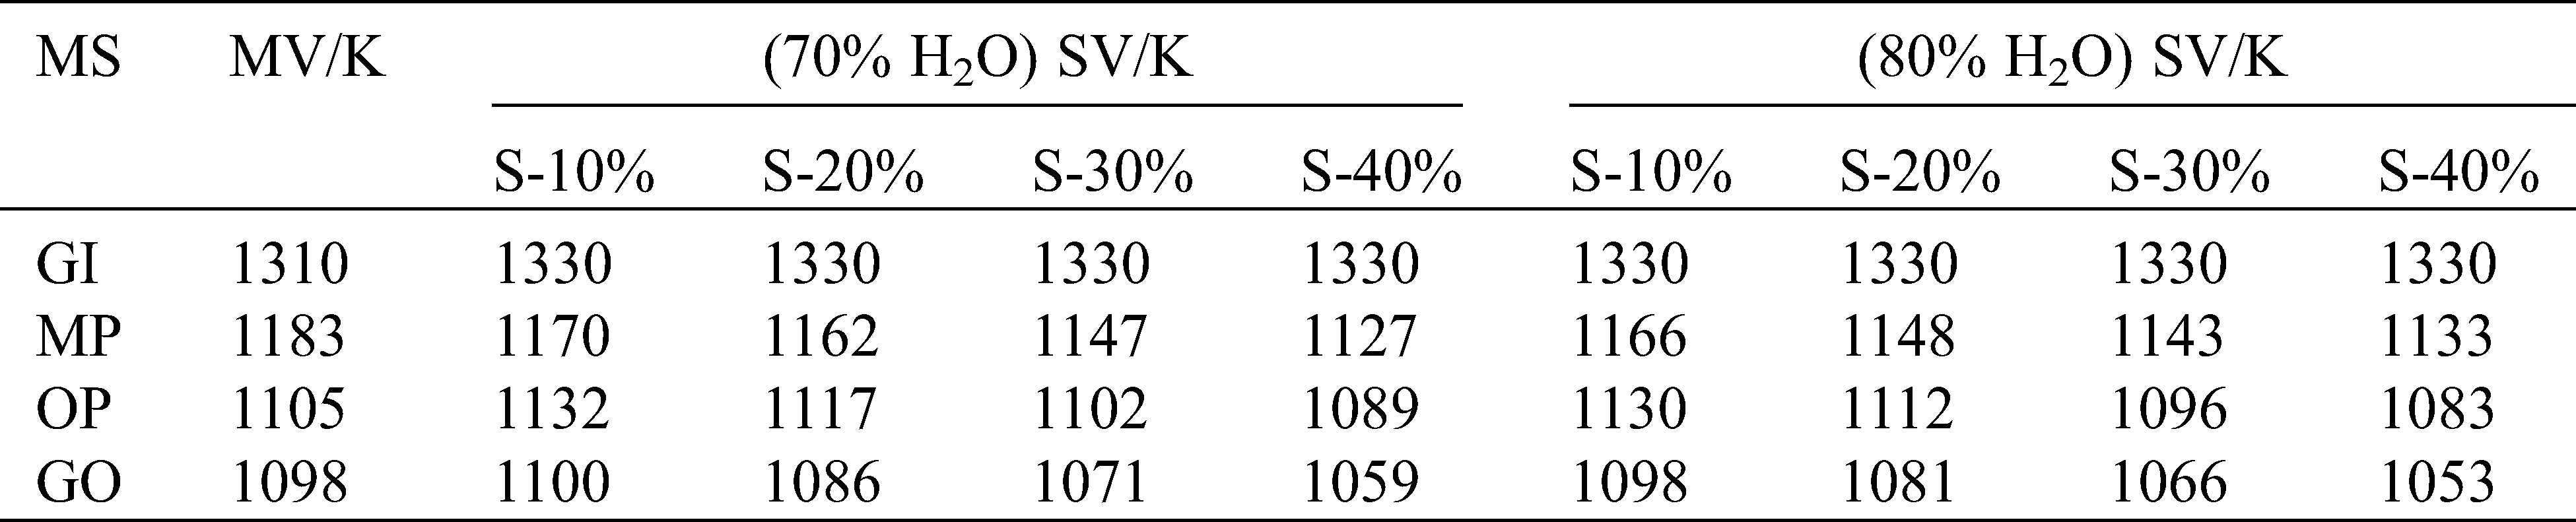
The comparison revealed that the simulated value of the inlet temperature of the precalciner is 1330 K, higher than the measured value. The middle of the precalciner is lower than the measured value, and the outlet of the precalciner and gooseneck are slightly lower than the measured value. After calculating the relative error of the corresponding measuring point, the error of the simulated value is approximately 2% when the moisture content was 70% and the input sludge was S-10% and S-20%. This shows that the simulation result is reliable. If the moisture content is 80%, the average temperature at the outlet of the gooseneck is lower than 1070 K when the input amounts are S-30% and S-40%. Hence, these two input sludge are not recommended in production.
4.2 Effect of Sludge Input on Components
As presented in Figs. 6a to 6f, when the moisture content of the sludge is 50%, as the amount of sludge increases (the mass fraction of Fe2O3) and the temperature decreases, the average mass fraction of CaCO3 and the average mole fraction of O2 increase, while the average mass fraction of CaO decreases. The average mole fraction of CO2 is higher than that of no sludge input. When existing the sludge input, the average mole fraction of CO2 only decreases between Y = 10 m and Y = 27 m and the content near the outlet of the precalciner is basically the same with the amount of sludge increasing. This is because the sludge reduces the temperature of the precalciner and affects the decomposition of the raw meal, resulting in an increase in undecomposed CaCO3 and a decrease in the content of CaO and CO2. When Y=7 m and Y = 20 m, a large amount of raw meal enters the precalciner to decompose, contributing to a rapid increase in CO2 content. For the sake of sludge combustion, the combustion of pulverized coal is delayed (incomplete combustion), which reduces O2 consumption and increases O2 content. Furthermore, although the combustion of pulverized coal also produces CO2, the production volume is small compared with the decomposition of raw meal.

Figure 6: Changes of various components along the Y direction at different input amounts of sludge with a moisture content of 50%
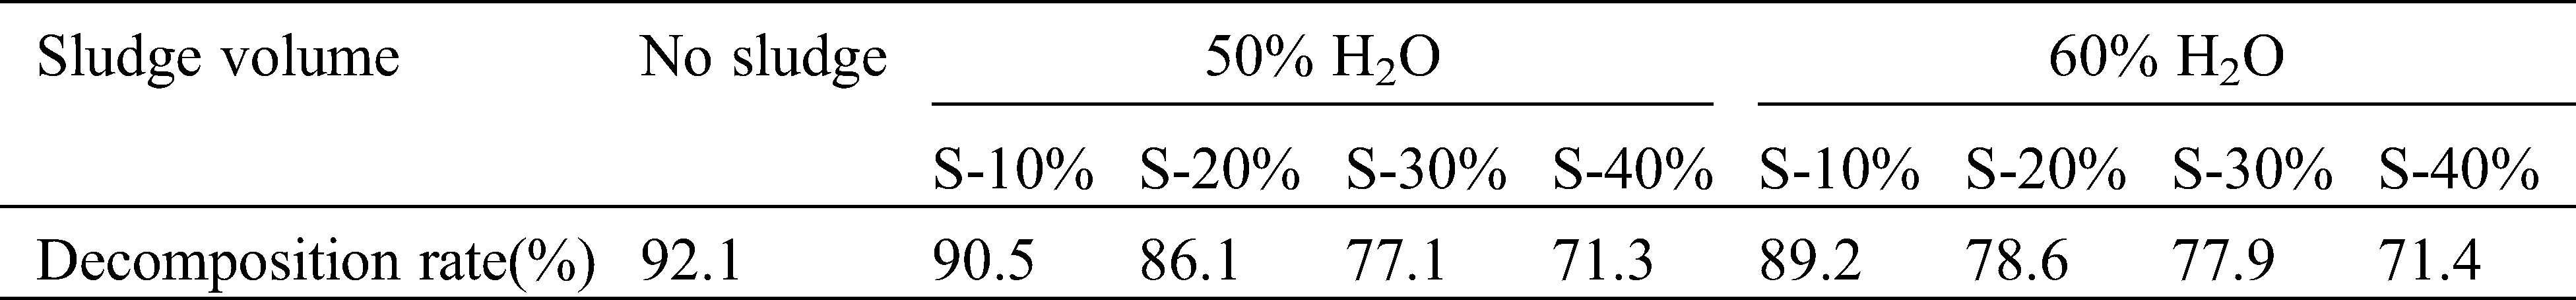
From Fig. 7, the change trend is the same as that showed in Fig. 6 with 60% of the sludge moisture content. The result demonstrates that the temperature and composition change little when the moisture content of the sludge increases from 50% to 60%. Therefore, the raw meal decomposition rate was calculated according to the CaCO3 and CaO mole fraction distribution at the outlet of the precalciner, as shown in Tab. 7. The decomposition rate of TTF precalciner can reach up to 92.1% without a sludge combustion. When the moisture content is 50% and the sludge input is S-10% and S-20%, the decomposition rates are 90.5% and 86.1%, respectively. When the sludge input is S-30% and S-40%, the decomposition rate is below 80%. When the moisture content is 60% and the sludge input is S-10%, the raw meal decomposition rate is 89.2%. When the input amount is greater than S-10%, the decomposition precalciner is also less than 80%. In actual production, the raw meal decomposition rate of the precalciner is required to be between 85% and 95%. Hence, it is not advised to use a firing amounts with a decomposition rate of less than 80%. Comparing the chemical composition analysis of the clinker in Tab. 1 we can know that the maximum content of CaO in clinker is 66.45%. Moreover, SiO2, Al2O3 and Fe2O3 account for a relatively high proportion. There is no CaCO3 in the chemical composition, which means that CaCO3 will be completely decomposed after firing. Therefore, in order to ensure the stability of the composition of the clinker, the decomposition rate of the raw meal must be strictly controlled.

Figure 7: Changes of various components along the Y direction at different input amounts of sludge with a moisture content of 60%
Table 7: Comparison of the decomposition rates of raw meal under different sludge inputs
Figs. 8 and 9 shows the contour of the mass fraction distribution of CaCO3 and CaO under different firing amounts when the moisture content of the sludge is 70%. It can be seen from the figure that the mass fraction of CaCO3 increases and the mass fraction of CaO decreases with increasing sludge above the upper raw meal pipe. The mass fraction of CaO at the outlet of the precalciner is reduced from 0.11 to 0.09. The CaO content of the first combustion chamber is the highest, decreasing from 12 wt% to 8 wt%. The result also proves the change law of the decomposition rate of the raw meal above. The decomposition rate of the raw meal decreases with the increase of the amount of sludge and the moisture content of the sludge.
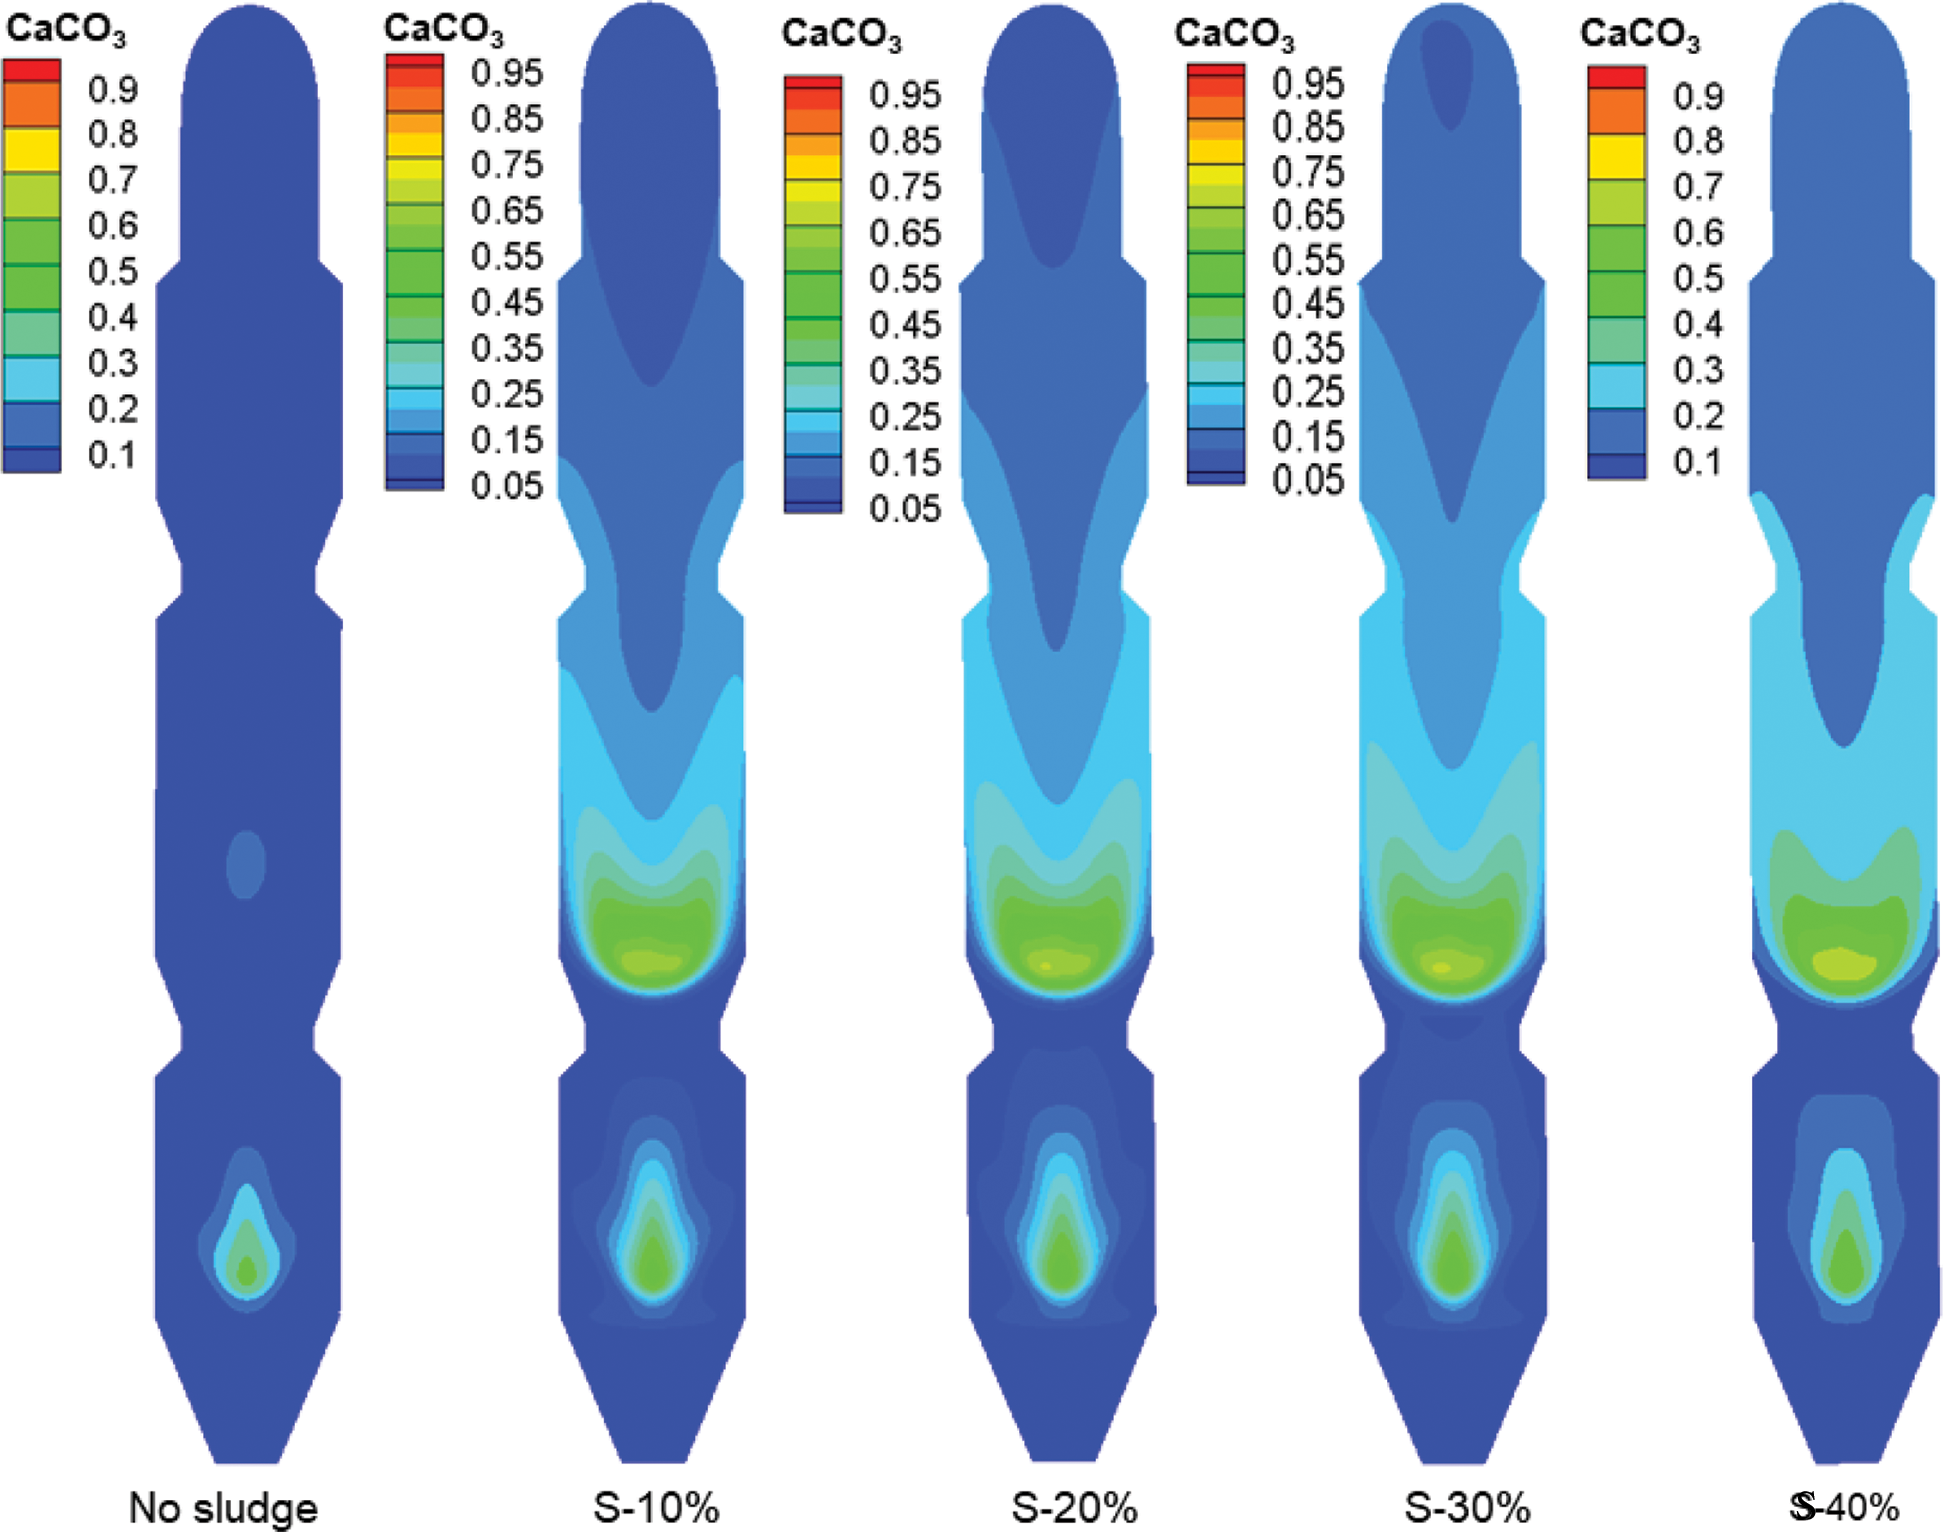
Figure 8: At a moisture content of 70%, the mass fraction cloud of CaCO3 under different sludge inputs

Figure 9: At a moisture content of 70%, the mass fraction cloud of CaO under different sludge inputs
It can be seen from Eq. (27) that the combustion of C in pulverized coal will also be accompanied by the production of CO. In the TTF precalciner, the amount of H2O introduced will also increase when the amount of sludge input increases, which will affect the combustion of coal powder. Fig. 10 shows the distribution of CO in the precalciner under different input amounts when the moisture content of the sludge increases to 70%. It was found that CO was only distributed more in the first combustion chamber, the highest position can reach 0.5%, and the CO distribution area was smaller with the sludge input increasing. This can be explained as in the first combustion chamber. The combustion of pulverized coal is accompanied by the decomposition of the raw meal. The NOx content in the precalciner increases at high temperatures with sludge. CO can reduce NOx, resulting in a decrease in CO content. The production of CO is related to the combustion of pulverized coal. The temperature and excess air coefficient directly controls the proportion of pulverized coal combustion products. O2 is also required for sludge combustion, and the air from the tertiary air is constant, which reduces the excess air coefficient. Theoretically, the amount of CO produced will have an upward trend with the increase of the amount of sludge within a certain range, but it is reduced in the study, so it can be inferred that NOx consumes CO.
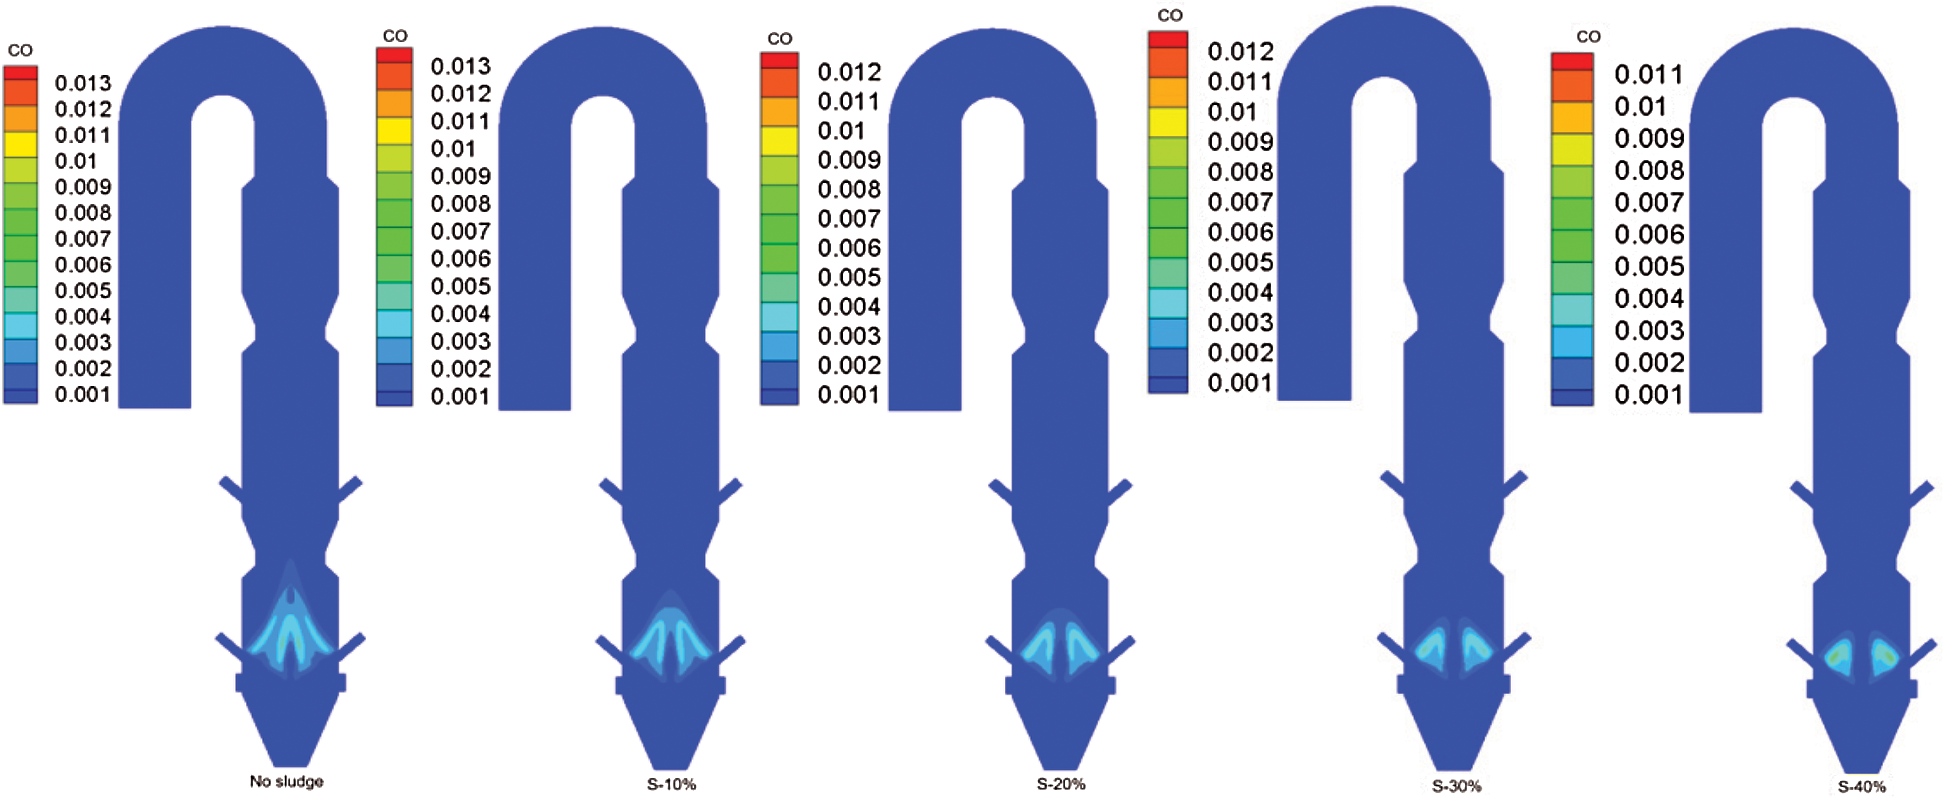
Figure 10: At a moisture content of 70%, the mass fraction cloud of CO under different sludge inputs
As shown in Fig. 11, when the sludge moisture content is 50%, the NOx concentration distribution contours are under different firing amounts. When sludge is not burned, the NOx concentration of the precalciner can reach up to 1900 ppm (3420 mg/Nm3), and the outlet of the precalciner is 733 ppm (1319 mg/Nm3). As the amount of sludge increases from S-10% to S-40%, the maximum NOx concentration in the precalciner drops to 1500 ppm (2700 mg/Nm3), and the outlet drops to about 400 ppm (720 mg/Nm3). This shows that despite the high N content in the sludge, a large amount of NOx will be produced. But in general, the reasonable addition of sludge is beneficial to the reduction of NOx to a certain extent.

Figure 11: When the moisture content of the sludge is 50%, the NOx concentration distribution contour under different firing amounts
When removing NOx in the cement industry, the initial choice of ammonia injection point is generally at the gooseneck. The NOx concentration at the gooseneck is a key consideration. NOx concentration values (measured in mg/Nm3) at the gooseneck under different conditions are extracted and listed in Tab. 8. The NOx content is also reduced after the sludge is burned in the gooseneck. When the moisture content is 50%, minimum NOx content after sludge burning is 720 mg/Nm3. As the water content of the sludge increases to 60%, minimum NOx content can be reduced to 522 mg/Nm3. Also, the NOx content is also decreased with the water concentration increasing from 50% to 60% under the same firing amount. It can be speculated that H2O has a certain reduction effect on NOx. According to China’s cement industry NOx emission standards and limit indicators, NOx emissions cannot be higher than 800 mg/Nm3 [37]. The results obtained from the above analysis show that the NOx concentration gradually decreases to below 800 mg/Nm3 as the amount of sludge increases. In this way, the NOx concentration can be assured to be discharged within the standard after the ammonia water is sprayed.
Table 8: Extracted values of NOx concentration at the outlet of the gooseneck under different conditions

When the sludge burns, it will produce reducing gaseous substances, as mentioned above CO is one of them. Therefore, sludge has also been shown to have the potential to be used as a denitrification agent [38]. Thermal NOx is related to temperature and fuel NOx is concerned with the combustion of pulverized coal. It was observed that the NOx at the outlet of the precalciner decreased from 733 ppm to 395 ppm (711 mg/Nm3), a drop of 338 ppm (608 mg/Nm3). In addition to take the reduction effect of CO on NOx into account, other factors need to be considered. Some studies have found that H2O has a certain emission reduction effect on NOx, consistent with our speculation [39]. This is because H2O produces H2 at high temperatures and it has a reduction effect on NOx. The conversion process is NO→HNO→NH→N2O→N2, further proved by observing Fig. 12. When the sludge input is S-10% and the moisture content is 60%, the average concentration of NOx is 500 ppm (900 mg/Nm3) at the outlet of the precalciner. If the water content of the sludge increases to 70%, the average concentration of NOx at the outlet of the precalciner is less than 500 ppm. When the amount of sludge is S-20%, S-30% and S-40%, it was found that the moisture content of the sludge increases from 60% to 70%, and the average concentration of NOx at the outlet of the precalciner is reduced. It indicates the influence of H2O on NOx reduction, which is consistent with the results in Tab. 8. It should be noted that although moisture is found to have an inhibitory effect on NOx, moisture also has an important inhibitory effect on furnace temperature in the production of cement. This is not conducive to the stability of the furnace temperature and will increase fuel supply, thereby increasing production costs. In order to solve this contradiction, one method is to control the input amount when the moisture content is too high (more than 70%). The input amount of the high moisture content sludge has been discussed before. Another method is to use a new type of drying process (such as biological drying technology, fluidized bed, etc.) to further reduce the water content of the sludge before combustion. When the moisture content of the sludge after drying is low, the amount of sludge input into the precalciner can be increased accordingly and the moisture content also increases with the increase of the amount of sludge. This not only increases the processing capacity of sludge, but also the H2O carried by the sludge can still suppress NOx within a certain combustion range. Additionally, the impact on temperature will be relatively small with small input of sludge. This is because compared with the metal and non-metal oxide components in the sludge, H2O has a greater specific heat melting (Tab. 3), and the effect of the endothermic heat of gasification on temperature is much greater than that of metal and non-metal oxides. In fact, the sludge has a certain calorific value and the heat released by the combustion of the organic components, volatiles and fixed carbon in the sludge also supplements the temperature lost in the precalciner.

Figure 12: Variation of NOx along precalciner height at 60% and 70% moisture content
In this study, the combustion of sludge in the TTF precalciner was verified by calculation and simulation. The simulation results show that the TTF precalciner has a stable flow field during combustion, and the raw meal enters the precalciner in stages. The sprinkling effect is good and the decomposition efficiency is high. The decomposition rate can reach 92.1% without sludge input, and the maximum temperature of the precalciner can reach 1600 K. As the sludge is burned, the maximum temperature drops to 1500 K. When the moisture content of the sludge is constant, the temperature gradually decreases with the increase of the amount of sludge thrown in and the minimum temperature at the outlet is 1080 K. In order to ensure the normal productivity of cement, the decomposition rate of raw meal under different conditions is calculated. Since the raw meal decomposition rate of the precalciner is at least 85%. As a result, when the sludge moisture content is 50%, sludge input can be about S-20% (when sludge input is S-20%, the decomposition rate of the raw meal is higher than 85%). When the sludge moisture content is 60%, the sludge firing amount cannot be higher than S-20% (when sludge input is S-20%, the decomposition rate of the raw meal is lower than 85%).
Furthermore, sludge firing also has a pronounced impact on NOx. The high water content in the sludge lowers the temperature in the precalciner, suppressing the production of thermal NOx. CO generated by incomplete combustion of pulverized coal suppresses fuel-type NOx. The NOx concentration corresponding to the higher sludge moisture content is correspondingly lower when the sludge input amount is fixed, proving the inhibitory effect of H2O on NOx and also having an important guiding role in reducing NOx emissions in cement production. Finally, a solution to small sludge treatment volume resulted from by the high moisture content of the sludge and the decrease of the furnace temperature is given. That is to reduce the moisture content of the sludge as much as possible through the drying process.
Funding Statement: This work was supported by the general institute of building materials research of china (No. 2017YFC0210801) and the Priority Academic Program Development of Jiangsu Higher Education Institutions (PAPD).
Conflicts of Interest: The authors declare that they have no conflicts of interest to report regarding the present study.
1. Chen, J., Deng, Z., Zhang, R., Zhu, P., Ding, W. (2014). Research on the quicklime treatment dewatered sludge technology and mechanical. Materials Science and Engineering Technology, 3, 902–906. [Google Scholar]
2. Zhai, Y., Chen, H., Xu, B. (2014). Influence of sewage sludge-based activated carbon and temperature on the liquefaction of sewage sludge: Yield and composition of bio-oil, immobilization and risk assessment of heavy metals. Bioresource Technology, 159, 72–79. DOI 10.1016/j.biortech.2014.02.049. [Google Scholar] [CrossRef]
3. Wang, W., Liao, Y., Liu, J., Huang, Z., Tian, M. (2019). Numerical simulation and optimization of staged combustion and NOx release characteristics in precalciner. Journal of Thermal Science, 28(5), 1024–1034. DOI 10.1007/s11630-019-1164-y. [Google Scholar] [CrossRef]
4. Li, H., Wu, X., Jiang, L. (2014). Research progress of municipal sludge incineration process. Environmental Engineering, 32, 88–92. [Google Scholar]
5. Hemphill, B. (1988). Fluid bed technology for sludge destruction. Water Engineering & Management, 12, 37–40. [Google Scholar]
6. Li, J., Wang, Z., Zhang, N., Yang, X., Song, W. (2005). Research on sludge incineration technology. Environmental Engineering, 6, 48–52. [Google Scholar]
7. Qin, C., Li, H., Zhong, X. (2011). Comparison and analysis of sludge incineration technologies in my country. Energy Engineering, 01, 52–56. [Google Scholar]
8. Lin, H., Ma, X. (2012). Simulation of co-incineration of sewage sludge with municipal solid waste in a grate furnace incinerator. Waste Management, 32(3), 561–567. DOI 10.1016/j.wasman.2011.10.032. [Google Scholar] [CrossRef]
9. Liu, H., Wang, Y., Liu, X. (2017). Reduction in greenhouse gas emissions from sludge biodrying instead of heat drying combined with mono-incineration in China. Journal of the Air & Waste Management, 67(2), 212–218. DOI 10.1080/10962247.2016.1227282. [Google Scholar] [CrossRef]
10. Fan, W. (2016). Effect of trace components in raw cement on denitrification performance of precalciner SNCR. Journal of Environmental Engineering, 9, 5030–5036. [Google Scholar]
11. Xie, H., Ma, H., Chi, Y., Ma, Z. (2012). Bound water measurement methods and moisture distribution within sewage sludge. Journal of Zhejiang University, 46, 503–508. [Google Scholar]
12. Chan, W. P., Wang, J. (2018). Formation of synthetic sludge as a representative tool for thermochemical conversion modelling and performance analysis of sewage sludge based on a TG-FT. Journal of Analytical and Applied Pyrolysis, 133, 97–106. DOI 10.1016/j.jaap.2018.04.015. [Google Scholar] [CrossRef]
13. Wei, L., Li, R., Li, A., Li, Y., Jiang, X. (2008). Study on ignition characteristics of micro-pulverized coal by thermogravimetry. Journal of China Coal Society, 33, 1292–1295. [Google Scholar]
14. Lei, K., Zhang, R., Ye, B., Cao, J., Liu, D. (2020). Combustion of single particles from sewage sludge/pine sawdust and sewage sludge/bituminous coal under oxy-fuel conditions with steam addition. Waste Management, 101, 1–8. DOI 10.1016/j.wasman.2019.09.034. [Google Scholar] [CrossRef]
15. Xiang, Y. H., Guo, R. X., Li, H. B., Wang, Y. (2008). Combustion characteristics and kinetics of partial gasified coal char. Energy Sources Part A-Recovery Utilization and Environmental Effects, 30(2), 110–118. DOI 10.1080/00908310600626804. [Google Scholar] [CrossRef]
16. Werther, J., Ogada, T. (1999). Sewage sludge combustion. Progress in Energy and Combustion Science, 25(1), 55–116. DOI 10.1016/S0360-1285(98)00020-3. [Google Scholar] [CrossRef]
17. Lou, B., Wang, F., Peng, X. (2010). Numerical simulation and analysis of the combustion of sludge mixed with waste water in a coal-fired boiler. Journal of South China University of Technology, 10, 153–156. [Google Scholar]
18. Houdkova, L., Boran, J., Ucekaj, V., Elsasser, T., Stehlik, P. (2008). Thermal processing of sewage sludge II. Applied Thermal Engineering, 28(16), 2083–2088. DOI 10.1016/j.applthermaleng.2008.04.005. [Google Scholar] [CrossRef]
19. Robie, R. A., Waldbaum, D. R. (1968). Thermodynamic properties of minerals and related substances at 298.15 (25°C) and one atmosphere (1.013 Bars) pressure and at higher temperatures. US Geological Survey Bulletin, 1259, 256. [Google Scholar]
20. Mei, S. (2013). Numerical simulation of combustion and decomposition coupling process of DD decomposition furnace. Journal of Chemical Engineering, 3, 897–905. [Google Scholar]
21. Wei, H. G., Luo, Y. Q. (1995). A study on the kinetics of thermal-decomposition of CaCO3. Journal of Thermal Analysis, 45(1–2), 303–310. DOI 10.1007/BF02548694. [Google Scholar] [CrossRef]
22. Zhang, J., Wang, G., Shao, J., Chen, Y., Yang, T. (2013). Pulverized coal combustion of nitrogen free blast furnace. Journal of Iron and Steel Research International, 20, 1–5. [Google Scholar]
23. Chernetskiy, M. Y., Dekterev, A. A. (2011). Mathematical model for heat transfer and combustion in a pulverized coal flame. Combustion, Explosion, and Shock Waves, 47(3), 280–288. DOI 10.1134/S001050821103004X. [Google Scholar] [CrossRef]
24. Zhong, Q., Zhang, J., Yang, Y. (2018). Thermal behavior of coal used in rotary kiln and its combustion intensification. Energies, 11, 3833–3841. [Google Scholar]
25. Mikulcic, H., von Berg, E., Vujanovic, M., Duic, N. (2014). Numerical study of co-firing pulverized coal and biomass inside a cement calciner. Waste Management & Research, 32(7), 661–669. DOI 10.1177/0734242X14538309. [Google Scholar] [CrossRef]
26. Tian, F. J., Li, B. Q., Chen, Y., Li, C. Z. (2002). Formation of NOx precursors during the pyrolysis of coal and biomass. Part V. Pyrolysis of a sewage sludge. Fuel, 81, 2203–2208. [Google Scholar]
27. Shao, L., Fan, S., Zhang, H., Yao, Q., He, P. (2013). SO2 and NOx emissions from sludge combustion in a CO2/O2 atmosphere. Fuel, 109, 178–183. DOI 10.1016/j.fuel.2013.01.027. [Google Scholar] [CrossRef]
28. Jayaraman, K., Gökalp, I. (2015). Pyrolysis, combustion and gasification characteristics of miscanthus and sewage sludge. Energy Conversion and Management, 89, 83–91. DOI 10.1016/j.enconman.2014.09.058. [Google Scholar] [CrossRef]
29. Shao, J., Yan, R., Chen, H. (2008). Pyrolysis characteristics and kinetics of sewage sludge by thermogravimetry Fourier transform infrared analysis. Energy & Fuels, 22(1), 38–45. DOI 10.1021/ef700287p. [Google Scholar] [CrossRef]
30. Magdziarz, A., Wilk, M. (2013). Thermogravimetric study of biomass, sewage sludge and coal combustion. Energy Conversion and Management, 75, 425–430. DOI 10.1016/j.enconman.2013.06.016. [Google Scholar] [CrossRef]
31. Chun, Y. N., Ji, D. W., Yoshikawa, K. (2013). Pyrolysis and gasification characterization of sewage sludge for high quality gas and char production. Journal of Mechanical Science and Technology, 27(1), 263–272. DOI 10.1007/s12206-012-1202-0. [Google Scholar] [CrossRef]
32. Liao, Y., Ma, X. (2010). Thermogravimetric analysis of the co-combustion of coal and paper mill sludge. Applied Energy, 87(11), 3526–3532. DOI 10.1016/j.apenergy.2010.05.008. [Google Scholar] [CrossRef]
33. Xiao, H., Ma, X., Liu, K. (2010). Co-combustion kinetics of sewage sludge with coal and coal gangue under different atmospheres. Energy Conversion and Management, 51(10), 1976–1980. DOI 10.1016/j.enconman.2010.02.030. [Google Scholar] [CrossRef]
34. Modaresi, Z. K., Karimi, G., Mowla, D. (2019). Study of co-combustion of dried sewage sludge with coke: Thermogravimetric assessment and gaseous emissions. Journal of Environmental Chemical Engineering, 7(1), 1976–1980. DOI 10.1016/j.jece.2018.102871. [Google Scholar] [CrossRef]
35. Park, J. M., Keel, S., Yun, J., Yun, J. H., Lee, S. (2017). Thermogravimetric study for the co-combustion of coal and dried sewage sludge. Korean Journal of Chemical Engineering, 34(8), 2204–2210. DOI 10.1007/s11814-017-0129-7. [Google Scholar] [CrossRef]
36. Zhou, J., Tang, Q., Wang, L., Zhang, L. (2011). Experimental research on combustion characteristics of sewage sludge in oxygen-enriched environment. Chinese Journal of Environmental Engineering, 5, 1871–1876. [Google Scholar]
37. Xu, N. (2008). Handbook of environmental protection of cement industry. China: China Building Materials Industry Press. [Google Scholar]
38. Tang, Z., Fang, P., Xiao, X. (2019). Data on species and concentration of the main gaseous products during sludge combustion to support the feasibility of using sludge as a flue gas denitration agent for the cement industry. Data in Brief, 25, 103998. DOI 10.1016/j.dib.2019.103998. [Google Scholar] [CrossRef]
39. Li, S., Wei, X., Guo, X. (2012). Effect of H2O vapor on NO reduction by CO: Experimental and kinetic modeling study. Energy & Fuels, 26(7), 4277–4283. DOI 10.1021/ef300580y. [Google Scholar] [CrossRef]
 | This work is licensed under a Creative Commons Attribution 4.0 International License, which permits unrestricted use, distribution, and reproduction in any medium, provided the original work is properly cited. |