DOI: 10.32604/jrm.2021.015079
ARTICLE
Numerical Simulation of Co-Combustion of Pulverized Coal and Different Proportions of Refused Derived Fuel in TTF Precalciner
College of Materials Science and Engineering, Nanjing Tech University, Nanjing, 211816, China
*Corresponding Author: Hongtao Kao. Email: kaoht@163.com
Received: 19 November 2020; Accepted: 21 December 2020
Abstract: Based on the theory of computational fluid dynamics (CFD), pulverized coal combustion alone, and the co-combustion of pulverized coal and refuse-derived fuel (RDF) in a Trinal-sprayed calciner (TTF) precalciner were simulated. The results revealed that when coal was used as a single fuel, the velocity field in the precalciner had good symmetry, and formed three spray effects and multiple recirculation zones. The main combustion zone was distributed in the lower tertiary air and pulverized coal area, and the highest temperature reached up to 1,500 K. According to the simulation results, the predicted decomposing rate of raw meal was 90.12%, which is in good agreement with the actual measured result. In addition, with the increase in RDF content, the average temperature of the furnace, the decomposition rate of the raw meal, and the NOx concentration all exhibited a downward trend. Under the condition of ensuring the normal operation of the precalciner, blending with 20% RDF is the most reasonable strategy, and the NOx emissions decreased by approximately 16%.
Keywords: Numerical simulation; TTF precalciner; RDF; co-combustion; NOx emission
Cement is an indispensable raw material for national infrastructure construction. At the same time, the resource consumption and pollutant emissions of the cement industry are huge. Studies have shown that coal-based fuel combustion pollution from the cement industry is the third largest source of NOx emissions, and coal storage has become lesser [1,2]. Therefore, there is an urgent to seek for suitable alternative fuel to meet the need for cementing production. RDF is a solid fuel made from refuse sorting, crushing, compression and drying processes [3]. It owns the characteristics of high calorific value, stable combustion, easy transportation, and low secondary pollution [4]. Norton [5] conducted a co-firing experiment of RDF and coal, and found that because the nitrogen content of RDF is generally lower than that of coal, NOx emissions during the combustion process are negatively correlated with the amount of RDF incorporated, which is also one of the advantages of RDF as an alternative fuel. At present, there are few researches on RDF as an alternative fuel in the precalciner. Therefore, it is necessary to carry out research on the co-combustion of pulverized coal and RDF in the precalciner.
As the core equipment of the new dry process cement production line, the precalciner is the main place for fuel combustion and raw meal decomposition, and this is also accompanied by a large amount of NOx generation [6]. Since the precalciner is under high temperature and high dust concentration during operation, it is difficult to study its internal physical and chemical processes through experiments. Therefore, many scholars at home and abroad have chosen numerical simulation to study the precalciner. Xie et al. [7] conducted a simulation study on the SLC-S precalciner, and optimized the gas-solid flow field in the furnace by changing the horizontal projection angle of the two raw meal inlets. Huang et al. [8] conducted a full-scale modeling of the in-line dual combustion and denitrator process precalciner (DD-PRC), and discovered that the applications of air staging and fuel staging are beneficial to reduce NO emissions without affecting the operation. Iliuta et al. [9] studied the ILC precalciner, and developed a heterogeneous model based on the reaction-diffusion approach for coal combustion and CaCO3 decomposition. Although there are many researches on the precalciner, few studies have been conducted on the new TTF precalciner. Compared with the older precalciner, the newer TTF precalciner has more spraying times and a recirculation region. Furthermore, the pulverized coal feeding modes were changed, enabling it adapt to more fuel types. These significant differences make the operation of the TTF precalciner different from the older precalciner, and China’s cement production basically uses coal as the single fuel. Therefore, it is of great significance to simulate the coupling process of pulverized coal combustion and raw meal decomposition in the TTF precalciner under the condition of using coal as the only fuel through the widely used computational fluid dynamics (CFD) software, Fluent [10]. The simulation results not only provide theoretical guidance for the actual operation of the precalciner, but also provide a basis for further research on the co-firing process of pulverized coal and RDF in this type of precalciner. In addition, RDF and pulverized coal are mixed and combusted in the precalciner at different ratios, and the best RDF blending ratio is determined by analyzing the combustion characteristics, and the decomposition of raw meal and NOx emissions.
2 Geometric Model and Boundary Conditions
2.1 Geometric Model and Mesh Independence
Fig. 1a shows the actual size of the TTF precalciner structure, which is 45.8 m high, and the maximum diameter is 7.1 m. The precalciner is divided into three cylinders: Two necks and one lower cone. The bottom is the high temperature flue gas inlet, and the top is the precalciner outlet. There are three tertiary air pipes: Two pipes are symmetrically distributed in the lower column, and one pipe is in the middle column. There are two raw meal pipes in the lower column and middle column, respectively, and the four coal injection pipes are distributed 0.7 m above the lower tertiary air inlet. Fig. 1b shows the mesh of the precalciner, in which a high-quality structured hexahedral grid was used for the whole model. In order to ensure the accuracy of the computed results, mesh independence must be verified. Five mesh numbers (662346 cells, 884680 cells, 1013158 cells, 1262747 cells, and 1421282 cells) are simulated, and the influence of the mesh number on the calculation results was compared according to the average temperature of the precalciner outlet. As shown in Tab. 1, when the mesh number was greater than 1013158, the temperature basically did not change. This shows that solution was mesh independence [11]. Therefore, the present study used 1013158 cells for the numerical simulation.

Figure 1: Structure and mesh of the TTF precalciner (a) Structure, (b) Mesh
Table 1: Comparison of outlet temperatures for the different mesh numbers

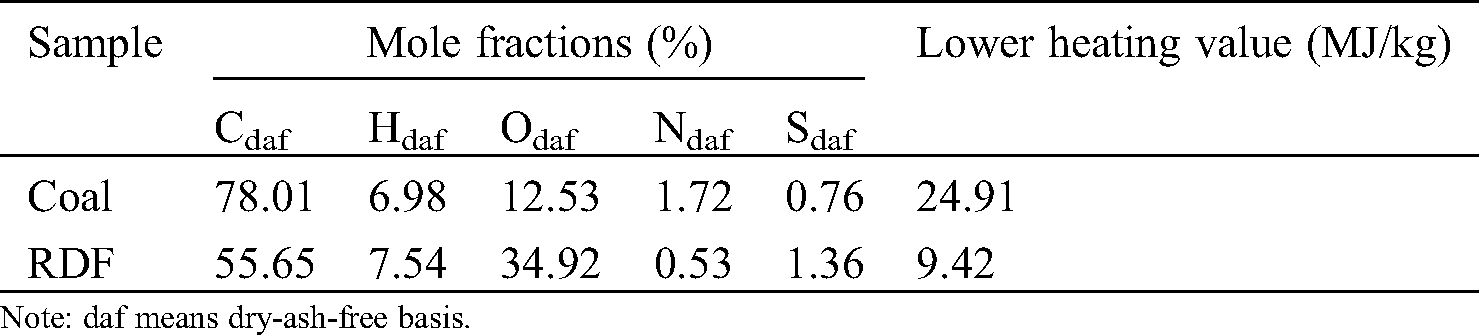
The boundary conditions used for the present study all come from the thermal calibration of the cement plant. The inlet boundaries of the tertiary air and flue gas inlet were the velocity inlets. The upper tertiary air speed was 25 m/s at a temperature of 1,200 K, and the lower tertiary air speed was 26 m/s at a temperature of 1,200 K. The flue gas velocity was 27 m/s, and the temperature was 1,350 K. The outlet boundary condition was the pressure outlet, and the pressure value was −1250 Pa. The coal was bituminous from Jiangxi Province [12], and the RDF was obtained from an RDF production plant in Yunnan. The proximate analysis and ultimate analysis of pulverized coal and RDF are shown in Tabs. 2 and 3. The inlet boundaries of the pulverized coal and raw meal inlet were the mass flow inlets. The mass flow of each pulverized coal inlet and raw meal inlet was 1.25 and 16 kg/s, respectively, and the temperature was 331 and 1,040 K, respectively. Except for the inlet and the outlet of the precalciner, the other parts are set as walls, and the standard non-slip wall function was used to deal with the influence of the wall on the fluid flow.
Table 2: Proximate analysis of the coal and RDF
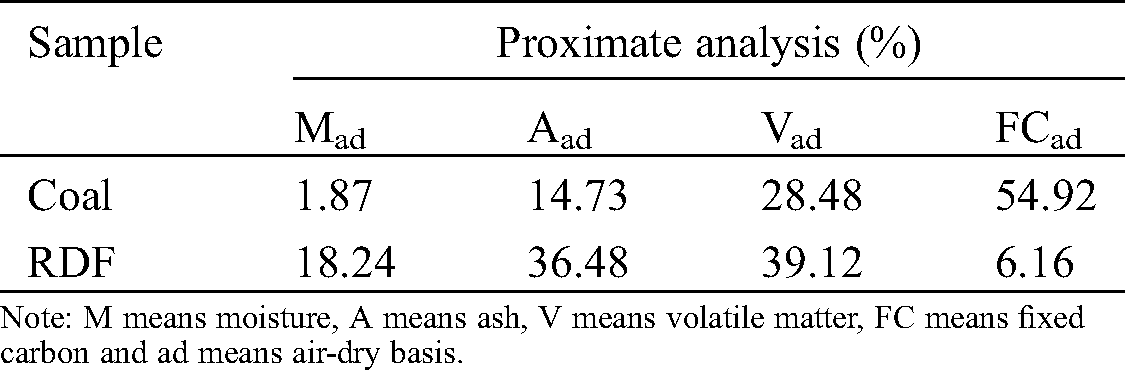
Table 3: Ultimate analysis of the coal and RDF
3 Mathematical Models and the Numerical Method
Considering the characteristics of the geometric model, calculation time and accuracy, the standard  model was used to simulate the turbulent flow field in the present study [13]. This model was based on the semi-empirical formula of turbulent kinetic energy
  and the turbulent dissipation rate
  .
.
In the standard  model, the transportation equations for
  and
and  were, as follows:


where:  represents the turbulent viscosity,
  represents the turbulent kinetic energy caused by the average velocity gradient,
  represents the turbulent kinetic energy caused by buoyancy, and
  represents the contribution of the fluctuating expansion in compressible turbulence to the total dissipation rate.
  ,
,  and
and  are constants, which are 1.44, 1.92 and 0.09. Furthermore,
  and
and  are the turbulent Prandtl numbers of
  and
and  , respectively. Moreover,
  and
and  are the user-defined source terms.
The discrete phase model (DPM) is used to solve the trajectory of the particle phase (pulverized coal, RDF and raw meal) in the precalciner [14]. Due to the strong turbulent flow in the furnace, the discrete random walk model and the stochastic tracking model can respectively predict the turbulence in the gas phase, and the particle diffusion caused by the turbulence. The force balance equation of the particle in the x direction in the Cartesian coordinate system is, as follows:


where:  represents the drag force per unit mass of the particle,
  and
and  represents the fluid velocity and particle velocity, respectively, and
  and
and  represents the fluid density and particle density, respectively. Furthermore,
  is the drag coefficient,
  is the particle diameter,
  is the relative Reynolds number, and
  is fluid dynamic viscosity.
3.3 Pulverized Coal and the RDF Combustion Model
In comparing the data of pulverized coal and RDF in Tabs. 1 and 2, RDF can be regarded as a kind of pulverized coal with higher volatile and ash content [15]. The combustion of pulverized coal is a complex process of physical and chemical changes, which can be divided into two steps [16,17]. The first step is the release and combustion of volatiles, and the second step is the combustion of residual coke. The volatiles release process adopts the two competing rates model proposed by Kobayashi et al. [18], which has the characteristics of less calculation amount and high accuracy. The expression for the volatiles release rate is, as follows:

where:  represents the mass of volatile that has been released at time t,
  represents the initial particle mass,
  represents the ash content in the particles, and
  and
and  represents the low temperature release rate factor and high temperature release rate factor of volatiles, respectively. The reaction rate constants
  and
and  were defined using the Arrhenius formula.
After the volatiles were released and burned out, the residual coke would begin to undergo a surface combustion reaction, and the kinetic/diffusion control rate model will be selected. The model assumes that the combustion rate of coke is simultaneously controlled by the kinetic rate  and diffusion rate
 :
:


where:  is the particle size,
  is the partial pressure of the gas around the particle, and
  is the particle surface area. Furthermore,
  and
and  represent the initial particle temperature and gas temperature around the particle, respectively.
3.4 Raw Meal Decomposition Model
In the research on the decomposition reaction of raw meal in the precalciner, domestic scholars all took the decomposition of CaCO3 as the main research object [19,20]. Therefore, in order to simplify the mathematical model, the species transport model was used to simulate the decomposition reaction of the raw meal, which was approximated as CaCO3. In this model, the mass fraction of each species  was estimated by solving the convection-diffusion equation of the
  species. The conservation equation takes the following general form:

where:  is the diffusion flux of species
  ,
,  is the net production rate of species
  by chemical reaction, and
  is the rate of creation by addition from the discrete phase plus any user-defined sources. The reaction process for the CaCO3 decomposition is, as follows [21]:

where: the pre-exponential factor of the reaction is  , and the activation energy is 187.3 kj/mol. The decomposition rate for the raw meal was defined, as follows:

In this equation,  is the mass flow rate of CaCO3 at the inlet, and
  is the mass flow rate of CaCO3 at the outlet.
According to the formation mechanism of NOx, NOx is mainly divided into prompt NOx, thermal NOx and fuel NOx. Under the combustion conditions in the precalciner, the proportion of prompt NOx and thermal NOx is less than 5%, which is negligible. The present study only considered the formation of fuel NOx, and the reaction path is shown in Fig. 2 [22]. Assuming that Fuel-N is distributed between volatiles and fixed carbon, volatile N is first converted to HCN, and then part of the HCN is oxidized to NO. The unoxidized HCN, acting as reduction agents, reacts with NO to form N2. The char N is directly converted to NO, and some of the NO is reduced to N2 due to the reducibility of char.

Figure 2: Fuel NOx formation path
According to the above-mentioned NO reaction mechanism, the generation rate for HCN and NO were respectively used as the source terms to simulate the formation of NO in the precalciner.


The focus of the present research was the TTF precalciner in Yunnan Province, China. The research consisted of two main parts. In the first part, the investigators predicted and analyzed the velocity field, temperature field, composition field, and distribution of NOx in the furnace under separate combustions of pulverized coal, in order to reveal the transport of the gas–solid two-phase flow in the new TTF precalciner. In the second part, under the premise of ensuring that the total heat entering the furnace remains unchanged, the present study simulated five blending situations. Among these, the heat provided by RDF accounted for 10%, 20%, 30%, 40% and 50% of the total heat, respectively. The final ideal blending ratio was used to minimize the NOx concentration at the outlet when the combustion characteristics and decomposition rate of the raw meal were less affected, that is, the precalciner operates normally.
The prerequisite for solving the control equations is to discretize these. In the present study, the controlling-volume method was used to discretize the control equations for the fluid phase, and a second-order upwind difference scheme is used to obtain the difference equations. The semi-implicit method for pressure-linked equations (SIMPLE) algorithm was used to couple the pressure and velocity of the discrete equations. The convergence criterion was that the energy term is less than 10−6, and the remaining residuals were less than 10−3. During the data processing, the burnout rate of fuel was defined as the ratio of the mass loss of unburned coke at the outlet with input fuel mass.
4.1.1 Distribution of the Velocity Field
The velocity vector diagrams of the X = 0 and Y = 0 sections in the precalciner are shown in Figs. 3a and 3b, respectively. It can be observed that the velocity field in the furnace has good symmetry, which is caused by the symmetrical furnace structure. Observed from bottom to top, and after the high-speed flue gas from the rotary kiln enters the precalciner, the speed gradually decreases due to the increase in the diameter of the furnace. After the flue gas meets the lower tertiary air that radially enters the furnace, these merges into a vertical upward high-speed air flow at the center, and the first spray effect is formed. Surrounding this high-speed air flow are two low-speed recirculation zones. Subsequently, the air flow continued to rise through the two necks, and the speed sharply increased, forming the second and third spray effects. In the middle cylinder, three recirculation zones were formed due to the addition of upper raw meal and upper tertiary air. The spray effect induces the pulverized coal and raw meal to be suspended in the precalciner, and fully exchange heat with the air flow. The existence of the recirculation zone increases the residence time of the particles in the furnace, and makes the pulverized coal and raw meal mix more uniform, which is beneficial for improving the decomposition rate of the raw meal and burnout rate of the pulverized coal.

Figure 3: Velocity vector in the precalciner (a) X = 0, (b) Y = 0
4.1.2 Distribution of the Temperature Field
The temperature contours of the X = 0 and Y = 0 sections in the precalciner are shown in Figs. 4a and 4b, respectively. It can be observed that the main combustion zone is distributed in the lower tertiary air and pulverized coal area, and the highest temperature can reach up to 1,500 K. This is mainly because the area is rich in high-temperature oxygen, and carries a large amount of pulverized coal, which allows the volatiles to be rapidly released from the pulverized coal, and burn violently. Then, the lower raw meal moves upward under the action of the high-speed flue gas, and absorbs heat to decompose, causing the temperature to gradually decrease. In the middle cylinder, due to the introduction of the upper tertiary air, the unburned pulverized coal particles continue to burn, resulting in a slight increase in temperature. Finally, the flue gas rises to the upper cylinder, since the reaction of the raw meal decomposition takes place during this process, and the temperature shows a downward trend.

Figure 4: Temperature contours in the precalciner (K) (a) X = 0, (b) Y = 0
4.1.3 Distribution of the Composition Field
Fig. 5 shows the mass fraction distribution of each component in the precalciner. In Figs. 5a, 5b and 5e, it can be observed that the mass fraction of O2 was the highest near the lower tertiary air. With the combustion of pulverized coal, O2 is gradually consumed, the mass fraction of CO2, as a combustion product, gradually increases, and the main combustion zone shown in Fig. 4 is formed. In the middle cylinder, due to the injection of air from the upper tertiary air inlet, the mass fraction of O2 slightly increases, while CO2 becomes diluted. Then, as the height of the furnace increases, the unburned coke and O2 would continue to react to form CO2, the concentration of O2 would continue to decrease, and the concentration of CO2 would continue to increase. The air required for combustion can be divided into two stages into the furnace, resulting in insufficient O2 in the lower cylinder, and a large amount of CO is produced here due to the incomplete combustion of pulverized coal. In Figs. 5b–5d, it can be observed that the mass fraction of CaCO3 was the largest at the inlet of the raw meal. When the height of the furnace was increased, the endothermic decomposition of CaCO3 generated CaO and CO2. When the mass fraction of CaCO3 gradually decreased, and the mass fractions of CaO and CO2 exhibited an overall upward trend, except for the decrease in the middle cylinder, due to the dilution effect of the tertiary air. According to the simulation results, the decomposition rate of the raw meal was 90.12%, which well coincides with the actual measurement results [23].

Figure 5: Mass fraction of each component in the precalciner (a) O2, (b) CO2, (c) CaCO3, (d) CaO, (e) CO
According to the online measurement, the NOx concentration at the flue gas inlet was approximately 800 ppm. Fig. 6 shows the average NOx concentration in the height direction of the precalciner (Z-axis). It can be observed that when z < 5 m, the thermal NOx from the rotary kiln enters the furnace, and the NOx concentration slightly changes. In the z = 5–10 m region, due to the dilution effect of the lower tertiary air and the large amount of CO generated (Fig. 5e), NOx is reduced to N2, and the concentration of NOx rapidly drops to 349 ppm. When 10 m < z < 17 m, the fuel N is oxidized to generate NOx, and NOx concentration rises to 548 ppm. In the z = 17–24 m region, the concentration of NOx rapidly decreases, which is attributed to the dilution effect of the upper tertiary air. When z > 24 m, the NOx concentration continued to increase. However, as the pulverized coal combustion rate became slower, the growth trend gradually decreased, and the NOx concentration at the outlet was 585 ppm.

Figure 6: Average NOx concentration along the height of the precalciner
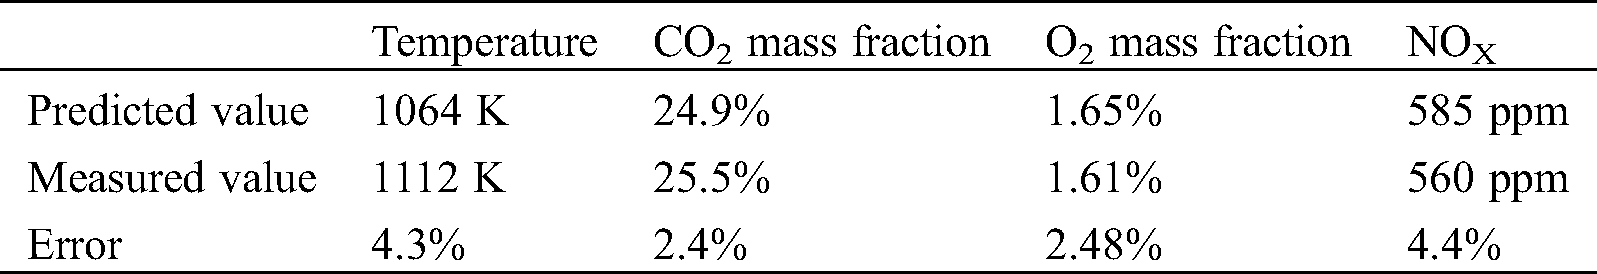
The comparison between the predicted value and measured value at the outlet of the precalciner is shown in Tab. 4. The measured value was actually measured by China Building Materials Industry Association under the normal operation of the precalciner. It can be observed that all errors were within the engineering allowable range. This indicates that the simulation is reliable.
Table 4: Comparisons between the simulation and measurements
4.2 Mixed Combustion of Pulverized Coal and RDF
4.2.1 Influence on Combustion Characteristics
Fig. 7 shows the average temperature in the height direction of the precalciner (Z-axis) under different RDF blending ratios. It can be observed that the average temperature of each working condition presents the same trend: The temperature first increases, subsequently decreases, and increases and decreases again. In addition, with the increase in RDF content, the average temperature of each cross-section sequentially decreases. The data in Tab. 1 shows that the moisture content of RDF was approximately 10 times of that of coal powder. The RDF would consume more heat due to moisture vaporization during combustion, which may be the main reason for the temperature drop [15]. Furthermore, although the RDF blending ratios of the six working conditions are different, the temperature for each section of the lower cone slightly changes, because the fuel gas enters the furnace, and the remaining sections of the precalciner exhibits a large temperature difference. When z = 15 m, there is a maximum temperature difference of approximately 50 K, which is mainly attributed to the change in the cross-section that corresponds to the temperature peak of each working condition. It can be observed from the partial enlarged view that when the RDF blending ratio increased from 0% to 50%, the peak positions in the furnace were 15 m, 15 m, 15 m, 14 m, 13 m and 12 m, respectively. This means that the peak position would be greatly affected when the ratio reaches 30%.
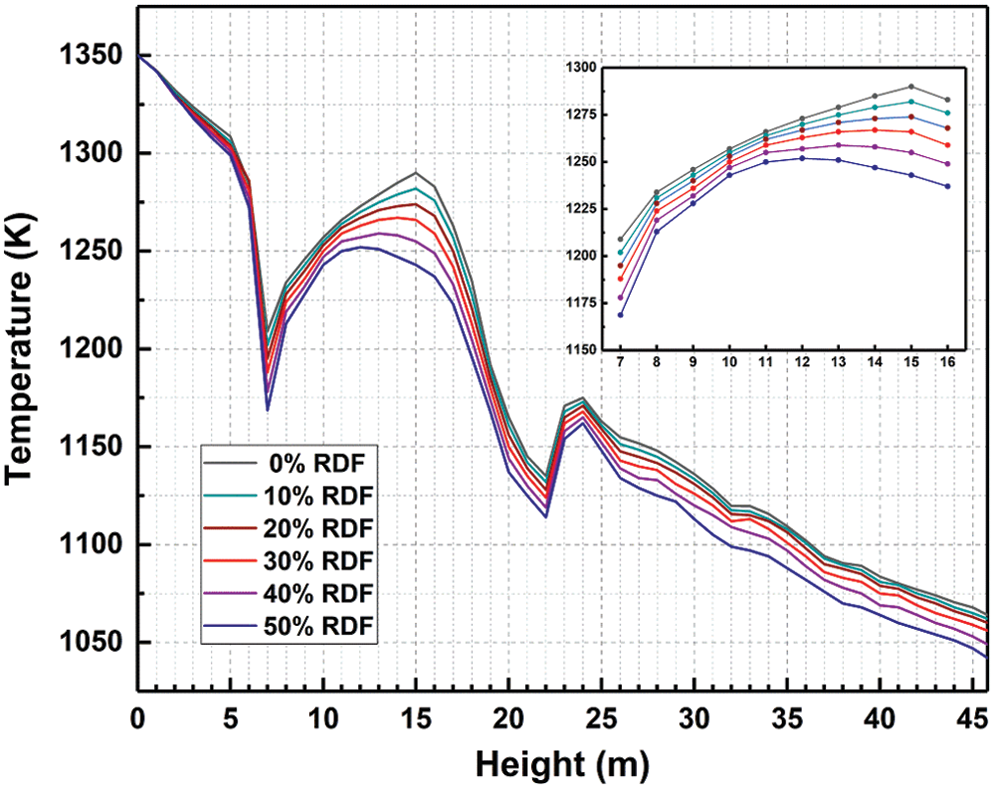
Figure 7: Average temperature along the height of the precalciner
The burnout rate reflects the degree of mixed fuel combustion in the precalciner. As shown in Fig. 8, with the increase in RDF blending ratio, the burnout rate gradually decreases. This is probably attributed to the high ash content in the RDF. During the combustion process, the ash may be adsorbed on the fuel surface, and hinder the diffusion of O2 to the surface, thereby inhibiting combustion. When the blending ratio reaches 30%, the burnout rate becomes less than 90% [8]. Combined with the peak position in Fig. 7, it was found that this blending ratio greatly changed the temperature distribution in the furnace.
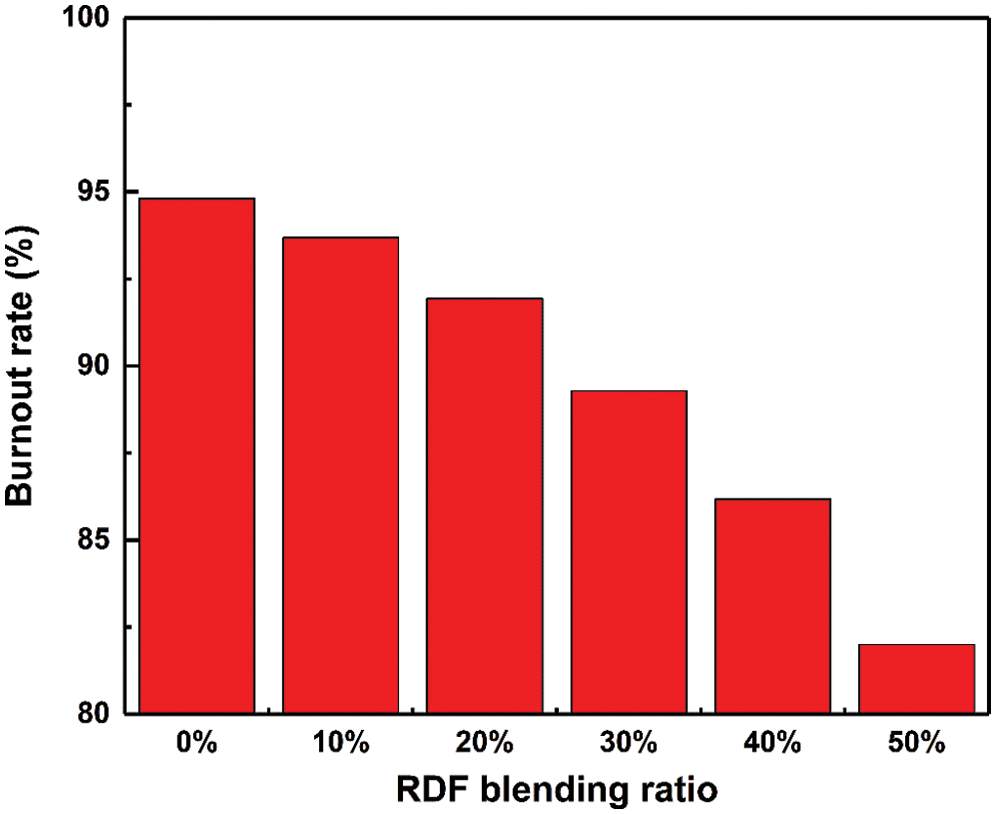
Figure 8: Burnout rate of mixed fuel under different RDF blending ratios
4.2.2 Influence on the Decomposition of the Raw Meal
Figs. 9a and 9b shows the average mass fraction of CaCO3 and CaO in the height direction of the precalciner under different RDF blending ratios. It can be observed that as the blending ratio increases, the lower the mass fraction of CaO, the higher the mass fraction of CaCO3. This indicates that the decomposition efficiency of CaCO3 decreases. As shown in Fig. 7, the increase in blending ratio would reduce the average temperature in the precalciner, which may affect the decomposition of CaCO3. In addition, as shown in Fig. 9c, the mass fraction of CO2 at the outlet is reduced. Although CO2 is also produced by the combustion of mixed fuel, the output was smaller than that of the CaCO3 decomposition, indicating that undecomposed CaCO3 in the furnace increases and the content of CaO decreases. This is consistent with the results shown in Figs. 9a and 9b. Some scholars have inferred through curve integration that the CO2 produced by RDF combustion is greater than that of pulverized coal, when the total heat provided by the combustion is constant [24]. As the RDF content increases, the CO2 produced by the combustion of mixed fuel increases. Since the concentration of CO2 inhibits the decomposition of CaCO3, the decomposition efficiency of CaCO3 decreases, resulting in the decrease in CO2 content at the outlet. Fig. 10d shows the decomposition rate for the raw meal. When the RDF blending ratio was not more than 20%, the decomposition rate slowly decreased. When the blending ratio was more than 20%, the decomposition rate significantly decreased, and was reached below 85%. In general production, the decomposition rate of the raw meal in the precalciner needs to be greater than 85% [25]. Therefore, it is not recommended for the RDF blending ratio to be greater than 20%.

Figure 9: Comparison of different RDF blending ratios: (a) Mass fraction of CaCO3; (b) Mass fraction of CaO; (c) Mass fraction of CO2 at the outlet; (d) Decomposition rate of the raw meal
4.2.3 Influence on NOx Emission
Fig. 10 shows the NOx concentration contours under different RDF blending ratios. It can be observed that when the RDF blending ratio increased from 0% to 50%, the NOx concentration almost had no change, except for each section of the lower cone, and the sections from the lower cylinder to the outlet of the precalciner gradually decreased. This is because the N content of the RDF (0.53%) was significantly lower than that of coal (1.72%), and that the NOx in the furnace was mainly derived from the fuel NOx produced by the fuel combustion. Furthermore, the precipitation and combustion process of volatiles was very fast, resulting in the rapid decrease in O2 concentration around it. In addition, as illustrated in Tab. 1, the volatiles in the RDF were relatively high. Hence, as the RDF content increases, the low oxygen concentration zone in the lower cylinder becomes larger, the high concentration zone of CO for reducing NOx becomes larger, and the area of the low NOx concentration zone in the lower cylinder become larger. Fig. 11 shows the NOx concentration at the outlet under different RDF blending ratios. It can be observed that the NOx concentration decreases with the increase in blending ratio, and when the blending ratio was not less than 30%, the concentration change was small.

Figure 10: The NOx concentration contours under different RDF blending ratios (ppm) (a) 0%RDF, (b) 10%RDF, (c) 20%RDF, (d) 30%RDF, (e) 40%RDF, (f) 50%RDF

Figure 11: The NOx concentration at the outlet under different RDF blending ratios
The analysis indicates that based on the constant total heat that enters the furnace, when the RDF blending ratio was not less than 30%, the pollutant emissions can be significantly reduced. However, this has a greater impact on the combustion characteristics and decomposition of the raw meal. Therefore, under the condition of ensuring the normal operation of the precalciner, blending with 20% RDF is feasible, and the NOx emission is reduced by approximately 16%, when compared with the use of coal as the only fuel.
In the present study, the numerical simulation of an actual operating TTF precalciner was carried out, and the simulated results were compared with the measured data, in order to prove the reliability of the numerical method. The results indicated that the main combustion zone of the precalciner is distributed in the lower tertiary air and pulverized coal area, and that the maximum temperature can reach up to 1,500 K. The mass fraction of CaCO3 alternately increases and decreases, and the mass fraction of CaO continues to increase. The NOx concentration initially decreases, subsequently increases, and decreases and increases again. Furthermore, the present study also analyzed the mixed combustion of pulverized coal and RDF. With the increase in RDF content, the average temperature of the furnace, the decomposition rate of the raw meal, and the NOx concentration exhibits a downward trend. Considering all these factors, it is feasible and reasonable to mix pulverized coal and RDF at an 8:2 ratio. Furthermore, compared with coal as a single fuel, the NOx emissions at the outlet were reduced by approximately 16%.
Funding Statement: This work was supported by the General Institute of Building Materials Research of China (No. 2017YFC0210801) and the Priority Academic Program Development of Jiangsu Higher Education Institutions (PAPD).
Conflicts of Interest: The authors declare that they have no conflicts of interest to report regarding the present study.
1. McDonald, B. C., McKeen, S. A., Cui, Y. Y., Ahmadov, R., Kim, S. W. et al. (2018). Modeling ozone in the eastern U.S. using a fuel-based mobile source emissions inventory. Environmental Science & Technology, 52(13), 7360–7370. DOI 10.1021/acs.est.8b00778. [Google Scholar] [CrossRef]
2. Lei, Y., Zhang, Q., Nielsen, C., He, K. (2011). An inventory of primary air pollutants and CO2 emissions from cement production in China, 1990−2020. Atmospheric Environment, 45(1), 147–154. DOI 10.1016/j.atmosenv.2010.09.034. [Google Scholar] [CrossRef]
3. Bai, J., Yu, C., Li, L., Li, X., Wang, Q. et al. (2012). Experimental investigation on co-firing of coal and refuse-derived fuel in a pilot-scale circulating fluidized bed combustor. Proceedings of the CSEE, 32, 36–41. [Google Scholar]
4. Guo, X. F., Yang, X. L. (2001). Combustion characteristics of refuse derived fuel. ACTA Energiae Solaris Sinica, 3, 286–290. [Google Scholar]
5. Norton, G. A., Levine, A. D. (1989). Cocombustion of refuse-derived fuel and coal—A review of selected emissions. Environmental Science & Technology, 23(7), 774–783. DOI 10.1021/es00065a006. [Google Scholar] [CrossRef]
6. Chen, Z. B., Liu, N., Tang, S. (2017). Numerical simulation of NOx emission reduction on DDF precalciner. China Powder Science and Technology, 23, 32–38. [Google Scholar]
7. Xie, J. L., Mei, S. X. (2007). Numerical simulation of gas-solid flow in SLC-S precalciner by adding a raw meal inlet. Journal of the Chinese Ceramic Society, 10, 1382–1386. [Google Scholar]
8. Huang, L., Lu, J. D., Xia, F., Li, W. J., Ren, H. B. (2006). 3-D mathematical modeling of an in-line swirl-spray precalciner. Chemical Engineering and Processing: Process Intensification, 45(3), 204–213. DOI 10.1016/j.cep.2005.09.001. [Google Scholar] [CrossRef]
9. Iliuta, I., Dam-Johansen, K., Jensen, L. S. (2002). Mathematical modeling of an in-line low-NOx calciner. Chemical Engineering Science, 57(5), 805–820. DOI 10.1016/S0009-2509(01)00420-1. [Google Scholar] [CrossRef]
10. Ozakin, A. N., Kaya, F. (2019). Effect on the exergy of the PVT system of fins added to an air-cooled channel: A study on temperature and air velocity with ANSYS Fluent. Solar Energy, 184, 561–569. DOI 10.1016/j.solener.2019.03.100. [Google Scholar] [CrossRef]
11. Wu, S., Liu, J., Yu, Y. (2017). Design of a new double layer spreading plate for a turbo air classifier. Powder Technology, 312, 277–286. DOI 10.1016/j.powtec.2017.02.044. [Google Scholar] [CrossRef]
12. Lei, K., Zhang, R., Ye, B., Cao, J., Liu, D. (2020). Combustion of single particles from sewage sludge/pine sawdust and sewage sludge/bituminous coal under oxy-fuel conditions with steam addition. Waste Management, 101, 1–8. DOI 10.1016/j.wasman.2019.09.034. [Google Scholar] [CrossRef]
13. Su, S., Xiang, J., Sun, L., Zhang, Z., Sun, X. et al. (2007). Numerical simulation of nitric oxide destruction by gaseous fuel reburning in a single-burner furnace. Proceedings of the Combustion Institute, 31(2), 2795–2803. DOI 10.1016/j.proci.2006.07.260. [Google Scholar] [CrossRef]
14. Fluent Inc. (2006). Fluent 6.3 User’s Guide. USA: Fluent Inc. [Google Scholar]
15. Mei, S. X., Xie, J. L. (2013). Numerical simulation study on combustion of refuse derived fuel and pulverized coal in calciner. Journal of Wuhan University of Technology, 35, 38–42. [Google Scholar]
16. Zhang, J., Wang, G., Shao, J., Chen, Y., Yang, T. (2013). Pulverized coal combustion of nitrogen free blast furnace. Journal of Iron and Steel Research International, 20, 1–5. [Google Scholar]
17. Chernetskiy, M. Y., Dekterev, A. A. (2011). Mathematical model for heat transfer and combustion in a pulverized coal flame. Combustion, Explosion, and Shock Waves, 47(3), 280–288. DOI 10.1134/S001050821103004X. [Google Scholar] [CrossRef]
18. Kobayashi, H., Howard, J. B., Sarofim, A. F. (1977). Coal devolatilization at high temperatures. Symposium (International) on Combustion, 16(1), 411–425. DOI 10.1016/S0082-0784(77)80341-X. [Google Scholar] [CrossRef]
19. Yun, F., Chen, Y. X. (2006). Development of research on calcium carbonate for decomposed kinetics. Bulletin of the Chinese Ceramic Society, 3, 140–145. [Google Scholar]
20. Xie, J. Y., Fu, W. B. (2002). Uniform mathematical model for limestone calcination. Journal of Combustion Science and Technology, 3, 270–274. [Google Scholar]
21. Mikulčić, H., von Berg, E., Vujanović, M., Priesching, P. Tatschl, R. et al. (2013). Numerical analysis of cement calciner fuel efficiency and pollutant emissions. Clean Technologies and Environmental Policy, 15(3), 489–499. DOI 10.1007/s10098-013-0607-5. [Google Scholar] [CrossRef]
22. Cai, X., Ma, Y. L. (2014). Numerical simulation of flow and temperature field in a cement precalciner. Chinese Journal of Environmental Engineering, 8, 4349–4354. [Google Scholar]
23. Mei, S. X., Xie, J. L., Chen, X. L., He, F., Yang, H. et al. (2017). Numerical simulation of the complex thermal processes in a vortexing precalciner. Applied Thermal Engineering, 125, 652–661. DOI 10.1016/j.applthermaleng.2017.07.041. [Google Scholar] [CrossRef]
24. Xie, J. L., Zhang, W. (2015). Numerical simulation on combustion of refuse derived fuel and pulverized coal in an Eddy-currnet precalciner. Journal of Wuhan University of Technology, 37, 1–8. [Google Scholar]
25. Chen, Z. B., Tang, S., Xiang, Q. (2016). Numerical simulations on the coupling process of the combustion of coal powder and the decomposition of raw material in DDF precalciner. Modern Machinery, 6, 45–48. [Google Scholar]
 | This work is licensed under a Creative Commons Attribution 4.0 International License, which permits unrestricted use, distribution, and reproduction in any medium, provided the original work is properly cited. |