DOI: 10.32604/mcb.2021.012598
ARTICLE
Computational Fluid Dynamics Simulations at Micro-Scale Stenosis for Microfluidic Thrombosis Model Characterization
1School of Biomedical Engineering, Faculty of Engineering, The University of Sydney, Darlington, NSW 2008, Australia
2Charles Perkins Centre, The University of Sydney, Camperdown, NSW 2006, Australia
3Heart Research Institute, Newtown, NSW 2042, Australia
4School of Mechanical, Medical and Process Engineering, Queensland University of Technology, Brisbane, 4000, Australia
5Future Industries Institute, University of South Australia, Mawson Lakes, SA 5095, Australia
6South Australian Node, Australian National Fabrication Facility, University of South Australia, Mawson Lakes, SA 5095, Australia
7School of Aerospace, Mechanical and Mechatronic Engineering, Faculty of Engineering, The University of Sydney, Darlington, NSW 2008, Australia
*Corresponding Author: Lining Arnold Ju. Email: arnold.ju@sydney.edu.au
Received: 12 July 2020; Accepted: 27 October 2020
#These authors contributed equally
Abstract: Platelet aggregation plays a central role in pathological thrombosis, preventing healthy physiological blood flow within the circulatory system. For decades, it was believed that platelet aggregation was primarily driven by soluble agonists such as thrombin, adenosine diphosphate and thromboxane A2. However, recent experimental findings have unveiled an intriguing but complementary biomechanical mechanism—the shear rate gradients generated from flow disturbance occurring at sites of blood vessel narrowing, otherwise known as stenosis, may rapidly trigger platelet recruitment and subsequent aggregation. In our Nature Materials 2019 paper [1], we employed microfluidic devices which incorporated micro-scale stenoses to elucidate the molecular insights underlying the prothrombotic effect of blood flow disturbance. Nevertheless, the rheological mechanisms associated with this stenotic microfluidic device are poorly characterized. To this end, we developed a computational fluid dynamics (CFD) simulation approach to systematically analyze the hemodynamic influence of bulk flow mechanics and flow medium. Grid sensitivity studies were performed to ensure accurate and reliable results. Interestingly, the peak shear rate was significantly reduced with the device thickness, suggesting that fabrication of microfluidic devices should retain thicknesses greater than 50 µm to avoid unexpected hemodynamic aberration, despite thicker devices raising the cost of materials and processing time of photolithography. Overall, as many groups in the field have designed microfluidic devices to recapitulate the effect of shear rate gradients and investigate platelet aggregation, our numerical simulation study serves as a guideline for rigorous design and fabrication of microfluidic thrombosis models.
Keywords: Computational fluid dynamics; thrombosis; stenosis; hemodynamics; microfluidics
Cardiovascular diseases have become the world’s No.1 killer, as they are responsible for approximately a quarter of modern mortality worldwide [2,3]. Leading cardiovascular diseases such as coronary artery disease, carotid artery disease and deep vein thrombosis, which cause heart attack, stroke and embolism respectively, share a common root of being attributed to platelet aggregation [3]. These diseases together place a significant burden on the healthcare system and individuals, thus thrombosis is a clinically relevant research area of high demand, due to its prevalence and impact in society today.
Although it is well known that platelet adhesion, activation and aggregation play a central role in thrombosis, the precise interplay of mechanisms surrounding biochemical and biomechanical factors are yet to be fully delineated [4–6]. Our 2019 Nature Materials publication discovered that an integrin αIIbβ3 intermediate affinity state mediates biomechanical platelet aggregation and subsequent thrombus formation [1], and is induced by platelet mechanosensing pathways [7]. Biomechanical or rheological factors have long been recognized as crucial to thrombus formation [5,6], thus identifying, characterizing, and performing experiments on the entire range of physiologically relevant hemodynamic conditions is desired for further advancing our understanding of flow and shear-dependent thrombosis, and development of better antithrombotic drug therapies and biomaterials [3,8].
1.1 Stenosis-Induced Hemodynamic Effects of Flow Disturbance
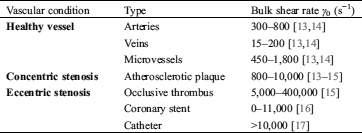
Hemodynamic force largely exists with a wide range of physiological (Fig. 1A, left) and pathological (Fig. 1A, middle and right) shear conditions present in circulating blood flow, especially at a stenosis (Tab. 1). Stenosis describes a vessel or channel narrowing, which leads to flow velocity increase. This in turn also increases the shear rate γ (s−1)—the tangential strain rate acting on vessel walls and blood components due to fluid flow. Clinically, there are two types of vessel stenoses typically observed: firstly, ‘concentric stenosis’ (Fig. 1A, middle) which usually occurs due to atherosclerotic plaque formation [9] and symmetrically narrows the vessel from two directions; and secondly ‘eccentric stenosis’ (Fig. 1A, right) which usually occurs due to medical device intervention [10,11] or existing thrombi formation [12], and asymmetrically narrows the vessel from one direction.

Figure 1: Schematics of vessel stenosis and the mimicking microfluidic models of thrombosis. (A) Blood flow in a healthy vessel without stenosis (left), in a vessel of concentric stenosis due to atherosclerotic plaque (middle) and a vessel of eccentric stenosis due to medical device intervention (right). (B) Eccentric stenosis mimicking microfluidic model. Note that platelet aggregation occurs at the downstream of the stenosis (top). Representative streamline of a platelet trajectory flowing through the microfluidic device (bottom). (C) 3D geometry and coordinate system of the eccentric stenosis model. Note the origin is located at the center of the front bottom line. (D) Computational mesh details for grid sensitivity analysis. Note the entire structure was meshed into 2,868,187 hexahetral elements for CFD analysis
Table 1: Physiological and pathological shear rate ranges of in vivo circulating blood
In the context of blood rheology, recent studies have highlighted the intriguing association between enhanced platelet adhesion, activation, aggregation and blood flow disturbance, specifically the shear rate gradient γ’ as implicated in elongational flow, eddy currents, recirculation and reciprocation [5]. It is also hypothesized that the primed platelet adhesion is not simply a localized response to elevated shear and extensional force at the stenosis, but may be a result of the cumulative effects of the entire ‘shear history’ and concomitant cellular (particle) interactions experienced by platelets and red blood cells as they enter the stenosis contraction, pass through the stenosis apex and exit the stenosis expansion [18,19]. Thus, a CFD approach that can map ‘shear distribution and rheological history’ would be instrumental in investigating biomechanical thrombosis using microfluidics [6].
1.2 Application of Microfluidics to Thrombosis Researches
Microfluidics, or ‘lab on a chip’ systems, are popular tools for micro-scale investigation of hematological processes, by miniaturized control of agonist stimulation and ligand presentation [1,20–22]. Moreover, taking advantage of their fluidic nature, microfluidic devices are increasingly invented and employed to examine the hemodynamic force effect on vascular and hematological cell behaviors [23–25], particularly the unique mechanosensitive features of platelet activation and thrombus formation [6]. In this context, microfluidic channels may be designed and fabricated with specific materials to recapitulate specific cardiovascular or medical device shear microenvironments. For example, a micro-contraction or ‘hump’ may be designed to mimic concentric stenosis and flow disturbance [1,26] (Fig. 1B). Furthermore, while in vivo stenosis may have a complex 3D geometry, the hemodynamic shear effects of such 3D geometries may be simply mimicked using a precisely constructed 2D geometry, to mirror the same hemodynamic environment in vitro in an easily fabricated manner. The challenge in these microfluidic studies is to accurately recapitulate physiologically relevant flow conditions, which is mostly determined by flow medium selection.
1.3 Computational Fluid Dynamic Modelling for Interpreting Microfluidic Shear Experiments
While previous experimental studies have used CFD to demonstrate stenosis induced shear gradients [18,26], none of them have conducted whole channel numerical simulation nor systematically modeled the effect of different bulk flow mechanisms and fluid media on blood rheology. Furthermore, the employed verification schemes are usually unclear or void. Hereby, this CFD study comprehensively mapped the shear rate distribution of various flow conditions and examined the geometrical influence on microfluidic hemodynamics. Our efforts of numerical verification established CFD characterization principles for microfluidic models of thrombosis in the field.
2.1 Numerical Formulation and Governing Equations
In the present study, a finite volume approach using ANSYS FLUENT version 2020 R1 is utilized to solve the governing equations of fluid flow dynamics and obtain the flow field. It is assumed that the flow is incompressible, laminar and steady. Under these assumptions, the well-known Navier-Stokes equation can be expressed as


where  denote the velocity vector, the pressure of the fluid, the density and the dynamic viscosity, respectively. In ANSYS FLUENT, the standard second order scheme as well as the second order upwind scheme were applied to discretize the pressure and momentum equations, with the Coupled algorithm utilized for pressure-velocity coupling.
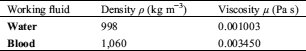
To assess the effect of various physical properties of fluid on the shear rate distribution, two working fluids were examined; water and blood. The physical properties of the investigated working fluids are listed in Tab. 2.
Table 2: Working fluids modeled and physical properties
2.2 Geometrical Properties and Boundary Conditions
A schematic diagram of the microfluidic device is illustrated in Fig. 1C. The axial length (X0 = 200 µm), the width (Y0 = 100 µm) and the height of the microfluidic device’s cross-section (Z0 = 130 µm) were kept as default geometric constants for all simulations.
A zero-gauge pressure boundary condition was applied at the inlet of microchannel (Fig. 1B). The no-slip boundary condition was applied to the walls. Finally, a boundary condition of the experimentally implemented mass flow rate Q (kg/s) was implemented at the outlet of the flow region (Figs. 1B and 1C) as ANSYS inputs. The mass flow rate calculation is defined as:

where  (s−1) is the bulk shear rate, A (m2) is the cross-sectional area, Dh (m) is the hydraulic diameter, and, λ is the shape factor of the microfluidic device’s cross-section [27]. A, Dh and
  are calculated by the following equations:


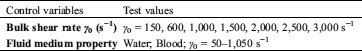
2.3 Control Variables Selection
To investigate the flow rate influences on shear rate distribution, two studies were conducted with variables defined as per Tab. 3. Study 1) The bulk (wall) shear rate was varied from γ0 = 150 to 3,000 s−1 by adjusting outlet mass flow rate from 32.5 to 649.6 µg s−1 as calculated from Eq. (3); Study 2) We assessed water and blood scenarios by adjusting the density and viscosity of fluid medium.
Table 3: Control variable selection
The shear rate and velocity profile were exported with a default streamline sampled as the single platelet trajectory passing 1 µm (half of a typical platelet diameter) above the stenosis apex, and z = 30 µm from the bottom (Fig. 1B, bottom).
3.1 Grid Sensitivity and Convergence Analysis
Grid sensitivity study is the key calibration step, which should be conducted before finalizing the results. Hereby, we analyzed blood shear rate and velocity profiles along a 20 μm vertical sample line, which is located 30 µm away from the channel wall in the z-direction and connects between the apex of the stenosis and the ceiling of the microfluidic channel (Fig. 2A). To assure the independence of meshing size, three grids with 1,005,040 (Fine), 2,010,840 (Finer) and 2,868,187 (Finest) structured hexahedral meshed elements were examined (Fig. 1C) and six simulations for the eccentric stenosis geometry were performed for the lowest γ0 = 50 s−1 (Figs. 2B and 2E) and the highest γ0 = 3,000 s−1 (Figs. 2C and 2F). Moreover, during the iterative finite volume analysis, the computation is considered completed when the residuals (the root mean square error of approximation between two successive iterations) of the continuity equation are less than a certain value, defined as the “convergence criteria”. To assure the results are also independent of the applied convergence criteria, three simulations were performed with the finer grid and γ0 = 1,000 s−1 with residuals less than 1e−3, 1e−6 and 1e−9 (Fig. 2F). We found the velocity and shear rate profiles are superimposed, demonstrating that the results acquired from our simulations are independent of the selected grid and convergence criteria. It is worth noting the following simulations are conservatively performed utilizing the finer grid and 1e−6 convergence criteria.

Figure 2: Grid sensitivity and convergence analysis result under blood condition. (A) The vertical sample line of grid sensitivity study, which locates 30 µm height to the bottom in the z-direction and connects 20 µm spacing between the ceiling and the surface of stenosis apex along y-direction. (B–E) Shear rate and velocity profiles along the sample line under γ0 = 50 s−1 (B and D) and γ0 = 3,000 s−1 (C and E) with 3 different meshing sizes. Note the 3 lines are indistinguishable with each other. (F) The velocity distribution along the sample line under γ0 = 1,000 s−1 with 3 convergence criteria of <1e−3, <1e−6 and <1e−9
3.2 Flow Rate Effect on Shear Rate Distribution
Over the past decades, extensive studies using parallel plate flow chambers and capillary slides have demonstrated shear-dependent platelet adhesive behaviors at various shear rates of laminar flow [25,28,29]. Nevertheless, the effect of shear rates in disturbed flow remains elusive. Thus, we first examined the effect of various bulk shear rates γ0 = 150–3,000 s−1 on the disturbed flow region of eccentric (Fig. 3A) and concentric (Fig. 3E) stenoses. As observed in both types of stenoses, the peak shear rate γmax occurs at the middle of stenosis area while the peak shear rate gradient γ’max occurs at the upstream corner of stenosis geometry (Figs. 3D and 3H; 5 µm from the x-direction midpoint). Blood flow experienced linear increases in γmax and γ’max with respect to γ0 (Figs. 3B and 3F). The γmax for eccentric and concentric stenoses increased 19.4 and 20.0 folds respectively as γ0 increases from 150 to 3,000 s−1 (Figs. 3C and 3G). Similarly, the γ’max for both geometries increased 18.8 and 20.5 folds respectively (Figs. 3D and 3E). A close look at the eccentric (Figs. 3A–3D) and concentric (Figs. 3E–3H) stenoses with their γ and γ’ distribution in all cases shows an equal-space increasing trend. Similar to eccentric stenosis, concentric stenosis geometry presents identical shear rate distributions in most of the cases. Notably, we found concentric stenosis has a more organized streamline which leads to smaller peak shear rate than eccentric stenosis (compare γmax = 24,300 s−1 in Fig. 3A vs. γmax = 26,900 s−1in Fig. 3E). Furthermore, the concentric stenosis γ0–γmax linearity is stronger than that of eccentric stenosis (compare Figs. 3F vs. 3B). In addition, a more extensive high γ region at the ceiling is observed in the eccentric stenosis geometry (Figs. 3A and 3E), which could lead to higher probabilities of platelet aggregation. These results suggest that increased hemodynamic force is not purely a function of the stenosis level, but that the stenosis topology also plays a role. As a result, further investigation into the effects of geometrical shape and location of atherosclerotic plaque, thrombi, or medical device intervention, may be of clinical implication to controlling shear-dependent platelet activation.

Figure 3: CFD simulated shear rates and shear gradients in eccentric (A–D) and concentric (E–H) stenoses geometry under various bulk shear rates of blood condition. (A and E) The 3D colormap of shear rate distribution in the eccentric stenosis and concentric stenosis microfluidic device for γ0 = 1,000 (top) and 2,000 (bottom) s−1 respectively. The interstitial blood flow rendering was colored by shear rate at constant viscosity. Note the shear rate maxima occurs at the stenosis apex and near the wall while the center forms a low shear pocket. (B and F) Peak shear rate γmax linearly correlates with input bulk shear rate γ0 for both eccentric and concentric stenoses respectively. Note the concentric stenosis geometry demonstrates better linearity. The shear rate γ (C and G) and shear rate gradient γ’ (D and H) distribution were analyzed along a sample streamline 1µm above stenosis apex spanning the shear acceleration (x = −100–0 µm) and deceleration (x = 0–100 µm) zones. Note the γ and γ’ present equal-space increment in regard to γ0. The γmax is located at x = 0 µm while the γ’max is located at x = −5 µm
3.3 Fluid Medium Effect on Shear Rate Distribution
The effects of the selected fluid medium on microfluidic experiment models are incompletely defined. For example, it is fundamental to understand whether the flow-induced shear force experienced by purified platelets in water based buffer is the same as that in whole blood [25,29]. It is commonly known that water is a Newtonian fluid, while whole blood displays Newtonian features at γ > 1,000 s−1 [30]. To examine the viscosity influence on shear rate distribution, we mapped the shear rate distribution of the entire microfluidic device. In these studies, water and blood were examined at a wide range of bulk shear rates (γ0 = 50 to 1,050 s−1). The results presented in Fig. 4A illustrate negligible differences in γmax for the two fluid medium. As a result, water can be used to qualitatively map shear rate distribution as a pilot study, and thereby reduce the computational power and time required for microfluidic characterizations in our future practice.
3.4 Relationship between the Device Thickness and Shear Rate Distribution
Previous experimental observations have shown that for the same stenosis level, small variations in the height of the microfluidic channel may compromise the reproducibility of thrombosis observation [1]. With respect to the microfabrication principle, it is difficult to ascertain and design the optimal z-axis thickness with the dilemma of compromising between smooth blood flow with a large Z0 > 100 µm, while saving time and material costs of microfluidic fabrication photolithography with a small Z0 < 50 µm [31]. Hereby, we constructed three eccentric stenoses microchannels of thicknesses Z0 = 10, 50, and 130 µm then performed CFD simulation at γ0 = 1,000 s−1 (Fig. 4B). Interestingly, γmax was significantly reduced from 28,000 s−1 at Z0 = 130 µm down to 4,180 s−1 at Z0 = 10 µm (Fig. 4C). This result suggests that fabrication of microfluidic devices should retain Z0 > 50 µm to avoid unexpected hemodynamic changes, which causes significant shear rate decreases between wall and medium. In addition, ‘cutting-corners’ by reducing the thickness of the microfluidic device (and thus cutting down on the raw materials required to fabricate the device, as well as the blood volume required per experiment), may compromise the accuracy of rheological results, leading to questionable biological conclusions in experiments.

Figure 4: Numerical calculation and modeling of flow medium and device thickness. A) Peak shear rate of water (blue) and blood (red) with respect to bulk shear rate. Note the blue and red lines are superimposed. B) The geometry modeling (left) and meshing results (right) of 10, 50 and 130 µm thickness devices. C) The shear rate distribution along a sample streamline 1 µm above stenosis apex spanning the shear acceleration (x = −100–0 µm) and deceleration (x = 0–100 µm) zones in the mid-plane of z-axis (z = 5, 25, 65 µm in height respectively)
Our systematic CFD study provides rheological characterization of microfluidics with stenosis under a 2D flow assumption, with respect to bulk shear rates and flow medium effects. The numerical results provide rheological insights that influence biomechanical platelet aggregation [1,26]. Overall, our results present 1) Both the peak shear rate and shear rate gradient linearly correlate with the bulk flow rate as the boundary condition; 2) To simulate microfluidic perfusion with isolated blood components, for example wih washed platelets, the fluid medium can be assumed as water so as to qualitatively compute the shear rate distribution; 3) Reduction of the microfluidic channel thickness to Z0 < 50 µm incurs a caveat that compromises the accuracy of rheological modeling in the disturbed flow regions.
Acknowledgement: We thank Qing Li, Chi Wu, Lawrence Hao Huang and Sarah Keogh for their helpful discussion, and Sydney Manufacturing Hub, Gregg Suaning, Simon Ringer, Kevin Doan and Nadia Court for support of our lab startup. This work was supported by Australian Research Council Discovery Project (DP200101970–L.A.J. and Z.L.), NSW Cardiovascular Capacity Building Program (Early-Mid Career Researcher Grant–L.A.J.) and Sydney Research Accelerator prize (SOAR–L.A.J.), The University of Sydney Faculty of Engineering Startup Fund and Major Equipment Scheme (L.A.J.). Lining Arnold Ju is an Australian Research Council DECRA fellow (DE190100609), an honorary National Heart Foundation Future Leader fellow (102532), Faculty of Engineering Dean’s Research Award 2020 recipient. This work was conducted (in part) using the ‘Research and prototype foundry’ facilities at the New South Whales node and the ‘Design House’ facilities at the South Australia node of the Australian National Fabrication Facility (ANFF), a company established under the National Collaborative Research Infrastructure Strategy to provide nano- and micro-fabrication facilities for Australia’s researchers.
Author Contributions: Y.C.Z., P.V. and T.G. performed the research, analyzed the data and co-wrote the paper. L.Z., J.W., M.K. and K.Z. provided critical advice. X.V.C. helped revise the manuscript. L.A.J. supervised the study, designed the research and wrote the paper. Research activities related to this work complied with relevant ethical regulations at the Faculty of Engineering, The University of Sydney.
Funding Statement: The author(s) received no specific funding for this study.
Conflicts of Interest: The authors declare that they have no conflicts of interest to report regarding the present study.
1. Chen, Y., Ju, L. A., Zhou, F., Liao, J., Xue, L. et al. (2019). An integrin αIIbβ3 intermediate affinity state mediates biomechanical platelet aggregation. Nature Materials, 18(7), 760–769. DOI 10.1038/s41563-019-0323-6. [Google Scholar] [CrossRef]
2. Virani, S. S., Alonso, A., Benjamin, E. J., Bittencourt, M. S., Callaway, C. W. et al. (2020). Heart disease and stroke statistics—2020 update: A report from the American Heart Association. Circulation, 141(9), e139–e596. DOI 10.1161/CIR.0000000000000757. [Google Scholar] [CrossRef]
3. Jackson, S. P. (2011). Arterial thrombosis—insidious, unpredictable and deadly. Nature Medicine, 17(11), 1423–1436. DOI 10.1038/nm.2515. [Google Scholar] [CrossRef]
4. Jackson, S. P., Nesbitt, W. S., Westein, E. (2009). Dynamics of platelet thrombus formation. Journal of Thrombosis and Haemostasis, 7, 17–20. DOI 10.1111/j.1538-7836.2009.03401.x. [Google Scholar] [CrossRef]
5. Rana, A., Westein, E., Niego, B., Hagemeyer, C. E. (2019). Shear-dependent platelet aggregation: mechanisms and therapeutic opportunities. Frontiers in Cardiovascular Medicine, 6, 141. DOI 10.3389/fcvm.2019.00141. [Google Scholar] [CrossRef]
6. Chen, Y., Ju, L. A. (2020). Biomechanical thrombosis: The dark side of force and dawn of mechano-medicine. Stroke and Vascular Neurology, 5(2), 185–197. DOI 10.1136/svn-2019-000302. [Google Scholar] [CrossRef]
7. Zhu, C., Chen, Y., Ju, L. A. (2019). Dynamic bonds and their roles in mechanosensing. Current Opinion in Chemical Biology, 53, 88–97. DOI 10.1016/j.cbpa.2019.08.005. [Google Scholar] [CrossRef]
8. McFadyen, J. D., Schaff, M., Peter, K. (2018). Current and future antiplatelet therapies: Emphasis on preserving haemostasis. Nature Reviews Cardiology, 15(3), 181–191. DOI 10.1038/nrcardio.2017.206. [Google Scholar] [CrossRef]
9. Yang, S., Hanley, F. L., Chan, F. P., Marsden, A. L., Vignon-Clementel, I. E. et al. (2017). Computational simulation of postoperative pulmonary flow distribution in Alagille patients with peripheral pulmonary artery stenosis. Congenital Heart Disease, 13(2), 241–250. DOI 10.1111/chd.12556. [Google Scholar] [CrossRef]
10. Jin, C., Liu, Y. (2019). Influence of competitive flow caused by different stenosis on coronary artery bypass hemodynamics and PIV study. Molecular & Cellular Biomechanics, 16(1), 51–52. DOI 10.32604/mcb.2019.05728. [Google Scholar] [CrossRef]
11. Zhao, Z., Mao, B., Liu, Y., Yang, H., Chen, Y. (2018). The study of the graft hemodynamics with different instant patency in coronary artery bypassing grafting. Computer Modeling in Engineering & Sciences, 116(2), 229–245. DOI 10.31614/cmes.2018.04192. [Google Scholar] [CrossRef]
12. Mickley, V. (2004). Stenosis and thrombosis in haemodialysis fistulae and grafts: The surgeon’s point of view. Nephrology Dialysis Transplantation, 19(2), 309–311. DOI 10.1093/ndt/gfg504. [Google Scholar] [CrossRef]
13. Kroll, M. H., Hellums, J. D., McIntire, L. V., Schafer, A. I., Moake, J. L. (1996). Platelets and shear stress. Blood, 88(5), 1525–1541. DOI 10.1182/blood.V88.5.1525.1525. [Google Scholar] [CrossRef]
14. Nascimbene, A., Neelamegham, S., Frazier, O. H., Moake, J. L., Deong, J. (2016). Acquired von Willebrand syndrome associated with left ventricular assist device. Blood, 127(25), 3133–3141. DOI 10.1182/blood-2015-10-636480. [Google Scholar] [CrossRef]
15. Kim, D., Bresette, C., Liu, Z., Ku, D. N. (2019). Occlusive thrombosis in arteries. APL Bioengineering, 3(4), 041502. DOI 10.1063/1.5115554. [Google Scholar] [CrossRef]
16. Foin, N., Gutierrez-Chico, J. L., Nakatani, S., Torii, R., Bourantas, C. V. et al. (2014). Incomplete stent apposition causes high shear flow disturbances and delay in neointimal coverage as a function of strut to wall detachment distance. Circulation: Cardiovascular Interventions, 7(2), 180–189. DOI 10.1161/CIRCINTERVENTIONS.113.000931. [Google Scholar] [CrossRef]
17. Lucas, T. C., Tessarolo, F., Jakitsch, V., Caola, I., Brunori, G. et al. (2013). Blood flow in hemodialysis catheters: A numerical simulation and microscopic analysis of in vivo-formed fibrin. Artificial Organs, 38(7), 556–565. DOI 10.1111/aor.12243. [Google Scholar] [CrossRef]
18. Tovar-Lopez, F. J., Rosengarten, G., Khoshmanesh, K., Westein, E., Jackson, S. P. et al. (2011). Structural and hydrodynamic simulation of an acute stenosis-dependent thrombosis model in mice. Journal of Biomechanics, 44(6), 1031–1039. DOI 10.1016/j.jbiomech.2011.02.006. [Google Scholar] [CrossRef]
19. Tovar-Lopez, F. J., Rosengarten, G., Nasabi, M., Sivan, V., Khoshmanesh, K. et al. (2013). An investigation on platelet transport during thrombus formation at micro-scale stenosis. PLoS One, 8(10), e74123. DOI 10.1371/journal.pone.0074123. [Google Scholar] [CrossRef]
20. Zhou, F., Chen, Y., Felner, E. I., Zhu, C., Lu, H. (2018). Microfluidic auto-alignment of protein patterns for dissecting multi-receptor crosstalk in platelets. Lab on A Chip, 18(19), 2966–2974. DOI 10.1039/C8LC00464A. [Google Scholar] [CrossRef]
21. Colace, T. V., Tormoen, G. W., McCarty, O. J., Diamond, S. L. (2013). Microfluidics and coagulation biology. Annual Review of Biomedical Engineering, 15, 283–303. DOI 10.1146/annurev-bioeng-071812-152406. [Google Scholar] [CrossRef]
22. Hansen, C. E., Lam, W. A. (2017). Clinical implications of single-cell microfluidic devices for hematological disorders. Analytical Chemistry, 89(22), 11881–11892. DOI 10.1021/acs.analchem.7b01013. [Google Scholar] [CrossRef]
23. Sundd, P., Gutierrez, E., Koltsova, E. K., Kuwano, Y., Fukuda, S. et al. (2012). Slings’ enable neutrophil rolling at high shear. Nature, 488(7411), 399–403. DOI 10.1038/nature11248. [Google Scholar] [CrossRef]
24. Tsai, M., Kita, A., Leach, J., Rounsevell, R., Huang, J. N. et al. (2011). In vitro modeling of the microvascular occlusion and thrombosis that occur in hematologic diseases using microfluidic technology. Journal of Clinical Investigation, 122(1), 408–418. DOI 10.1172/JCI58753. [Google Scholar] [CrossRef]
25. Ju, L., McFadyen, J. D., Al-Daher, S., Alwis, I., Chen, Y. et al. (2018). Compression force sensing regulates integrin alphaIIbbeta3 adhesive function on diabetic platelets. Nature Communications, 9(1), 1087. DOI 10.1038/s41467-018-03430-6. [Google Scholar] [CrossRef]
26. Nesbitt, W. S., Westein, E., Tovar-Lopez, F. J., Tolouei, E., Mitchell, A. et al. (2009). A shear gradient-dependent platelet aggregation mechanism drives thrombus formation. Nature Medicine, 15(6), 665–673. DOI 10.1038/nm.1955. [Google Scholar] [CrossRef]
27. Miller, C. (1972). Predicting non-Newtonian flow behavior in ducts of unusual cross section. Industrial Engineering Chemistry Fundamentals, 11(4), 524–528. DOI 10.1021/i160044a015. [Google Scholar] [CrossRef]
28. Savage, B., Saldivar, E., Ruggeri, Z. M. (1996). Initiation of platelet adhesion by arrest onto fibrinogen or translocation on von Willebrand factor. Cell, 84(2), 289–297. DOI 10.1016/S0092-8674(00)80983-6. [Google Scholar] [CrossRef]
29. Ju, L., Dong, J. F., Cruz, M. A., Zhu, C. (2013). The N-terminal flanking region of the A1 domain regulates the force-dependent binding of von Willebrand factor to platelet glycoprotein Ibalpha. Journal of Biological Chemistry, 288(45), 32289–32301. DOI 10.1074/jbc.M113.504001. [Google Scholar] [CrossRef]
30. Mendieta, J. B., Fontanarosa, D., Wang, J., Paritala, P. K., McGahan, T. et al. (2020). The importance of blood rheology in patient-specific computational fluid dynamics simulation of stenotic carotid arteries. Biomechanics and Modeling in Mechanobiology, 19, 1477–1490. DOI 10.1007/s10237-019-01282-7. [Google Scholar] [CrossRef]
31. Qin, D., Xia, Y., Whitesides, G. M. (2010). Soft lithography for micro- and nanoscale patterning. Nature Protocols, 5(3), 491–502. DOI 10.1038/nprot.2009.234. [Google Scholar] [CrossRef]
 | This work is licensed under a Creative Commons Attribution 4.0 International License, which permits unrestricted use, distribution, and reproduction in any medium, provided the original work is properly cited. |