DOI: 10.32604/mcb.2021.014287
ARTICLE
Impact of Temperature on Upper Respiratory Tract Infections in Lanzhou Based on the Distributed Lag Model
1School of Management, Lanzhou University, Lanzhou, 730000, China
2School of Economics and Management, Lanzhou University of Technology, Lanzhou, 730050, China
*Corresponding Author: Guorong Chai. Email: zhaigy12@lzu.edu.cn
Received: 15 September 2020; Accepted: 01 December 2020
Abstract: The study mainly analyzed the relationship between temperature and the upper respiratory tract infections (URI) in Lanzhou. We collected the daily URI and meteorological data from 2010 to 2015. A distributed lag non-linear model was used to examine the relationship and potential effects of different temperatures and different lag days on the morbidity of URI. The results showed that the morbidity of URI was significantly related to the meteorological factors, and the peak of the onset of the disease usually occurred between November and February the next year. The correlation analysis was carried out between meteorological factors and URI cases, and the result revealed that the daily morbidity of URI in Lanzhou was related to air temperature, air pressure, and wind speed. The exposure effect curve of average daily temperature to different sex and different age groups in Lanzhou displayed an M-shaped. Temperature had a certain lag effect on the daily morbidity of URI. For low temperature, it appeared on the present day, and the maximum impact appeared at lag 2 days and persisted for 12 days. The female was more vulnerable than the male, and the impact was obvious in teenagers and the elderly and not obvious in adult. Meteorological factors play an important role in the occurrence of URI in Lanzhou, but the main factor is low temperature. Temperature can trigger the morbidity of URI directly; it can induce various symptoms of URI (such as cold, sore throat and rhinitis) and directly affect the distribution of URI in the population.
Keywords: Upper respiratory tract infection; impact; temperature; distributed lag non-linear model
The main function of the respiratory system is to exchange gas between the body and the external environment. It continuously intakes oxygen from the outside world, while removing carbon dioxide produced by the circulatory system, so that the body can operate normally. In general, the nose, pharynx and larynx are called the upper respiratory tract, the upper respiratory tract is also an organ that contacts directly with meteorological factors. The changes in meteorological factors will have direct or indirect effects on the respiratory system, such as cold, frostbite, bronchitis, etc. [1]. Based on the analysis, Zhou [2] reported that the age of patients with URI in different weather is also different in Beijing; Ma et al. [3] revealed the effect of several meteorological factors on the onset of URI is also different in different seasons; Kong et al. [4] found the minimum temperature with a 1°C increase yielding a 1.8% decrease in URI by using multiple regression; Han et al. [5] conducted that under the influence of various meteorological factors, there is a negative correlation between temperature and upper respiratory diseases; Luo et al. [6] found that the number of respiratory diseases hospitalization has a non-linear relationship with temperature change and extreme low temperature is more harmful in Guangzhou; Jiang [7] used the generalized additive model to analyze the impact of meteorological factors on the number of outpatients with upper respiratory diseases in Beijing.
Through the research above, we can know the type and extent of the meteorological factors affecting the morbidity of URIs varied in different regions, and the conclusions are also different because of the differences in geographical conditions, climate, living environment, and air pollution in different regions. In addition, the main research areas are concentrated in coastal cities and some economically developed areas in China. There are few reports on Semi-arid areas, and the morbidity of URI is not stratified by sex and age in order to analyze the impact of temperature on different populations. As global warming continues, the rate of temperature rise in semi-arid areas is much faster than in other areas. At the same time, the frequency and duration of dramatic weather change are gradually increasing; the risk of upper respiratory tract diseases significantly increases [8,9]. This study aims to reveal the impact of meteorological conditions on the morbidity of URI in Lanzhou, further observe the influence of temperature change on the morbidity of URI, and further provide effective prevention. We collected meteorological and URIs data in Lanzhou City from 2010 to 2015, and distributed lag non-linear models (DLNM) were used to evaluate the impact of temperature on the URIs and the lag effects. The correlation between temperature and the morbidity of URI was conducted between different genders and ages [10–12].
URI data were obtained from the First Hospital of Lanzhou University in the period from January 2010 to December 2015. Daily outpatient data included patient ID, gender, age, disease classification, and diagnosis date. The diagnose was coded according to the 10th Edition of International Classification of Disease (ICD-10). The patients were divided into male, female, 18 years old, 18 to 64 years old, and ≥ 65 years old. The daily meteorological data from January 2010 to December 2015 were provided by Gansu Meteorological Bureau, including temperature, air pressure, wind speed, relative humidity, and precipitation.
2.2 Statistical Analysis Method
In the first step of the study, Spearman correlation was conducted to analyze the correlation between meteorological factors and URI. The meteorological factors correlated to the URI were included in the model, and p < 0.05 was regarded as statistically significant. Cross-basis matrices were established for morbidity data of URI and meteorological data respectively, the daily morbidity was taken as dependent variable, and quasi-Poisson connection function was used for fitting. The relationship between meteorological factors and URI (number of cases) was fitted by using the distributed lag non-linear model after controlled the long-term and seasonal trend. Daily mean temperature was selected as temperature indicator to analyze the relationship between daily average temperature and URI. The confounding effects of daily average air pressure and relative humidity were controlled. A two-dimensional matrix of temperature and lag time was established to conduct the lag effect of temperature on the URI. The basic model is as follows:  , In the formula:
  is the number of patients on day t;
  is a constant term;
  is a two-dimensional matrix of temperature obtained by using the “cross-basis” function in DLNM, and
  is the coefficient of explanatory variables in regression model;
  (
( ,
,  ) refers to the use of natural cubic splines with degrees of freedom of three to control the influence of air pressure;
  (
( ,
,  ) refers to the use of natural cubic splines with degrees of freedom of three to control the influence of relative humidity. As a new time series variable,
  is introduced into the natural cubic spline function to control the seasonal trend and long-term trend,
  (
( ,
,  ) is a natural cubic spline curve with a degree of freedom of 7 per year to control the influence of seasonal and long-term trends.
  is the dummy variable to explain what day is it day
  .
.
Referring to the relevant research [13], the maximum lag time was selected as 14 days to completely capture the adverse effect, and the median of annual average temperature ( ) was considered as the reference value to calculate RR values at different temperatures and different lags. The RR calculation is as follows: if
  is the explanatory variable coefficient in the regression model, the relative risk of temperature to the morbidity of URI in the whole lag time can be calculated as exp (
 ). In addition, the threshold of extreme low temperature was defined as the 5th percentile of daily mean temperature range during the study period, and the observed values of daily mean temperature below the threshold were defined as extreme low temperature. The relative risk of low temperature (
 ) relative to the median temperature (RR) was used to indicate the effect of temperature on the morbidity of URI. The effect of temperature on the daily morbidity of URI was conducted in different sex and age groups.
3.1 Description of Statistical Data
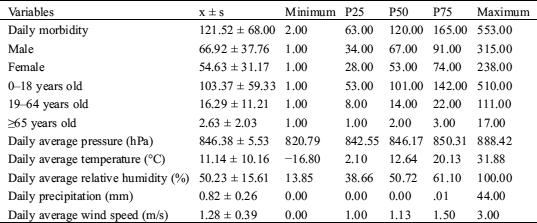
As Tab. 1 shows, 782820 outpatients due to URI in Lanzhou from 2010 to 2015 were collected, with an average of 121.52 cases per day. There were 428798 male cases and 354022 female cases, and the ratio of male to female was 1.21:1. In age-specific subgroups, there were 534434 cases (68.27%) in the 0-18-year-old adolescents group, 213216 cases (21.32%) in the 19–64-year-old adult group, and 35170 cases (4.49%) in the old group. The daily mean pressure, temperature, relative humidity, precipitation, and wind speed of the same period were 848.38 hPa, 11.14°C, 50.23%, 0.82 mm, and 1.28 m/s respectively.
Table 1: Descriptive statistics of meteorological factors and the number of upper respiratory outpatients from 2010 to 2015 in Lanzhou city
As Tab. 2 shows, the correlation between daily outpatient visits of URI and air temperature, air pressure, relative humidity, precipitation, and wind speed was statistically significant (p < 0.01). The morbidity of URI was negatively correlated with air temperature, relative humidity, and wind speed, and the r values were –0.3158, –0.0680, and –0.1237, respectively, and it was positively correlated with air pressure and precipitation. The temperature had the most significant correlation with URI (r = –0.3158) (p < 0.01).
Table 2: Spearman correlation coefficients of meteorological factors and number of upper respiratory outpatients
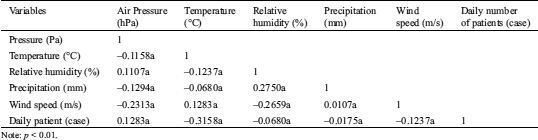
Note: p < 0.01.
Fig. 1 presents the time series of daily outpatients of URI and temperature sequence diagram during the study period. There was an apparent seasonal trend, the morbidity of URI increased during the winter time, especially from January to March, and the second peak of URI appeared between September and November.

Figure 1: Daily distribution of meteorological variables and URI cases in Lanzhou, 2010–2015
3.2 Analysis of Air Temperature and Daily Average Number of Outpatients Based on Distributed Lag Model
In this study, the DLNM model was used to fit the daily average temperature from 2010 to 2015 with the daily outpatients of URI. We selected 14 days as the maximum lag time as seven days, usually considered as a meteorological cycle, so we chose two meteorological cycles to fully capture the lag effect of temperature on URI. The model calculated the RR of each lag day and obtained a three-dimensional plot of the impact of temperature on URI along lag days (Fig. 2). Fig. 2 presents a non-linear relationship between temperature and the URI; the correlation intensity between different daily average temperatures and the number of outpatients varied with the lag time, showing a bimodal effect within certain lag days. When the temperature was 23.0°C, the RR value peaked at lag 5 days. Along the lag days, the impact caused by high temperature attenuated. The impact caused by low temperature on URI was the most significant at lag 2 days and lag 9 days with a temperature of −5°C. With the increase of lag days, the RRs kept increasing.

Figure 2: Three-dimensional plot of the relationship between mean temperature and URI along lag 14 days
Fig. 3 shows the relationship between the risk of URI and lag 0 (the current day), lag 3, lag 5, lag 7, and lag 14 days, respectively. With the year-round temperature range of 5th percentile (−9°C), 25th percentile (−5.3°C), 50th percentile (2.1°C), 75th percentile (20.1°C), and 95th percentile (25.3°C), and we take annual average temperature (11.14°C) as the reference value. The solid color line represents the line of relative risk point estimates, and the gray area is its 95% confidence interval (CI). At the present day, the risk of URI shows a single peak trend with the increase of daily average temperature. For low temperature, the maximum impact appeared when the temperature was −5°C and then attenuated along the lag days. At lag 3 days, 5 days and 7 days, the RR of URI changed in the same trend, showing a typical bimodal trend. The minimum impact appeared at 13°C, and the second peak of RR appeared at 23°C, then the RR attenuated. At lag 14 days, the RR of URI was not obvious.
In the right part of Figs. 3h–3m, for low temperature, the RR of URI increased at first and then attenuated along the rest of the lag days. The maximum impact appeared at lag 2 days and then attenuated, the second peak of RR appeared at lag 8 days and persisted for 2 days, then attenuated along the rest of the lag days. When the temperature was −5.3°C, the RR of URI showed a relatively high trend. When the temperature was 2.1°C, the risk of URI was not obvious, and there was little fluctuation in the lag days. When the temperature was 20.1°C and 25.3°C, the RR of URI increased first and then decreased with the lag days. At lag 5 days, the maximum impact of URI appeared and then began to attenuate gradually. From the analysis above, for low temperature, the RR of URI persist for a long lag period, and the RR decreases rapidly after lag 10 days; for high temperature, the RR of URI has acute and short-term effect within 4–6 days after lag period.

Figure 3: Plot of relative risk (RR) by temperature at specific lags (left), and RR by lag at specific temperatures (right)
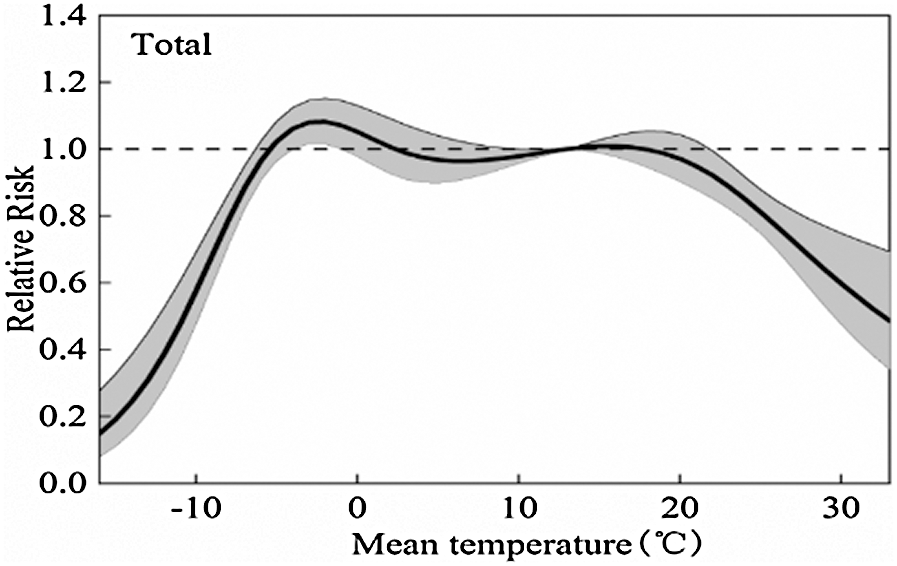
Figure 4: The overall relative risks of mean temperature for total URI cases over 14 days
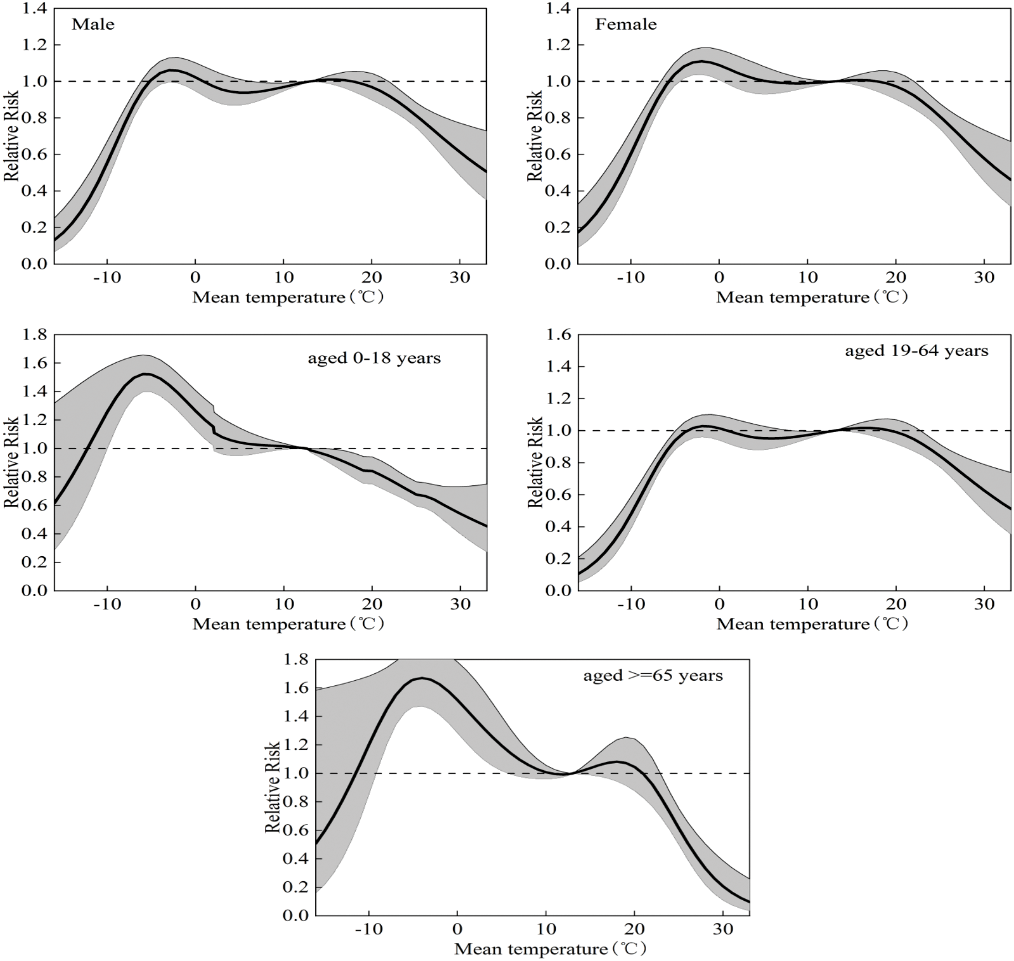
Figure 5: The overall relative risks of mean temperature for age and gender-specific URI cases over 14 days
As Fig. 4 shows, the relationship between daily average temperature and morbidity of URI in Lanzhou is non-linear along the lag period. At −5°C, the RR begun to show statistical significance, and the RR value was 1.02 (95% CI: 0.92–1.12); at 18°C, the RR increased, and the value was 1.14 (95% CI: 0.91–1.22). As shown in Tab. 3, the relationship between temperature and URI morbidity in different gender groups was similar to the general trend. The RR in females was slightly higher than males. Nevertheless, there was significance in age subgroup analysis. As shown in Fig. 5, the RR of adolescents aged 0–18 is a typical unmoral type, the RR increased at −10°C; the maximum impact occurred at −5.2°C and the value was 1.52 (95% CI: 1.40–1.65), then attenuated gradually; and there was no RR at 10°C. In the 19–64-year-old group, the RR is low, and the trend was similar to the general trend. The RR of URI in the old aged over 65 attenuated gradually after the maximum occurred with the value was 1.67 (95% CI: 1.47–1.89) at −4°C, and the second peak appeared at about 20°C.
In summary, for low temperature, adolescents had a relatively higher risk, whereas, for the old aged over 65-year-old, the RR was high at both low temperature and 20°C.
Table 3: The relative risks of different temperatures for age-specific and gender-specific URI cases in Lanzhou. −9°C, −5.1°C, 2°C, 20.1°C and 25.3°C represented the 1th percentile, 5th percentile, 25th percentile, 75th percentile, and 95th percentile of temperature in Lanzhou, respectively
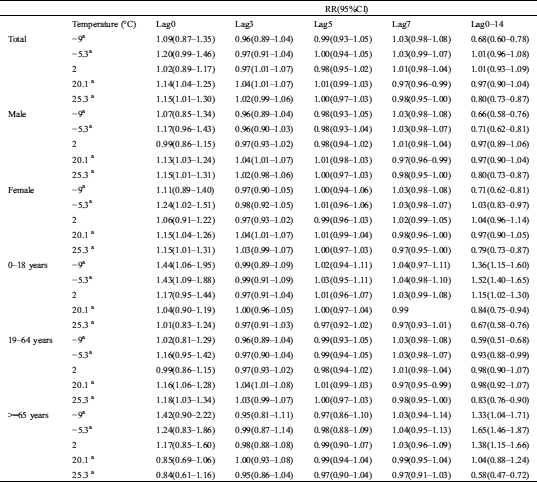
In terms of cumulative effect, for all the cases, it had statistical significance when the temperature was −5.3°C and 2°C, the cumulative RR value was 1.01 (95% CI: 0.96–1.08), 1.01 (95% CI: 0.93–1.09) respectively, which was greater than the cumulative effect of lag 3 days and lag 5 days.
In term of gender specific-subgroup, for male, the cumulative RR was 0.97 (95% CI: 0.89–1.06) at a temperature of 2°C, the cumulative RRs had statistical significance at a temperature of 20.1°C, and the maximum impact occurred at lag 14 days; for female, the RR was 1.24 (95% CI: 1.02–1.51) at −5.3°C, which indicated lower daily mean temperature had a strong impact on URI at the present day, that means the cold effect is more obvious. At lag 14 days, the RR was 1.04 (95% CI: 0.96–1.14), which is greater than the cumulative effect at any other temperatures, but was not statistically significant.
In terms of age-specific subgroup, for children of different ages, the maximum impact occurred at lag 14 days when temperature was −5.3°C. The RRs were 1.36 (95% CI: 1.15–1.60) and 1.15 (95% CI: 1.02–1.30) at lag 14 days at a temperature of −9°C and 2°C, respectively; for adults, the cumulative effects of each temperature were statistically significant; for the old over 65 years old, the RRs were statistically significant at lag 14 days at temperatures of −9°C, −5.3°C, 2°C, and 20.1°C, and the RR peak at −5.3°C, which was 1.65 (95% CI:1.46–1.87).
In this study, we used a distributed lag nonlinear model to analyze the impact of temperature changes on the morbidity of URIs in Lanzhou from 2010 to 2015. The results revealed that the exposure-response relationship between temperature and the morbidity of URI was non-linear. Both low and high temperature are the important risk factors triggering the URI. Compared with 11.13°C, temperature with 1°C increase yielding a 1.36% (95% CI: 1.07–1.56%) increase in the morbidity of URI. By analyzing the emergency data of URI in three hospitals in Beijing from 2009 to 2012, Jiang [7] found temperature with 1°C increase resulting in 0.96% (95% CI: 0.77–2.08%) increase in the morbidity of URI when the temperature was higher than 18.1°C. In Wenzhou City Zhejiang Province, Kong et al. [4] revealed the emergency cases of URI decreased by 1.8% with the daily minimum temperature rose by 1°C. Han [5] found that the morbidity of URI was obvious when the temperature was below −4°C, and the number of cases increased by 67.5%. Luo et al. [6] found that low temperature had a significant impact on the morbidity of respiratory diseases in the Panyu District of Guangzhou and the risk of respiratory hospitalization was 1.48% (95% CI: 1.13–1.94%) when the temperature was 10.9°C. We can see that the risk of URI was at a moderate level in Lanzhou by comparing with the previous studies.
This study analyzed the relationship between temperature and the exposure-response of URI in different gender and age. The study shows that the RR of the female is higher than that of the male, and a 1°C increase yields a 1.24 (95% CI: 1.02–1.51) increase in the risk of female compared with 11.14°C (annual average temperature); the RR of adolescents aged 0–18 and the old aged over 65 is significantly higher than that of adults. The potential reason may be related to female physique is weak and are more vulnerable to the occurrence of low temperature than male, so when the temperature became low, the probability of getting cold and URI would increase. Low temperature also has a strong impact on adolescents and the old and increased RR of URI. Especially for adolescents aged 0-18, when the temperature at 2°C, a 1°C temperature increase would yield 1.17 (95% CI: 0.95–1.44) risk of URI. The underlying reason is that in the spring and autumn, the diurnal temperature range was high and could even reach 20°C. Children are not regulated adequately in the face of large temperature changes, so the risk of URI increases. It is recommended to increase or decrease the amount of clothing for children in time to prevent them from getting cold.
In addition, the Spearman correlation was used in our study to analyze the correlation between meteorological factors and URI. The correlation analysis results showed that the morbidity of URI was negatively correlated with average temperature, precipitation, relative humidity, and wind speed, and had the most significant correlation with average temperature (r = −0.3158), followed by the correlation with average wind speed. (r = −0.1237), but positively correlated with mean pressure (r = 0.1283). This is in line with the previous study conducted in Lanzhou [13]. However, contrary to the studies based in other parts of China, Zhou [2], Kong [4], and Bai [14] reported the main factors affecting the URI were low temperature, low humidity, high temperature, and high humidity while the morbidity of URI in Lanzhou is mainly due to the interaction of low temperature, low humidity, and small wind speed. The reason may be related to the special climate conditions in Lanzhou. Lanzhou is deep inland and far from the ocean. The Qinghai-Tibet Plateau blocked the northward movement of warm and humid airflow to the south, and lack of precipitation; It is a typical continental temperate semi-arid climate. The general climatic characteristics are as follows: Spring (March-May): Rapid warming, but frequent cold air invasion, windy and dusty weather, lake of precipitation, and high probability of drought. Summer (June-August): High temperature, more precipitation, multi-paroxysmal precipitation weather. Autumn (September-October): Temperature drops rapidly, sunshine is abundant, but the diurnal temperature range is large. Winter (November-February of the next year): Controlled by air southward of polar cold, the climate is dry and cold, with less snow, which is the peak period of URI. However, when the temperature and humidity are moderate, adolescents will also have a higher risk of URI; the main reason is that during spring and autumn, the diurnal temperature range is large, and the range of temperature rise is much larger than that of precipitation, the water loss rate is accelerated while the humidity cannot be increased [15–18]. In autumn and winter when the humidity is relatively high, the temperature is in a low-value area, and the morbidity of URI is at a peak. Long term drought, strong sandstorm, and abnormal high temperature in some local areas have led to an increase in the morbidity of URI. Therefore, the meteorological factors affecting the morbidity of URI in semi-arid areas are various, but the main affecting factor is low temperature.
There were some highlights in our research. First, the relationship and lag effects between URI and temperature in different genders and ages was conducted in Lanzhou area by using the distributed lag non-linear model, the potential confounding effects of air pollutants was considered in our model. Second, Lanzhou is the provincial capital of Gansu Province, the research results may provide some reference for the prevention of URI and the development of public health in Gansu Province.
Without a doubt, there are some limitations in our study. First, the differences may exist in different people, and these differences have not been considered in our research. Second, we did not quantify the impact of temperature-related URI on residents’ income and the local economy, which deserves further research.
In summary, the female, teenagers, and elderly are more vulnerable than male and adult, receptively. The finding can provide a reference value for the local public health department and establish prevention strategies for extreme temperature occurrence.
Funding Statement: This research was supported by Fund projects: China Postdoctoral Science Foundation (No. 2016M600827); National Natural Science Foundation of China (No. 71861026).
Conflicts of Interest: The authors declare that they have no conflicts of interest to report regarding the present study.
1. Zhang, S. Y. (2010). Medical-meteorological forecast. Beijing: Meteorological Publishing House. [Google Scholar]
2. Zhou, Z. Y. (2013). Studies on the relationship between upper respiratory infection diseases and meteorological conditions in Beijing. China: Lanzhou University. [Google Scholar]
3. Ma, P., Li, T. S., Ning, G. C., Liu, L. W., Zhang, Z. W. et al. (2015). Relationships between upper respiratory tract infections and meteorological environment conditions in Beijing City and a cluster of weather types in winter. Journal of Lanzhou University (Natural Sciences), 50(1), 79–86. [Google Scholar]
4. Kong, L. D. (2017). The correlation between air pollutants and meteorological factors and children’s respiratory tract infection. Journal of Wenzhou Medical University, 47(4), 263–267. [Google Scholar]
5. Han, P., Xu, Z. Q. (2015). Correlation analysis of disease structure with air quality and temperature in respiratory clinic in winter. Chinese Journal of Respiratory and Critical Care, 14(2), 197–200. [Google Scholar]
6. Luo, H. J., Zeng, S. Q., Hu, M. Y., Luo, Y., Ma, W. J. (2014). Effect of extreme low temperature on respiratory hospital admissions: A time-series study. South China Preventive Medicine, 40(2), 504–511. [Google Scholar]
7. Jiang, Y. F. (2015). A study on the meteorological incentives of upper respiratory tract infection and forecasting methods. Lanzhou: Lanzhou University. [Google Scholar]
8. Luo, X. L., Yang, X. F., Song, L. L., Xia, G. H. (2006). The relationship between the daily incidence of upper respiratory tract infection and the change of meteorological conditions. Guangdong Meteorology, 2, 43–46. [Google Scholar]
9. Zhang, Y., Wang, S. G., Jia, X. W., Feng, X. Y., Hu, W. D. et al. (2017). Synergetic effect of mean temperature and PM2.5 on emergency room visits for different diseases. Environmental Science of China, 37(8), 3175–3182. [Google Scholar]
10. Gasparrini, A., Armstrong, B., Kenward, M. G. (2010). Distributed lag non linear models. Statistics in Medicine, 29(21), 2224–2234. DOI 10.1002/sim.3940. [Google Scholar] [CrossRef]
11. Gasparrini, A. (2011). Distributed lag linear and non-linear models in R: The package dlnm. Journal of Statistical Software, 43(8), 1–20. DOI 10.18637/jss.v043.i08. [Google Scholar] [CrossRef]
12. Gasparrini, A. (2014). Modeling exposure–lag–response associations with distributed lag non-linear models. Statistics in Medicine, 33(5), 881–899. DOI 10.1002/sim.5963. [Google Scholar] [CrossRef]
13. Jing, W. C., Ma, Y. X. (2011). Analysis of the relationship between respiratory diseases and meteorological factors in Lanzhou Xiamen. The 28th Annual Meeting of China Meteorological Society-s14 Climate and Environment Change and Human Health. [Google Scholar]
14. Bai, L. (2014). Temperature effects on human health and assessment of human-heat vulnerability in Tibet, China. Beijing: Chinese Center for Disease Control and Prevention. [Google Scholar]
15. Gao, W., Baig, A. Q., Ali, H., Sajjad, W., Farahani, M. R. (2017). Margin based ontology sparse vector learning algorithm and applied in biology science. Saudi Journal of Biological Sciences, 24(1), 132–138. DOI 10.1016/j.sjbs.2016.09.001. [Google Scholar] [CrossRef]
16. Gao, W., Wang, Y., Basavanagoud, B., Jamil, M. K. (2017). Characteristics studies of molecular structures in drugs. Saudi Pharmaceutical Journal, 25(4), 580–586. DOI 10.1016/j.jsps.2017.04.027. [Google Scholar] [CrossRef]
17. Gao, W., Wang, Y., Wang, W., Shi, L. (2017). The first multiplication atom-bond connectivity index of molecular structures in drugs. Saudi Pharmaceutical Journal, 25(4), 548–555. DOI 10.1016/j.jsps.2017.04.021. [Google Scholar] [CrossRef]
18. Li, W., Jia, M., Wang, J., Lu, J., Deng, J. et al. (2019). Association of MMP9-1562C/T and MMP13-77A/G polymorphisms with non-small cell lung cancer in southern Chinese population. Biomolecules, 9(3), 107. DOI 10.3390/biom9030107. [Google Scholar] [CrossRef]
 | This work is licensed under a Creative Commons Attribution 4.0 International License, which permits unrestricted use, distribution, and reproduction in any medium, provided the original work is properly cited. |