Biomechanics
| Molecular & Cellular Biomechanics |
DOI: 10.32604/mcb.2021.014622
ARTICLE
Determination of Cup to Disc Ratio Using Unsupervised Machine Learning Techniques for Glaucoma Detection
Muthayammal Engineering College, Kakaveri, Rasipuram, 637408, India
*Corresponding Author: R. Praveena. Email: praveena.r.ece@mec.edu.in
Received: 13 October 2020; Accepted: 05 March 2021
Abstract: The cup nerve head, optic cup, optic disc ratio and neural rim configuration are observed as important for detecting glaucoma at an early stage in clinical practice. The main clinical indicator of glaucoma optic cup to disc ratio is currently determined manually by limiting the mass screening was potential. This paper proposes the following methods for an automatic cup to disc ratio determination. In the first part of the work, fundus image of the optic disc region is considered. Clustering means K is used automatically to extract the optic disc whereas K-value is automatically selected by algorithm called hill climbing. The segmented contour of optic cup has been smoothened by two methods namely elliptical fitting and morphological fitting. Cup to disc ratio is calculated for 50 normal images and 50 fundus images of glaucoma patients. Throughout this paper, the same set of images has been used and for these images, the cup to disc ratio values are provided by ophthalmologist which is taken as the gold standard value. The error is calculated with reference to this gold standard value throughout the paper for cup to disc ratio comparison. The mean error of the K-means clustering method for elliptical and morphological fitting is 4.5% and 4.1%, respectively. Since the error is high, fuzzy C-mean clustering has been chosen and the mean error of the method for elliptical and morphological fitting is 3.83% and 3.52%. The error can further be minimized by considering the inter pixel relation. To achieve another algorithm is by Spatially Weighted fuzzy C-means Clustering (SWFCM) is used. The optic disc and optic cup have clustered and segmented by SWFCM Clustering. The SWFCM mean error clustering method for elliptical and morphological fitting is 3.06% and 1.67%, respectively. In this work fundus images were collected from Aravind eye Hospital, Pondicherry.
Keywords: Cup to disc ratio (CDR); glaucoma whereas K-means clustering; fuzzy C-means clustering (FCM); hill climbing searching
Blindness is conditioning with lack visually perfected due to the physiological or neurological factors. The major global cause of blindness due to cataract (47.8%), glaucoma (12.3%), is age related macular degeneration (8.7%) and due to corneal opacity (5.1%).
Glaucoma is a serious ocular disease and leads to blindness if it is not detected and treated in proper way. When there is an elevated intra ocular pressure from the normal condition, the subject is affected by glaucoma and in this condition the retinal nerve fiber layer and the optic disc are affected and this leads to progressive loss of vision if not diagnosed and treated. The observation of optic nerve head, optic cup to optic disc ratio and neural rim configuration are important for detecting glaucoma at an early stage in clinical practice. However, the broad range of cup to disc ratio is difficult to identify the early changes of optic nerve head, and different ethnic groups possess various features in optic nerve head structures. Hence, it is important to develop various detection techniques to assist clinicians to diagnose glaucoma at early stages. This work presents a method for glaucoma detection using digital fundus image. As said earlier, the optic cup to disc ratio (CDR) is one of the main clinical indicators of glaucoma and is currently determined manually limiting the potential in mass screening. In this work, we propose methods for an automatic CDR determination.
Blindness causes mostly due to Glaucoma [1], it was initiated in intraocular pressure (>21 of Hg) which leads to damage the optic nerve [2]. The cup to disc ratio greater than 0.3 in value indicates presence of glaucoma. Colour fundus images are normally used to track the anatomical structures like blood vessels, optic cup, optic disc and macula from the normal retina. In a normal eye physical diameter of the optic disc was about 1.5 mm which is placed in 3 to 4 mm towards nasal side of the fovea. About small depression can be seen in front of the optic nerve head which is known as the cup that is smaller than the optic disc.
The cup to disc ratio is one of the most important parameters to detect the glaucoma. So, First detect the optic nerve head because disc and cup area present in optic nerve head regions only. So, in this study we are concentrated in segmentation of optic nerve head.
The discussion of the glaucoma detection was in deep convolution [3]. It was consisting of six layers; four convolutional layers and two fully connected layers. The over fitting problem was adopted by overlapping-pooling layers and response-normalization layers. It was reviewed in various automated techniques for glaucoma diagnosis which is discussed in [4], the five includes active contour model, super pixel clustering, vessel bend, simple linear iterative clustering, and pallor information.
There are four features such as CDR, vertical to horizontal CDR, disc area to cup ratio and rim to disc area ratio are used for glaucoma diagnosis [5]. The Optic disc segmentation is done with geodesic active contour model and cup segmentation based on pallor appearance around optic disc region. Naïve Bayes, method of K- nearest neighbour and SVM classifiers are used to do the classification. The features are based on segmentations are used for glaucoma diagnosis to be discussed in [6]. Illumination was corrected before extracting features. Optic disc region is detected using Hough transform and template matching is used for ROI extraction. SVM classifier is adopted for classification [7]. Five different Image Net-trained models (VGG16, VGG19, InceptionV3, ResNet50 and Exception) employed for automatic glaucoma assessment using fundus images. Extensive validation results using cross-validation and cross-testing strategies were compared with previous works in the literature [8]. Multilayer raw pixels are extracted with unsupervised architecture using resented convolutional neural network (CNN). The annotated training dataset was used to select the most discriminative deep-belief network (DBN) model. The final decision was made to perform the soft max linear classifier to differentiate between glaucoma and non-glaucoma retinal fundus image.
In deep learning convolutional neural network, computational time was very high. First segment optic disc and cup regions from the fundus images were used to reduce the computational time. Detected regions are fed to the convolutional neural network.
From the literature survey it is inferred that:
• For the segmentation of optic disc and optic cup the level set based algorithm generally needs human interaction. The detection of incorrect boundaries by the conventional level set method is avoided by continuously reinitializing the level set function throughout the evaluation processes.
• Variation level set method is introduced to eliminate the re-initialization procedure.
• The energy minimization-based variation level set method does not consider the edge and region-based information, and hence the segmentation of optic cup is very difficult.
• Due to large intensity variations in the cup region, thresholding techniques are not adequate.
• Segmentation of optic disc and optic cup using mathematic morphological techniques highly depends on the shape and size of the selected structuring elements.
• Active contour model takes more convergence time and snakes capture limited range of initialization around the region of interest.
In order to get accurate detection of optic disc and cup region, clustering techniques are proposed. In this work, proposed three unsupervised learning clustering and analysis performance of clusters using regression techniques.
3.1 Research Aims and Objectives
In the medical field, physical measurement, manual processing and classification of medical images have increased the time and stress of clinicians. Hence this research aims to develop an automatic system for the detection of glaucoma. So, the main objectives of this research are as follows:
• To determine cup to disc ratio from the retinal fundus images.
• To determine regression analysis of Gold standard value and developed algorithm.
3.2 Design and Setting of the Study
To determine any abnormality, change in retina fundus images are used. Nowadays glaucoma can be performed by measuring the key characteristic feature like Cup to Disc ratio with automated detection. In this work, three methods are described to detect glaucoma automatically based on the cup to disc ratio.
3.2.1 Optic Disc Segmentation Using Hill Climbing Algorithm and Optic Cup Segmentation Using K-means Clustering
The diameter of optic cup and optic disc are calculated to compute CDR. With this method of calculations, K-means clustering technique is used to extract the optic disc in an automatic manner. By Hill climbing algorithm K-value is automatically selected. The cup is also detected by K-means clustering algorithm with the K-value of 3. In Cup segmentation process, the segmented disc output is applied to k mean clustering. In segmented disc three regions are there namely optic disc, optic cup and background, so K-value used by three.
The Green plane (G) from the RGB fundus image is separated and it is considered for the analysis, because G plane provides best contrast than other two planes is referred in [9]. Maximum brightest point within the optic disc in the G plane is determined. The size 360 × 360 pixels is selected approximately around this identified brightest point. This region is segmented using K-means clustering algorithm initially. The accuracy of optic disc segmentation mainly depends on the number of clusters (K-value) used in K-means clustering algorithm. The optic cup, optic disc, blood vessels and background, the number of clusters cannot be predicted due to intensity variations. Hence, Hill-climbing algorithm [10] is used to determine the optimal number of clusters by identifying peaks in the 3D color histogram of Lab color channel. By obtaining the contours, an elliptical fitting step is introduced to smooth the optic disc boundary.
The greater challenge in extraction was compared with the optic disc, optic cup segmentation. The optic cup region is masked in many places by the blood vessels emerging through the optic disc. Hence to correctly identify the region of optic cup, the blood vessels have to be removed from this region. In order to blur the blood vessels, wavelet transform, and morphological closing operation are used. The characteristics of biorthogonal wavelet transform is similar to shape of blood vessel, so biorthogonal wavelet transform is used for blood vessel segmentation. K-means clustering [11] is performed by assigning the k equal to 3 to detect optic cup. Figs. 1a, 1b show the segmented and elliptically fitted optic cup and disc for normal and glaucoma conditions, respectively [12]. Figs. 2a, 2b show the segmented and elliptically fitted optic disc and actual contour of optic cup for the same conditions.

Figure 1: CDR computations with elliptical fitting shows both optic cup and optic disc (K-means clustering) (a) Normal image (b) Glaucoma condition CDR-Gold standard = 0.3 CDR-Gold standard = 0.6

Figure 2: CDR computation shows elliptical optic disc and actual segmented contour for optic cup (K-means clustering) (a) Normal image (b) Glaucoma condition CDR-Gold standard = 0.3 CDR-Gold standard = 0.6
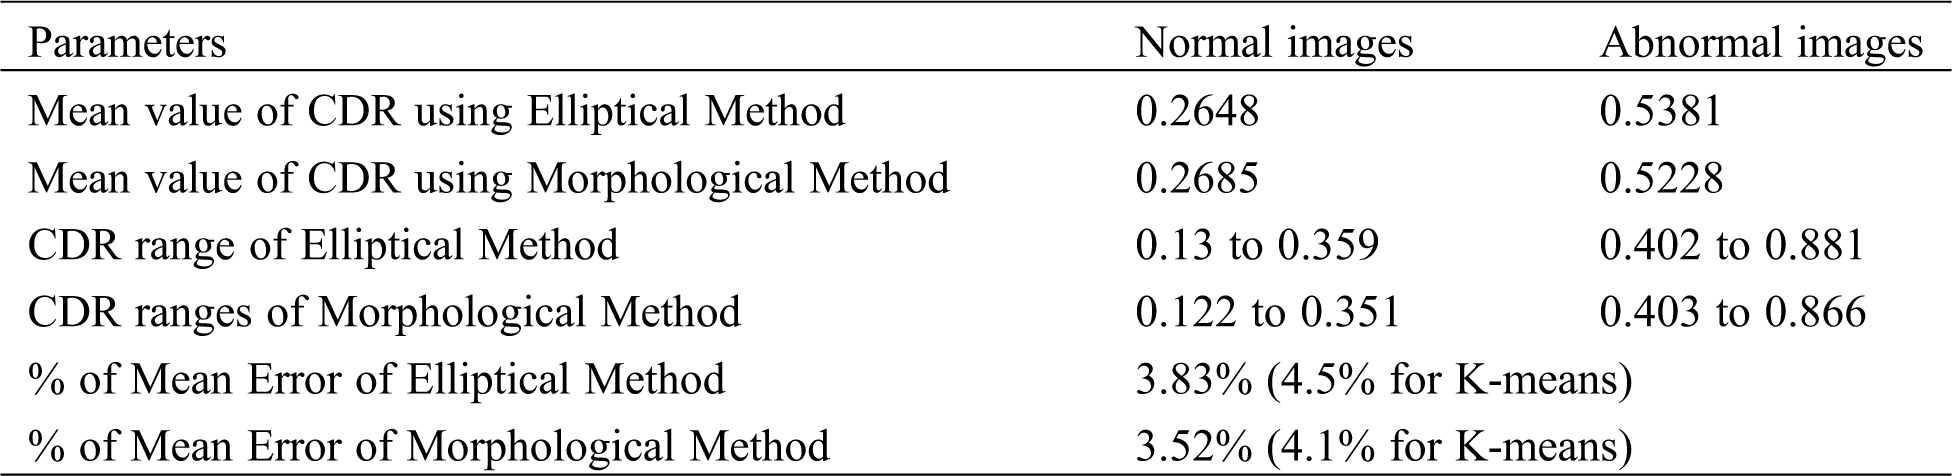
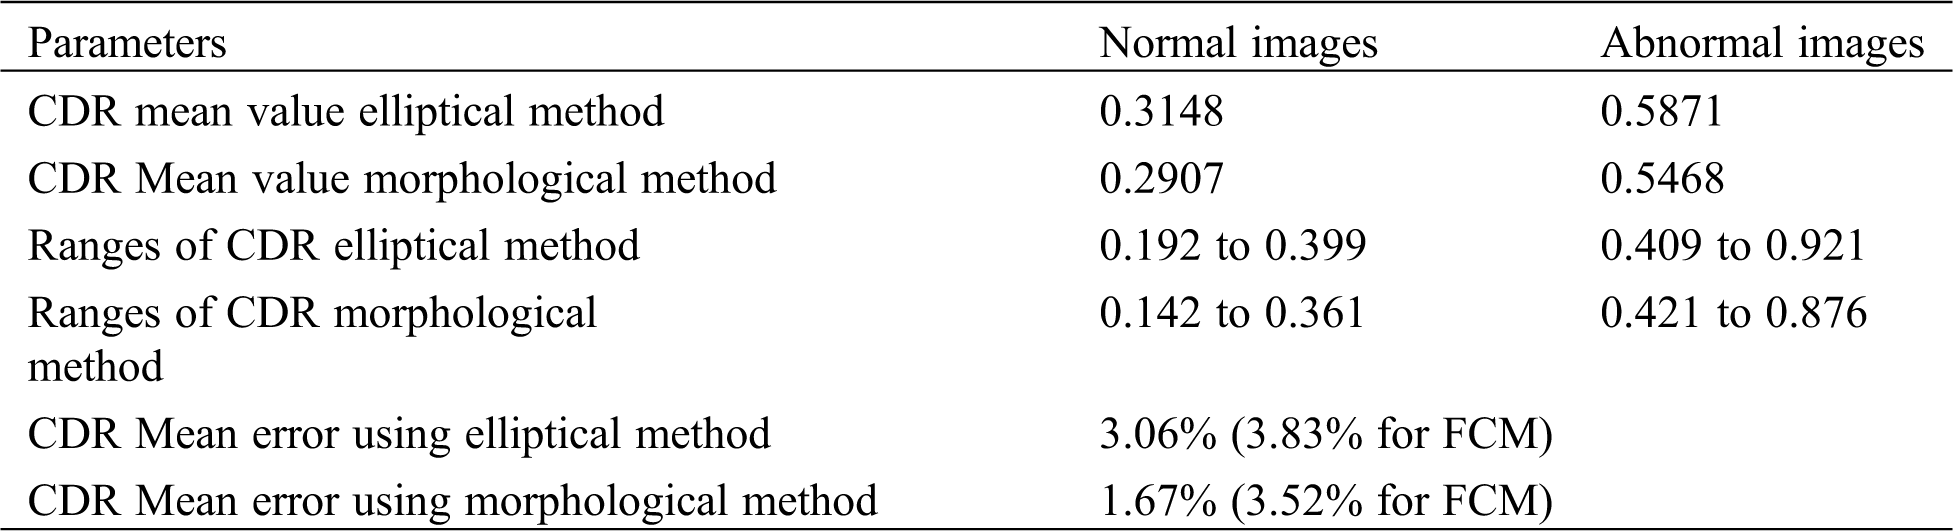
In this method of computation 50 normal images and 50 glaucoma images are used for analysis. In regression analysis ten images are used. These ten images collected from other data set. Tab. 1 shows the CDR ranges, mean value of CDR and mean error of the proposed method. This CDR gold standard range for the normal images lies between 0.15 and 0.35 as far as the glaucoma images it lies between 0.4 and 0.9.
Table 1: CDR ranges from mean and mean error of the proposed method (K-means clustering)
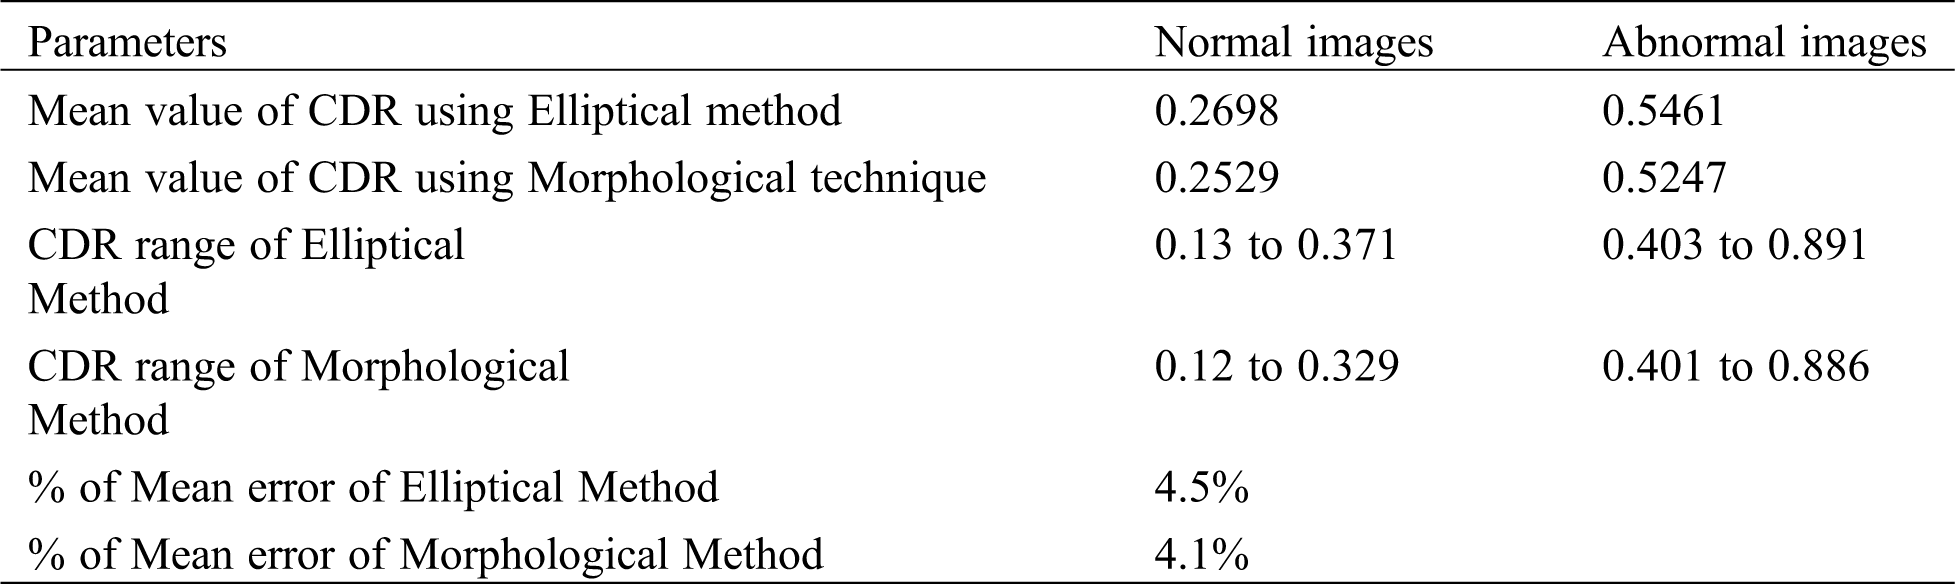
The Tab. 1 shows mean error was calculated by obtained CDR values by K-means clustering algorithm. From the table inferred that the mean error value of morphological method is less than elliptical method.
The concise result was achieved through the scatter plot has been used. The scatter plot was computed CDR vs. gold standard values of CDR that is generated by Minitab statistical software. Fig. 3 shows the scatter plot of CDR using elliptical method and gold standard values and the expression relating the parameters is obtained as
Fig. 4 shows the scatter plot of CDR using morphological method and gold standard values. The correlation coefficient for elliptical method is 0.954 and for morphological method is 0.993. The equation of the fitted curve is obtained as

Figure 3: Scatter plot of elliptical method (K-means clustering)

Figure 4: Scatter plot of morphological method (K-means clustering)
3.2.3 Regression Analysis (K-means Clustering)
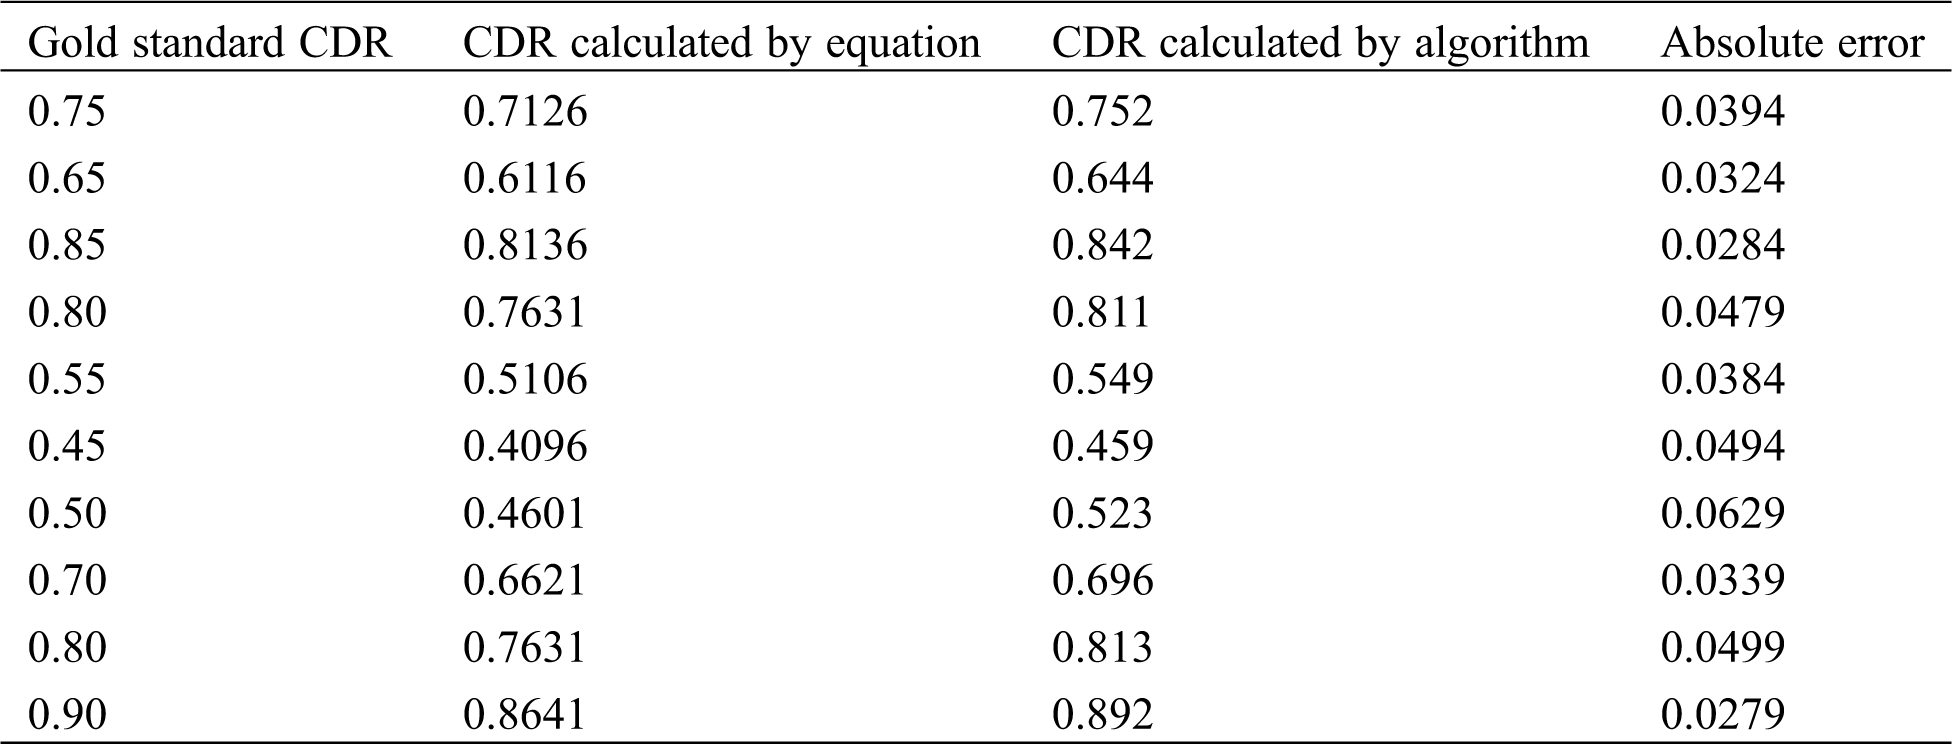
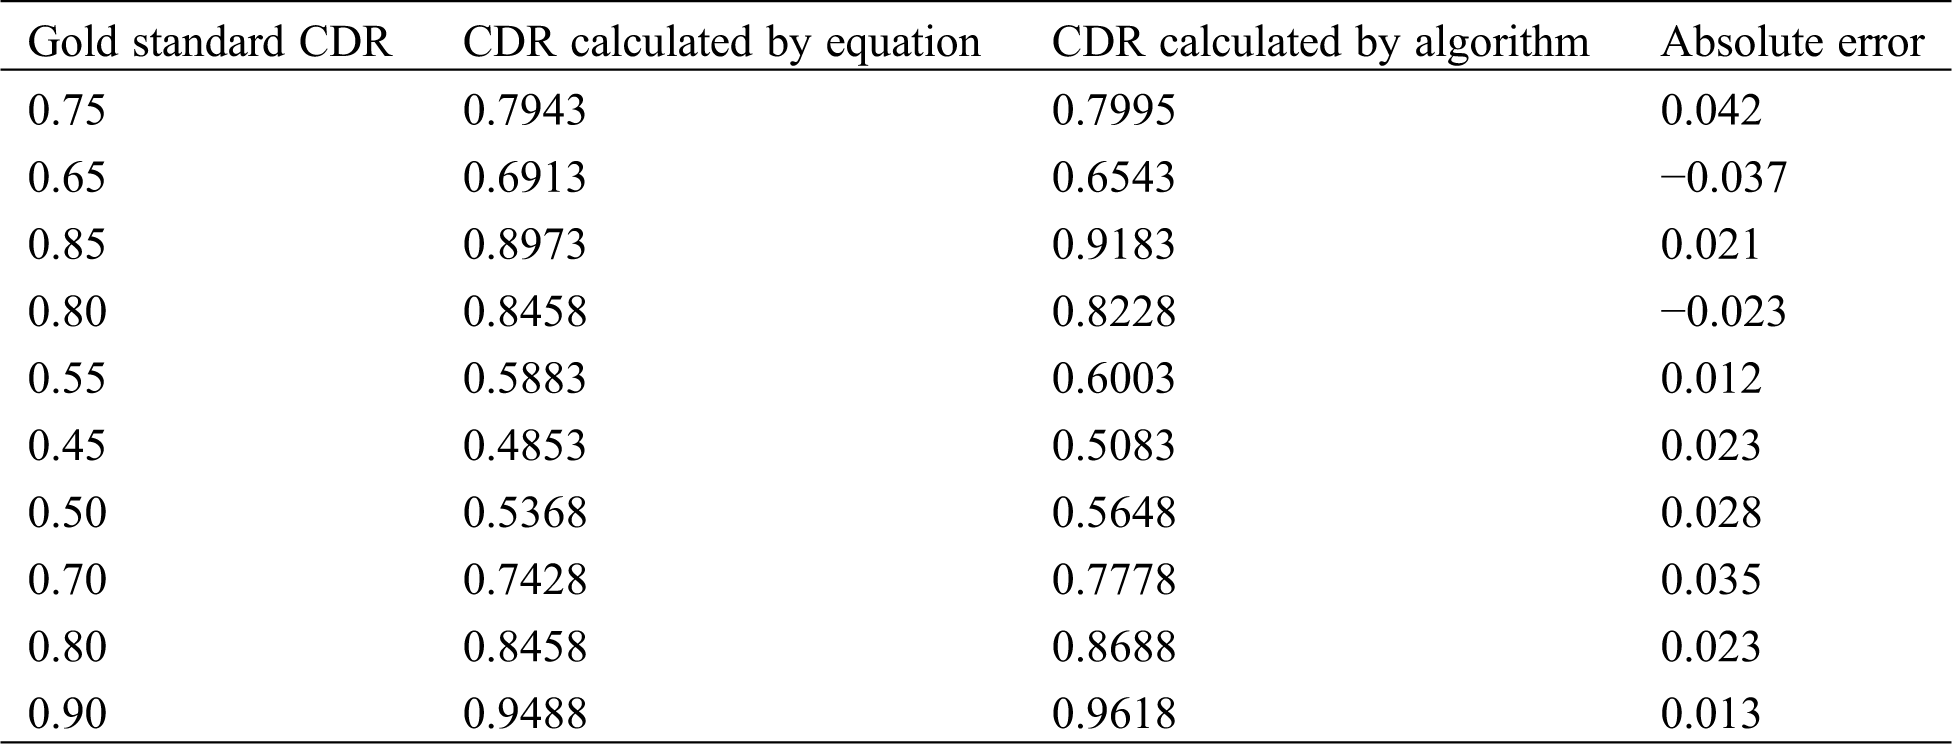
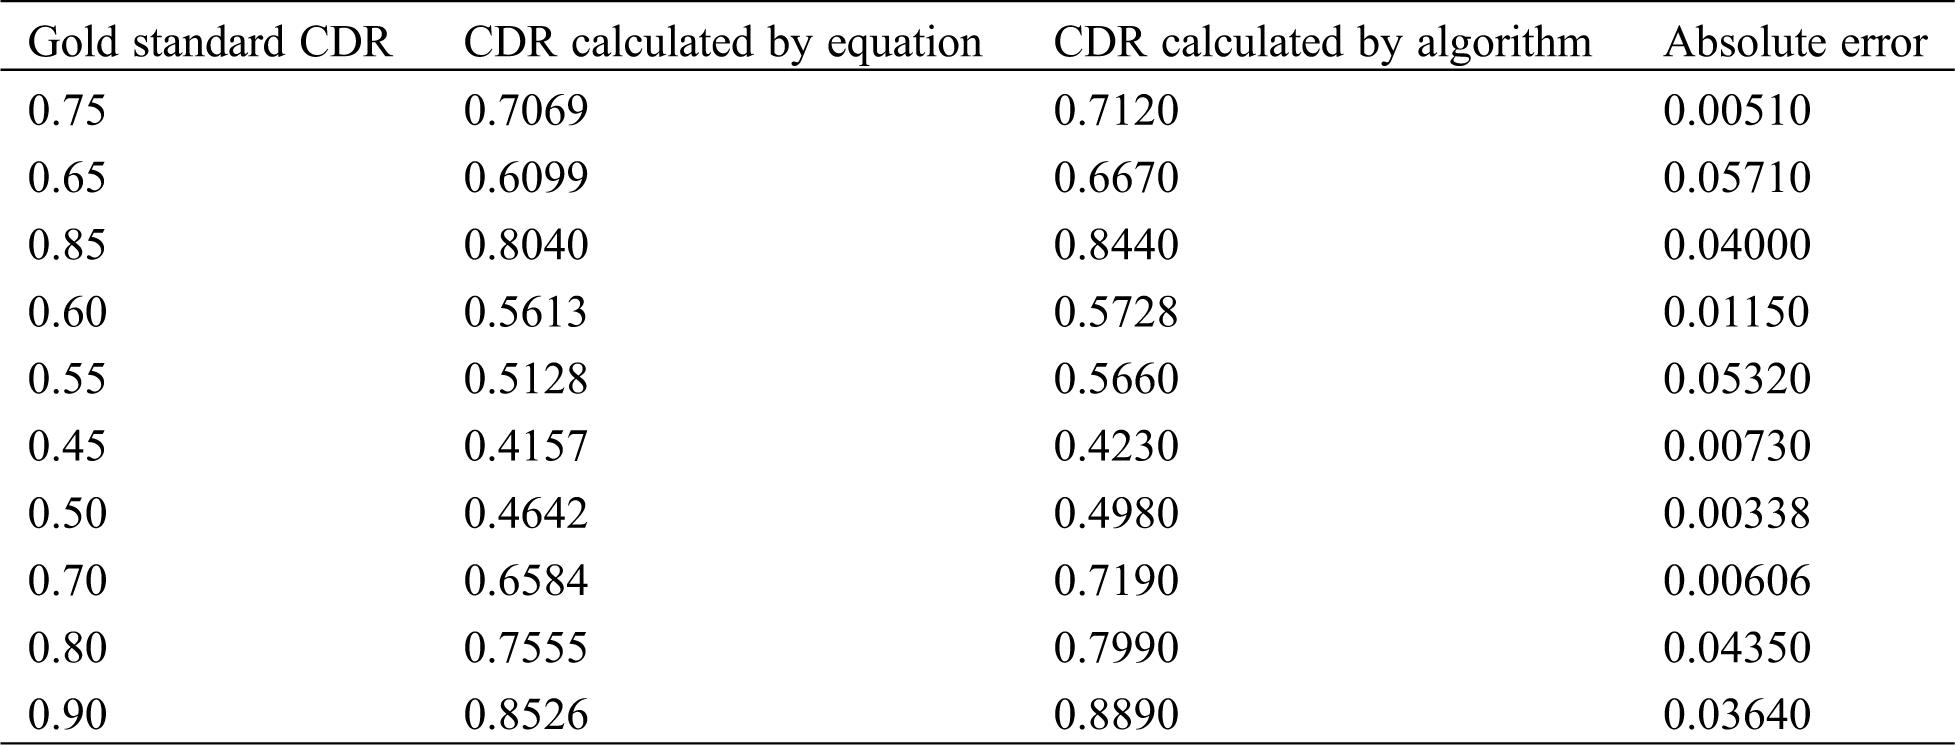
In this analysis, the regression output ‘error’ is calculated from the CDR values by regression equation and proposed algorithm. For this calculation, ten new fundus images from ophthalmologist which are not used in the previous analysis are utilized along with specified gold standard CDR values. The gold standard CDR value is substituted in the Eqs. (1) and (2) to determine elliptical and morphological CDR values and these values are compared with CDR obtained by the application of the proposed method. Tabs. 2 and 3 show the regression analysis of elliptical and morphological CDR values for the same set of ten new images. First to calculate CDR values form new set of ten images by developed algorithm then CDR value computed by regression by substituting ground truth values. The absolute error is the difference between the CDR computed by algorithm and CDR computed by regression method. The mean error of this elliptical method is 4.2% and morphological method is 4.1% which is almost similar to the values shown in Tab. 1. The standard deviation for the regression equation and developed algorithm for the elliptical method is 0.16338 and 0.15898. The standard deviation for the regression equation and developed algorithm for the morphological method is 0.1551 and 0.1491. These results show that the algorithm produces an error less than 5% in both the methods.
Table 2: Regression analysis of elliptical vs. gold standard values of CDR (K-means clustering technique)
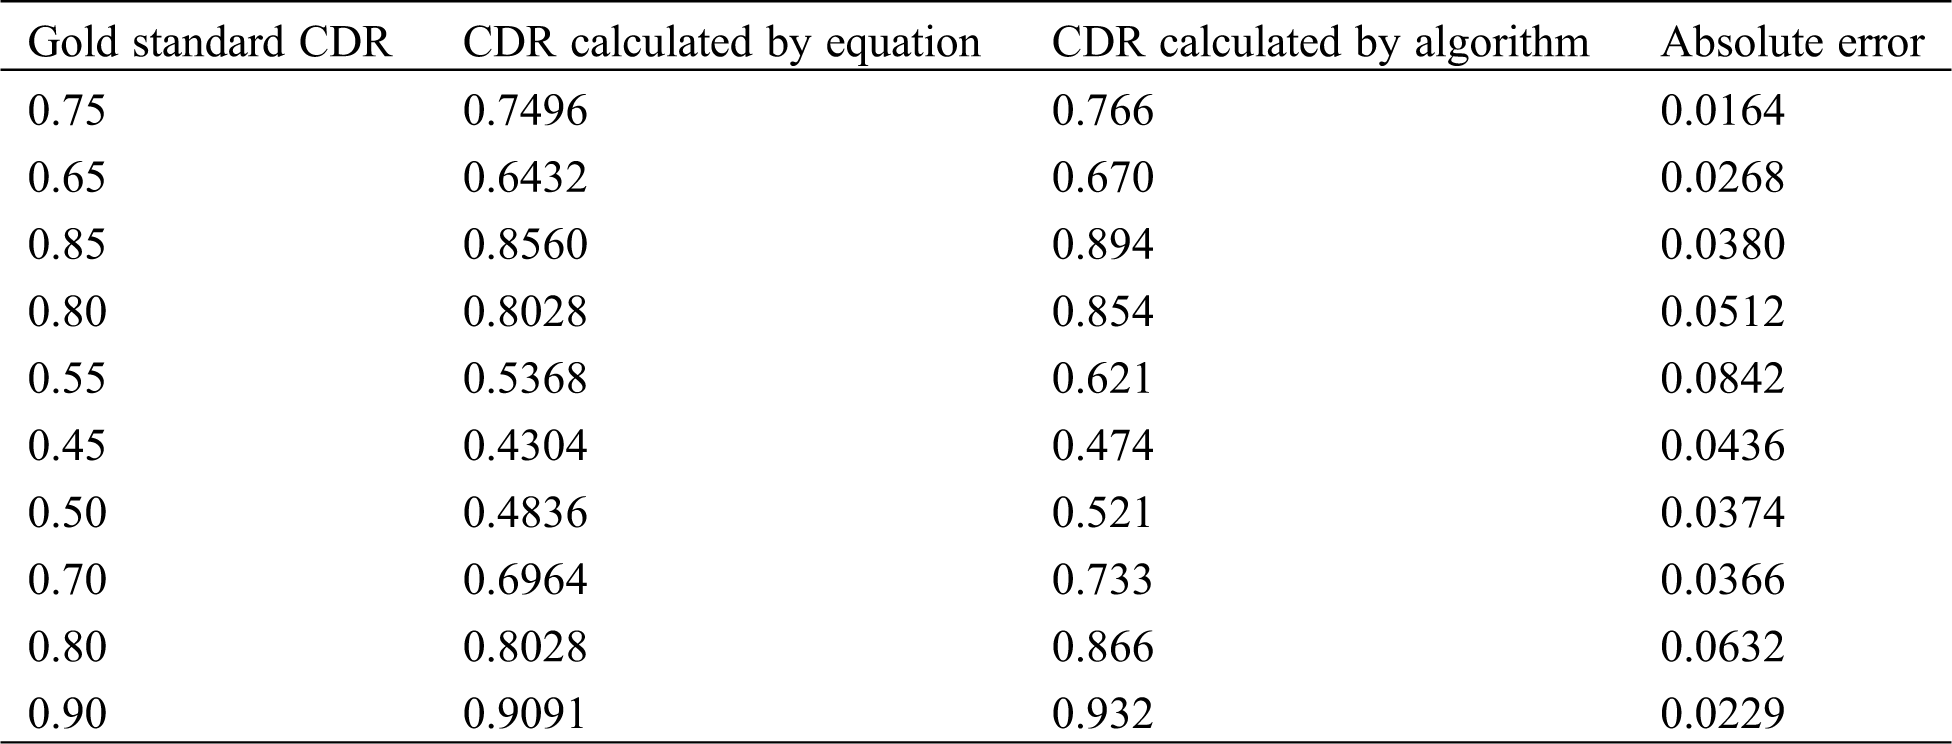
Table 3: Regression analysis of morphological vs. gold standard values of CDR (K-means clustering technique)
3.2.4 Optic Cup Segmentation Using Fuzzy C-means Clustering
In K-means clustering, the detected cup region from actual method gives better results than the elliptical method. The detected optic cup cluster some of them are having small extra regions found due to the overlapped intensity variations in the cup region. Hence this cup region affects the CDR determination. In order to give the best result of segmentation in spite of overlapped intensity variations, the fuzzy C-mean (FCM) method is used. Unlike K-means where data point always belongs to only one cluster, in FCM the data point may belong to more than one cluster as data point is assigned to membership functions. Therefore, to improve the segmentation results, FCM clustering was applied as an improvement over simple K-means clustering technique.
FCM is employed by [13] for automated detection of exudates only. In this work, FCM is applied for optic cup segmentation because the optic cup region is having almost similar pixel characteristics as exudates. FCM clustering is defined as an overlapping clustering algorithm, where each point may belong to two or more clusters with different degrees of membership. The features are having close similarity in images that are grouped within the same cluster. The similarity is defined by the distance between the feature vector and the cluster centers. Euclidean distance is used to measure this distance and data will be associated to an appropriate membership value.
The developed algorithm is tested on 50 normal fundus images and 50 fundus images obtained from glaucoma patients. These images can also be used for the previous K-means clustering algorithm. The CDR values for all these images have been calculated by the developed algorithm. Figs. 5a and 5b shows the segmented and elliptically fitted optic cup and disc for normal and glaucoma conditions, respectively. Figs. 6a, 6b show the segmented that are elliptically fitted optic disc and actual contour of optic cup for the same conditions. In these images, for comparison purpose, the results of K-means clustering and FCM clustering for cup region are shown in the image. White colour contours show the result of FCM technique and green colour contour for K-means technique. The CDR values that are computed by the corresponding algorithm is shown as a part of the result which is segmented as contour the original image shown as similar to gold standard value for comparison.

Figure 5: CDR computation is with elliptical fitting for optic cup and optic disc (FCM method) Green color = K-means clustering White color = FCM clustering CDR-Gold Standard = 0.3 CDR-Gold Standard = 0.6 (a) Normal image (b) Glaucoma condition
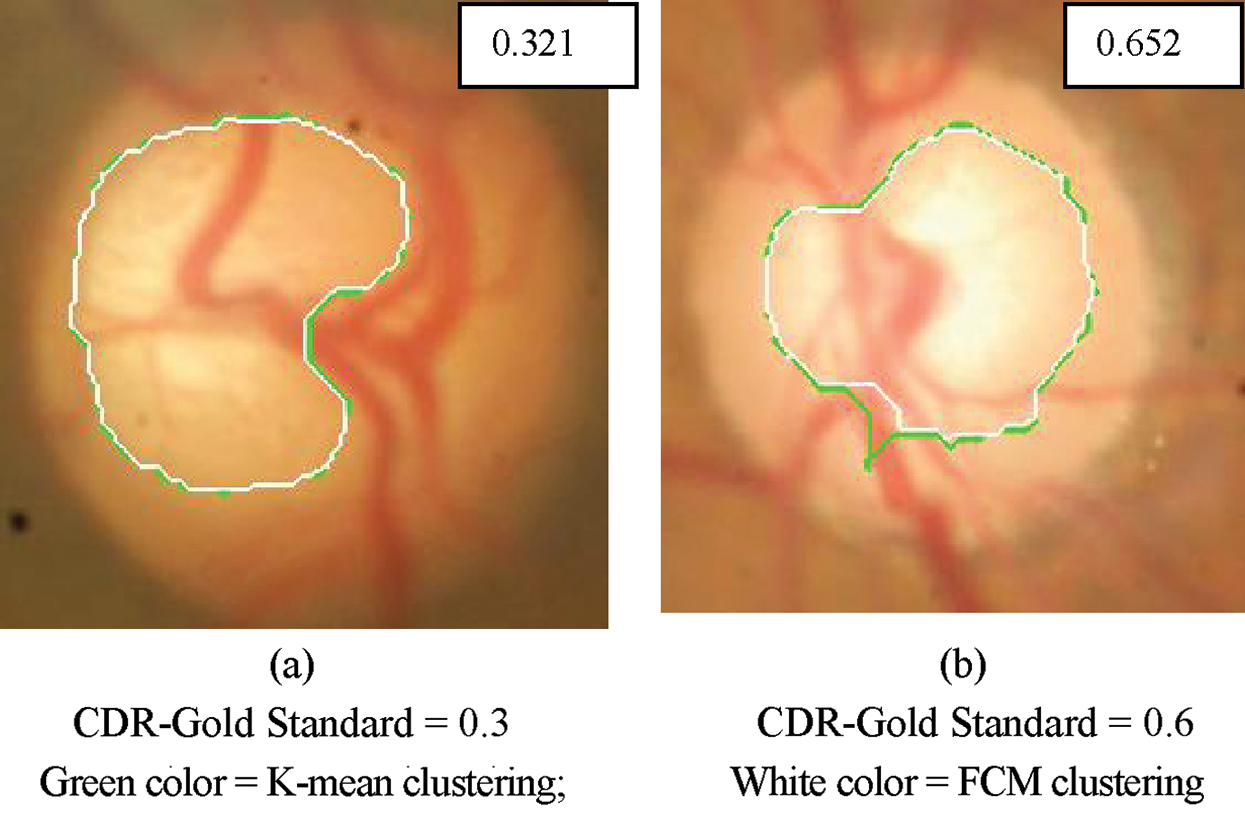
Figure 6: CDR computation is with elliptical optic disc and actual segmented contour for optic cup (FCM method) Green color = K-means clustering; White color = FCM clustering CDR-Gold Standard = 0.3 CDR-Gold Standard = 0.6 (a) Normal image (b) Glaucoma condition
The mean errors for K–means clustering technique have applied for same set of 100 images that are highlighted in the Tab. 4 for comparison. It is inferred that the mean error of CDR for the set of 100 images is reduced in FCM method are compared to K-means clustering technique. This is due to the increase in segmentation accuracy of optic cup region by FCM method.
Table 4: Shows the CDR ranges from mean and mean error of the FCM clustering method. The gold standard value of the CDR for normal images lies between the range of 0.15–0.35 and for the glaucoma images, are from 0.4 to 0.9
To have a concise result, the scatter plot has been used. The scatter plot of computed CDR and gold standard is generated by Minitab statistical software.
Fig. 7 shows the scatter plot of CDR ratio using elliptical method and gold standard.

Figure 7: Scatter plot of elliptical method (FCM method)
Fig. 8 shows the scatter plot of CDR using morphological method and gold standard.
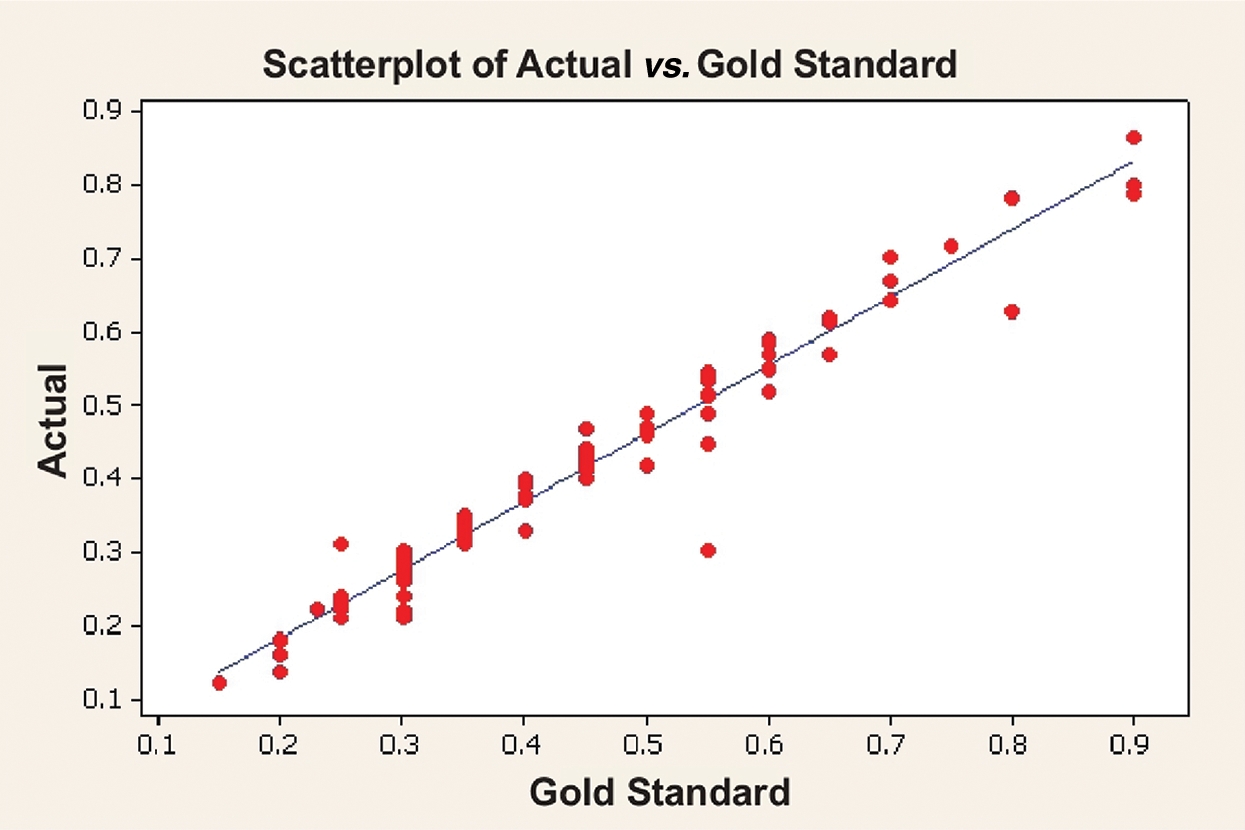
Figure 8: Scatter plot of morphological method (FCM method)
The correlation coefficient for elliptical method is 0.97 and for morphological method is 0.987.
3.2.6 Regression Analysis (FCM Method)
As discussed in the previous method, (3.2.3) regression analysis has been carried over. The same set of ten new images that had been used in the previous K-means clustering method are selected here also and CDR values are obtained by FCM method and are listed in Tab. 5 with elliptical fitting and in Tab. 6 with actual segmented contour for optic cup. The absolute error is the difference in the values in 3rd and 4th column. The mean error of this elliptical method is 2.83% and morphological method is 2.57% whereas for K-means method, the mean errors are 4.2% and 4.1%, respectively. The standard deviation for the regression equation and developed algorithm for the elliptical method are 0.156085 and 0.155146. The standard deviation for the regression equation and developed algorithm for the morphological method are 0.158176 and 0.156366.
Table 5: Regression analysis of elliptical vs. gold standard (FCM method)
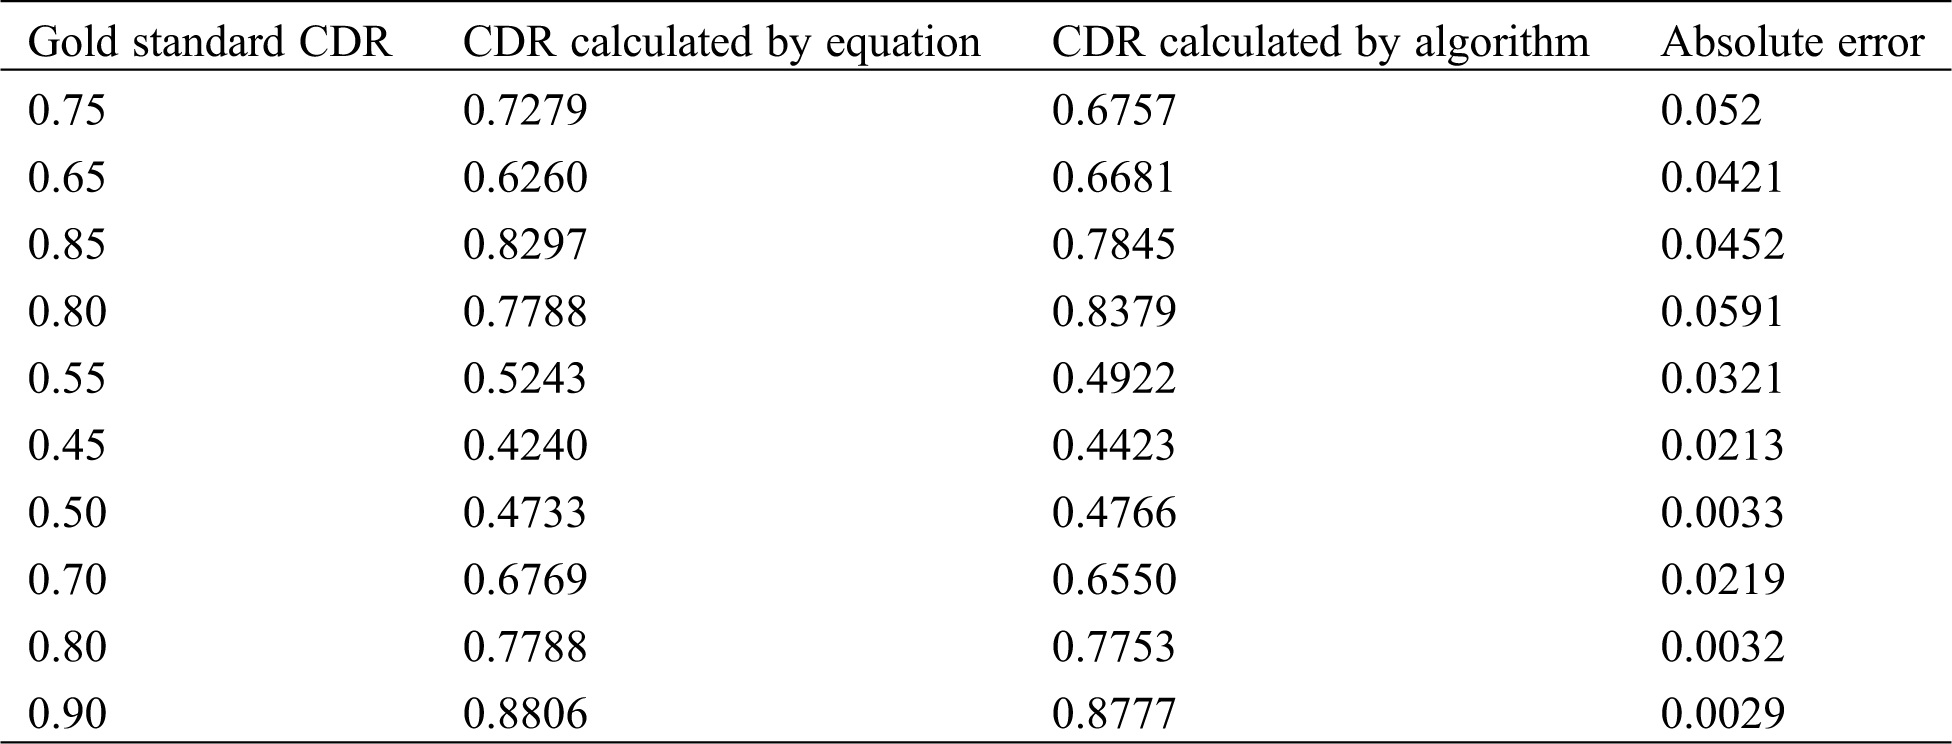
Table 6: Regression analysis of morphological vs. gold standard (FCM method)
Due to more accurate segmentation of optic cup region by FCM method, the mean error of the FCM is less compared to mean error of K-means clustering method. The method for finding optic disc region and region of optic cup has been presented in the work. Result of the proposed method for normal and glaucoma fundus images has been presented and reported. Though the FCM produces less error in the CDR values, the optic cup region from FCM does not show the complete contour and hence the error was seen in CDR. To increase the accuracy, used another algorithm for segmentation of optic disc and optic cup in fundus image is developed.
3.2.7 Optic Cup Segmentation Using Spatially Weighted Fuzzy C-Means Clustering
The standard FCM does not consider the spatial information of pixels this will affect the segmentation result. One of the important characteristics of an image is that neighboring pixels are highly correlated with the spatially weighted fuzzy C-mean (SWFCM) method. The pixels in optic cup and optic disc regions are correlated in their respective regions of fundus image. The optic cup is the excavation of nerve fiber and the neuro retinal rim that is the area between optic cup and disc formed by nerve fiber and glial cells. The contour of the optic disc is the outer contour of neuro retinal rim. Thus, when imaged, pixels in the cup region will be highly correlated among them compared to the above said region namely the neuro retinal rim. In this research, SWFCM is used as a novel method to detect optic cup and disc. This SWFCM method is utilized by the previous researchers [14] for MRI image segmentation. Though the quality of fundus image will not be as good as the MRI image, SWFCM method is adopted as a novel method here for optic cup and disc segmentation by exploiting the inter pixel correlation in the corresponding region.
In SWFCM, to exploit the spatial information, a spatial function is defined as
Uik = Spatial domain in the entire neighborhood around the pixel
where
where p and q are controlling parameters of both functions. The spatial functions simply strengthen the original membership in a homogenous region, but it does not change clustering result. However, this formula reduces the weight of a noisy cluster in noisy pixels by the labels to its neighboring pixels. As a result, misclassified pixels from noisy region or spurious blobs can easily be corrected.
The clustering is a two-pass process at each iteration. The first pass is the same as that in standard FCM to calculate the membership function. In the second pass, the membership information of each pixel is mapped to the spatial domain and the spatial domain function is computed from that. The FCM iteration proceeds with the new membership that is incorporated with spatial function. The iteration is stopped when the maximum difference between two cluster centers at two successive iterations is less than 0.00001. After the convergence, defuzzification is applied to assign each pixel to a specific cluster for which the membership is maximal.
Step 1: Generate the random number with the range from 0 to1 to be the initial memberships. Let us consider the number of clusters is N then calculate Vi using Eq. (7)
where,
Vi = ithcluster center
m = fuzziness parameter m = 2
where
Step 2: Map
Step 3: Update the cluster center using Eq. (5)
Step 4: Repeat Step 6 to Step 8 until the following termination criterion is satisfied:
where
The proposed SWFCM method is tested on 50 normal fundus images and 50 fundus images obtained from glaucoma patients. The results of elliptical and morphological methods are used to calculate the CDR values for these images. This was shown in Figs. 9a and 9b elicit the results by using elliptical method for both normal and abnormal subjects. Figs. 10a and 10b elicit the results by the proposed morphological method for both normal and abnormal subjects.

Figure 9: CDR computation with elliptical fitting for optic cup and optic disc (SWFCM method) (a) Normal (b) Glaucoma

Figure 10: CDR computation with elliptical optic disc and actual segmented contour for optic cup (SWFCM method) (a) Normal (b) Glaucoma
Tab. 7 indicates the statistical analysis of SWFCM clustering algorithm. The method is applied on the same image set used for the K-means clustering and FCM method.
Table 7: Statistical analysis of SWFCM clustering
The result from Tab. 7 is compared with same set images with FCM clustering. The accuracy is much improved in SWFCM algorithm because the cup region is exactly detected by taking the pixel correlation into consideration.
The scatter plot has been used to analysis a result Fig. 11 illustrates the scatter plot of CDR using elliptical method and gold standard based on the SWFCM clustering and Fig. 12 illustrates the same for morphological method [15]. The Eq. (11), (12) indicates regression analysis for elliptical and morphological methods
The correlation coefficient for morphological method is 0.980.

Figure 11: Scatter plot of elliptical method (SWFCM method)

Figure 12: Scatter plot of morphological method (SWFCM method)
When the scatter plots of SWFCM (Figs. 11 and 12) are compared with that of FCM method (Figs. 7 and 8), it is inferred that the points marked in the scatter plot of SWFCM methods are much closer to the regression line than the FCM method. This indicates that the error in CDR value in the newly proposed SWFCM method is less compared to the FCM or K-means method.
3.2.8 Regression Analysis (SWFCM Method)
It is inferred from Eqs. (5) and (6) that the mean error is very less, and correlation coefficient is improved in morphological method. These mean errors occur due to the segmentation method is more efficient.
As discussed in FCM method, Section 3.2.6 here also the analysis has been carried over on ten new images which are the same used in FCM regression analysis and the results are shown in Tabs. 8 and 9. Tabs. 8 and 9 show the regression analysis of elliptical and morphological CDR values, respectively. The mean error of this elliptical method is 3.4% and morphological method is 2.3%.
Table 8: Regression analysis of elliptical method (SWFCM method)
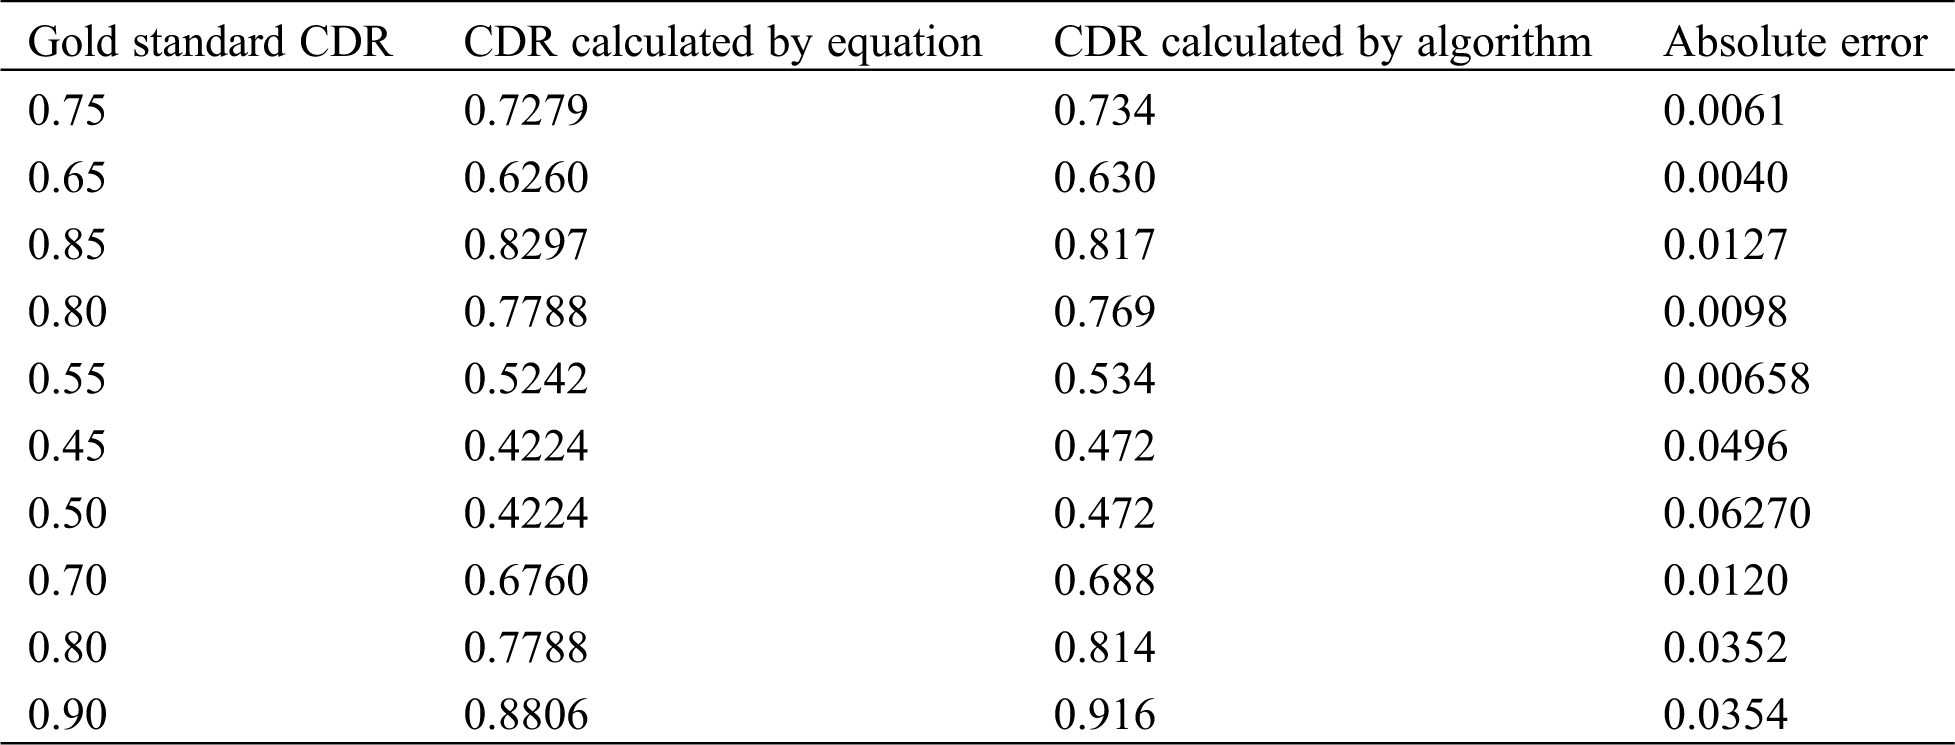
Table 9: Regression analysis of morphological method (SWFCM method)
Tab. 10 shows the comparison between K-means, FCM and SWFCM output with different parameters. From this result, The SWFCM mean error is lesser than FCM and K-means output. The mean error of CDR for K-means clustering, FCM and SWFCM methods have been computed by considering the gold standard value which is quantized to step of 0.05. If this fact is also taken into consideration, the error will be less than the computed values. Both optic disc and optic cup are detected in one stage from the SWFCM method, so computational time and accuracy are improved. Hence, for further analysis with CDR, both optic cup and disc is segmented applying SWFCM algorithm. Fig. 13 shows the performance analysis of proposed work. The diagram shows that comparison between K-means FCM and SWFCM of Mean error of Elliptical method and morphological method. From the analysis FCM method slightly decrease the error rate compared with K-means but dramatically improve the error rate in SWFCM compared with K-means and FCM techniques.
Table 10: Comparison between FCM and SWFCM results
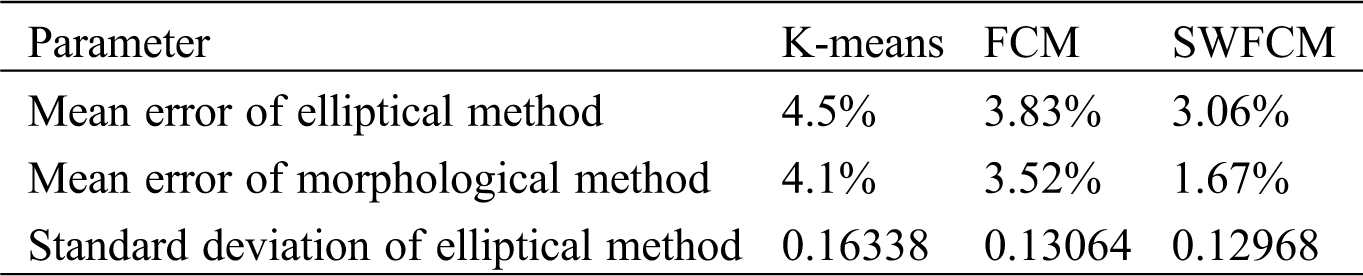
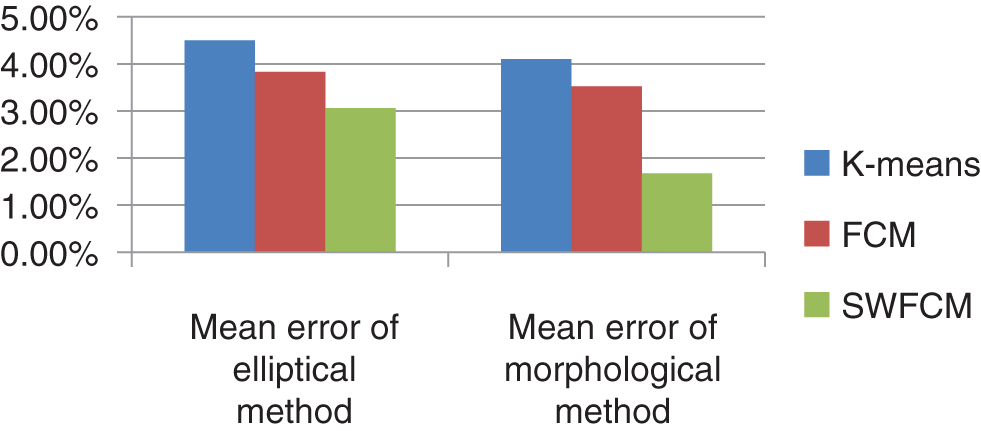
Figure 13: Comparison between K-means, FCM and SWFCM results
Due to more accurate segmentation of optic cup region by FCM method, the mean error of FCM is less compared to the mean error of K-means clustering method. A method for detecting the optic disc region and region of optic cup has been presented here. Though the FCM produces less error in the CDR values, the optic cup region does not show the complete contour in FCM clustering (Fig. 14) and hence error is seen in the CDR. To increase the accuracy, another algorithm (SWFCM) for segmentation of optic disc and optic cup in fundus image is developed.

Figure 14: Segmented optic cup (FCM method)
The SWFCM is applied to the images in which blood vessels are already blurred. The neighboring pixels are highly correlated in SWFCM clustering. The standard FCM spatial relationship is not utilized but it is important in clustering. The drawback of FCM, the detection of optic cup region does not show the complete contour. To overcome the drawback, SWFCM is considered. The Fig. 15 shows SWFCM clustering output. The segmented image has three clusters, namely the inner cluster representing the cup, the adjacent cluster representing the disc, and outer cluster representing the background. The optic disc and cup clusters are to be separated from the clustered image to determine the cup to disc ratio.

Figure 15: SWFCM output
In this chapter, detection of optic disc, optic cup, neuro-retinal rim and blood vessels from fundus images are discussed. Two methods are used for segmentation of optic disc and cup. In the first method, K-means clustering is used for optic disc by defining value manually. Then the method is modified by computing K-value automatically by hill climbing technique and optic disc is segmented. Since the segmentation is not yielding the correct result, FCM clustering is used for optic cup. As the standard K-means and FCM does not consider the spatial information, the segmentation result is affected. In order to account the spatial information, SWFCM is used for both optic disc and optic cup segmentation. The results show that the performance of SWFCM based glaucoma detection method is better than the other two methods. In future fast detection of Glaucoma and to reduce the false rate, images of segmented optic disc and cup is applied to convolutional neural network in deep learning classifier.
Acknowledgement: The authors wish to thank Doctor Rengaraj Venkatesh, M.D., Professor of the Aravind Eye Hospital & Post Graduate Institute of Ophthalmology, Pondicherry, India for providing the expert analysis of the fundus data.
Funding Statement: The author(s) received no specific funding for this study.
Conflicts of Interest: The authors declare that they have no conflicts of interest to report regarding the present study.
1. Song, X., Song, K., Chen, Y. (2005). A computer-based diagnosis system for early Glaucoma screening. Proceedings of the IEEE conference on Engineering in Medicine and Biology, pp. 6608–6611. [Google Scholar]
2. George, R., Vijaya, L. (2008). First World Glaucoma day, March 6, 2008: Tackling glaucoma challenges in India. Indian Journal of Ophthalmology, 56(2), 97–98. DOI 10.4103/0301-4738.39111. [Google Scholar] [CrossRef]
3. Chen, X., Xu, Y., Wong, D. W. K., Wong, T. Y., Liu, J. (2015). Glaucoma Detection based on Deep Convolutional Neural Network. 37th Annual International Conference of the IEEE Engineering in Medicine and Biology Society, IEEE, pp. 715–718. [Google Scholar]
4. Nawaldgi, S. (2016). Review of automated glaucoma detection techniques. IEEE International Conference on Wireless Communications Signal Processing and Networking, pp. 1435–1438. [Google Scholar]
5. Lotankar, M., Noronha, K., Koti, J. (2015). Detection of optic disc and cup from color retinal images for automated diagnosis of Glaucoma. IEEE UP Section Conference on Electrical Computer and Electronics, pp. 1–6. [Google Scholar]
6. Chakravarty, A., Sivaswamy, J. (2016). Glaucoma classification with a fusion of segmentation and image-based features. IEEE 13th International Symposium on Biomedical Imaging, pp. 689–692. [Google Scholar]
7. Diaz-pinto, A., Morales, S., Naranjo, V., Kohler, T., Mossi, T. M. et al. (2019). CNNs for automatic glaucoma assessment using fundus images: an extensive validation. Biomedical Engineering Online, 18(1), 253. DOI 10.1186/s12938-019-0649-y. [Google Scholar] [CrossRef]
8. Abbas, Q. (2017). Glaucoma-deep: detection of Glaucoma eye disease on retinal fundus images using deep learning. International Journal of Advanced Computer Science and Applications, 8(6), 41–45. [Google Scholar]
9. Walter, T., Klein, J. C. (2005). Automatic analysis of color fundus photographs and its application to the diagnosis of diabetic retinopathy. Handbook of Biomedical Image Analysis, 2, 315–368. [Google Scholar]
10. Ohashi, T., Aghbari, Z., Makinouchi, A. (2003). Fast segmentation of texture image regions based on hill-climbing. IEEE Explorer, 2, 848–851. DOI 10.1109/PACRIM.2003.1235914. [Google Scholar] [CrossRef]
11. Ohashi, T., Aghbari, Z., Makinouchi, A. (2003). Hill-climbing algorithm for efficient color-based image segmentation. IASTED International Conference On Signal Processing, Pattern Recognition, and Applications, pp. 17–22. [Google Scholar]
12. GaneshBabu, T. R., Devi, S. (2011). Automatic detection of glaucoma using Fundus image. European Journal of Scientific Research, 59(1), 22–32. [Google Scholar]
13. Sopharak, A., Uyyanonvara, B., Barman, S. (2009). Automatic exudate detection from non-dilated diabetic retinopathy retinal images using fuzzy C-means clustering. Sensors (Basel), 9(3), 2148–2161. DOI 10.3390/s90302148. [Google Scholar] [CrossRef]
14. Chuang, K. S., Tzeng, H. L., Chen, S., Wu, J., Chen, T. J. (2006). Fuzzy C-means clustering with spatial information for image segmentation. Journal of Computerized Medical Imaging and Graphics, 30(1), 9–15. DOI 10.1016/j.compmedimag.2005.10.001. [Google Scholar] [CrossRef]
15. GaneshBabu, T. R., Sathishkumar, R., Venkatesh, R. (2014). Segmentation of Optic Nerve Head for Glaucoma Detection using Fundus images. Biomedical & Pharmacology Journal, 7(1), 1–8. DOI 10.13005/bpj/445. [Google Scholar] [CrossRef]
 | This work is licensed under a Creative Commons Attribution 4.0 International License, which permits unrestricted use, distribution, and reproduction in any medium, provided the original work is properly cited. |