Biomechanics
| Molecular & Cellular Biomechanics |
DOI: 10.32604/mcb.2021.015453
ARTICLE
The Differences in Lower Extremity Joints Energy Dissipation Strategy during Landing between Athletes with Symptomatic Patellar Tendinopathy (PT) and without Patellar Tendinopathy (UPT)
1Faculty of Sports Science, Ningbo University, Ningbo, 315211, China
2Savaria Institute of Technology, Faculty of Informatics, Eötvös Loránd University, Szombathely, 9700, Hungary
3School of Health and Life Sciences, University of the West of Scotland, Scotland, G72 0LH, UK
*Corresponding Author: Yaodong Gu. Email: guyaodong@nbu.edu.cn
Received: 19 December 2020; Accepted: 25 February 2021
Abstract: Patellar tendinopathy is a clinical symptom of patellar tendons characterized by local pain in the front of the knee joint. It is common among basketball and volleyball players. Patients with patellar tendinopathy may exhibit different landing strategies during landing compared to healthy individuals. The purpose of this study was to compare the differences in lower limb joint energy dissipation (eccentric work) values for the symptomatic patellar tendinopathy (PT) athletes and no patellar tendinopathy (UPT) athletes during single-leg landing. A total of 26 (PT: 13, UPT:13) semi-professional male basketball and volleyball player’s kinetic data were collected during the landing phases. Joint work was calculated by the integral of joint power over time. In this study, the result showed that the ankle joint means energy dissipation (p < 0.001) and total energy dissipation (p < 0.001) of PT were significantly greater than UPT. Compared to the UPT athletes, the PT athletes showed smaller knee joint mean energy dissipation (p = 0.002) and contribution to total energy dissipation (p < 0.001) during the landing stance. Meanwhile, there were no differences in hip joint contribution to total energy dissipation (p = 0.523) and lower limb total energy dissipation (p = 0.127). A deeper understanding of each joint’s energy dissipation contribution ratio between UPT and PT during landing can provide clues that reveal the biomechanical mechanism of PT athletes landing. Further study should choose a larger sample size to more comprehensively reveal the energy dissipation strategy of PT during landing.
Keywords: Athletic injury; patellar tendinopathy; landing task; joint eccentric work; energy dissipation strategy
Participating in various sports requires athletes to perform various landing maneuvers, and landing-related injuries are common in these sports such as volleyball, basketball and gymnastics [1–3]. Most exercise-related injuries are caused by overuse of the musculoskeletal system [4,5]. In overuse injuries, the patellar tendon may be damaged by repetitive loads placed on the knee during landing activities [6–8]. Patellar Tendinopathy, also known as jumper’s knee, is a clinical symptom of patellar tendons characterized by local pain in the front of the knee joint [9]. The symptom described includes 1) Anterior knee pain located at the inferior and lower pole of the patella [10,11]; 2) Tendon pain triggered by an abnormality of the superior patellar tendon [11]; 3) A history of pain associated with the activity (Victorian Institute of Sport Assessment Questionnaire, Patellar Tendon (VISA-P) score < 80) [12]. This damage often occurs during repeated jumps landing and rapid change of direction in motion [13]. While Patellar Tendinopathy can reduce athletic ability and performance, which can cause disability and premature termination of a professional career; current data have shown that the risk of Patellar Tendinopathy among basketball and volleyball players continues to increase [14–16]. Therefore, it is essential to understand better the risk factors associated with Patellar Tendinopathy during landing and take some precautions against it.
For the exact pathogenesis of Patellar Tendinopathy, it is widely believed that it is caused by the interaction of many internal and external risk factors [9,13]. Excessive load on the knee tendons is considered the primary cause of clinical Patellar Tendinopathy [17]. Landing mechanics in dynamic missions is also thought to be a key factor associated with Patellar Tendinopathy [18]. Previous studies have shown that the biomechanics of symptomatic Patellar Tendinopathy change during landing [19–22]. Individuals with Patellar Tendinopathy have less range of motion of the hip and knee, and peak ankle dorsiflexion during the landing phase, there are considered risk factors for re-injury [23–26]. At the same time, previous studies have shown that individuals with Patellar Tendinopathy exhibit a higher peak knee extension moment and a lower load rate of vertical ground reaction force during landing [27]. The biomechanical differences shown by individuals with Patellar Tendinopathy during landing appear to be a self-protective mechanism to avoid further damage. Individuals with Patellar Tendinopathy also showed greater lower limb eccentric work and knee peak power during landing [27]. The accelerated kinetic energy during downward landing is dissipated through the combination of eccentric muscle contraction and skeletal structure, and the lower limb eccentric work is related to musculoskeletal load [28]. Therefore, it is important to understand the load impact and energy dissipation of lower limb joints during each landing mode.
The stress process of the lower extremity results from different injury patterns. The interaction between the foot and the ground plays an essential role in the musculoskeletal system’s load [29]. During landing, the lower extremity undergoes a pattern of distal to proximal loading, in which the feet and ankles are first under load, followed by the knees and hips. Previous studies have shown that most patients with symptomatic patellar tendinopathy present with symptoms in the dominant leg, which is the result of overuse [12,15,16]. Therefore, single-leg (leg with patellar tendinopathy) landing may reveal the landing mechanism better. It should be noted that most energy shocks are dissipated in the lower extremities, and the coordinated energy dissipation of the hip, knee, and ankle joints through the joint muscles helps to absorb shock and reduce injury [30]. Especially in the sagittal plane, the eccentric work done by lower limb joints during landing is mainly concentrated in the sagittal plane [27,28]. Although previous studies have shown that lower limb joints’ eccentricity was different among individuals with Patellar Tendinopathy during landing [30,31], the total contribution ratio of each joint’s eccentricity work is still unknown. A deeper understanding of each lower limb joint’s eccentricity work ratio during landing could provide clues for exploring the Patellar Tendinopathy landing mode mechanism.
There is a lack of understanding of the lower limb joint energy dissipation strategy during landing between athletes with symptomatic patellar tendinopathy (PT) and without patellar tendinopathy (UPT). Therefore, the purpose of this study was to compare and analyze lower limb sagittal joint work values during landing between PT and UPT and to determine the relative contribution of the eccentric work done by each joint to the load attenuation. We hypothesized that PT athletes would show significantly smaller lower limb joint work values and knee joint work values and contributions to load attenuation than UPT and that PT would have significantly greater ankle and hip joint work values and contributions to load attenuation than UPT.
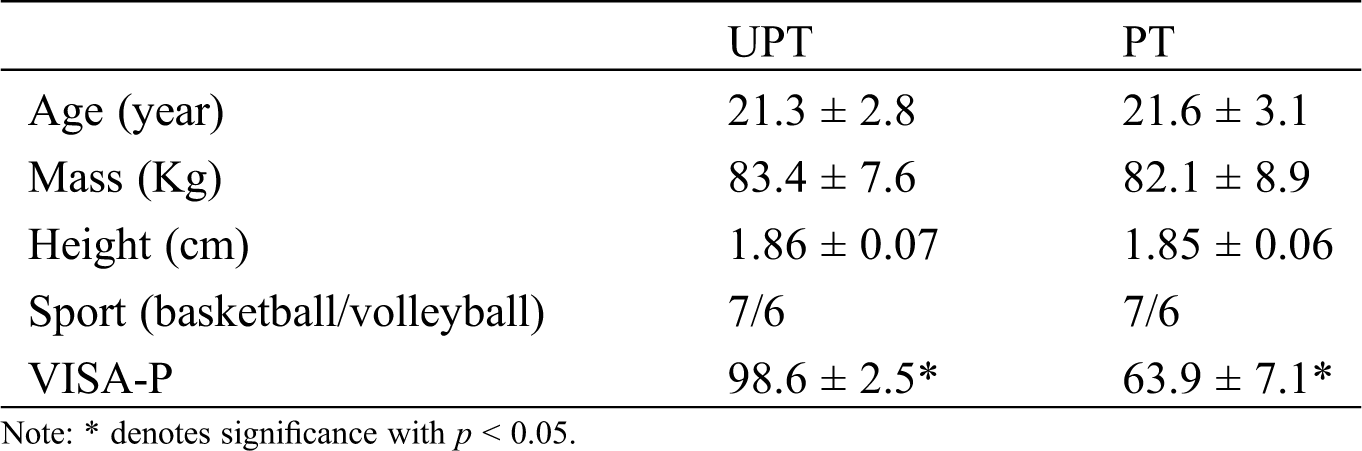
Twenty-six semi-professional male basketball and volleyball players from the local university were recruited to participate in this experiment. According to previous studies, semi-professional athletes were defined as those performing at national or international level and receiving some remuneration as part of their sport participation [32]. Thirteen (basketball player: seven, volleyball player: six) subjects had PT, and the other thirteen subjects UPT. For PT, recruitment requirements included: 1) the presence of anterior knee pain located at the inferior and lower pole of the patella [10,11]; 2) a diagnosis of an abnormality of the superior patellar tendon [11]; 3) the presence of patellar tendon pain during practice landing sessions but not enough to restrict or affect level of performance [28]; 4) A history of pain associated with the activity (Victorian Institute of Sport Assessment Questionnaire, Patellar Tendon (VISA-P) score < 80) [12]; They had no other lower limb injuries except patellar tendinopathy in the six months before the trial. All of them had patellar tendinopathy in their dominant leg, and the dominant leg was defined as the leg that is more suitable for kicking the ball [33]. For UPT, they also did not have any lower extremity injuries in the six months before the trial. All athletes with UPT were anthropometrically matched with athletes with PT. The basic information of subjects is shown in Tab. 1. Prior to the experiment, subjects were informed of the purposes, requirements, process and other details of the experiment and signed an informed consent approved by the Human Ethics Committee of Ningbo University.
Table 1: Means ± standard deviations for the anthropometric parameters between UPT and PT. Subjects had similar anthropometric parameters, except PT athletes had a significantly smaller VISA-P score
2.2 Experimental Protocol and Procedures
The whole experiment was conducted in the biomechanics laboratory of Ningbo University. All subjects’ mass and weight were measured with a calibrated scale and stadiometer prior to the formal experiment. An eight infrared cameras Vicon motion capture system (200 Hz, Oxford Metric Ltd., Oxford, UK) was used to capture the three-dimensional motion trajectory data. A floor-embedded force plate (AMTI, Watertown, MA, USA) was used to collect ground reaction force data with a sampling frequency of 1000 Hz. The data of kinematics and ground reaction force were synchronously collected through Vicon Nexus software. As shown in Fig. 1A, thirty-six standard reflective marker (marker diameter: 12.5 mm) was pasted to the bilateral lower limbs and pelvis to define axes of rotation and track the motion trajectory based on the previous study [34]. The reflective markers locations included anterior superior iliac spine, posterior superior iliac spine, medial condyle and malleolus, lateral condyle and malleolus, first metatarsal heads, distal interphalangeal joint of the second toe, fifth metatarsal heads, and a total of 6 tracking clusters was pasted to the middle of the lateral thigh, shank and heel.
Prior to the formal experiment, participants were required to wear uniform tights, leggings and shoes, and then complete a 10 min warm-up session that involved familiarizing themselves with the drop landing task. The practice drop landing warm up sessions within the experimental environment allowed the participants familiarize themselves with the test movements. A 40 cm high platform was placed in front of the force plate, surrounded by eight infrared cameras. After the warming up was completed, the participants were asked to stand on the platform and then perform drop landing task with a single-leg by stepping off the 40 cm platform (Fig. 1B) [34]. The subjects were asked to use their dominant leg to land on the force plate (For PT, all of them had patellar tendinopathy in their dominant leg). A successful trial was defined when the participant was able to step off the platform with arms crossed in front of their chest and then hold the balance on their dominant legs for at least 2 s after landing. All participants were allowed a 30 s rest between each landing protocol. A total of 5 successful landing datasets were collected.
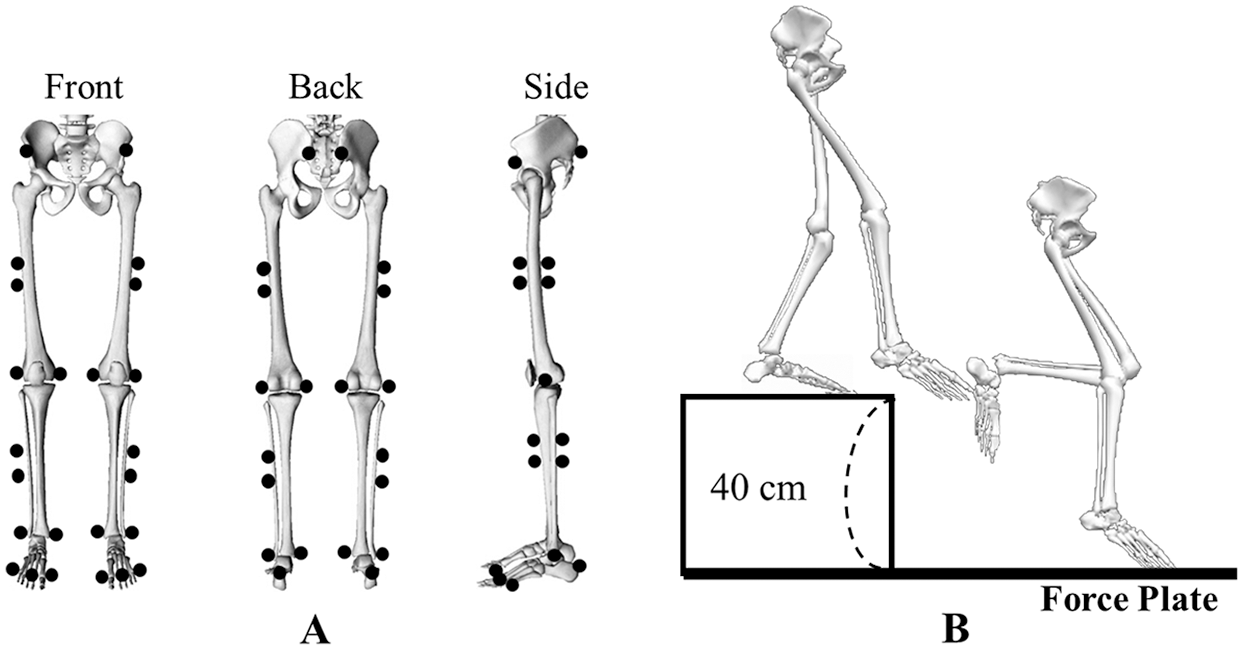
Figure 1: The reflective markers placement (front view, back view and side view) following anatomical bony landmarks; B: A diagrammatic tasks description of the process involved in performing a single-leg drop landing maneuver by stepping off a 40 cm platform with the dominant leg and landing onto the center of the force plate
2.3 Data Collection and Processing
When the vertical ground reaction force (VGRF) of the force plate exceeds 10N, it is set as the initial contact point [35]. A total of 5 s data were collected, which were 2 s before initial contact and three seconds after initial contact. Based on the analysis of filtering frequency selection by Winter, residual analysis of kinetics and kinematics data was implemented in the subsets to confirm the most suitable signal-to-noise ratio [36]. Finally, kinetics and kinematics data are filtered by 20 and 10 Hz Butterworth low-pass filters (fourth-order zero-phase lag). The kinematics and kinetics data were calculated through an inverse kinetics algorithm conducted by the software of Visual 3D (C-Motion Inc., Germantown, MD, USA).
The landing period was defined as the initial contact point to peak knee flexion. The positive (negative) sagittal plane was defined as ankle dorsiflexion (plantarflexion), knee and hip flexion (extension). Joint power was calculated by the product of the joint moment and joint angular velocity. Joint work was calculated by the integral of joint power over time, and negative (eccentric) work indicated the energy dissipation of the joint muscle [28]. The individual joint work contribution to the total energy dissipation was calculated as the percentage of the joint energy dissipation in the total energy dissipation of the ankle, knee, and hip joints of the lower extremity joints. The joint moment, joint power and energy dissipation were standardized to body mass. Data were then imported into MATLAB R2019a (The MathWorks, MA, USA) and the written script was used to process the data further. At the same time, all the data were calculated using MATLAB scripts.
All data were tested by the Shapiro-Wilk normality test before statistical analysis. If the data were not normally distributed, the Wilcoxon matched-pairs signed-rank test was performed for non-parametric data. For mean energy dissipation, peak joint power and other discrete variable analysis, the Independent-samples T-test were used by WindowsTM software of SPSS 24.0 (SPSSs, Inc., Chicago, IL, USA). Because of the one-dimensional character of joint power varying with time, the data points were extended to 101 data points time series curves (expressing the landing phase of 0%–100%) with the MATLAB script. Then the open-source statistical parametric mapping of one-dimensional (SPM 1d) script of independent-samples T-test was used for the statistical analysis [37]. All significance threshold was set at p = 0.05.
The athletes of PT and UPT had similar lower limb total energy dissipation (Tab. 2). The statistical analysis revealed that there were no differences in lower limb total energy dissipation (p = 0.127; UPT: −3.10 ± 0.26 J/kg; PT: −2.90 ± 0.39 J/kg). However, the contribution of lower limb joints to total energy dissipation was statistically different (p < 0.05). The results of lower extremity energy dissipation distribution and relative contribution to total negative work are shown in Figs. 2 and 3. For the ankle, UPT depicted significantly smaller mean energy dissipation (p < 0.001; UPT: −0.82 ± 0.14 J/kg; PT: −0.97 ± 0.13 J/kg) and significantly smaller contribution to total energy dissipation (p < 0.001; UPT: 26.43% ± 4.64%; PT: 33.38% ± 4.57%) than PT. For the knee, UPT depicted significantly greater mean energy dissipation (p = 0.002; UPT: −1.57 ± 0.40 J/kg; PT: −1.22 ± 0.19 J/kg) and significantly greater contribution to total energy dissipation (p < 0.001; UPT: 50.71% ± 12.78%; PT: 42.20% ± 6.69%) than PT. The statistical analysis revealed that there were no significant in hip mean energy dissipation (p = 0.968; UPT: −0.72 ± 0.10 J/kg; PT: −0.71 ± 0.13 J/kg) and contribution to total energy dissipation (p = 0.523; UPT: 23.19% ± 3.45%; PT: 24.41% ± 4.26%).
Table 2: Means ± standard deviations for the peak joint angle, peak joint power, peak joint moment, the mean energy dissipation (eccentric joint work) and the percentage contribution to total energy dissipation of ankle knee and hip joints, and total energy dissipation of lower extremity between UPT and PT
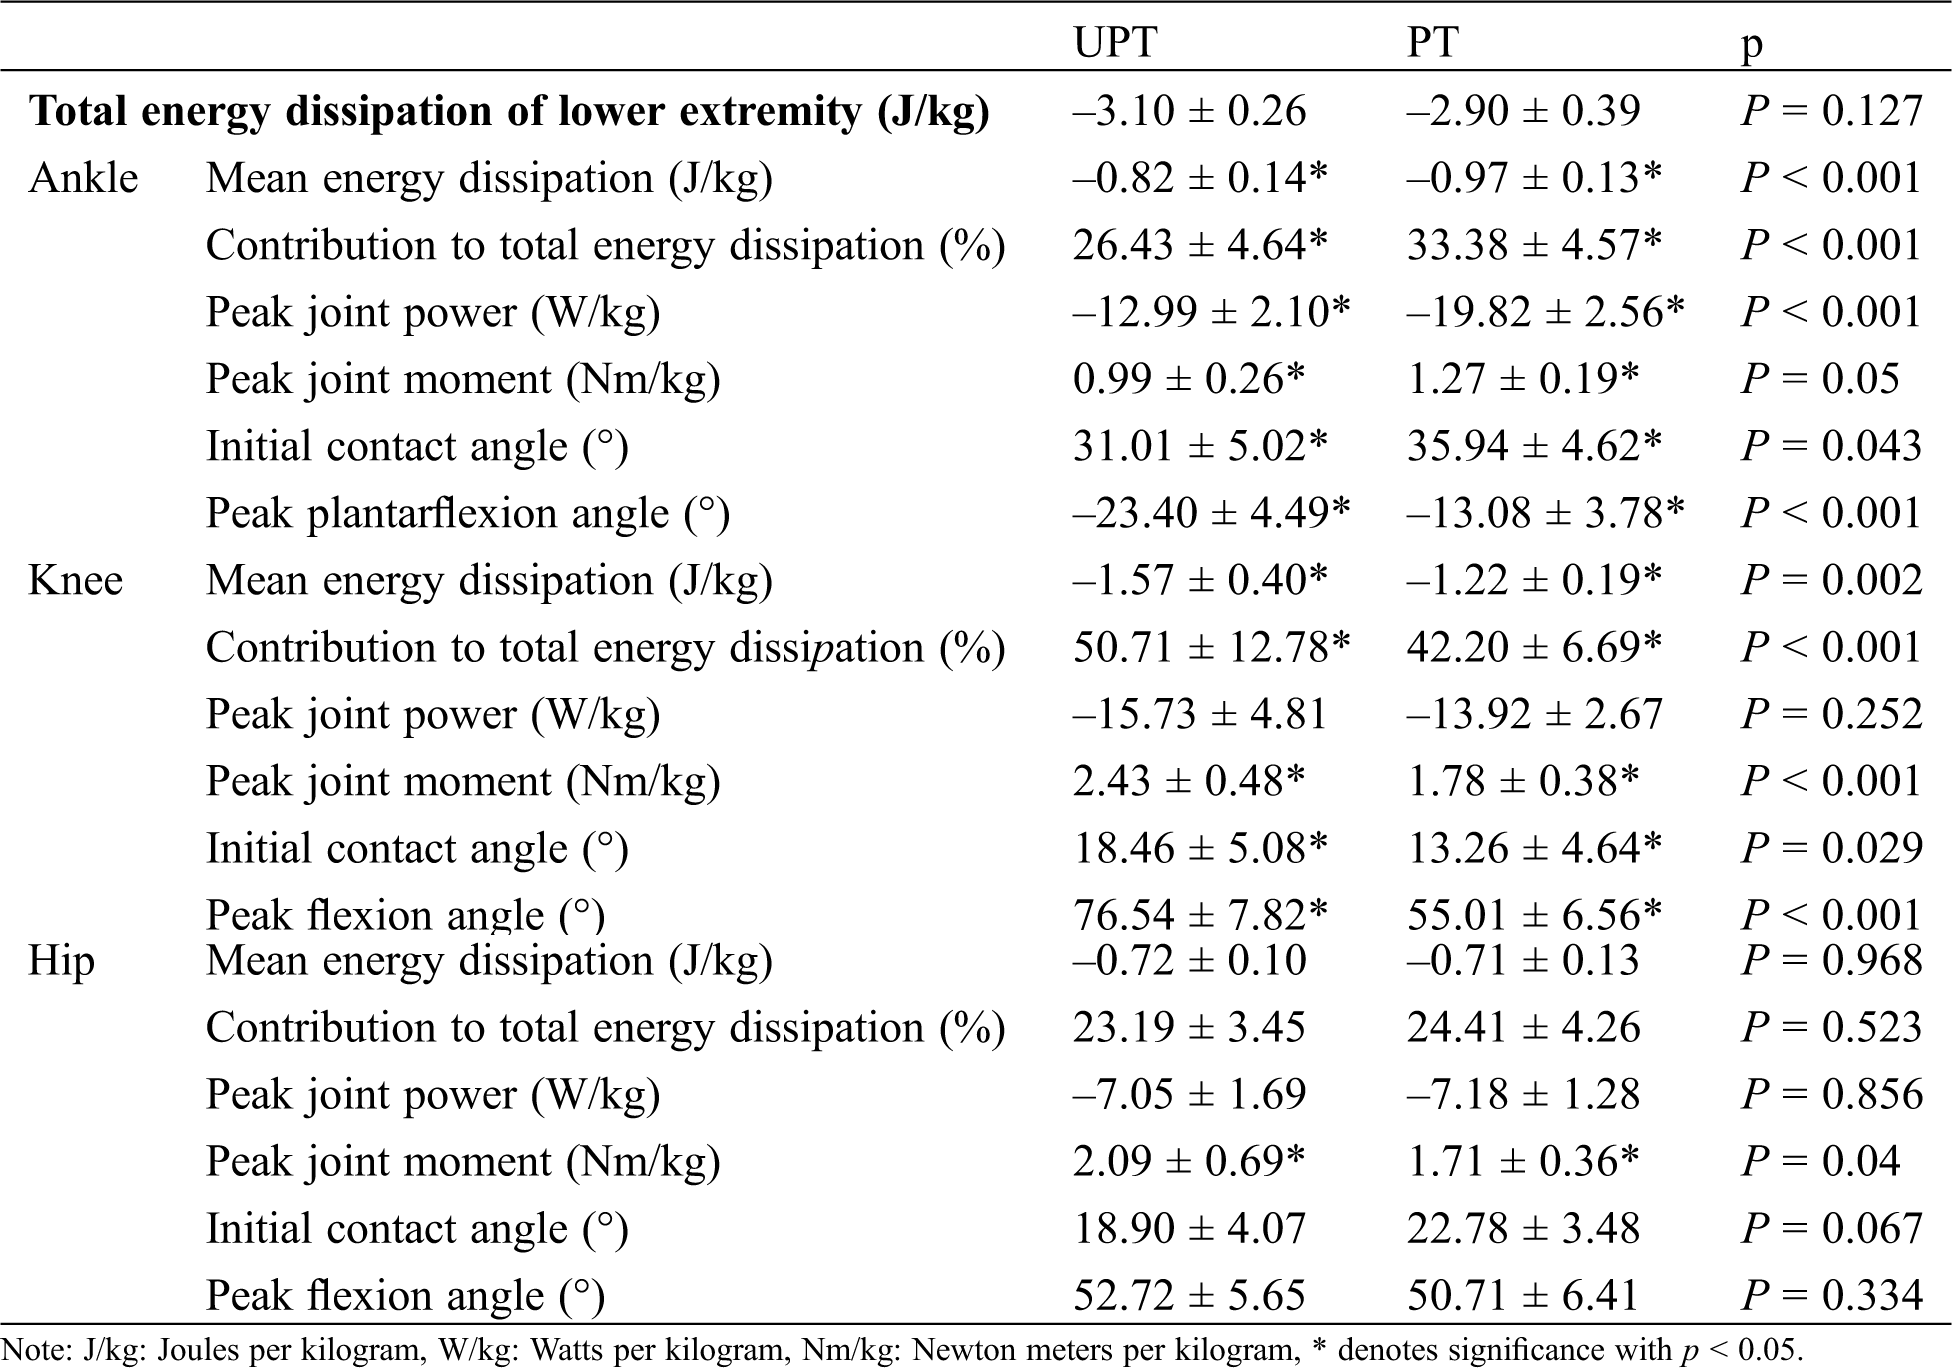
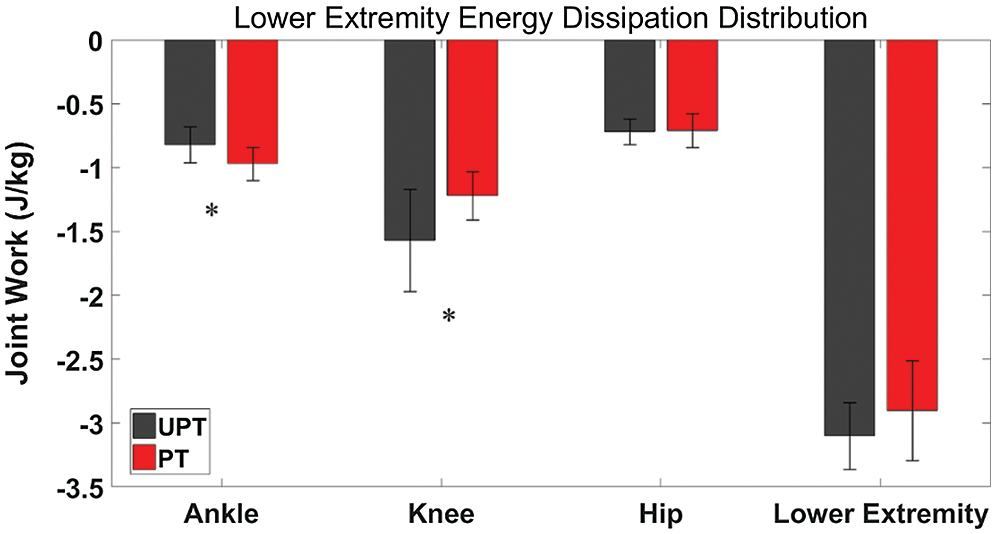
Figure 2: Comparison of lower extremity energy dissipation distribution in the ankle, knee and hip between UPT (dark black) and PT (dark red) during landing. * refer to the significant difference between UPT and PT (p < 0.05)
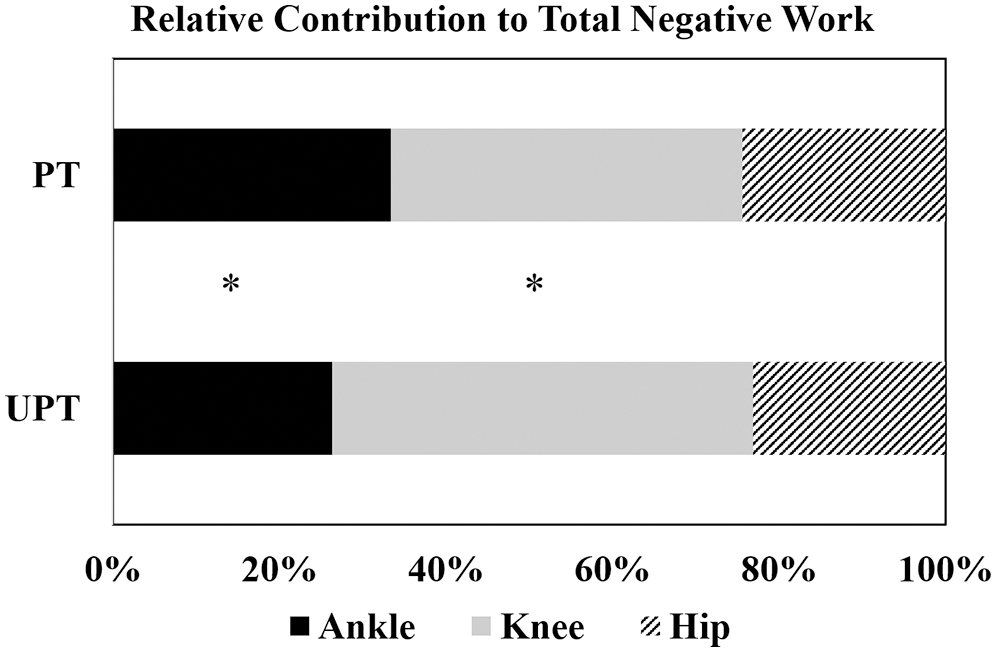
Figure 3: Comparison of mean relative contribution joints work value in the ankle (dark black), knee (light grey) and hip (diagonal) between UPT and PT during landing. * refer to the significant difference between joints (p < 0.05)
For the peak ankle knee and hip angle during the landing phase (Tab. 2), UPT depicted a significantly greater peak plantarflexion angle (p < 0.001) and greater peak knee flexion angle (p < 0.001) than PT. The results of peak joint power and peak joint moment are shown in Fig. 4. For the ankle, UPT depicted significantly smaller peak joint power (p < 0.001) and a smaller peak joint moment (p = 0.05) than PT. For the knee, UPT depicted a significantly greater peak joint moment (p < 0.001) than PT, but there were no significant in peak joint power (p = 0.252). UPT depicted a significantly greater peak joint moment (p = 0.04) for the hip, but there were no significant in peak joint power (p = 0.856). As shown in Fig. 5, the SPM analysis revealed that UPT depicted a significantly smaller ankle joint power during the 10.90%–20.06% (p < 0.001) landing phase and a significantly greater knee joint power during the 30.54%–47.64% (p < 0.001) landing phase than PT.
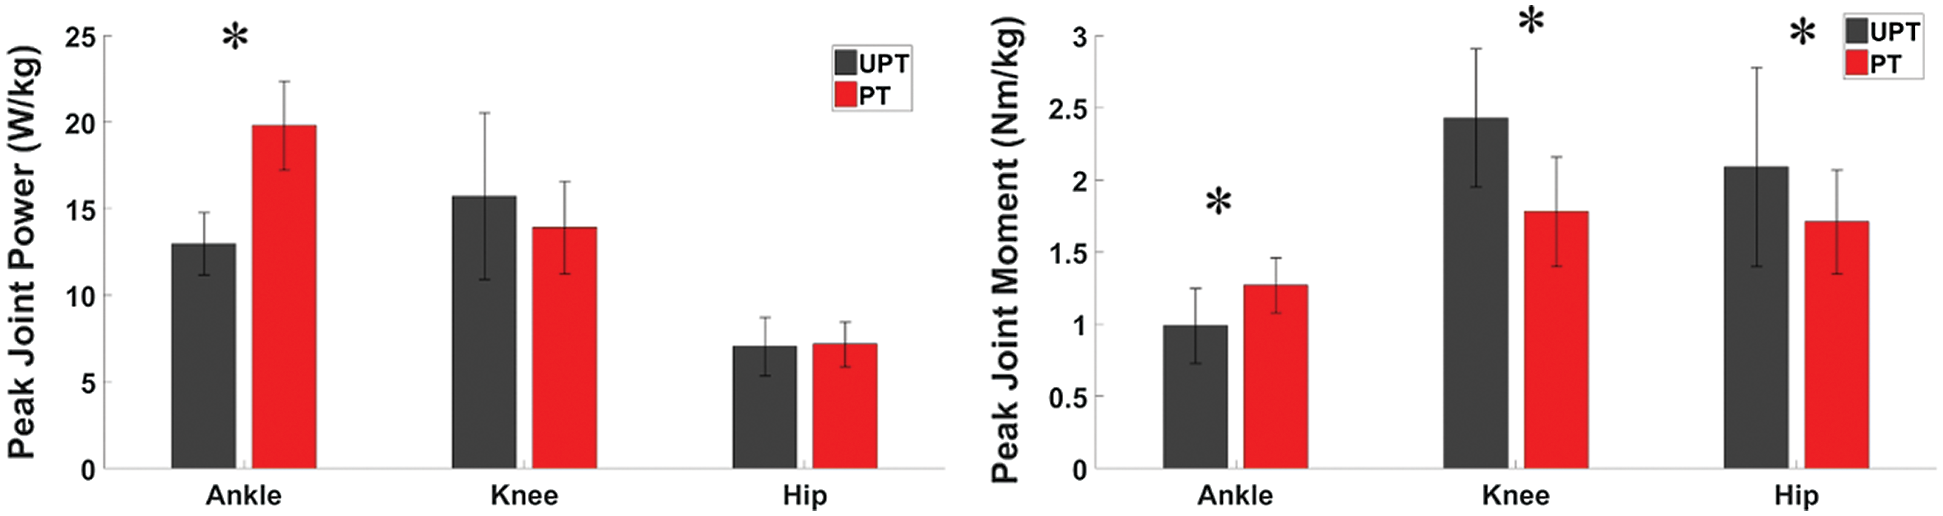
Figure 4: Comparison of peak joint power and peak joint moment in the ankle, knee and hip between UPT (dark black) and PT (dark red) during landing. * refer to the significant difference between UPT and PT (p < 0.05)
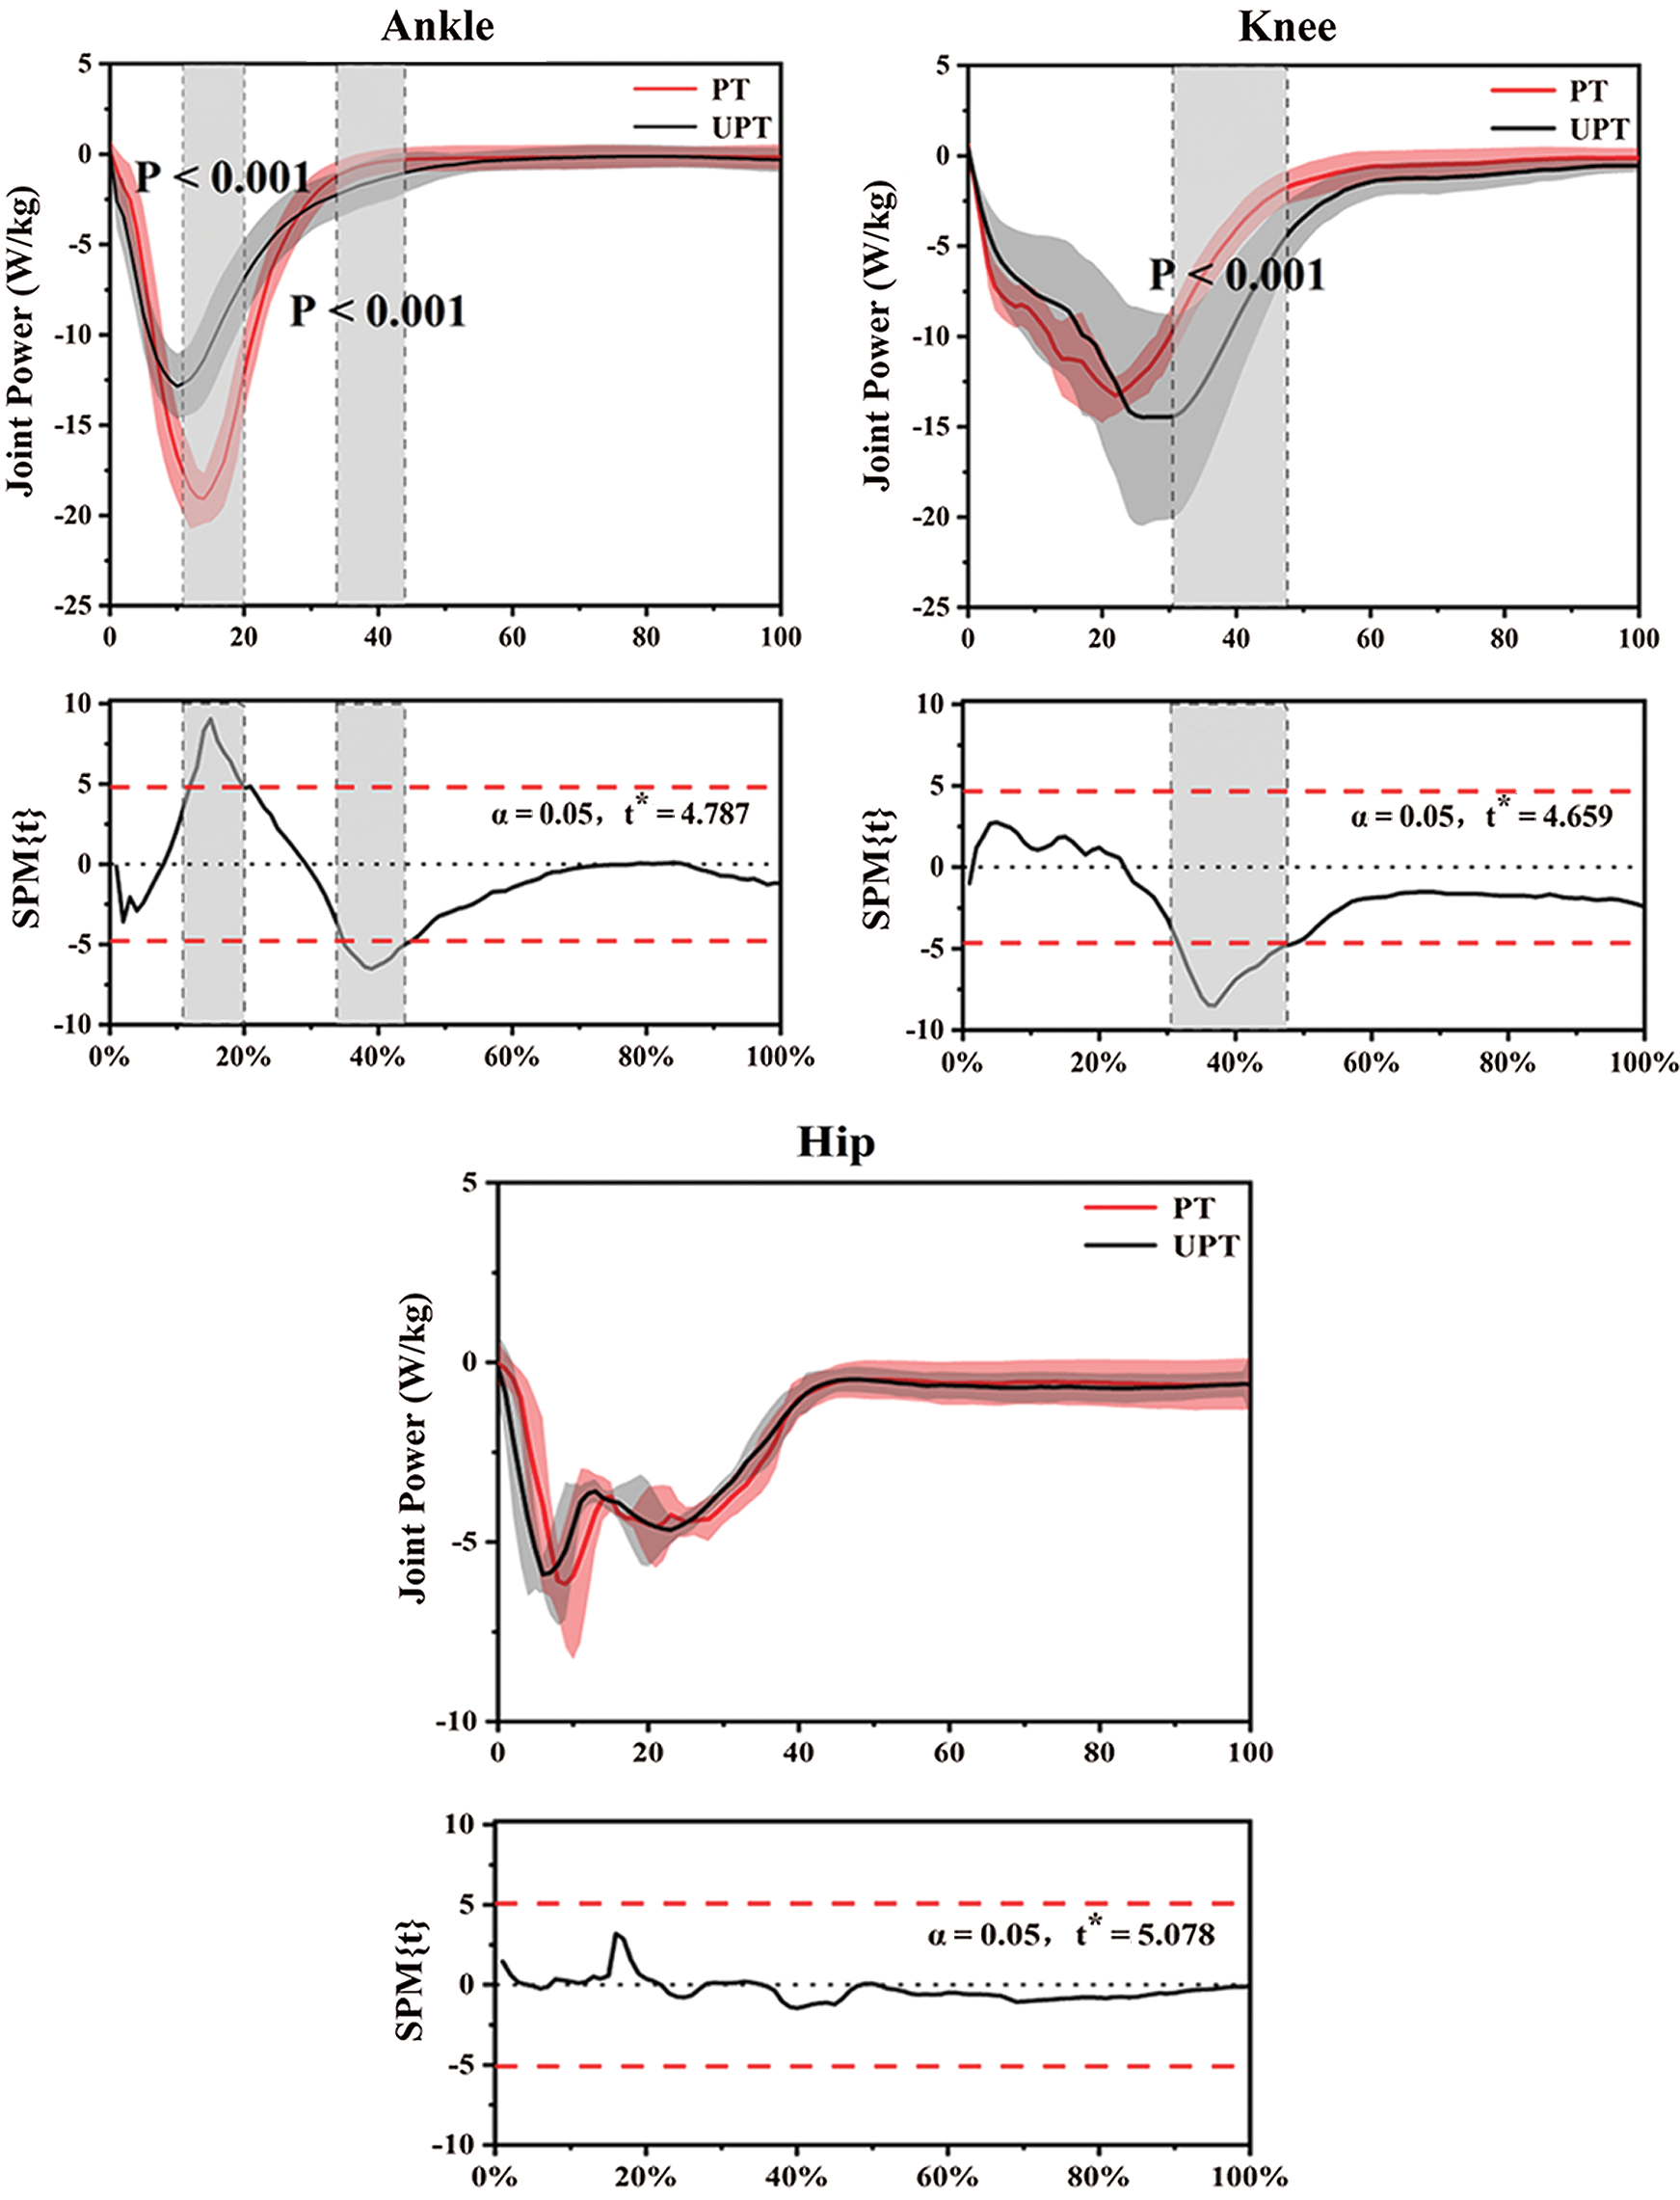
Figure 5: The Statistical Parametric Mapping (SPM) analysis results between UPT (dark black) and PT (dark red) during single-leg landing, depicting the mean joint power and standard error of ankle, knee and hip. The X-axis represents the mean percentage of the landing phase (%). The grey shaded areas significantly differ (p < 0.05) between UPT and PT during the landing phase
The purpose of this study was to compare and analyze lower limb sagittal joint work values during single-leg landing between individuals with PT and without UPT and to determine the relative contribution of the eccentric work done by each joint to the load attenuation. Our current study results are partially consistent with the proposed hypothesis. Compared with UPT athletes, PT depicted significantly greater ankle mean energy dissipation and contribution to total lower limb energy dissipation. PT showed significantly smaller knee mean energy dissipation and contributed to total lower limb energy dissipation during landing tasks. Although there were no statistically significant differences in the amount of hip eccentric work and the value of total lower limb energy dissipation, the UPT showed a greater value of total lower limb energy dissipation when compared to PT during landing.
The knee joint plays a vital role in absorbing shock during contact between the body and the ground [38,39]. When landing with a single-leg, the energy transfer and impact can only be assimilated by the lower limb’s muscle tissue in contact with the ground. Therefore, as a joint capsule with multiple joints, the knee can easily be damaged during the process of energy impact and transmission. Previous studies have shown that the knee joint plays a leading role in lower limb energy consumption, accounting for about 56% of the total energy dissipation of lower limbs during drop landing with single-leg [28,40]. Our current study indicated that UPT accounted for about 50.71% (standard deviation: 12.78%) of the total energy dissipation during a single-leg landing, and the results are consistent with the previous study. However, the PT only accounted for about 42.20% (standard deviation: 6.69%) of the total energy dissipation. The damping capacity of the knee joint to energy shock seemed to be reduced in the PT. Previous studies have shown that the joint structure’s risk of potential injury can be reduced by increasing the lower limb joints’ energy dissipation during the landing process [28,31]. The PT shows a smaller range of motion of the knee during landing, which reduces the knee’s ability to dissipate impact energy [28,41,42]. The lower knee flexion angle during landing also causes the muscular system to absorb less kinetic energy from the body, thus increasing the impact pressure on other body tissues [38]. Therefore, PT may have a self-protection mechanism due to a significant reduction in the knee’s contribution to the lower limb’s total energy dissipation.
During landing, the lower extremity undergoes a distal-to-proximal loading condition where by the foot and ankle joints are loaded before the load distribution is transferred to the knee and hip joints. Previous studies have indicated that the ankle joint’s contribution to load attenuation is limited as mechanical requirements increase, however, more proximal muscle tissues have a greater capacity to execute the eccentric work associated with landing [20,28]. Our current study results of the individual joint work values showed that the UPT had significantly smaller mean energy dissipation (p = 0.001; UPT: –0.82 ± 0.14 J/kg; PT: −0.97 ± 0.13 J/kg) and significantly smaller contribution to total energy dissipation (p = 0.001; UPT: 26.43% ± 4.64%; PT: 33.38% ± 4.57%) compared to PT. These results suggest that PT experiences a greater contribution to total energy dissipation, and PT has a smaller dependence on proximal muscle tissue. It seems to be a process in which the ankle joint receives the energy impact of other joint’s eccentric work of the lower limbs during the landing process. Previous study only compared the energy dissipation value of each joint of the lower limbs between UPT and PT during landing. These studies showed no significant difference in the ankle joint’s energy dissipation [19,20,28]. Nevertheless, when we quantified the ankle eccentric work value’s contribution ratio to the lower limbs’ total energy dissipation, we found a significant difference in the energy contribution ratio between PT (33.38% ± 4.57%) and UPT (26.43% ± 4.64%). While the joint eccentric work values offer an understanding of the energy absorption offered by individual joints and total mechanical requirements, relative joint work values permit researchers to calculate and quantify each joint’s relative contribution to total energy dissipation during the landing task.
Landing biomechanics in dynamic missions is a crucial factor associated with patellar tendinopathy and it is essential to adapt to excessive impact during landing [18] effectively. Although our results revealed that there were no differences in lower limb total energy dissipation (p = 0.127; UPT: −3.10 ± 0.26 J/kg; PT: −2.90 ± 0.39 J/kg), the total energy dissipation of PT less than UPT is consistent with the results of previous studies [27,28]. These findings may suggest that the musculoskeletal system transfers energy shocks to the external environment during landing, and neuromuscular strategies are considered to optimize athlete performance based on these mechanisms. A previous study has shown that the stress exerted on the lower extremities during landing can cause different injury patterns to develop. Hence, the foot interaction with the ground plays an important role in the musculoskeletal system [29]. From an anatomical perspective, the ankle joint connects the foot to the shank and is affected by the impact loading during landing. Therefore, the athletes with PT may be associated with a greater risk of ankle injury during landing because the ankle shows a greater energy contribution to total energy dissipation. Regarding the hip joint, our results showed that there were no differences in hip mean energy dissipation and contribution to total energy dissipation between UPT and PT. The interpretation of this finding could be that the hip joint acts as a distal joint. The effect of the energy impact on the hip joint is absorbed by the musculoskeletal system via the landing energy transfer process. Therefore, based on the unique difference in lower limb joints’ contribution to total energy dissipation between PT and UPT during landing, PT athletes’ joint energy dissipation during landing is worthy of attention.
Although the current study has novel findings in the biomechanics of lower limb landing in PT athletes, the authors recognize some limitations. Our study only compared and analyzed the energy dissipation during landing between athletes with PT and athletes UPT. The biomechanics of landing in athletes with asymptomatic patellar tendinopathy were not explored. Although previous studies have shown no difference in energy dissipation during landing between asymptomatic patellar tendinopathy athletes and UPT athletes [27], the relative energy contribution of each joint during landing in asymptomatic patellar tendinopathy athletes should continue to be explored. Another limitation of our study was that we only used 40 cm of landing height, even though 40 cm of landing height is generally accepted. Landing heights higher or lower than 40 cm should also be considered to reveal the differences that different landing heights and associated mechanical requirements may bring to PT and UPT athletes. Finally, our study’s sample size was only 26 (UPT: 13, PT: 13) athletes, and larger sample size should be considered to further and deeper reveal the energy dissipation strategy of PT during landing.
The findings of this study indicate that athletes with symptomatic patellar tendinopathy (PT) and athletes without patellar tendinopathy (UPT) show unique lower limb biomechanical characteristics and that each joint within the lower limb promotes these unique landing modes during landing. Our study showed that the PT depicted significantly greater ankle joint and smaller knee joint mean energy dissipation and contribution to total energy dissipation during landing in comparison to UPT. However, there were no differences in hip eccentric work and lower limb total energy dissipation. A deeper understanding of each joint’s energy dissipation contribution ratio between UPT and PT during landing can provide clues to reveal the biomechanical mechanism of PT athletes landing.
Funding Statement: This study was sponsored by the National Natural Science Foundation of China (81772423), NSFC-RSE Joint Project (81911530253) and K. C. Wong Magna Fund in Ningbo University.
Conflicts of Interest: The authors declare that they have no conflicts of interest to report regarding the present study.
1. Ferretti, A., Papandrea, P., Conteduca, F., Mariani, P. P. (2016). Knee ligament injuries in volleyball players. American Journal of Sports Medicine, 20(2), 203–207. DOI 10.1177/036354659202000219. [Google Scholar] [CrossRef]
2. Ying, J., Cen, X., Yu, P. (2021). Effects of eccentric exercise on skeletal muscle injury: From an ultrastructure aspect: A review. Physical Activity and Health, 5(1), 15–20. DOI 10.5334/paah.67. [Google Scholar] [CrossRef]
3. McKay, G. D., Goldie, P., Payne, W. R., Oakes, B. (2001). Ankle injuries in basketball: Injury rate and risk factors. British Journal of Sports Medicine, 35(2), 103–108. DOI 10.1136/bjsm.35.2.103. [Google Scholar] [CrossRef]
4. Scott, S. H., Winter, D. A. (1990). Internal forces at chronic running injury sites. Medicine & Science in Sports & Exercise, 22(3), 357–369. DOI 10.1249/00005768-199006000-00013. [Google Scholar] [CrossRef]
5. Yu, P., Gong, Z., Meng, Y., Baker, J. S., István, B. et al. (2020). The acute influence of running-induced fatigue on the performance and biomechanics of a countermovement jump. Applied Sciences, 10(12), 4319. DOI 10.3390/app10124319. [Google Scholar] [CrossRef]
6. Xiang, L., Mei, Q., Xu, D., Justin, F., Gu, Y. (2020). Multi-segmental motion in foot during counter-movement jump with toe manipulation. Applied Sciences, 10(5), 1893. DOI 10.3390/app10051893. [Google Scholar] [CrossRef]
7. Lian, Ø., Holen, K., Engebretsen, L., Bahr, R. (1996). Relationship between symptoms of jumper’s knee and the ultrasound characteristics of the patellar tendon among high level male volleyball players. Scandinavian Journal of Medicine & Science in Sports, 6(5), 291–296. DOI 10.1111/j.1600-0838.1996.tb00473.x. [Google Scholar] [CrossRef]
8. Shu, Y., Sun, D., Hu, Q. L., Zhang, Y., Li, J. S. et al. (2015). Lower limb kinetics and kinematics during two different jumping methods. Journal of Biomimetics, Biomaterials and Biomedical Engineering, 22, 29–35. DOI 10.4028/www.scientific.net/JBBBE.22.29. [Google Scholar] [CrossRef]
9. Crossley, K. M., Thancanamootoo, K., Metcalf, B. R., Cook, J. L., Purdam, C. R. et al. (2007). Clinical features of patellar tendinopathy and their implications for rehabilitation. Journal of Orthopaedic Research, 25(9), 1164–1175. DOI 10.1002/jor.20415. [Google Scholar] [CrossRef]
10. Khan, K. M., Cook, J. L., Kannus, P., Maffulli, N., Bonar, S. F. (2002). Time to abandon the “tendinitis” myth. BMJ, 324(7338), 626–627. DOI 10.1136/bmj.324.7338.626. [Google Scholar] [CrossRef]
11. Rudavsky, A., Cook, J. (2014). Physiotherapy management of patellar tendinopathy (jumper’s knee). Journal of Physiotherapy, 60(3), 122–129. DOI 10.1016/j.jphys.2014.06.022. [Google Scholar] [CrossRef]
12. Visentini, P. J., Khan, K. M., Cook, J. L., Kiss, Z. S., Harcourt, P. R. et al. (1998). The VISA score: An index of severity of symptoms in patients with jumper’s knee (patellar tendinosis). Journal of Science and Medicine in Sport, 1(1), 22–28. DOI 10.1016/S1440-2440(98)80005-4. [Google Scholar] [CrossRef]
13. Cook, J. L., Khan, K. M., Harcourt, P. R., Kiss, Z. S., Fehramann, M. W. et al. (1998). Patellar tendon ultrasonography in asymptomatic active athletes reveals hypoechoic regions: A study of 320 tendons. Clinical Journal of Sport Medicine, 8(2), 73–77. DOI 10.1097/00042752-199804000-00001. [Google Scholar] [CrossRef]
14. Zwerver, J., Bredeweg, S. W., Van, I. (2011). Prevalence of Jumper’s knee among nonelite athletes from different sports: A cross-sectional survey. American Journal of Sports Medicine, 39(9), 1984–1988. DOI 10.1177/0363546511413370. [Google Scholar] [CrossRef]
15. Baker, J. S., Quach, B., Jiao, J., Liang, W., Gao, Y. (2020). Body composition matters when designing and prescribing HIIT protocols to individuals for health promotion. Physical Activity and Health, 4(1), 158–161. DOI 10.5334/paah.68. [Google Scholar] [CrossRef]
16. Peers, K. H., Lysens, R. J. (2005). Patellar tendinopathy in athletes. Sports Medicine, 35(1), 71–87. DOI 10.2165/00007256-200535010-00006. [Google Scholar] [CrossRef]
17. Cardoso, T. B., Pizzari, T., Kinsella, R., Hope, D., Cook, J. L. (2019). Current trends in tendinopathy management. Best Practice & Research Clinical Rheumatology, 33(1), 122–140. DOI 10.1016/j.berh.2019.02.001. [Google Scholar] [CrossRef]
18. Van, H., Poel, H. J., Diercks, R. L., Zwerver, J. (2014). Jumper’s knee or lander’s knee? A systematic review of the relation between jump biomechanics and patellar tendinopathy. International Journal of Sports Medicine, 35(8), 714–722. DOI 10.1055/s-0033-1358674. [Google Scholar] [CrossRef]
19. Richards, D. P., Ajemian, S. V., Wiley, J. P., Zernicke, R. F. (2016). Knee joint dynamics predict patellar tendinitis in elite volleyball players. The American Journal of Sports Medicine, 24(5), 676–683. DOI 10.1177/036354659602400520. [Google Scholar] [CrossRef]
20. Gu, Y., Ren, X., Li, J., Lake, M., Zhang, Q. et al. (2010). Computer simulation of stress distribution in the metatarsals at different inversion landing angles using the finite element method. International Orthopaedics, 34(5), 669–676. DOI 10.1007/s00264-009-0856-4. [Google Scholar] [CrossRef]
21. Kulig, K., Joiner, D., Chang, Y. J. (2015). Landing limb posture in volleyball athletes with patellar tendinopathy: a pilot study. International Journal of Sports Medicine, 36(5), 400–406. DOI 10.1055/s-0034-1395586. [Google Scholar] [CrossRef]
22. Fietzer, A. L., Chang, Y. J., Kulig, K. (2012). Dancers with patellar tendinopathy exhibit higher vertical and braking ground reaction forces during landing. Journal of Sports Sciences, 30(11), 1157–1163. DOI 10.1080/02640414.2012.695080. [Google Scholar] [CrossRef]
23. Bisseling, R. W., Hof, A. L., Bredeweg, S. W., Zwerver, J., Mulder, T. (2008). Are the take-off and landing phase dynamics of the volleyball spike jump related to patellar tendinopathy? British Journal of Sports Medicine, 42(6), 483–489. DOI 10.1136/bjsm.2007.044057. [Google Scholar] [CrossRef]
24. Edwards, S., Steele, J. R., Mcghee, D. E., Beattie, S., Purdam, C. et al. (2010). Landing strategies of athletes with an asymptomatic patellar tendon abnormality. Medicine & Science in Sports and Exercise, 42(11), 2072–2080. DOI 10.1249/MSS.0b013e3181e0550b. [Google Scholar] [CrossRef]
25. Siegmund, J. A., Huxel, K. C., Swanik, C. B. (2008). Compensatory mechanisms in basketball players with jumper’s knee. Journal of Sport Rehabilitation, 17(4), 358–371. DOI 10.1123/jsr.17.4.358. [Google Scholar] [CrossRef]
26. Scattone, S. R., Purdam, C. R., Fearon, A. M., Spratford, W. A., Kenneally, C. et al. (2017). Effects of altering trunk position during landings on patellar tendon force and pain. Medicine & Science in Sports and Exercise, 49(12), 2517–2527. DOI 10.1249/MSS.0000000000001369. [Google Scholar] [CrossRef]
27. Bisseling, R. W., Hof, A. L., Bredeweg, S. W., Zwerver, J., Mulder, T. (2007). Relationship between landing strategy and patellar tendinopathy in volleyball. British Journal of Sports Medicine, 41(7), e8–e8. DOI 10.1136/bjsm.2006.032565. [Google Scholar] [CrossRef]
28. Zhang, S. N., Bates, B., Dufek, J. (2000). Contributions of lower extremity joints to energy dissipation during landings. Medicine & Science in Sports & Exercise, 32(4), 812–819. DOI 10.1097/00005768-200004000-00014. [Google Scholar] [CrossRef]
29. Powell, D. W., Hanson, N. J., Long, B., Williams, D. B. (2012). Frontal plane landing mechanics in high-arched compared with low-arched female athletes. Clinical Journal of Sport Medicine, 22(5), 430–435. DOI 10.1097/JSM.0b013e318257d5a1. [Google Scholar] [CrossRef]
30. Mizrahi, J., Susak, Z. (1982). Analysis of parameters affecting impact force attenuation during landing in human vertical free fall. Engineering in Medicine, 11(3), 141–147. DOI 10.1243/EMED_JOUR_1982_011_039_02. [Google Scholar] [CrossRef]
31. Devita, P., Skelly, W. A. (1992). Effect of landing stiffness on joint kinetics and energetics in the lower extremity. Medicine & Science in Sports and Exercise, 24(1), 108–115. DOI 10.1249/00005768-199201000-00018. [Google Scholar] [CrossRef]
32. Turner, M. J., Allen, M. S. (2018). Confirmatory factor analysis of the irrational Performance Beliefs Inventory (iPBI) in a sample of amateur and semi-professional athletes. Psychology of Sport and Exercise, 35(4), 126–130. DOI 10.1016/j.psychsport.2017.11.017. [Google Scholar] [CrossRef]
33. Rosen, A. B., Ko, J., Simpson, K. J., Kim, S. H., Brown, C. N. (2015). Lower extremity kinematics during a drop jump in individuals with patellar tendinopathy. Orthopaedic Journal of Sports Medicine, 3(3), 2325967115576100. DOI 10.1177/2325967115576100. [Google Scholar] [CrossRef]
34. Xu, D., Jiang, X., Cen, X., Baker, J. S., Gu, Y. (2021). Single-leg landings following a volleyball spike may increase the risk of anterior cruciate ligament injury more than landing on both-legs. Applied Sciences, 11(1), 130. DOI 10.3390/app11010130. [Google Scholar] [CrossRef]
35. Xu, D., Cen, X., Wang, M., Rong, M., István, B. et al. (2020). Temporal kinematic differences between forward and backward jump-landing. International Journal of Environmental Research and Public Health, 17(18), 6669. DOI 10.3390/ijerph17186669. [Google Scholar] [CrossRef]
36. Winter, D. A. (1990). Biomechanics and motor control of human movement. 2nd ed USA: John Wiley & Sons, Inc., Press. [Google Scholar]
37. Pataky, T. C. (2010). Generalized n-dimensional biomechanical field analysis using statistical parametric mapping. Journal of Biomechanics, 43(10), 1976–1982. DOI 10.1016/j.jbiomech.2010.03.008. [Google Scholar] [CrossRef]
38. Devita, P., Skelly, W. A. (1992). Effect of landing stiffness on joint kinetics and energetics in the lower extremity. Medicine & Science in Sports and Exercise, 24(1), 108–115. DOI 10.1249/00005768-199201000-00018. [Google Scholar] [CrossRef]
39. Hargrave, M. D., Carcia, C. R., Gansneder, B. M., Shultz, S. J. (2003). Subtalar pronation does not influence impact forces or rate of loading during a single-leg landing. Journal of Athletic Training, 38(1), 18. DOI 10.1152/japplphysiol.00374.2002. [Google Scholar] [CrossRef]
40. Pietrosimone, L. S., Blackburn, J. T., Wikstrom, E. A., Berkoff, D. J., Docking, S. I. et al. (2020). Landing biomechanics, but not physical activity, differ in young male athletes with and without patellar tendinopathy. Journal of Orthopaedic & Sports Physical Therapy, 50(3), 158–166. DOI 10.2519/jospt.2020.9065. [Google Scholar] [CrossRef]
41. Harris, M., Schultz, A., Drew, M. K., Rio, E., Adams, S. et al. (2020). Thirty-seven jump-landing biomechanical variables are associated with asymptomatic patellar tendon abnormality and patellar tendinopathy: A systematic review. Physical Therapy in Sport, 45(1), 38–55. DOI 10.1016/j.ptsp.2020.03.011. [Google Scholar] [CrossRef]
42. Van, H., Brink, M., Zwerver, J., Hijmans, J. (2016). Prospective study of the relation between landing biomechanics and jumper’s knee. International Journal of Sports Medicine, 37(3), 245–250. DOI 10.1055/s-0035-1555858. [Google Scholar] [CrossRef]
 | This work is licensed under a Creative Commons Attribution 4.0 International License, which permits unrestricted use, distribution, and reproduction in any medium, provided the original work is properly cited. |