| Molecular & Cellular Biomechanics |
DOI: 10.32604/mcb.2022.018318
ARTICLE
Lung Nodule Detection Based on YOLOv3 Deep Learning with Limited Datasets
1School of Foreign Language, Guangxi University, Nanning, 530004, China
2School of Computer, Electronics and Information, Guangxi University, Nanning, 530004, China
3Guangxi Key Laboratory of Multimedia Communications and Network Technology, Nanning, 530004, China
4School of Informatics, Xiamen University, Xiamen, 361005, China
5College of Medicine, Guangxi University, Nanning, 530004, China
*Corresponding Author: Xuejun Zhang. Email: xjzhang@gxu.edu.cn
Received: 16 July 2021; Accepted: 01 October 2021
Abstract: The early symptom of lung tumor is always appeared as nodule on CT scans, among which 30% to 40% are malignant according to statistics studies. Therefore, early detection and classification of lung nodules are crucial to the treatment of lung cancer. With the increasing prevalence of lung cancer, large amount of CT images waiting for diagnosis are huge burdens to doctors who may missed or false detect abnormalities due to fatigue. Methods: In this study, we propose a novel lung nodule detection method based on YOLOv3 deep learning algorithm with only one preprocessing step is needed. In order to overcome the problem of less training data when starting a new study of Computer Aided Diagnosis (CAD), we firstly pick up a small number of diseased regions to simulate a limited datasets training procedure: 5 nodule patterns are selected and deformed into 110 nodules by random geometric transformation before fusing into 10 normal lung CT images using Poisson image editing. According to the experimental results, the Poisson fusion method achieves a detection rate of about 65.24% for testing 100 new images. Secondly, 419 slices from common database RIDER are used to train and test our YOLOv3 network. The time of lung nodule detection by YOLOv3 is shortened by 2–3 times compared with the mainstream algorithm, with the detection accuracy rate of 95.17%. Finally, the configuration of YOLOv3 is optimized by the learning data sets. The results show that YOLOv3 has the advantages of high speed and high accuracy in lung nodule detection, and it can access a large amount of CT image data within a short time to meet the huge demand of clinical practice. In addition, the use of Poisson image editing algorithms to generate data sets can reduce the need for raw training data and improve the training efficiency.
Keywords: Lung nodule detection; Computer Aided Diagnosis (CAD); deep learning; YOLOv3; poisson image editing
In recent years, lung cancer has the highest incidence and mortality rate in China comparing to other cancer diseases. Even in the world, lung cancer is exponentially increasing as the most common malignant tumor and lethal cancer. A large number of CT images need to be interpreted by radiologists in their routine check, but there are many drawbacks in manual detection. According to the statistics of the Boston Research Group (Hopkinton, USA), 60.5% of the doctors missed the diagnosis with the misdiagnosis rate around 10% [1]. Therefore, a computer-aided diagnosis of lung nodules method has important practical significance and becomes one of the research hotspots in the field of medical image processing in last few years.
At present, there are various methods for detecting lung nodules which can be divided into two groups: image processing based traditional mode and machine learning method. Traditional image processing methods mainly include segmentation of lung parenchyma, extraction of regions of interest, feature extraction, and classification or recognition [2]. According to the medical features of lung CT images, in the segmentation of lung parenchyma images, analysis and extraction of suspected nodules images [3], lung nodules were segmented by specific CT values, and the adaptive high-quality segmentation of the nodule image is realized by using the “circle-cut” and “blow-ball” methods. Traditional image processing method is not ideal for complex and diverse CT images, especially when lung nodules are attached to other tissues or the area near the surrounding pixels with overlap CT values, leading to low detection accuracy. Therefore, the key of such algorithms are based on the pre-segmentation of lung nodules, and most of them are related to initialization, such as genetic algorithm, regional growth algorithm, and etc. As different lung nodules on CT scans need different initialization, such algorithms always have low generalization ability and cause inaccuracy in different datasets.
The method based on machine learning is to use computers to simulate human’s learning behaviors of acquiring new knowledge and skills. At present, more mainstream machine learning mainly includes the following algorithms: 1) SVM classifier; 2) CNN (Convolution Neural Network); 3) ANN (Artificial Neural Network); 4) Fast R-CNN (Fast Region-based Convolutional Neural Networks). Boroczky et al. [4] firstly extracted 32 individual data features and use it to build a feature pool, then using genetic algorithm to extract the highest correlation 10 features, from which the optimal feature subset are selected to train the SVM classifier. Finally this algorithm obtained 100% sensitivity and 56.4% specificity. Campadelli et al. [5] firstly extracted 160 features such as shape features and gray level distribution features, and then selected 36 features from these features to establish feature space and select feature subset with 18 features. Using these two feature sets and matching different parameters to train the SVM classifier. The sensitivity is 100% while the number of false positives per image is 8. Dou et al. [6] designed a new 3D-CNN structure, which can reduce the false positive false positive rate from stereoscopic CT images. Suzuki et al. [7] proposed a pattern recognition technology based on ANN, which was used to reduce the false positive rate in lung CT images. The results showed that this method has 90.6% sensitivity and 85% sensitivity to the detection of small nodules.
Recently Fast R-CNN is regarded as a better method to detect lung nodules with a higher accuracy rate among the mentioned methods. However, processing a large number of CT images not only requires higher accuracy, but also faster detection speed. Fast R-CNN uses Two-Stage method, which may reduce the detection rate by selecting candidate from a large number of boxes. In addition, because of the privacy of medical image data, clinical medical images are always not easy to collect. When only a small amount of training data is available, how to improve the accuracy of recognition is an important issue in CNN. In this paper, we apply the YOLOv3 depth learning neural network to our research, which uses the One-Stage method with some additional modules such as boundary box prediction, classification prediction, cross-scale prediction and feature extraction. YOLOv3 has been proven the advantages of high accuracy and fast detection speed, and better ability of detecting small targets using FPN (Feature Pyramid Networks).
In general, collection of a large number of training data sets is required to enable the network for fully learning, which is one of the keys for deep learning. However, less original training data sets are normal problem in medical image processing. This paper proposes a method to generate new lesions and fuse on normal cases by Poisson image editing. This algorithm is performed by using a small number of diseased areas collected from cancer cases, which are randomly deformed, displaced, rotated, and seamlessly integrated into normal lung area on CT images. Such procedure can not only produce a plenty amount of training data sets, but also different locations distributed over the whole lung area to enable the network to adjust the weights to fit the detection on every positions.
The proposed method consists of five steps: 1) Preprocessing of the lung CT images; 2) Calculating the gradient field and the divergence field of the fused image; 3) Marking the lung nodule image and configuring the optimized YOLOv3 deep neural network; 4) Randomly generating a part of the training datasets by using Poisson editing algorithm; 5) Training and evaluating the training datasets.
2.1 Preprocessing of the Lung CT Image
As a medical image, CT is usually stored in DICOM (Digital Imaging and Communications in Medicine) format. However this 16-bit formatted image cannot be directly trained as a training set for YOLOv3. Therefore, it is necessary to preprocess the image and convert the DICOM format into JPEG format.
The CT value of the 16-bit image data in a DICOM file is converted to the downscale 8-bit JPEG format. The wide lung window (W1600HU: L-550HU) is a better display setting for the lesion in the lung. Therefore, the window level and window width need to be set during preprocessing. The original CT image is preprocessed to clearly reflect the contour of the lung, the internal structure and the texture features of the lung nodules, which shows more details and benefits to observe. As shown in Fig. 1: (a) is the conversion result of the default setting before preprocessing, and (b) is the conversion result of setting the window level and window width.

Figure 1: The conversion result (a) of preprocessing from the original lung CT image (b)
2.2 Calculating the Gradient Field and the Divergence Field of the Fused Image
In an image, the gradient of the pixel describes the difference between the pixel and other pixels. It can be calculated from the first derivative of the pixel. For a two-dimensional (2D) image, it can be regarded as a 2D digital matrix sized W × H, then the gradient can be expressed as formula (1). The gradient of pixels is calculated by interpolation method, and the formulas are as follows (2) and (3). Where i and j are the horizontal and vertical coordinates of the pixel.
From the above formulas, the image gradient can also be approximately expressed as formulas (4) and (5).
The gradient can reflect the changes information of the image, and the region where the gradient changes greatly is the edge region of the image. Calculating the gradient of the region m to be fused can obtain the “change path” of the region, that is, the relative information. When it has the corresponding boundary condition, the absolute information can be changed. The reflection from the image is to change the pixel color of the region m to achieve fusion effect. The gradient field Gm of the region m can be calculated by the above method. Finally, the gradient field Gf of the image is the combination of the gradient field Gm of the region to be fused and the gradient field Gt of the target image.
The principle of calculating the gradient field of the target image t is similar to that of the gradient field of the region m. However, in order to simplify the calculation in practice, we can only calculate the gradient Gt of the part excluding region m in the image t. Because in the gradient field of the final fused image, the gradient field of the target image corresponding to the region to be fused is useless, which is eventually replaced by the gradient field of the region to be fused. Finally, the gradient field Gf of the reconstructed image is Gt + Gm. The 2D matrix containing gradient information is transformed into one-dimensional (1D) matrix to facilitate computer computation.
The function of divergence is to adjust the pixel value according to the difference between the pixel point and the surrounding pixel value, which can smooth the image. The convolution of Laplacian Operator is often used to obtain the divergence of an image. The Laplacian Operator operation template is shown in Fig. 2.

Figure 2: Laplacian operator operation template
In a more rigorous derivation, the divergence is obtained by partial derivative of x, y in the image gradient [8], i.e., formula (6).
2.3 Marking the Image and Configuring the Optimized Network
PASCAL VOC provides a set of standardized and excellent datasets for image recognition and classification. In many algorithms, the VOC datasets is used for testing, which is marked fast and the markup information is easy to store and parse. Therefore, the VOC format is used as the template for datasets in this study. YOLOv3 also supports the training of VOC datasets. In this study, LabelImg tool is used for labeling. According to the detection basis and the sample provided by the professional, the rectangular frame of the corresponding area drawn on the image is shown in Fig. 3, and the xml file in VOC format can be generated. Fig. 3a shows an example provided by a medical professional, and Fig. 3b shows the LabelImg marker. In this paper, we only label diseases such as lung nodule, so the detection category is only one type of lung nodule.

Figure 3: Lung nodule is indicated by a yellow arrow (a) and label marked by LabelImg tool (b) on CT image
YOLOv3 uses a three-scale feature map (when the input scale is 416 × 416): (13 × 13), (26 × 26), (52 × 52). When the down-sampling step size is 32, the length and width of the input image should be an integral multiple of 32. At this time, the length and width of datasets is 512 × 512, which satisfies this requirement, and the high-resolution input can better detect the image with smaller details.
When configuring deep learning network structure, we should consider the requirements of the detection itself as well as the hardware and computer environment. In the configuration file of YOLOv3, parameter settings for the network structure are provided. Adjusting the batch value is beneficial to better find the direction of the gradient descent. In the last convolutional layer of the network, according to the detection category only including lung nodule, the filter parameters are adjusted as follows:
This can make the network to adapt to the target category of detection and improve the convergence of the whole architecture.
3 Poisson Fusion Algorithm and YOLOv3 Lung Nodule Detection
Poisson image fusion is a major tool in Poisson editing [8], which was first proposed by Siggraph. Unlike other algorithms, Poisson editing principle is more like solving an equation. When a Laplacian Operator method for constructing an unknown function on an image region and its boundary conditions are given, the Poisson equation can be solved by numerical method to achieve a seamless fusion of the image region. It is essentially solving an equation of Ax = b, where A is a coefficient sparse matrix, b is the divergence of the fused image, and the solution value x is the pixel value of the fused region.
Describing the implementation of the algorithm in Mathematics is that it should firstly find the constraints, then construct the Poisson equation, and finally solve the Poisson equation. The basic flowchart is shown in Fig. 4.

Figure 4: The flowchart of Poisson fusion
From the previous steps, we have been able to calculate the divergence field of the fused image, that is, the b term in the equation. In practice, the constraint condition of Poisson equation can be added by obtaining the pixel value of the fused image boundary region. Finally, we only need to construct sparse matrix according to the constraint condition and solve the Poisson reconstruction equation to obtain the pixel value of the fused image. In this paper, the optimized FFT method is used to solve the Poisson reconstruction equation, which takes 4 or 5 times less time than the SOR method to achieve similar accuracy, and does not change with the vorticity field [9]. The fusion result is shown in Fig. 5. Fig. 5a is the target image, Fig. 5b is the source image, Fig. 5c is the mask image, and Fig. 5d is the fused image.

Figure 5: Poisson fusion target image (a) from another CT image with nodule (b) using a mask (c) to generate a new fused image (d)
In practice, a single fusion can not meet the requirements of data. In other words, the fixed position, size and shape of the region to be fused can not provide the extensive data support. Therefore, in the further processing, the fusion region is treated with geometric transformations, such as random rotation, scaling, displacement and so on. The result is shown in Fig. 6. Fig. 6a is the original fused image, Figs. 6b and 6c are the fused images after random geometric transformations.

Figure 6: Poisson random fusion from original fused image (a) by rotating (b) and shifting (c) transformation
YOLOv3 is an improved version of basic YOLO and YOLOv2, which was proposed by Joseph et al. [10] from University of Washington. By adding changes in design details to YOLO, YOLOv3 can improve detection speed while achieving a fairly accurate rate. It is 1000 times faster than R-CNN and 100 times faster than Fast R-CNN. Compared with YOLOv2, YOLOv3 has multi-scale prediction, which enables YOLOv3 to overcome the disadvantages of YOLOv2 insensitivity to small objects. This has a good recognition effect on lung nodules smaller than 3 mm in this study.
YOLOv3 continues the idea of other versions of YOLO, dividing the input image into S × S grid cell, each of which is responsible for detecting objects that “fall into” the grid cell. If the coordinates of the center position of an object fall into a certain grid cell, then the grid cell is responsible for detecting the object. The main steps of the processing algorithm include: bounding box prediction, class prediction, trans-scale prediction, feature extraction. The specific principle is detailed in the literature [10,11].
The training data is trained by the optimized network. In the training process, small batch gradient descent method and impulse are used, which can improve the convergence speed of network training. At the same time, the parameters for evaluating the training level will be displayed in real time and the curve of loss function is drawn. In YOLO network, the loss function is defined by the formula (8). When the loss value tends to 0 without changing, the training convergence can be stopped.
The experiment in this paper is based on c language and Python3.6 in Visual Studio 2017. It is carried out on the computer with a main frequency of 2.6 Ghz, GTX960M graphics card, and 4 GB memory.
In this paper, two kinds of data sets are used. One is a normally collected lung nodule data set, the other is a data set generated by Poisson fusion. The following two data training results will be analyzed and compared to verify the validity of Poisson fusion algorithm.
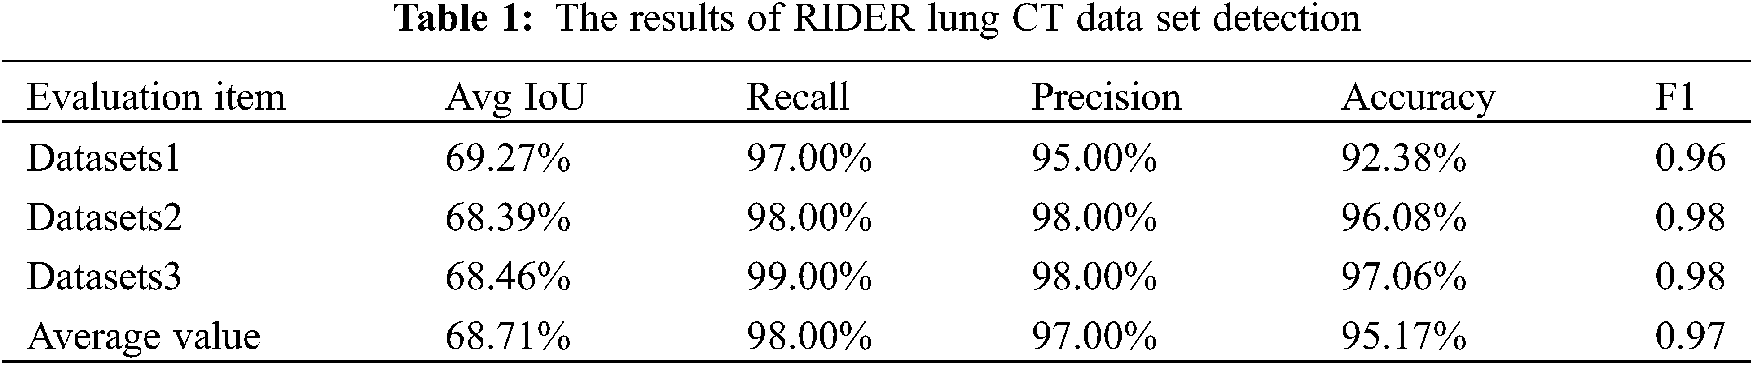
The first data set is trained with 419 images from the common database RIDER [12], and the size of these images is 512 × 512. 380 of them are lung nodule and 39 are normal. There are three test data sets, each with 100 images. The second data set uses 5 diseased images as the source image and 10 normal lung images as the target image. The Poisson fusion algorithm is used to create the data set with 110 images, and the test data set contains 100 images. After testing these images, we calculated the Recall, Precision, and AvgIoU values to reflect the accuracy of the frame positioning. Different from training evaluation, the detection results include Recall, Precision, F1 and Accuracy, which are used as the test evaluation.
Select a part of the recognition image, as shown in Fig. 7. It can be seen that the lung nodules can be well recognized in this study, even if the lung nodules were adhered to other tissues or the outer wall of the thoracic cavity. The recognition effect of small lung nodules is not as good as the larger one, but it also has good accuracy.

Figure 7: Lung nodule testing results with big size (a) and (d) vs. small size (b) and (c)
In this paper, the output results of the model are evaluated by using the statistical results of Recall, Precision and F1. Amongthem, Recall is obtained by the formula
The default threshold size for verification is 0.25, and the evaluation results of the test set are shown in Table 1.
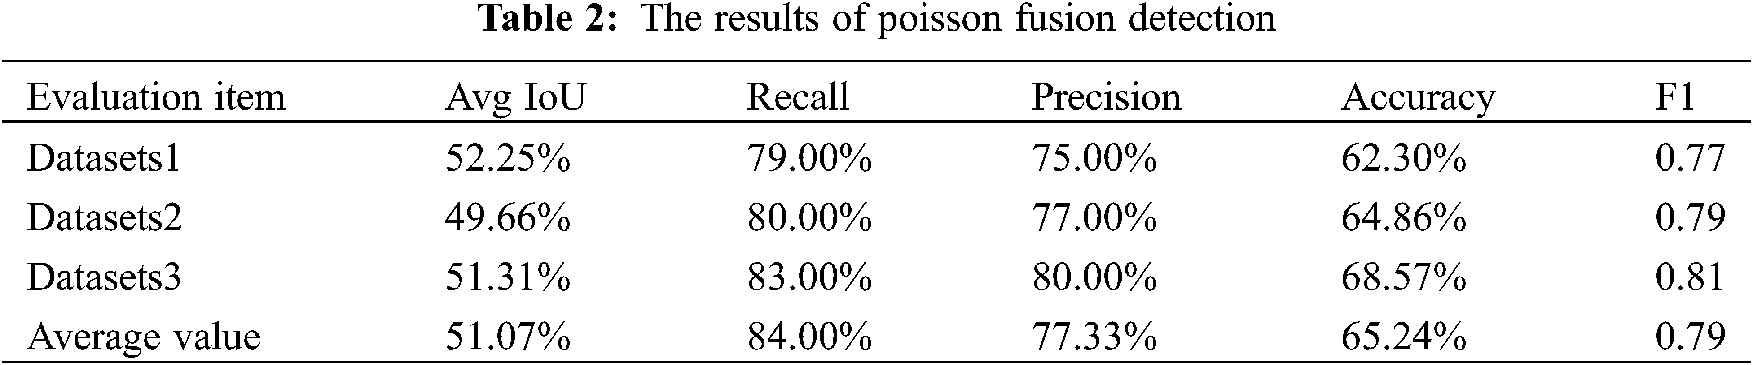
Poisson fusion generates more data by image processing with a small amount of data. Therefore, when evaluating this part of effect, the validation data set we used did not contain the image of the disease as the source image of Poisson fusion. The results are shown in Table 2.
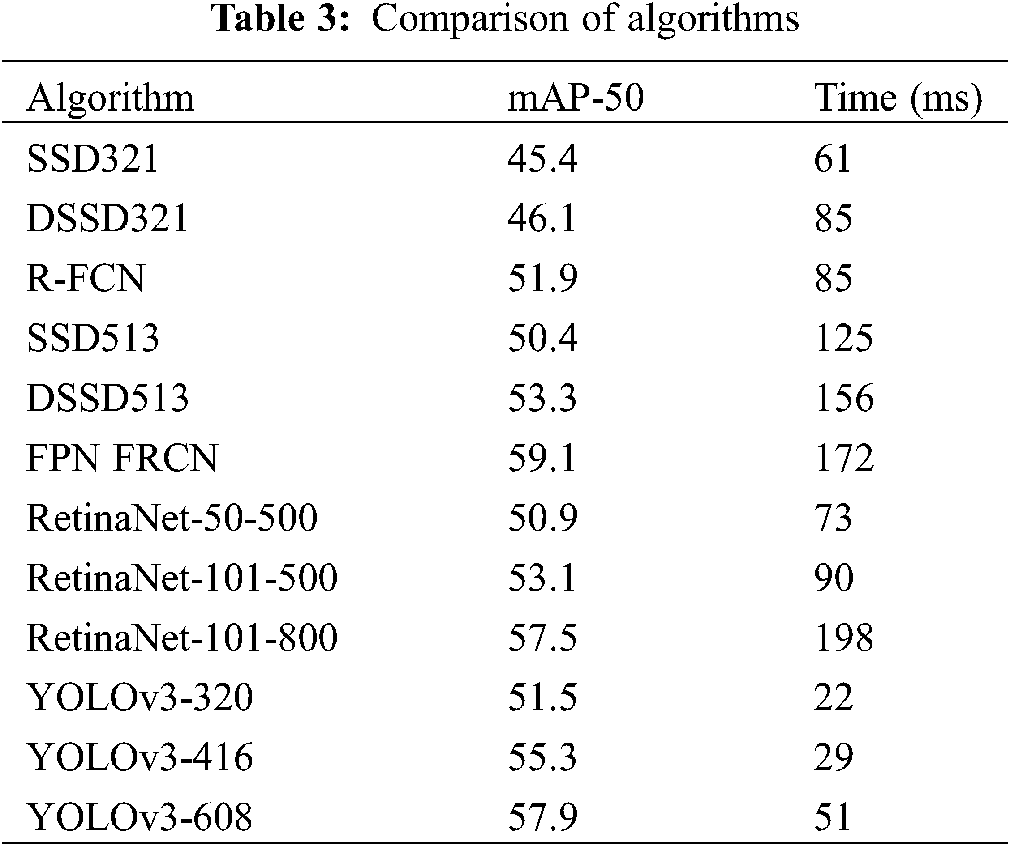
One of the advantages of YOLOv3 network is that it has better real-time performance and the detection time is shorter than other algorithms. Therefore, the detection can be achieved in a short time even on a computer with a common hardware. With a certain accuracy, CT images can be efficiently detected and a large amount of patient data can be processed. This has important practical significance for the exponential growth of lung cancer incidence.
Table 3 indicates a comparison of the current mainstream detection algorithms. The results show that the speed advantage of the YOLOv3 network is more obvious when the accuracy is basically the same, which is about three times that of other algorithms, that is, it can process multiple images in a short time. When 512 × 512 is used as the input size for detection, processing 100 images take 5.1 s, which is a good result for notebook computer graphics cards.
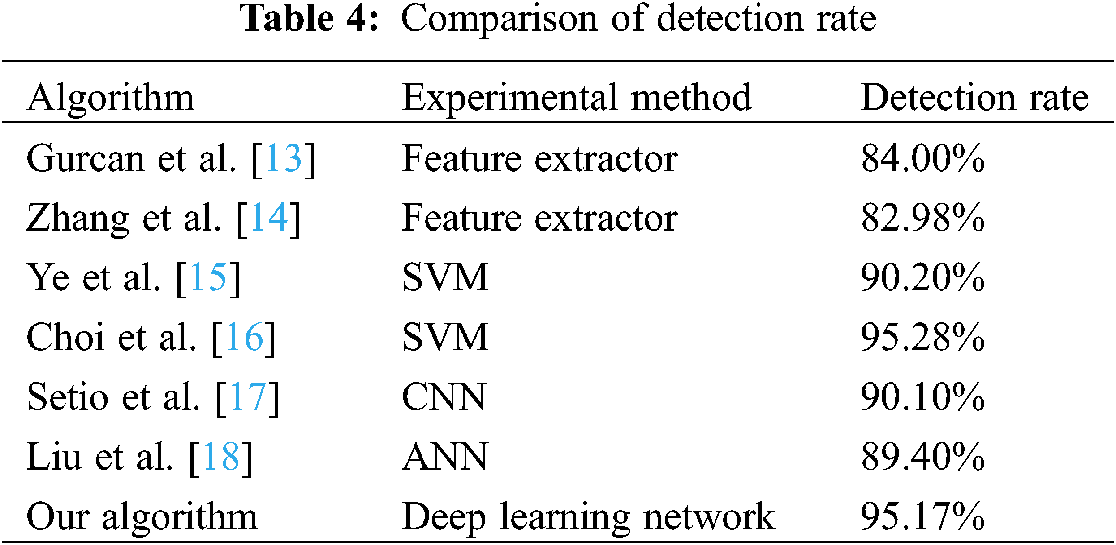
In terms of detection rate, it is compared with the data results of some existing algorithms in recent years. The results are shown in Table 4. It can be seen that the detection rate of this study is better than some existing algorithms.
In view of the rising prevalence rate of lung cancer, we use the advanced YOLOv3 algorithm in the field of target detection to recognize lung nodules, which plays an early role in the diagnosis of lung cancer. At the same time, a method of generating data sets using Poisson fusion algorithm is proposed, which reduce amount of the original data for training. After the testing and evaluation, the detection rate of the algorithm in this paper is higher than other algorithms, and the algorithm has obvious speed advantage, which is shorter than other mainstream algorithms. This has important practical significance for detecting a large number of CT images.
In the verification of Poisson fusion, this paper also achieved significant results. The specific method is using a small number of diseased areas as the source image, the normal lung image as the target image, calculate the gradient and divergence of the fused image, and construct the Poisson equation with the boundary pixels as the constraint condition. In the practical verification, this method achieves a detection rate of about 65% for the new images, which means that the data generated by Poisson fusion as part of the training data sets will reduce the need for original training data.
Funding Statement: This work is supported by the National Natural Science Foundation of China (Grant No. 81760324); and Guangxi Key Projects of Science and Technology (Grants No. 2020AA33004AA).
Conflicts of Interest: The authors declare that they have no conflicts of interest to report regarding the present study.
1. Feng, L., Roger, E., Metz, C. E., Kunio, D., Heber, M. M. (2016). Lung cancers missed on chest radiographs: Results obtained with a commercial computer-aided detection program. Radiology, 246(1), 273–280. DOI 10.1148/radiol.24610618486. [Google Scholar] [CrossRef]
2. Cao, L. (2009). Image analysis and recognition of pulmonary nodules. Guangzhou: Southern Medical University. [Google Scholar]
3. Li, L. (2010). Algorithm research of pulmonary nodule detection based on CT image analysis. Dalian: Dalian University of technology. [Google Scholar]
4. Boroczky, L., Zhao, L., Lee, K. P. (2006). Feature subset selection for improving the performance of false positive reduction in lung nodule CAD. IEEE Transactions on Information Technology in Biomedicine, 10(3), 504–511. DOI 10.1109/TITB.2006.872063. [Google Scholar] [CrossRef]
5. Campadelli, P., Casiraghi, E., Artioli, D. (2006). A fully automated method for lung nodule detection from postero-anterior chest radiographs. IEEE Transactions on Medical Imaging, 25(12), 1588–1603. DOI 10.1109/TMI.2006.884198. [Google Scholar] [CrossRef]
6. Dou, Q., Chen, H., Yu, L. Q., Qin, J., Heng, P. A. (2017). Multilevel contextual 3-D CNNs for false positive reduction in pulmonary nodule detection. IEEE Transactions on Biomedical Engineering, 64(7), 1558–1567. DOI 10.1109/TBME.2016.2613502. [Google Scholar] [CrossRef]
7. Suzuki, K., Doi, K. (2004). Massive training artificial neural network (MTANN) for detecting abnormalities in medical images. Chicago: The University of Chicago. [Google Scholar]
8. Patrick, P., Michel, G., Andrew, B. (2003). Poisson image editing. ACM Transactions on Graphics (TOG), 22(3), 313–318. DOI 10.1145/1201775.882269. [Google Scholar] [CrossRef]
9. Pickering, W. M. (1986). On the solution of poisson’s equation on a regular hexagonal grid using FFT methods. Journal of Computational Physics, 64(2), 320–333. DOI 10.1016/0021-9991(86)90036-7. [Google Scholar] [CrossRef]
10. Joseph, R., Ali, F. (2018). YOLOv3: An incremental improvement. arXiv e-prints: 1804. 02767v1. [Google Scholar]
11. Joseph, R., Santosh, D., Ross, G., Ali, F. (2016). You only look once: Unified, real-time object detection. IEEE Conference on Computer Vision and Pattern Recognition, Las Vegas, pp. 779–788. [Google Scholar]
12. Gavrielides, M., Phantom, F. D. A. (2016). The Cancer Imaging Archive. https://wiki.cancerimagingarchive.net/display//Public/RIDER+Lung+CT. [Google Scholar]
13. Gurcan, M. N., Sahiner, B., Petrick, N. (2002). Lung nodule detection on thoracic computed tomography images: Preliminary evaluation of a computer-aided diagnosis system. Medical Physics, 29(11), 2552–2558. DOI 10.1118/1.1515762. [Google Scholar] [CrossRef]
14. Zhang, X., Hoffman, E. A., Sonka, M. A. (2005). Complete CAD system for pulmonary nodule detection in high resolution CT images. Proceedings of SPIE–The International Society for Optical Engineering, 5747, 85–96. DOI 10.1117/12.594916. [Google Scholar] [CrossRef]
15. Ye, X., Lin, X., Dehmeshki, J., Slabaugh, G., Beddoe, G. (2009). Shape-based computer-aided detection of lung nodules in thoracic CT images. IEEE Transactions on Bio-Medical Engineering, 56(7), 1810–1820. DOI 10.1109/TBME.2009.2017027. [Google Scholar] [CrossRef]
16. Choi, W., Choi, T. (2013). Automated pulmonary nodule detection system in computed tomography images: A hierarchical block classification approach. Entropy, 15(2), 507–523. DOI 10.3390/e15020507. [Google Scholar] [CrossRef]
17. Setio, A. A., Ciompi, F., Litjens, G., Gerke, P., Jacobs, C. et al. (2016). Pulmonary nodule detection in CT images: False positive reduction using multi-view convolutional networks. IEEE Transactions on Medical Imaging, 35(5), 1160–1169. DOI 10.1109/TMI.2016.2536809. [Google Scholar] [CrossRef]
18. Liu, X., Hou, F., Qin, H., Hao, A. (2017). A CADe system for nodule detection in thoracic CT images based on artificial neural network. Science China Information Sciences, 60(7), 72–106. DOI 10.1007/s11432-016-9008-0. [Google Scholar] [CrossRef]
 | This work is licensed under a Creative Commons Attribution 4.0 International License, which permits unrestricted use, distribution, and reproduction in any medium, provided the original work is properly cited. |