| Molecular & Cellular Biomechanics |
DOI: 10.32604/mcb.2022.022658
ARTICLE
Comparison of Biomechanical Characteristics during the Second Landing Phase in Female Latin Dancers: Evaluation of the Bounce and Side Chasse Step
1Faculty of Sports Science, Ningbo University, Ningbo, 315211, China
2School of Health and Life Sciences, University of the West of Scotland, Scotland, G72 0LH, UK
3Department of Sport and Physical Education, Hong Kong Baptist University, Hong Kong, 999077, China
*Corresponding Author: Yaodong Gu. Email: guyaodong@nbu.edu.cn
Received: 19 March 2022; Accepted: 16 May 2022
Abstract: Research on dance lower extremity joint motion has been limited. Thus, the purpose of this study was to investigate the lower limb biomechanics differences between the side chasse step (SCS) and the bounce step (BS) of the second landing phase in Jive. Thirteen female recreational Latin dancers (Age: 22 ± 2.5 years; Height: 1.65 ± 0.05 m; Weight: 50 ± 4.5 kg; Dance experience: 4 ± 2 years) were involved in the experiment. The same music was used throughout the data collection period. We intended to determine whether these two steps generate different kinematic and kinetic data. The ankle, hip, and knee joint angle, moment, velocity, and ground reaction force were calculated for each step. Results demonstrated that the lower limb biomechanics of the two different steps showed significant differences. As a result, strengthening the lower limb muscles (gastrocnemius, Tibialis muscle, and quadriceps) is significantly important to balance the joint strength and prevent foot injury. According to the training time reasonably increasing the heel height should be recognized as important. The current study could provide new insights into reducing lower extremity injuries and improving dance performance.
Keywords: Latin dance; lower limb injury; step kinetics; kinematics
In the 1960s, Sports dance normatively developed from art and sports and has become a popular dance globally [1]. Latin dance, as a category of Sports dance, due to fierce competition, requires high levels of physiological movement of muscles, resulting in injury occurring frequently [2]. Biomechanical analysis has been applied to various types of dancing which including flamenco [3], ballet [4], samba [2], and swing dance [5]. Nevertheless, less research has been done on the Jive, which is a part of Latin dance [6]. Latin dance is a very vigorous dance requiring repeatedly ankle bouncy movements, lifting the knees, and bending or rocking the hips [7]. During the competition, Jive is dancing occurs at a rate of 176 beats per minute, although in some cases this is reduced to between 128 and 160 beats per minute. This type of movement on each limb causes high joint loading with the potential for lower limb injuries. A good understanding of the biomechanical relationships between dancers and the environment is essential to improving training and dance performance [8]. Despite the growing popularity of Latin dance, our theoretical knowledge of associated biomechanics is limited [7].
Previous articles [9,10] suggested that the most vulnerable part of a dancer was the lower limbs. The movements involved in dancing, perhaps, could be responsible for the types of injuries observed [11]. Bouncing is one of the most basic movements used in Jive. The strength of the bounce mainly comes from the combined joint work of the forefoot, ankles, and calves. Repeated flexion and extension of the knee and dorsiflexion and plantarflexion of the ankle of one leg during BS were needed to produce a “free fall” descent. This occurs while the center of mass is supported by the forefoot of the leg. The rhythm of this step can be described as 1-2 3-a-4 5-a-6. During this sequence, the center of mass always follows the dancer’s dominant leg. Another overlooked basic component of Jive dancing is completing the SCS by swinging the hips. This is also based on a simple six-beat sequence: 1-2 3-a-4 5-a-6. The count begins with the rock step (left foot step back, right foot in place), followed by the two triple steps (chasse) that are counted: 3-a-4, 5-a-6. These are two basic elements in Jive, which do not only aim to follow the high-frequency music and show different styles but as a competitive dance, it also requires additional techniques.
There is a certain similarity in the two basic steps in jive such as the same music rhythm. However, it is worth mentioning that bouncing and swinging are the most important movements and basic, but they can easily produce fatigue and injury in Jive. Thus, from a biomechanical point of view, the interaction between the floor and the foot are preconditions to completing these two steps perfectly [12]. Biomechanics is the study of normal mechanics (kinetics and kinematics) used in the musculoskeletal system by analyzing forces and their effects on anatomical structures [13,14]. This theory has been widely used in various fields except for the Jive used in Latin dance.
However, there are few studies on the lower extremity biomechanics of two steps. Therefore, the main purpose of this study was to measure the lower limb biomechanics differences in sport dancing players in the movement of the landing phase in the SCS and BS. We hypothesized that kinetics measurement would be different between two dancing conditions based on discussion with Dance athletes. Specifically, we hypothesized that the hip angle of the two steps would provide significant differences. As a result, we hoped to conclude that information could be provided to dance trainers and athletes to improve technique and therefore prevent dance injury.
The sample size was calculated using the G-Power software (Version. 3.1.9.7; Henley University Dusseldorf, Dusseldorf, Germany). A power analysis for single-sample t-test analysis of variance was performed for an effect size of 0.8 (significance level: 0.05; power: 0.08). The power analysis indicated that thirteen female recreational Latin dancers (age: 22 ± 2.5 years; Height: 1.65 ± 0.05 m; Weight: 50 ± 4.5 kg; Training experience: 4 ± 2 years), were included in the study. Any dancers with known cardiovascular, neurological, or musculoskeletal conditions were excluded from the study. All participants included practiced Latin dance in classes three times a week for at least four years. All participants, having had the purpose and procedures of the experiment explained to them, read, and signed an informed consent form. Ethical permission for the study was granted by the Ethical Institutional Review Board of Ningbo University. This was obtained prior to any participation in the study (protocol code: RAGH20210918).
Latin shoes were selected randomly by participants. There were three different sizes used, but all had the same heel height, were the same brand and were made from the same materials. Typical dancing shoes are made from leather. Women’s Latin dance shoes are lightweight, flexible, and have suede soles, which provide the right blend of grip and slide for moving across the floor [15]. An illustration of the dance shoe is provided in Fig. 1a.
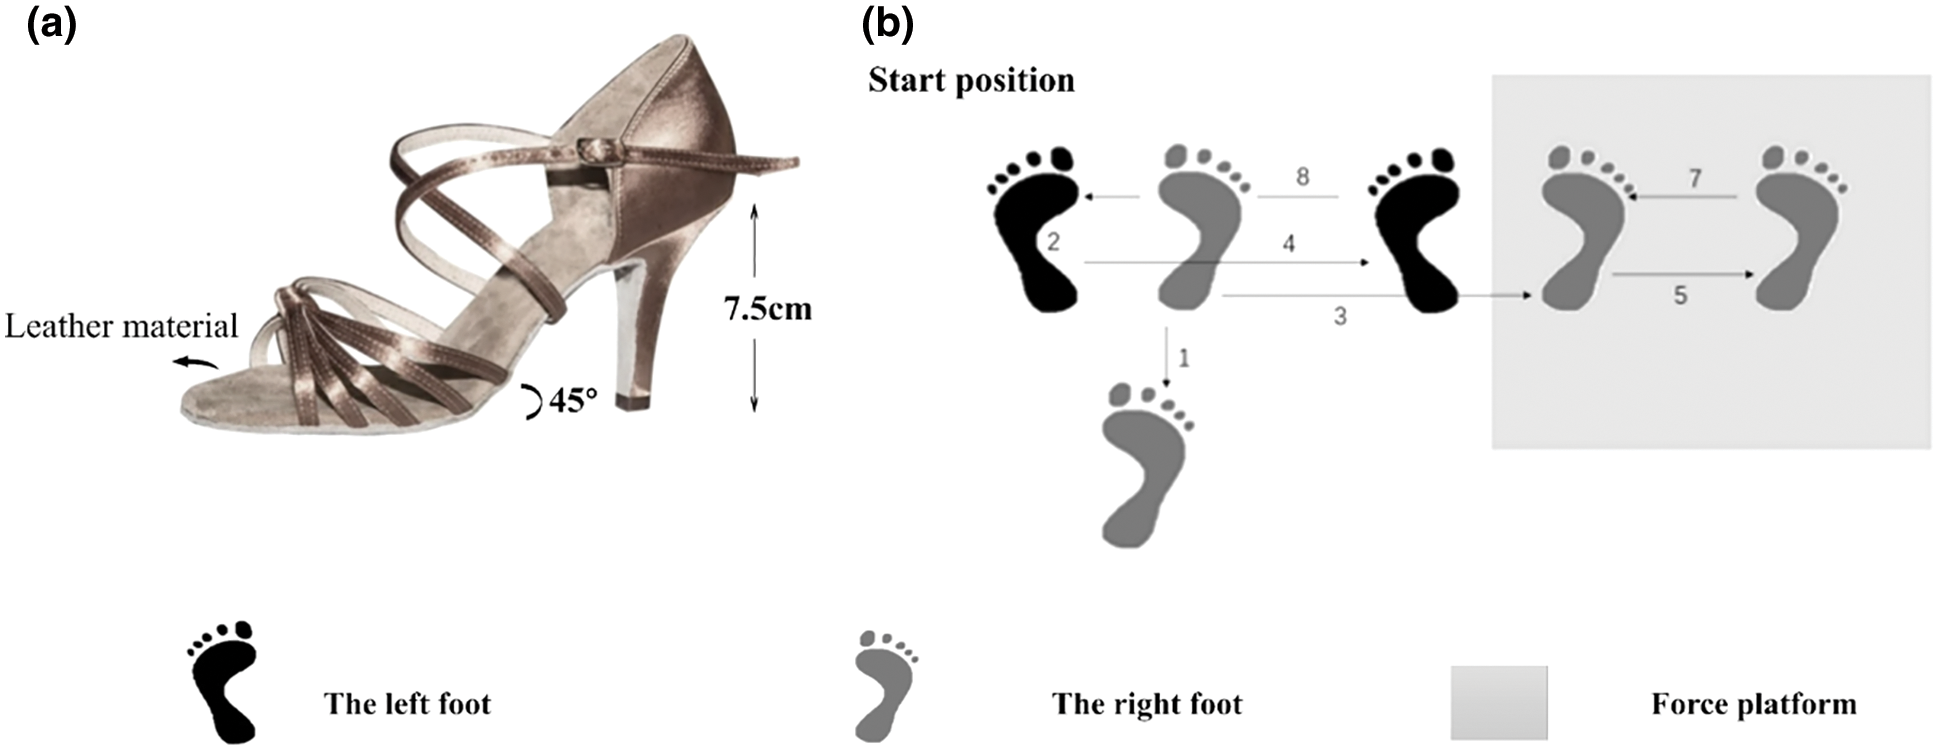
Figure 1: a) illustration of standard footwear with 7.5 cm high-heeled and leather fabric. b) illustration of experiment design for collecting the kinematics and kinetics data during the BS and SCS. The numbers 1–8 represent the sequence of the step (BS: Bounce step; SCS: Side Chasse step)
All tests of this study were performed in the Biomechanics Laboratory of Ningbo University Research Academy of Grand Health. A motion capture system (Oxford Metrics, Ltd., Oxford, UK) with eight cameras and a force plate (Kistler, Switzerland) placed in the middle of the cameras embedded in the floor which used to collect the kinematics and kinetics data for each participant (data collection of the kinetics and kinematics were synchronized). The kinematics and kinetics data were captured at frequencies of 200 and 1000 Hz, respectively.
After changing into tightly fitted clothing and standardized Latin shoes, standard anthropometric measurements of participants were taken including body height and mass, leg length, and knee and ankle width. Following a ten-minute warm-up and five-minute familiarity with the laboratory, 20 retroreflective markers and four tracking clusters were applied to anatomical landmarks on the participants’ bodies based on a modified Double-6DOF marker set [16,17].
The test was randomly divided into two parts: the BS test and the SCS test. Before the dynamics data test, statics coordinates were captured by asking each participant to stand parallel to the Y-axis of the force platform whilst crossing their arms on the shoulder with eyes looking forward. During the kinematics and dynamics data collection, hands were put on the waist, to reduce experimental error, and two sessions of step testing were used with the same frequency of music which was familiar to all participants. Participants performed BS and SCS respectively in random order. In Latin dance, both BS and SCS have shown a significant similarity with each other, reflected in their direction and number of steps. The starting position of BS and SCS was executed from the right foot, and the sequence used is briefly outlined here. The first and second steps landed on the force plate, and the third and fourth steps landed outside the plate. Using the left leg (Fig. 1b). 1) subjects then stepped back with the right foot, and the left foot remains in place, then the weight shifted onto that leg. 2). A sidestep to the force plate takes place with the right foot. 3) a small step from the left foot to the right foot. 4). A sidestep to the right using the right foot. 5) Left foot is in place, then the weight shifts onto the left foot. 6) Sidestep to the left using the right foot. 7) Sidestep to the left with the right foot and sidestep left with the left foot after the right foot touches the ground.
However, a technical difference existed between the two steps. For BS, repeated flexion and extension of the knee were required in dancers, an extension of the knee was needed in the first and third steps when the forefoot landed on the ground. The leg was then lifted as fast as possible until landing on the ground. For SCS, more hip swing was involved to complete the dance moves. This study focuses on the landing phase of each participant in the second landing phase in SCS and BS (the right foot landing phase), due to the strong guidance pattern of the lower right leg being more common in this group of female dancers [18]. A total of five successful trials were collected for each subject, excluded data where the right foot landing outside the force plate or the action did not meet the criterion formulated by a professional dance athlete.
2.5 Data Collection Processing
All outcome measures were calculated over the determined second landing phase of the right foot. The landing stage was defined as the right foot’s initial contact with the force platform until the right foot leaves the force platform. Then, the initial contact was defined as the vertical ground reaction force exceeding 10 N [19]. The data of lower extremity joint angle, velocity, moment, and GRF in three planes (sagittal, frontal, and transverse) were recorded during the entire landing phase of the two steps.
Three planes were analyzed. The three joints were defined as follows: we defined the flexion as a positive value (adduction, internal rotation); the extension defined as a negative value (abduction, external rotation). The GRF was determined as the bodyweight of each participant.
Both the kinematics and GRF data for each participant were acquired from Vicon Nexus 1.8.6 software and then exported into a c3d format file then imported to visual 3D software for static modeling. The residual analysis of vertical ground reaction force (VGRF) was put into effect in the subsets to determine which was the most appropriate signal-to-noise ratio. The data of VGRF and kinematics were filtered by 10 and 20 Hz fourth-order zero-phase lag Butterworth low-pass filters based on Winter’s description of the selected frequency of the filter [20].
All of the data were imported into the MATLAB R2021a (The MathWorks, MA, USA), then a coda edit was employed for further analysis. All statistical analysis was performed in SPSS. Before formal analysis, the normality test was inspected for all variables using Shapiro Wilk Test. For the non-parametric, Wilcoxon matched-pairs signed-rank test was used for it. Whilst, single sample t-test (SPSS Inc., Chicago, IL) was applied to assess data differences for kinematic and kinetic parameters between different step strategies.
Meanwhile, Statistical Parameter Mapping (SPM) was used to analyze the kinematic and dynamics time-series curves, which has been widely used in biomechanical research [21–23]. SPM is a method for comparing the complete time series curves by considering the correlation of adjacent time points when calculating the appropriate significance threshold [24,25]. All kinematic kinetic variables in these two steps were extracted in the One-Dimensional Statistical Parametric Mapping (SPM1D) analysis. Then, a data point expanded into a timing series curve of 101 data points using a customized MATLAB script. We used the open-source SPM1d script of the single-sample t-test for statistical analysis, 0.05 was the significance alpha level setting [24,25].
Respecting the analysis of traditional discrete variables, the customized MATLAB script was written to extract all data from the second landing phase of the BS and SCS. Using SPSS 25.0 for Windows software (IBM, Armonk, NY, USA), all analyses of traditional discrete variables were carried out by it.
3.1 Statistical Parametric Mapping
For the time of the landing phase, there were no differences (P = 0.38) between SCS (189.6 ± 20.2 m/s) and BS (191.7 ± 22.9 m/s) landing phase. For the flight time of the landing phase, there were no significant differences (P = 0.10) between SCS (0.72 ± 0.06 s) and BS (0.69 ± 0.05) landing phase.
Differences were found between the two steps. The initial contact of the right leg on the force plate was defined as the landing phase. Figs. 2–4 show the SPM analysis using single-sample t-tests between BS and SCS. Fig. 5 displayed significant differences found in sagittal, frontal, and transverse ground reaction force.
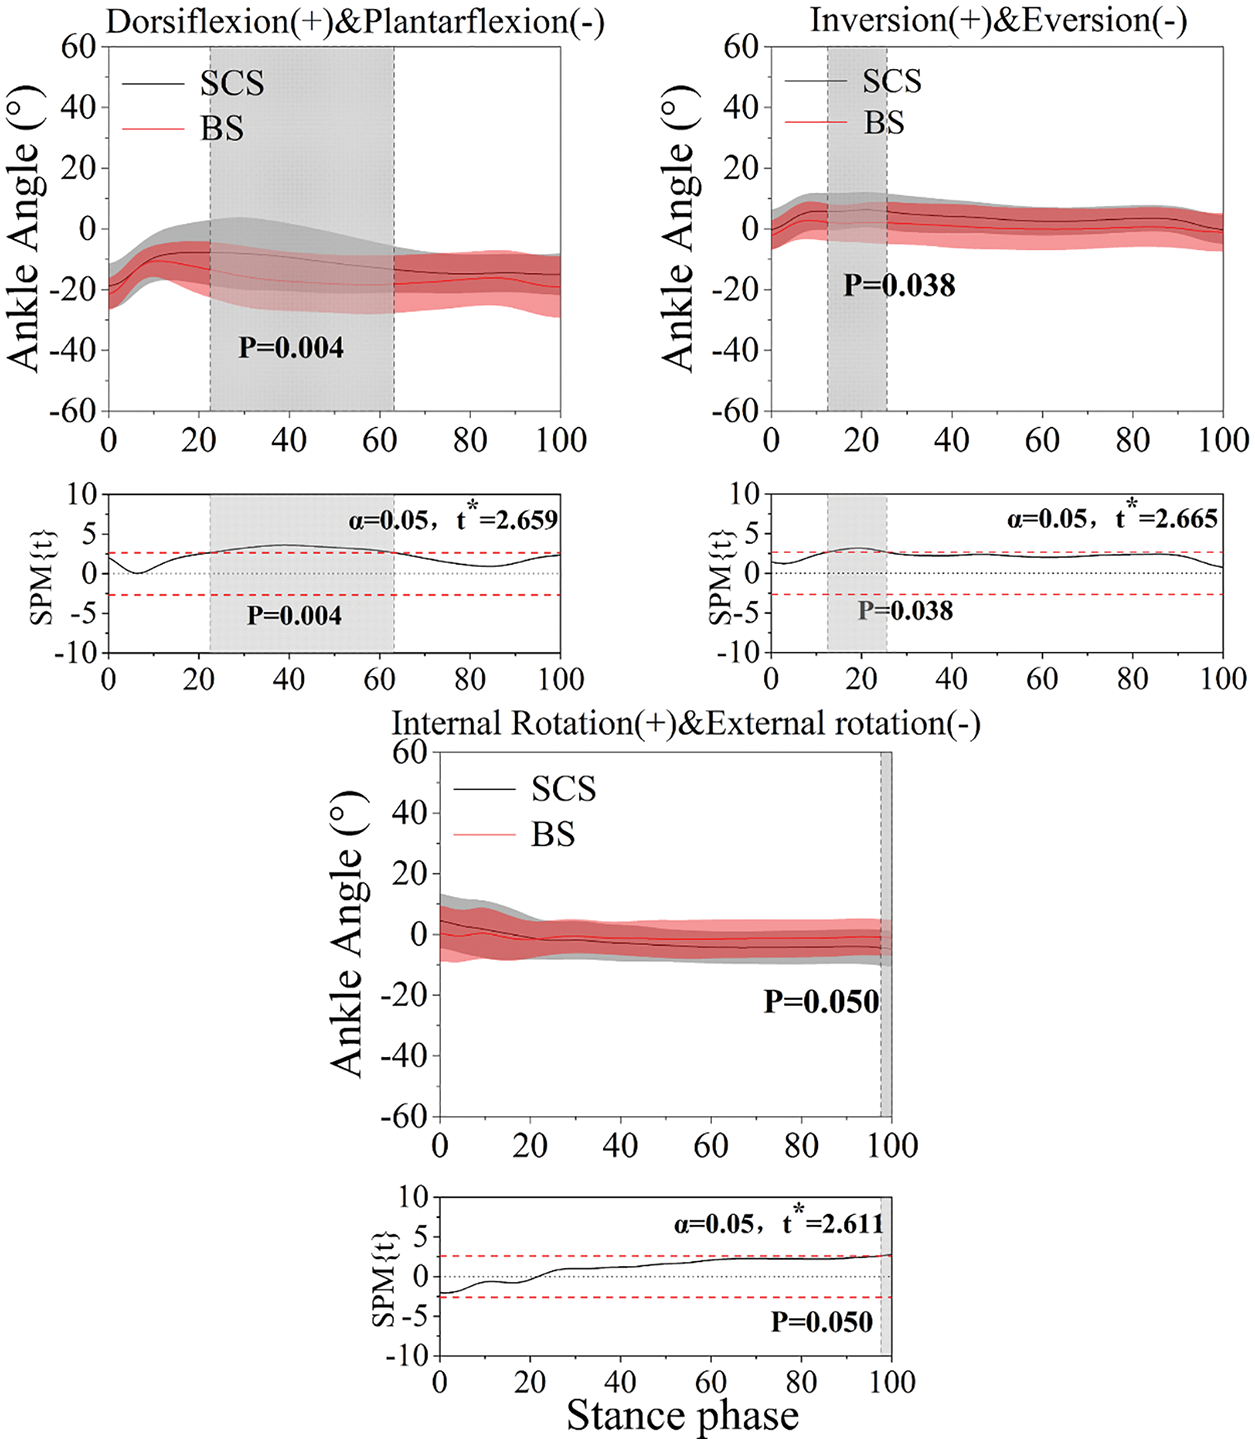
Figure 2: Display the mean and standard deviation on lower limb joint angle over the landing phase of the BS and SCS conditions in sagittal, frontal, and transverse planes during the landing phase. Statistically significant differences in the step, time, and interaction (P < 0.05) and values of t* of the SPM for all participants are highlighted (grey shaded areas) at the bottom of each picture. The value of 0%–100% below in each image presents a landing phase (BS: Bounce step; SCS: Side Chasse step)
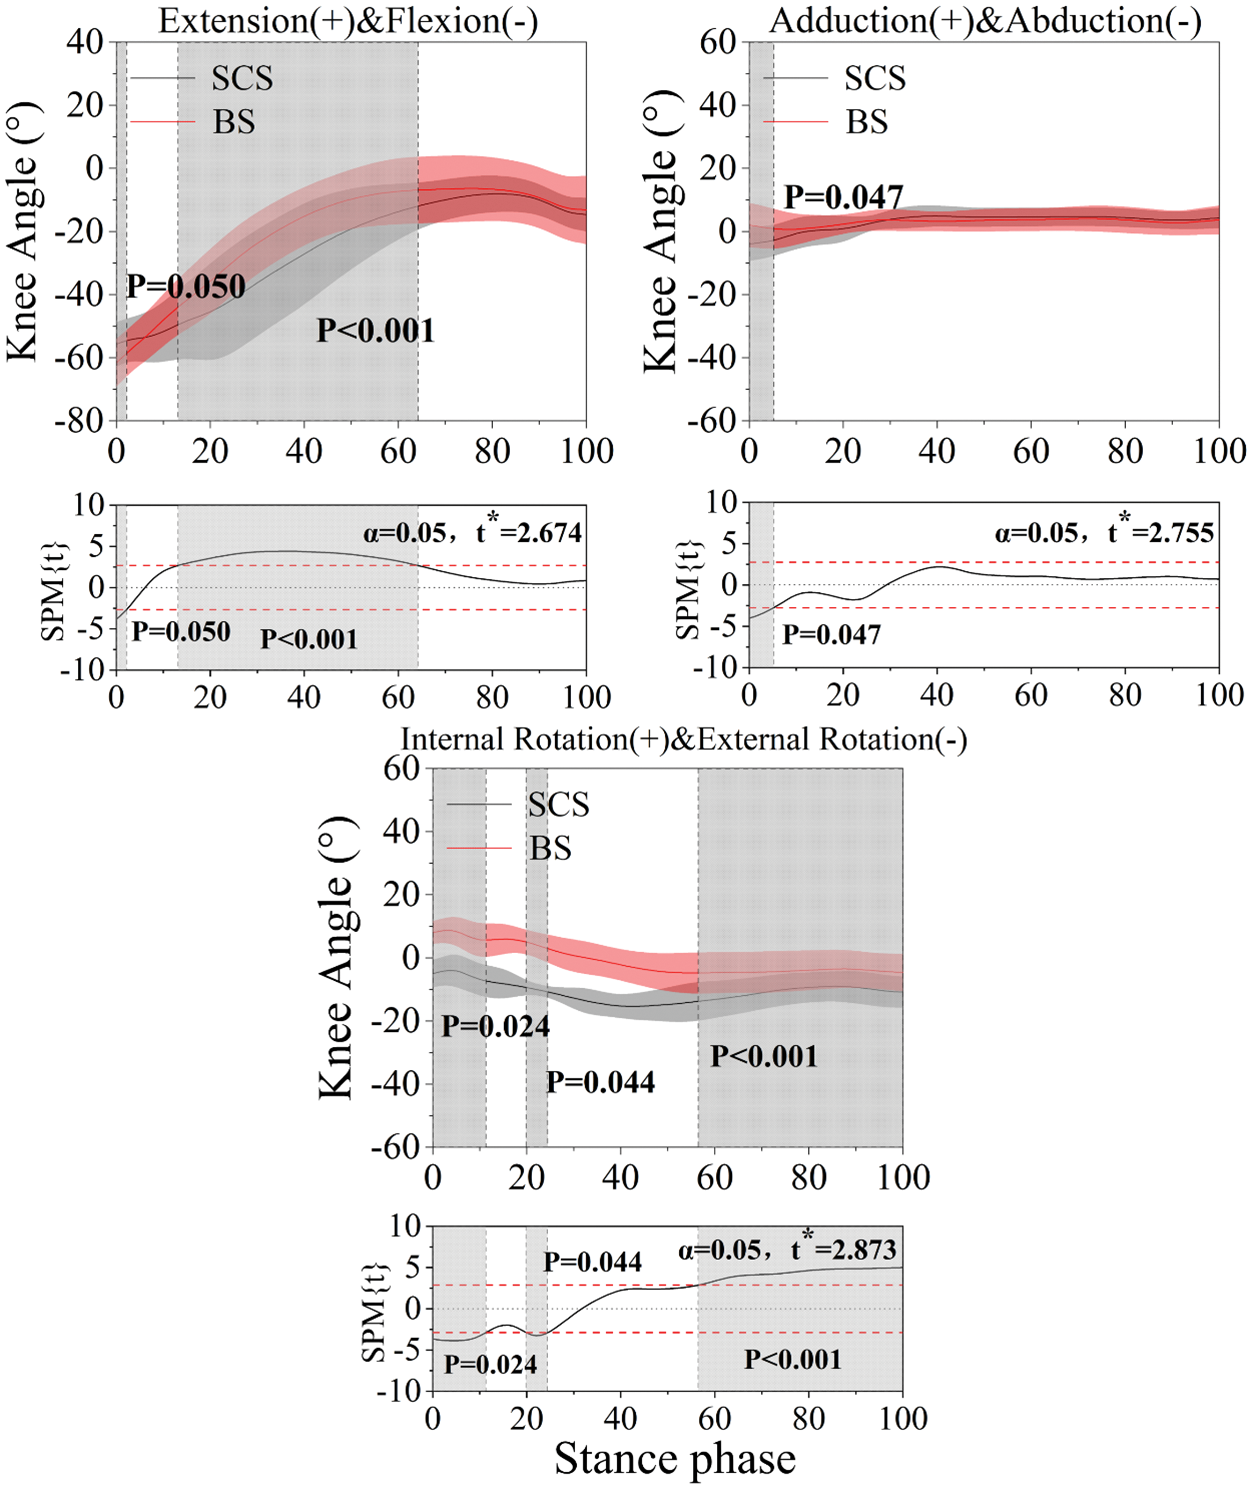
Figure 3: Display the mean and standard deviation on lower limb joint moment over the landing phase of the BS and SCS conditions in the sagittal, frontal and transverse plane during the landing phase. Statistically significant differences in the step, time, and interaction (P < 0.05) and values of t* of the SPM for all participants are highlighted (grey shaded areas) at the bottom of each picture. The value of 0%–100% below in each image presents a landing phase (BS: Bounce step; SCS: Side Chasse step)

Figure 4: Display the mean and standard deviation on lower limb joint velocity over the landing phase of the BS and SCS conditions in the sagittal, frontal, and transverse plane during the landing phase. Statistically significant differences in the step, time, and interaction (P < 0.05) and values of t* of the SPM for all participants are highlighted (grey shaded areas) at the bottom of each picture. The value of 0%–100% below in each image presents a landing phase (BS: Bounce step; SCS: Side Chasse step)

Figure 5: Descriptive results between BS and SCS lower-limb statistical parametric mapping results for vertical ground reaction force, sagittal ground reaction force, and frontal ground reaction force during the landing phase of the second step in this test. for all participants, t-values of the SPM (post hoc results, dashed red lines represent P = 0.05 level). Statistically significant differences were shown in the grey shaded areas. The bottom of each picture displays the change in the joint angle and the value of t*. The scale of 0–100 below each image presents a landing phase in two steps (BS: Bounce step; SCS: Side Chasse step)
3.1.1 Ankle, Knee, and Hip Angle
Fig. 2 had shown that BS revealed a significantly greater ankle plantarflexion than SCS during the 22.43%–63.21% (SCS: −21.53°∼−6.24°, BS: −25.24∼−7.93, P = 0.004) landing phase, a significantly smaller knee flexion than BS during the 13.10%–64.20% (SCS: 7.47°∼56.25°, BS: 5.56°∼61.55°, P < 0.001), landing phase, and smaller hip flexion than BS during the 3.56%–56.54% (SCS: 34.14°∼2.58°, BS: 33.92°∼2.45°, P < 0.001) landing phase; a larger ankle inversion and hip abduction were found during the 12.46%–25.58% (SCS: 7.54°∼−3.63°, BS: 5.33°∼−4.41°, P = 0.038) and 37.99%–96.54% (SCS: 14.96°∼−13.79°, BS: 8.53°∼−5.84°, P = 0.047) SCS landing phase, a greater knee abduction and external rotation were found during the 0%–5.19% (SCS: 5.51°∼−3.64°, BS: 7.25°∼−2.02°, P = 0.047) and 56.45%–100% (SCS: −11.85°∼13.59°, BS: −7.43°∼9.82°, P < 0.001) BS landing phase.
3.1.2 Ankle, Knee, and Hip Moment
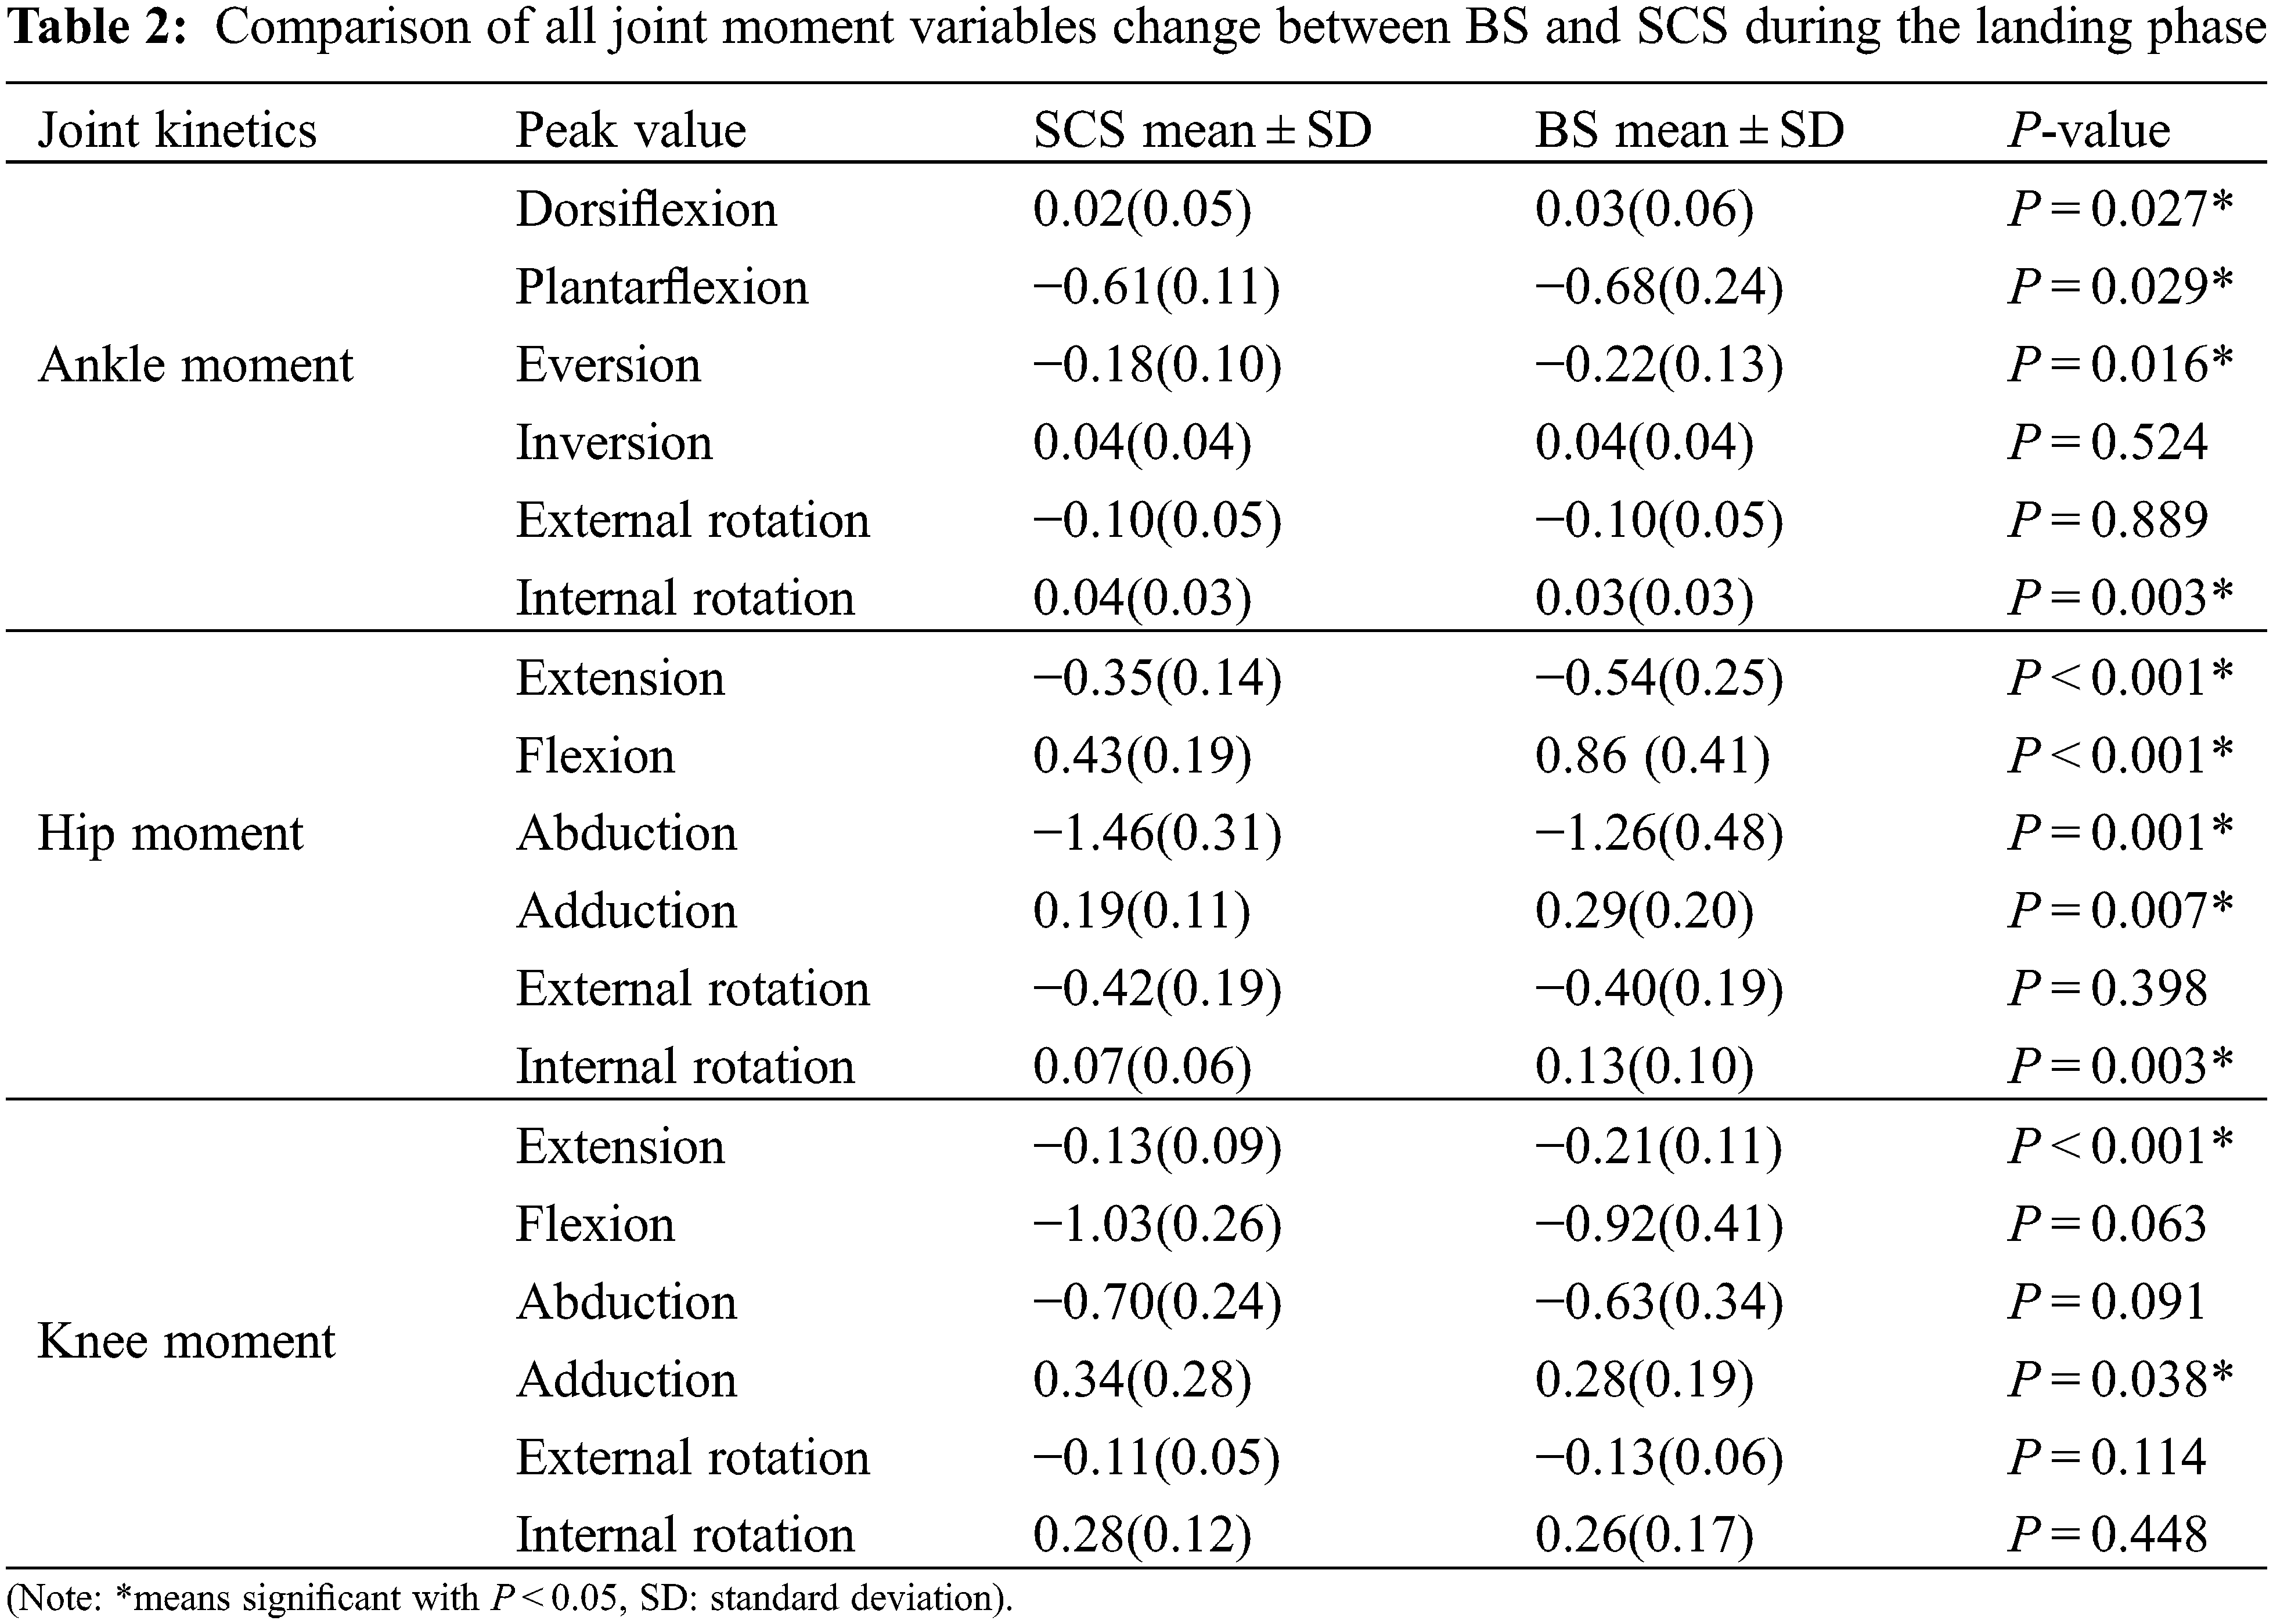
Fig. 3 had shown that SCS depicted a significantly larger ankle plantarflexion moment during the 27.81%–54.92% (SCS: −0.61∼0.02 Nm/kg, BS: −0.68∼0.03 Nm/kg, P = 0.007) landing phase; BS depicted a significantly greater knee extension moment (SCS: −0.13∼−1.03 Nm/kg, BS: −0.92∼−0.21 Nm/kg, P = 0.047) and hip flexion moment during the 4.29%–6.09% and 3.12%–6.05% (SCS: −0.35∼0.43 Nm/kg, BS: −0.54∼0.86 Nm/kg, P = 0.017) landing phase. There is a significantly greater hip abduction moment was found during the 34.10%–68.24% (SCS: −1.46∼0.19 Nm/kg, BS: −1.26∼0.29 Nm/kg, P < 0.001) SCS landing phase. BS depicted a significantly greater ankle external rotation moment and a smaller knee internal rotation during the 6.11%–27.00% (SCS: −0.10∼0.04 Nm/kg, BS: −0.10∼0.03 Nm/kg, P < 0.001) and 30.10%–58.54% (SCS: −0.11∼0.28 Nm/kg, BS: −0.13∼0.26 Nm/kg, P < 0.001) landing phase.
3.1.3 Ankle, Knee, and Hip Velocity
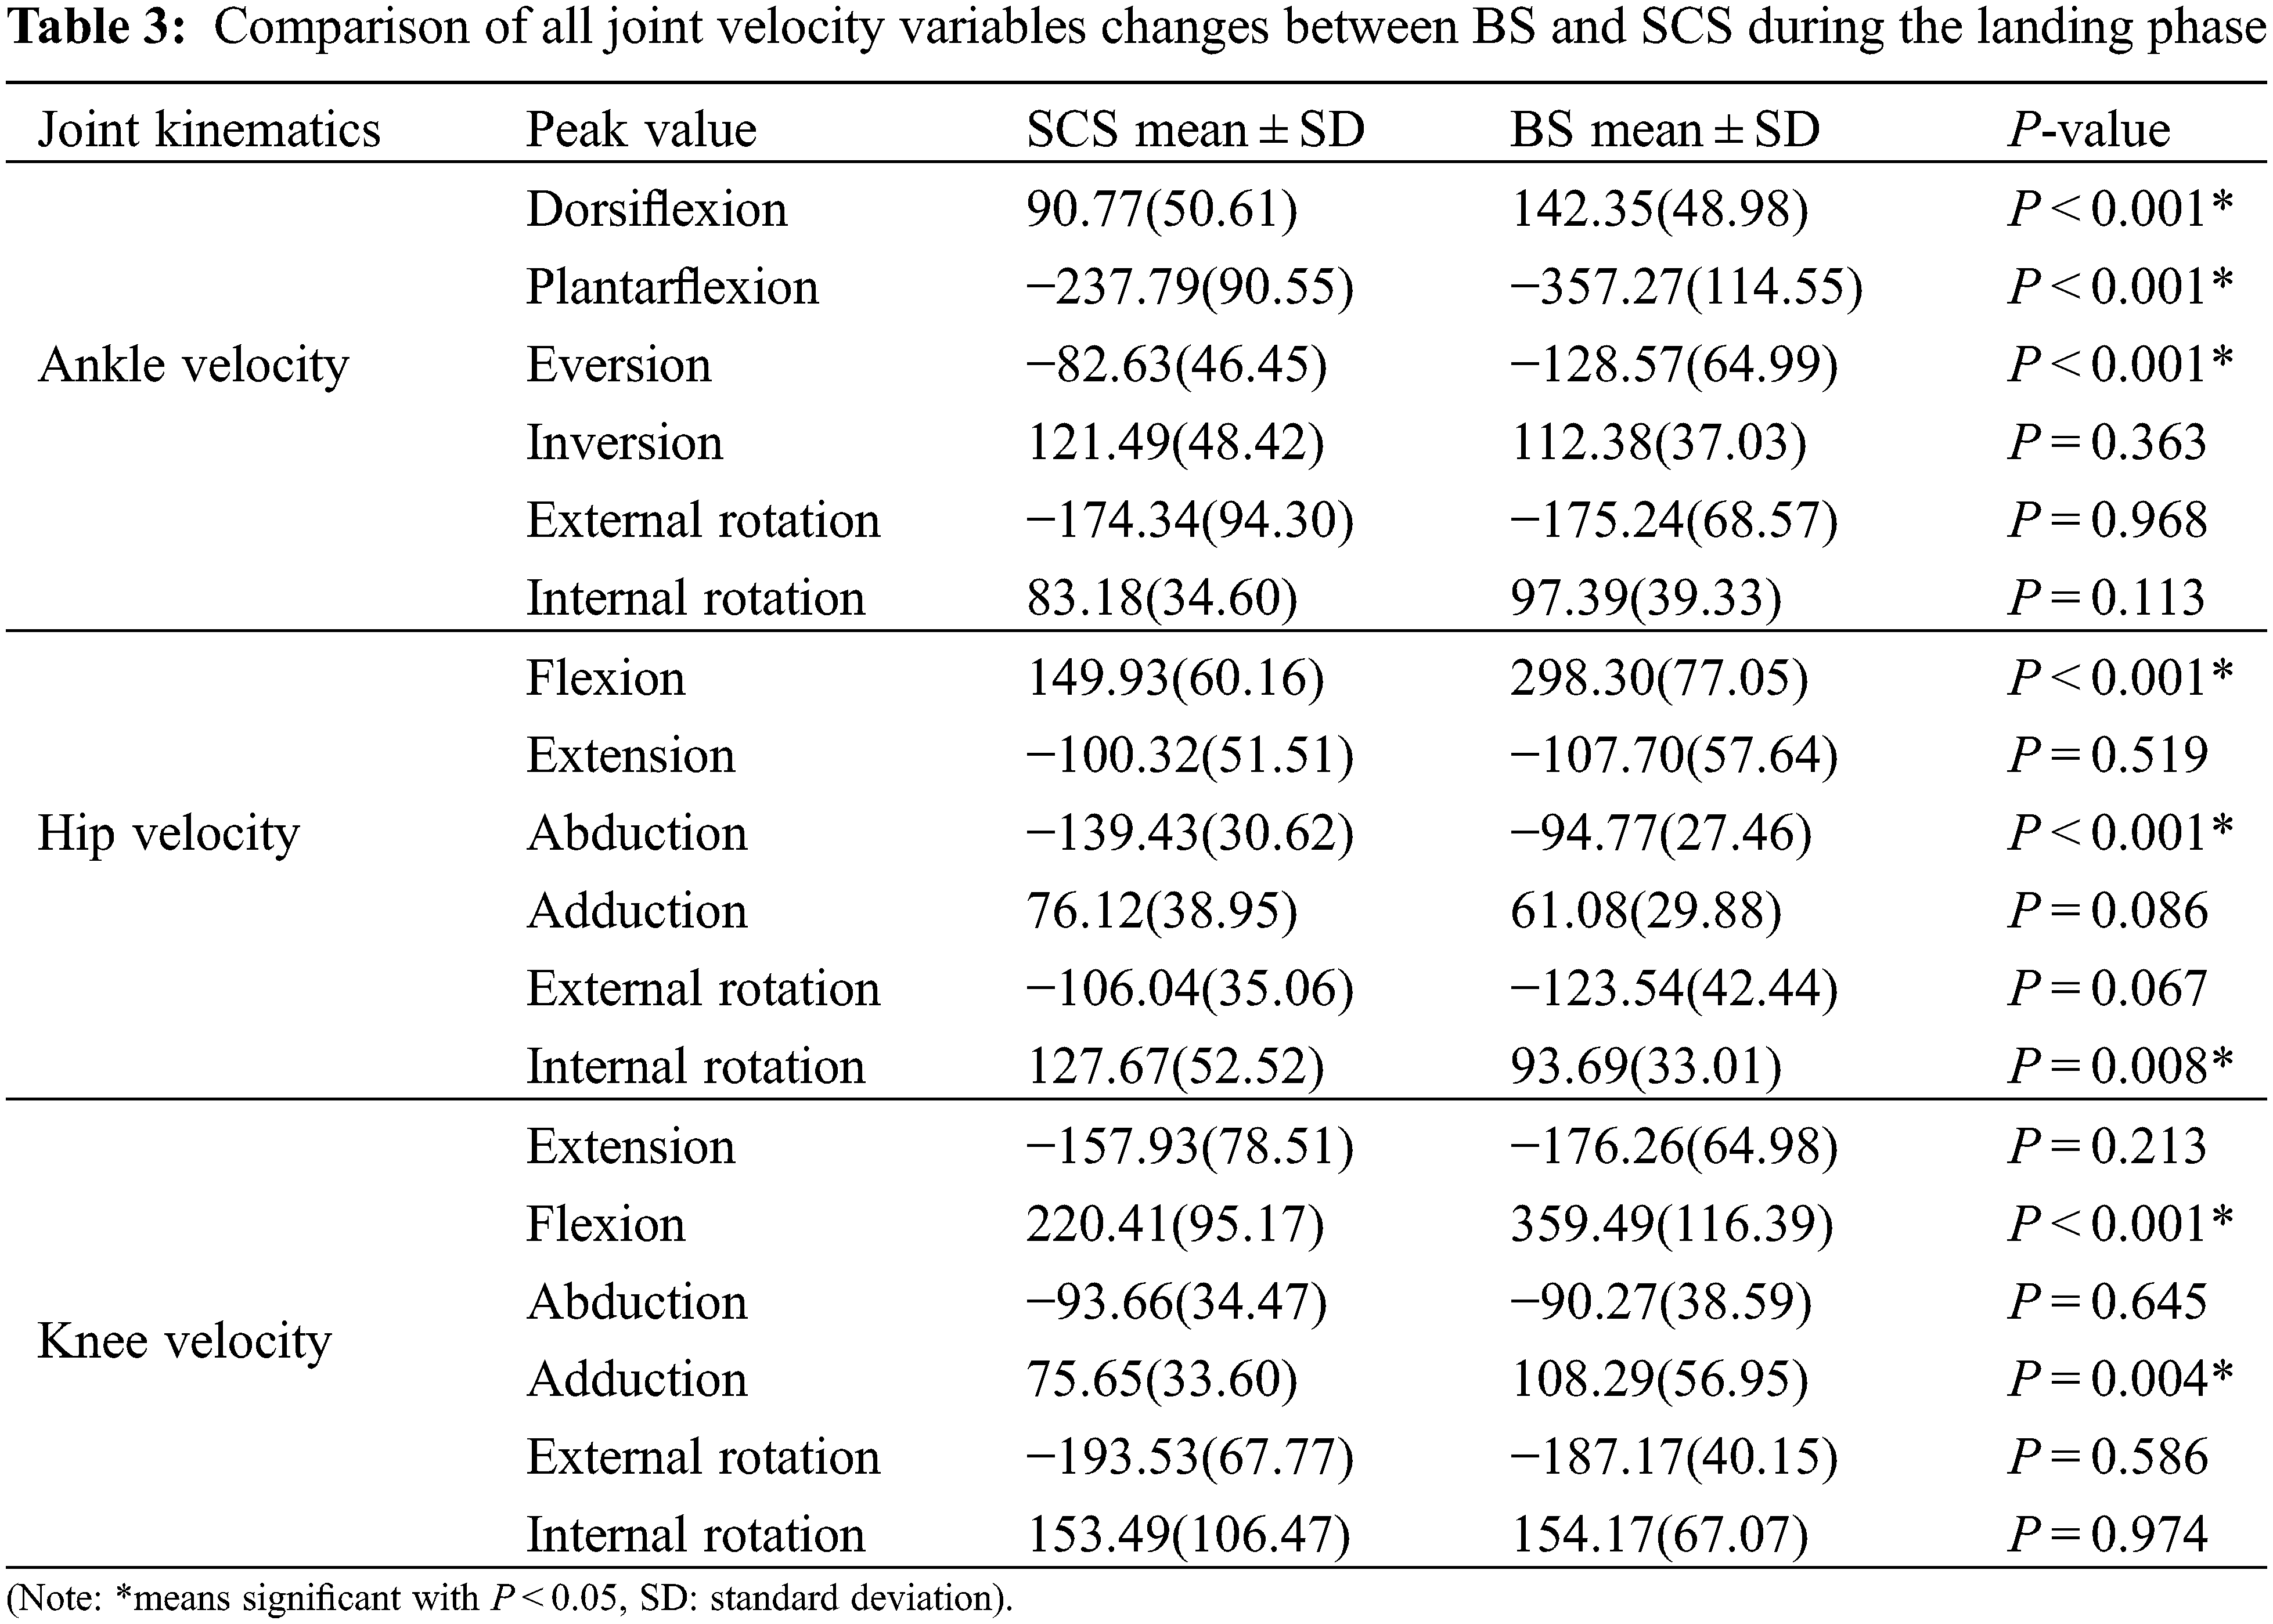
Fig. 4 had shown that BS revealed larger ankle dorsiflexion than SCS during the 8.59%–30.43% (SCS: −237.79°/s∼90.77°/s, BS: −357.27°/s∼142.35°/s, P < 0.001) landing phase, a greater knee extension velocity than SCS during the 0%–27.10% (SCS: −157.93°/s∼220.41°/s, BS: −176.26°/s∼359.49°/s, P < 0.001) landing phase, and a larger hip flexion velocity than SCS during the 0%–10.44% (SCS: −100.32°/s∼149.93°/s, BS: −107.70°/s∼298.30°/s, P = 0.001) landing phase. SPM revealed that SCS depicted a greater hip abduction velocity than BS during the 69.54%–100% (SCS: −139.43°/s∼76.12°/s, BS: −94.77∼61.08°/s, P < 0.001) landing phase. BS depicted a greater hip external rotation velocity than SCS during the 0%–8.66% (SCS: −106.04°/s∼127.67°/s, BS: −123.54°/s∼93.69°/s, P < 0.001) landing phase.
Fig. 5 revealed that BS depicted a greater VGRF than SCS during the 1.10%–11.43% (SCS: 1.12, BS: 1.26, P < 0.001) landing phase. SCS depicted a larger medial GRF than BS during the 30.85%–72.40% (SCS: −0.09∼0.09, BS: −0.13∼0.13, P < 0.001) landing phase.
Using single-sample t-test to compare the lower limb kinematics (peak angle, peak angular velocity) and kinetics (peak moment, peak GRF) differences between the two steps during the second landing stage.
3.2.1 Peak Value of Joint Angle
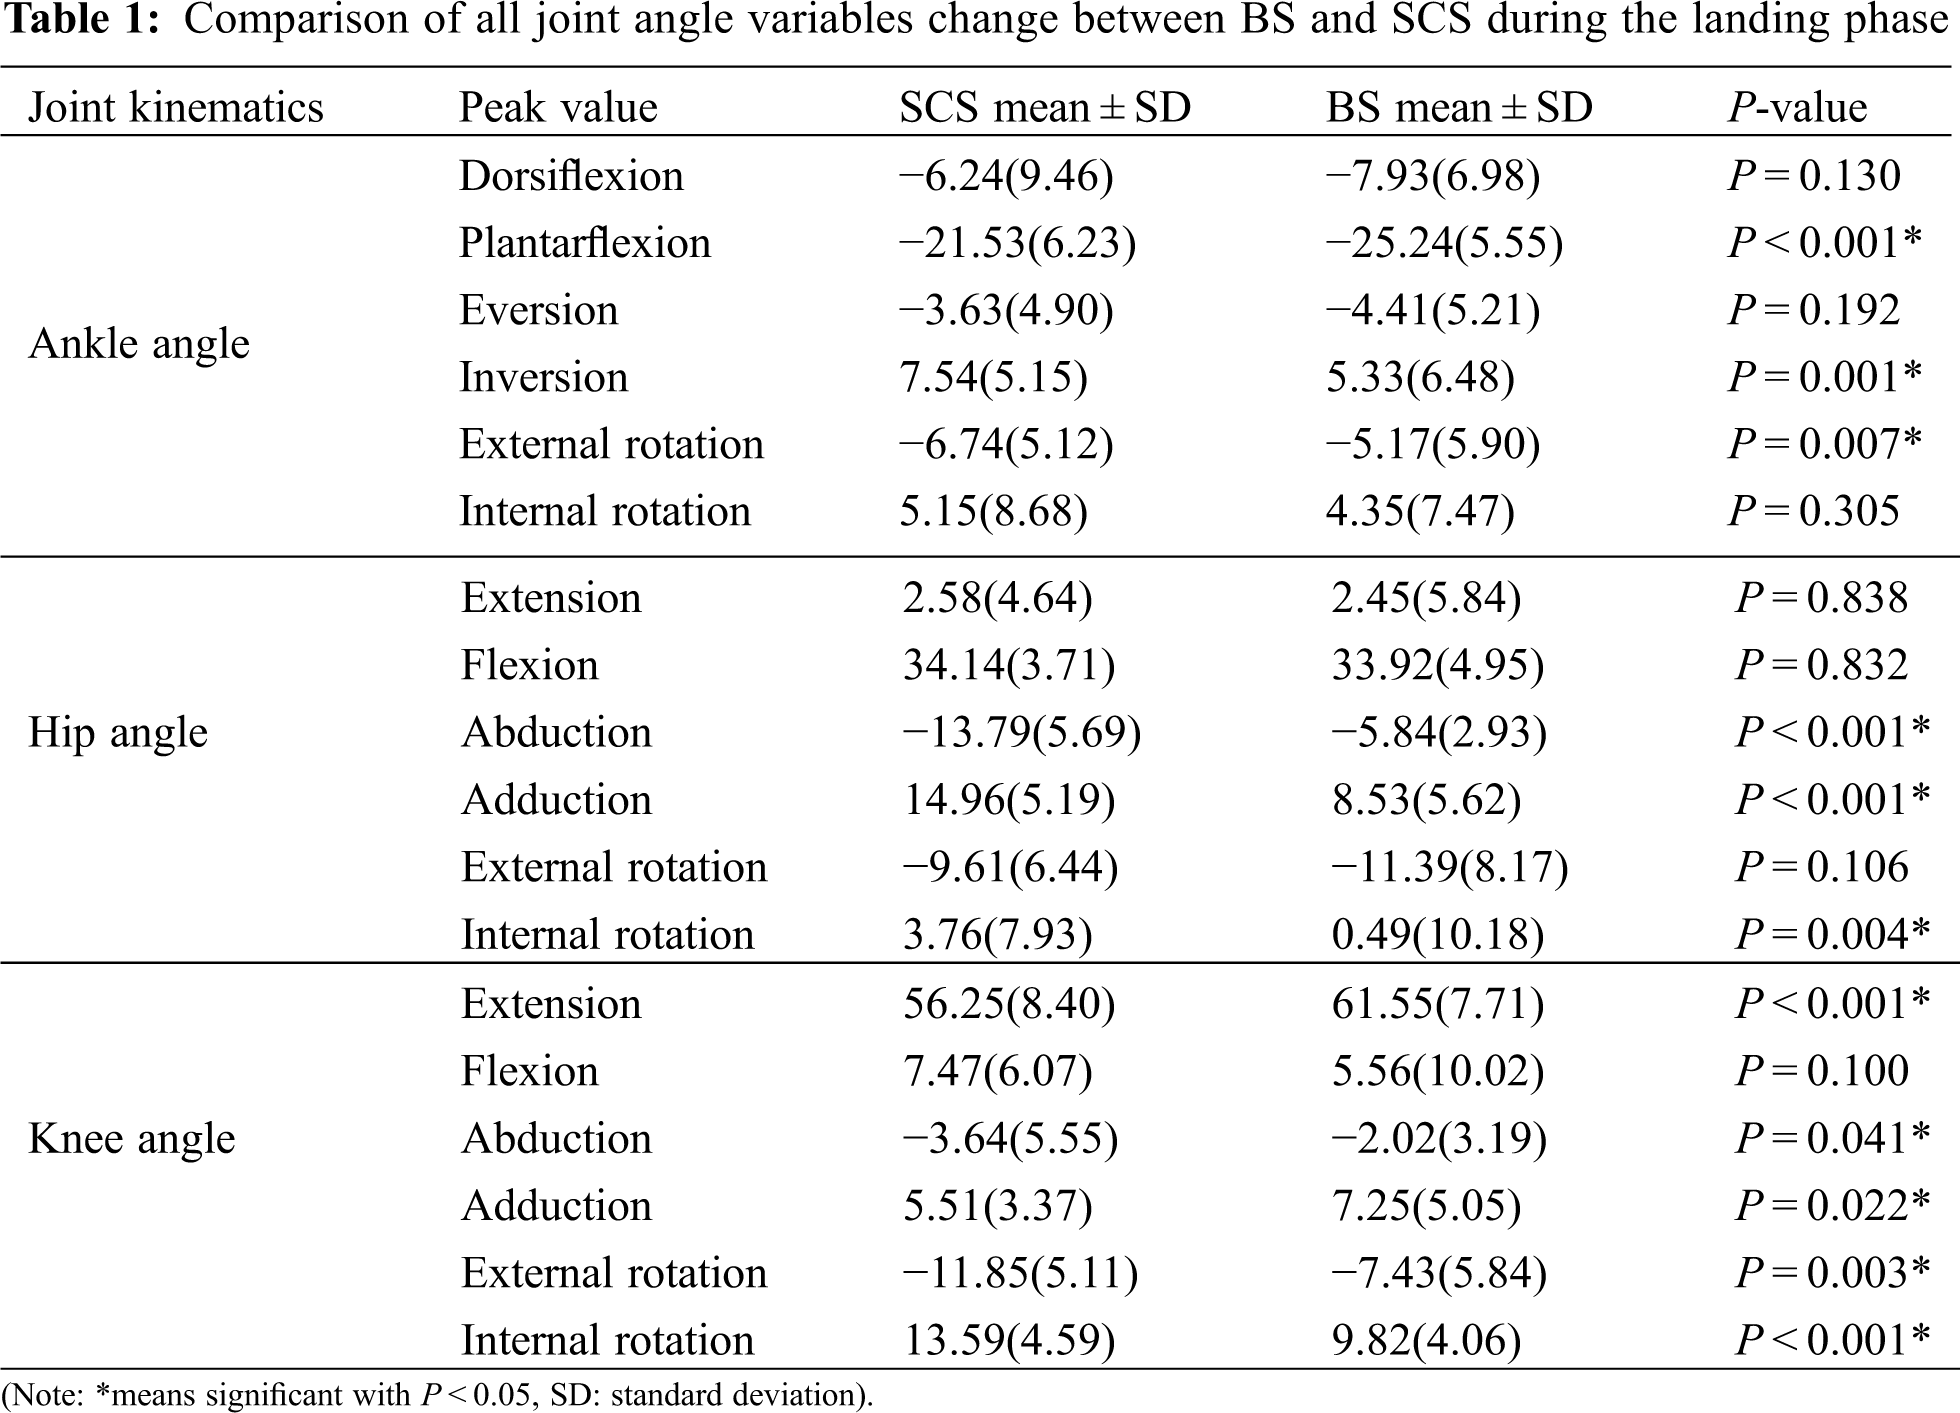
For the ankle joint angle, Table 1 displayed that BS depicted a significantly greater peak plantarflexion (P < 0.001), SCS depicted a significantly larger inversion (P = 0.001), and SCS depicted a larger external rotation (P = 0.007). There is a significantly larger hip peak abduction (P < 0.001) in SCS, adduction (P < 0.001) in BS, internal rotation (P = 0.004) in SCS. For the knee angle, Table 1 depicted a significantly greater extension (P < 0.001) in BS, a smaller abduction (P = 0.041) in BS, significantly greater adduction (P = 0.022) in BS, a small external rotation (P = 0.003), and a larger internal rotation (P < 0.001) in BS.
3.2.2 Peak Value of the Joint Moment
For the joint moment, Table 2 displayed that BS depicted a significantly larger ankle peak dorsiflexion (P = 0.027) and plantarflexion (P = 0.029); there is a significantly greater ankle peak eversion (P = 0.016) in BS, a significantly greater peak internal rotation (P = 0.003) in SCS. For the hip joint moment, a significantly greater peak extension (P < 0.001), flexion (P < 0.001), internal rotation (P = 0.003) and adduction (P = 0.007) in BS, a significantly greater abduction (P = 0.001) in SCS. For the knee joint moment, Table 2 depicted a significantly larger peak extension (P < 0.001) in BS, and a smaller adduction (P = 0.038) in SCS.
3.2.3 Peak Value of Joint Velocity
For the ankle joint velocity, Table 3 had shown that BS depicted a significantly greater peak dorsiflexion (P < 0.001), plantarflexion (P < 0.001), and eversion (P < 0.001). For the hip velocity, we found that BS depicted a significantly larger peak flexion (P < 0.001) and internal rotation (P = 0.008), and SCS depicted a smaller abduction (P < 0.001). For the knee joint velocity, a significantly greater peak flexion (P < 0.001), and adduction (P = 0.004) were found in the BS.
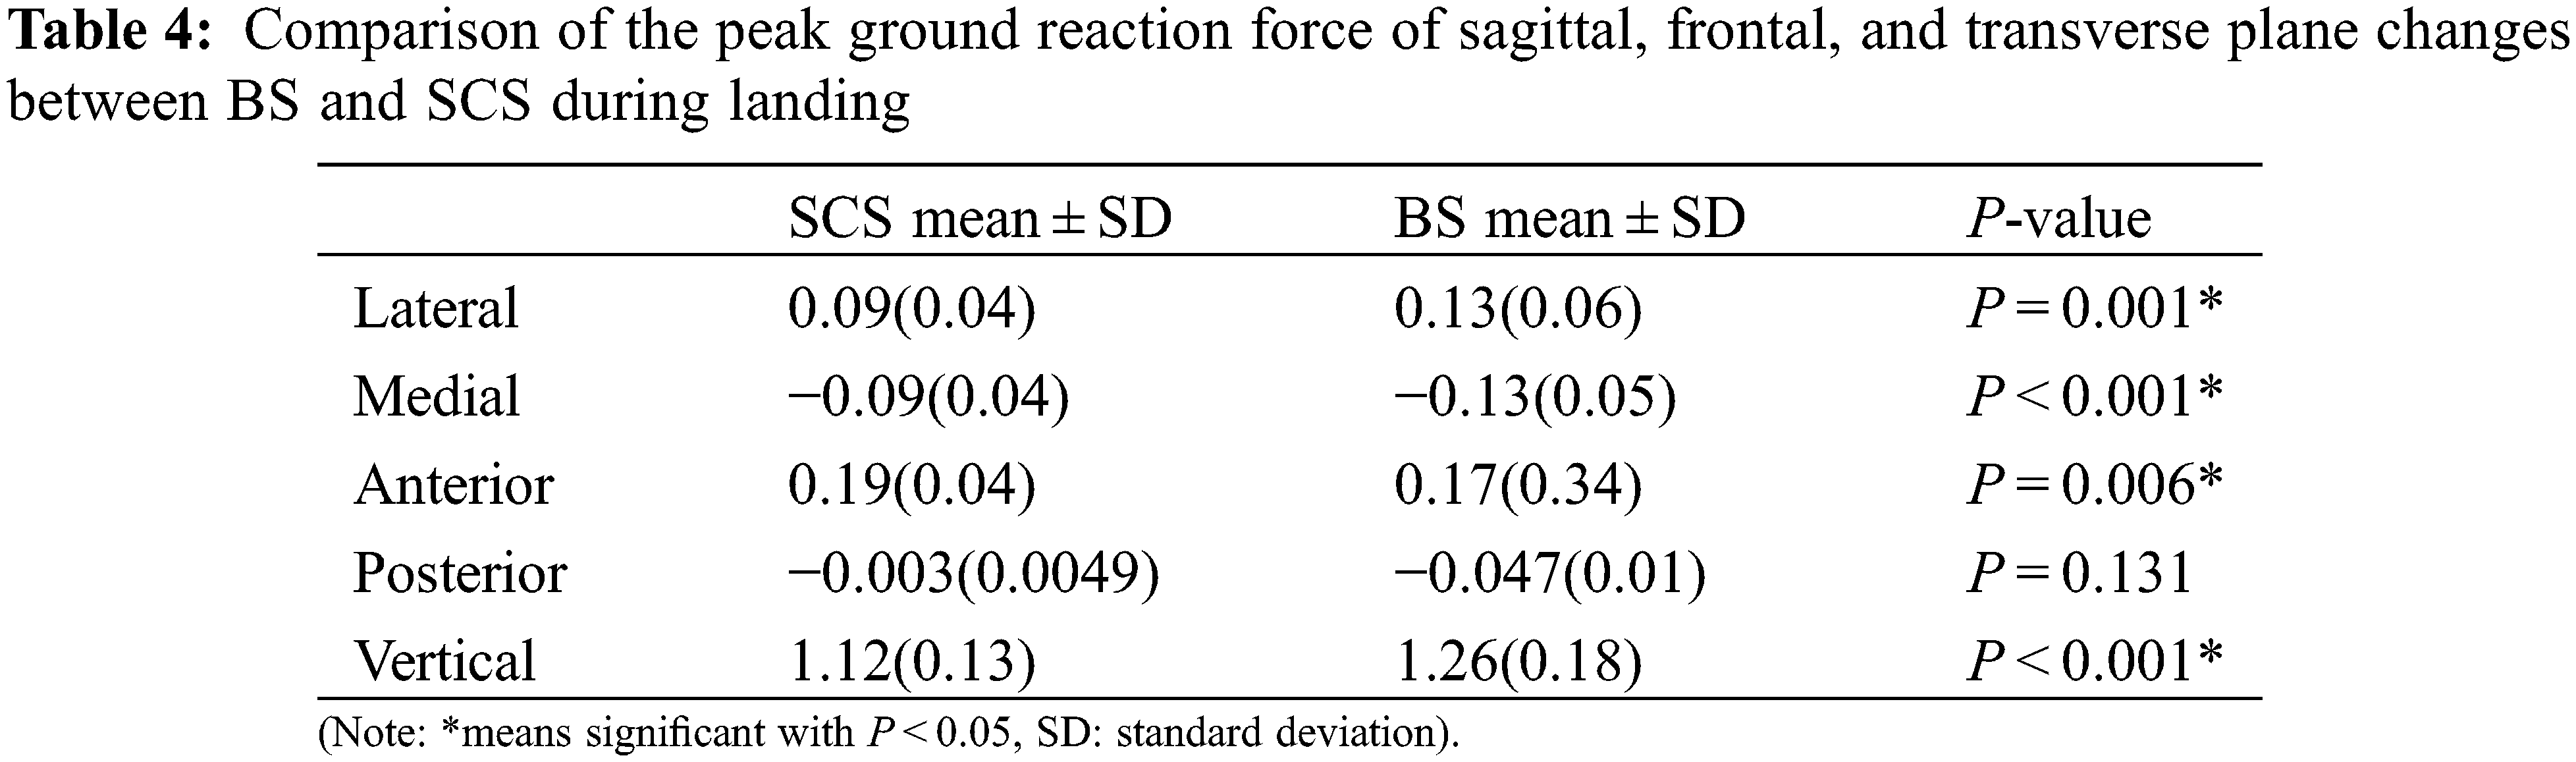
For the ground reaction force, Table 4 show that BS depicted a significantly greater peak lateral, vertical ground reaction force (P < 0.001), and medial ground reaction force (P = 0.001, P < 0.001). BS depicted a significantly small peak braking force (P = 0.006).
The current study aims to compare lower extremity stance results of landing phase mechanics between the Bounce step and Side Chasse step. Especially, the lower limb joint angle, moment, velocity, and ground reaction force are recorded to identify differences between the two steps. Therefore, this study can provide new insights into reducing lower extremity injuries and improving dance performance.
Our findings demonstrate that the peak vertical ground reaction force of BS is larger during the landing phase. There is a significantly greater inversion ankle angle and dorsiflexion ankle angle during SCS than BS during the landing phase. A previous study mentioned that the motion of the ankle angle of the sagittal plane would affect the movement of the hip joint [26]. We found greater hip flexion at 3.56%−56.54% of SCS, this may be related to the feature of the movement which needs to place the center of body mass on the forefoot and flex the hip joint. Therefore, more muscle control is needed in SCS. Comparing BS, a larger flexion angle of the hip joint during landing may be reducing the joint reaction force and increasing shock absorption of the body thereby reducing joint injury [26].
Our results show that a greater hip abduction moment existed in SCS, moreover, a greater knee flexion moment was observed in BS. As two basic steps of Jive, BS and SCS are heavily used in competitions and daily practice. However, BS requires more knee and ankle flexion and extension, and more swing of the hip joint in the SCS. This could account for the larger hip angle and moment of SCS in the frontal plane during the landing phase. In the 20%–75% of the landing phase in BS, a greater ankle plantarflexion was found. This could account for greater plantarflexion required in the process of acceleration and significant differences in velocity of the hip in sagittal and frontal planes were detected. Additionally, considering the biomechanical possibility that the second step of SCS produces the greatest impact as Jive dancers generally take a step from the first step to the second step followed by a single-legged landing and subsequent push-off while stepping into the third step. According to previous studies, dancing is a good way to promote public health [27–29]. This has only been proposed from the aspects of physical and psychological consideration, ignoring the damage caused to the lower extremity of dancers, especially female dancers due to the footwear used. It is worth mentioning that the biological structure of the human body, as opposed to a rigid body, allows the production of strength through muscle contraction [30], in dance, both the amplitude and speed of movement are positively related to the aesthetic experience of audiences [31–33]. The degrees of freedom of the lower limbs are also increased which increases the risk of injury [34]. As a result. the motion of Latin dance in relation to biomechanical characteristics should not be ignored in dance research.
From the above analysis, we can conclude that some similarities exist in SCS and BS of Jive. For instance, in Jive, a successful athletic performance relies on a high degree of amplitude control, especially in the knees and ankles. For certain dance moves, hips provide stability, allowing the ankles and knees to move quickly at high amplitudes, creating the BS and SC to make the Jive Dance flexible and brisk. However, the kinetic and dynamics parametric of the two steps are reflecting differences. The height of 7.5 cm high heels footwear is required in Latin dance. Higher heels exist in Latin Dance and perhaps contribute to changes in lower limb biomechanics and injury [35]. Most movements of dancers are accompanied by quick support of the floor using the forefoot. Such a technique increases the instability of the ankle joint. Therefore, in dance training, according to the characteristics of movement performance, the practices are crucial to avoid joint overuse and reduce the risk of injury to the lower extremity. Jive as a high frequency lower limb movement requires a high intensity of muscle activity [36]. Muscular strength seems to be important for all Latin dancers in all steps, especially for female dancers, greater power in the muscle can enhance the control of movement and reduce the joint torque [37–41].
There are some limitations in our current study that should be considered. Each participant is unique and their biomechanical skills to complete each dance movement, as well as physiological differences including muscle power and control ability will be different for each participant. We strictly controlled the dancing age of the subjects, and the laboratory environment will also impact the subject differently; the laboratory floor is different from the dance studio although we did control the experimental process as much as possible. We used the same footwear and the same frequency Jive music for each participant. Further research should focus on the change of joint power and the effects of different heel heights for Latin footwear on lower limb biomechanics. This study investigated the biomechanics of the lower extremity in female Latin dancers. Male dancers are also an important group linked with an injury; therefore, future studies should focus on male dancers’ lower limb biomechanics.
In present investigation examined the differences between the BS and SCS during the landing phase of Jive. Differences in joint angle, velocity, moment, and GRF between BS and SCS were revealed. These kinetic measurements compared two different steps (bounce step and side chasse step) of Jive. Strengthening lower limb muscles, including gastrocnemius, tibialis, and quadriceps plays an important role in preventing foot injuries and balancing joint strength. According to the training experience, reasonably controlling dance training time could reduce the risk of injury caused by muscle and joint overuse. These findings in the current study provide new insights into reducing lower extremity injuries and improving dance performance.
Authorship: The authors confirm contribution to the paper as follows: study conception and design: Fengfeng Li, Yaodong Gu; data collection: Fengfeng Li, Datao Xu, Huiyu Zhou; analysis and interpretation of results: Fengfeng Li, Julien S. Baker. All authors reviewed the results and approved the final version of the manuscript.
Funding Statement: This study was sponsored by the NSFC-RSE Joint Project (81911530253), Key R&D Program of Zhejiang Province China (2021C03130), Public Welfare Science and Technology Project of Ningbo, China (2021S133), Zhejiang Province Science Fund for Distinguished Young Scholars (R22A021199) and K. C. Wong Magna Fund in Ningbo University.
Conflicts of Interest: The authors declare that they have no conflicts of interest to report regarding the present study.
1. Drake-Boyt, E., (2011). Latin dance. Santa Barbara, California: ABC-CLIO. [Google Scholar]
2. Honglian, S., Thilak, K. D., Seetharam, T. G. (2021). Research on plantar pressure dynamic distribution characteristics of samba step movements based on biomechanics. Connection Science, 33(4), 1011–1027. DOI 10.1080/09540091.2020.1806205. [Google Scholar] [CrossRef]
3. Forczek-Karkosz, W., Michnik, R., Nowakowska-Lipiec, K., Vargas-Macias, A., Baena-Chicón, I. et al. (2021). Biomechanical description of Zapateado technique in flamenco. International Journal of Environmental Research and Public Health, 18(6), 2905. DOI 10.3390/IJERPH18062905. [Google Scholar] [CrossRef]
4. Jarvis, D. N., Kulig, K. (2016). Kinematic and kinetic analyses of the toes in dance movements. Journal of Sports Sciences, 34(17), 1612–1618. DOI 10.1080/02640414.2015.1126672. [Google Scholar] [CrossRef]
5. Perala, H. D., Wilson, M. A., Dai, B. (2018). The effect of footwear on free moments during a rotational movement in country swing dance. Journal of Dance Medicine & Science, 22(2), 84–90. DOI 10.12678/1089-313X.22.2.84. [Google Scholar] [CrossRef]
6. Lai, Y. C., Lin, H. S., Pan, H. F., Chang, W. N., Hsu, C. J. et al. (2014). Impact of foot progression angle on the distribution of plantar pressure in normal children. Clinical Biomechanics, 29(2), 196–200. DOI 10.1016/j.clinbiomech.2013.11.012. [Google Scholar] [CrossRef]
7. Campoy, F. A. S., de Oliveira Coelho, L. R., Bastos, F. N., Júnior, J. N., Vanderlei, L. C. M. et al. (2011). Investigation of risk factors and characteristics of dance injuries. Clinical Journal of Sport Medicine, 21(6), 493–498. DOI 10.1097/JSM.0b013e318230f858. [Google Scholar] [CrossRef]
8. Wilson, M., Kwon, Y. H. (2008). The role of biomechanics in understanding dance movement: A review. Journal of Dance Medicine & Science, 12(3), 109–116. [Google Scholar]
9. Evans, R. W., Evans, R. I., Carvajal, S. (1998). Survey of injuries among west end performers. Occupational and Environmental Medicine, 55(9), 585–593. DOI 10.1136/oem.55.9.585. [Google Scholar] [CrossRef]
10. Evans, R. W., Evans, R. I., Carvajal, S., Perry, S. (1996). A survey of injuries among broadway performers. American Journal of Public Health, 86(1), 77–80. DOI 10.2105/AJPH.86.1.77. [Google Scholar] [CrossRef]
11. Macintyre, J., Joy, E. (2000). Foot and ankle injuries in dance. Clinics in Sports Medicine, 19(2), 351–368. DOI 10.1016/S0278-5919(05)70208-8. [Google Scholar] [CrossRef]
12. Lukić, A., Bijelić, S., Zagorc, M., Zuhrić-Šebić, L. (2011). The importance of strength in sport dance performance technique. SportLogia, 7(1), 115–26. DOI 10.5550/sgia.110701.en.061L. [Google Scholar] [CrossRef]
13. Abboud, R. J. (2002). (I) Relevant foot biomechanics. Current Orthopaedics, 16(3), 165–179. DOI 10.1054/cuor.2002.0268. [Google Scholar] [CrossRef]
14. Aquino, J., Amasay, T. (2019). Biomechanical comparison of “dead” and “new” pointe shoes in female professional ballet dancers. The Sport Journal, 21, 305. [Google Scholar]
15. Su, X., Gu, Y. (2012). EMG in people with different heel height condition. Applications of EMG in Clinical and Sports Medicine, 18, 109–116. DOI 10.5772/25672. [Google Scholar] [CrossRef]
16. Jiang, X., Zhou, H., Quan, W., Hu, Q., Baker, J. S. et al. (2021). Ground reaction force differences between bionic shoes and neutral running shoes in recreational male runners before and after a 5 km run. International Journal of Environmental Research and Public Health, 18(18), 9787. DOI 10.3390/ijerph18189787. [Google Scholar] [CrossRef]
17. Xu, D., Jiang, X., Cen, X., Baker, J. S., Gu, Y. et al. (2021). Single-leg landings following a volleyball spike may increase the risk of anterior cruciate ligament injury more than landing on both-legs. Applied Sciences, 11(1), 130. DOI 10.3390/app11010130. [Google Scholar] [CrossRef]
18. Stein, C. J., Tyson, K. D., Johnson, V. M., Popoli, D. M., d’Hemecourt, P. A. et al. (2013). Injuries in Irish dance. Journal of Dance Medicine & Science, 17(4), 159–164. DOI 10.12678/1089-313X.17.4.159. [Google Scholar] [CrossRef]
19. Zhou, H., Xu, D., Quan, W., Liang, M., Ugbolue, U. C. et al. (2021). A pilot study of muscle force between normal shoes and bionic shoes during men walking and running stance phase using opensim. Actuators, 10(10), 274. DOI 10.3390/act10100274. [Google Scholar] [CrossRef]
20. Winter, D. A. (2009). Biomechanics and motor control of human movement. Canada: John Wiley & sons. [Google Scholar]
21. Xu, D., Quan, W., Zhou, H., Sun, D., Julien, S. B. et al. (2022). Explaining the differences of gait patterns between high and low-mileage runners with machine learning. Scientific Reports, 12(1), 2981. DOI 10.1038/s41598-022-07054-1. [Google Scholar] [CrossRef]
22. Xu, D., Lu, Z., Shen, S., Fekete, G., Ugbolue, U. C. et al. (2021). The differences in lower extremity joints energy dissipation strategy during landing between athletes with symptomatic patellar tendinopathy (PT) and without patellar tendinopathy (UPT). Molecular & Cellular Biomechanics, 18(2), 107–118. DOI 10.32604/mcb.2021.015453. [Google Scholar] [CrossRef]
23. Zhou, H., Xu, D., Chen, C., Ugbolue, U. C., Baker, J. S. et al. (2021). Analysis of different stop-jumping strategies on the biomechanical changes in the lower limbs. Applied Sciences, 11(10), 4633. DOI 10.3390/app11104633. [Google Scholar] [CrossRef]
24. Pataky, T. C. (2010). Generalized n-dimensional biomechanical field analysis using statistical parametric mapping. Journal of Biomechanics, 43(10), 1976–1982. DOI 10.1016/j.jbiomech.2010.03.008. [Google Scholar] [CrossRef]
25. Pataky, T. C., Robinson, M. A., Vanrenterghem, J. (2013). Vector field statistical analysis of kinematic and force trajectories. Journal of Biomechanics, 46(14), 2394–2401. DOI 10.1016/j.jbiomech.2013.07.031. [Google Scholar] [CrossRef]
26. Lee, J., Song, Y., Shin, C. S. (2018). Effect of the sagittal ankle angle at initial contact on energy dissipation in the lower extremity joints during a single-leg landing. Gait & Posture, 62, 99–104. DOI 10.1016/j.gaitpost.2018.03.019. [Google Scholar] [CrossRef]
27. Adilogullari, I. (2014). The examining the effects of 12-week Latin dance exercise on social physique anxiety: The effects of 12-week Latin dance. The Anthropologist, 18(2), 421–425. DOI 10.1080/09720073.2014.11891560. [Google Scholar] [CrossRef]
28. Iuliano, J. E., Lutrick, K., Maez, P., Nacim, E., Reinschmidt, K. (2017). Dance for your health: Exploring social latin dancing for community health promotion. American Journal of Health Education, 48(3), 142–145. DOI 10.1080/19325037.2017.1292875. [Google Scholar] [CrossRef]
29. Kiliç, M., Nalbant, S. S. (2022). The effect of Latin dance on dynamic balance. Gait & Posture, 92, 264–270. DOI 10.1016/j.gaitpost.2021.11.037. [Google Scholar] [CrossRef]
30. Neely, F. G. (1998). Biomechanical risk factors for exercise-related lower limb injuries. Sports Medicine, 26(6), 395–413. DOI 10.2165/00007256-199826060-00003. [Google Scholar] [CrossRef]
31. McCarty, K., Hönekopp, J., Neave, N., Caplan, N., Fink, B. (2013). Male body movements as possible cues to physical strength: A biomechanical analysis. American Journal of Human Biology, 25(3), 307–312. DOI 10.1002/ajhb.22360. [Google Scholar] [CrossRef]
32. Neave, N., McCarty, K., Freynik, J., Caplan, N., Hönekopp, J. et al. (2011). Male dance moves that catch a woman’s eye. Biology Letters, 7(2), 221–224. DOI 10.1098/rsbl.2010.0619. [Google Scholar] [CrossRef]
33. Torrents, C., Castañer, M., Jofre, T., Morey, G., Reverter, F. (2013). Kinematic parameters that influence the aesthetic perception of beauty in contemporary dance. Perception, 42(4), 447–458. DOI 10.1068/p7117. [Google Scholar] [CrossRef]
34. Chang, M., O’Dwyer, N., Adams, R., Cobley, S., Lee, K. Y. et al. (2020). Whole-body kinematics and coordination in a complex dance sequence: Differences across skill levels. Human Movement Science, 69, 102564. DOI 10.1016/j.humov.2019.102564. [Google Scholar] [CrossRef]
35. Rong, M., Wang, Y., Gu, Y. (2009). Plantar pressure distribution character in the Latin dance. Sample our Phasical Science Journals, 1(1), 36–37. DOI 10.1080/19424280902977152. [Google Scholar] [CrossRef]
36. Vargas-Macías, A., Baena-Chicón, I., Gorwa, J., Michnik, R. A., Nowakowska-Lipiec, K. et al. (2021). Biomechanical effects of flamenco footwork. Journal of Human Kinetics, 80(1), 19–27. DOI 10.2478/hukin-2021-0086. [Google Scholar] [CrossRef]
37. Alcazar, J., Aagaard, P., Haddock, B., Kamper, R. S., Hansen, S. K. et al. (2020). Age- and sex-specific changes in lower-limb muscle power throughout the lifespan. The Journals of Gerontology: Series A, 75(7), 1369–1378. DOI 10.1093/gerona/glaa013. [Google Scholar] [CrossRef]
38. Sadeghi, H., Sadeghi, S., Allard, P., Labelle, H., Duhaime, M. (2001). Lower limb muscle power relationships in bilateral able-bodied gait. American Journal of Physical Medicine & Rehabilitation, 80(11), 821–830. DOI 10.1097/00002060-200111000-00006. [Google Scholar] [CrossRef]
39. Xu, D., Zhou, H., Baker, J. S., István, B., Gu, Y. (2021). An investigation of differences in lower extremity biomechanics during single-leg landing from height using bionic shoes and normal shoes. Frontiers in Bioengineering and Biotechnology, 9, 679123. DOI 10.3389/fbioe.2021.679123. [Google Scholar] [CrossRef]
40. Tao, D., Supriya, R., Gao, Y., Li, F., Liang, W. et al. (2021). Dementia and dance: Medication or movement? Physical Activity and Health, 5(1), 250–254. DOI 10.5334/paah.138. [Google Scholar] [CrossRef]
41. Xiang, L., Mei, Q., Wang, A., Shim, V., Fernandez, J. et al. (2022). Evaluating function in the hallux valgus foot following a 12-week minimalist footwear intervention: A pilot computational analysis. Journal of Biomechanics, 132, 110941. DOI 10.1016/j.jbiomech.2022.110941. [Google Scholar] [CrossRef]
 | This work is licensed under a Creative Commons Attribution 4.0 International License, which permits unrestricted use, distribution, and reproduction in any medium, provided the original work is properly cited. |