| Oncologie |
DOI: 10.32604/Oncologie.2021.015154
REVIEW
Nucleus Detection on Pap Smear Images for Cervical Cancer Diagnosis: A Review Analysis
1Faculty of Electrical Engineering Technology, University of Malaysia Perlis, UniCITI Alam Campus, Sungai Chuchuh, Perlis, Malaysia
2Advanced Communication Engineering (ACE) Centre of Excellence, School of Computer and Communication Engineering, Universiti Malaysia Perlis (UniMAP), Kampus Pauh Putra, Perlis, Malaysia
3Faculty of Electronic Engineering Technology, University of Malaysia Perlis, Kampus Pauh Putra, Perlis, Malaysia
*Corresponding Author: Wan Azani Mustafa. Email: wanazani@unimap.edu.my
Received: 25 November 2020; Accepted: 04 February 2021
Abstract: Cervical cancer is a cell disease in the cervix that develops out of control in the female body. The cervix links the vagina (birth canal) with the upper section of the uterus, which can only be found in the female body. This is the second leading cause of death among women around the world. However, cervical cancer is currently one of the most preventable cancers if early detection is identified. The effect of unidentified cancer may increase the risk of death when the cell disease spreads to other parts of the female anatomy (metastasize). The Papanicolaou test is a cervical cancer screening technique used to identify potentially precancerous and cancerous cells in women’s cervix. In this paper, a few popular detection method was applying and experimented on pap smear images. A few image quality assessment (IQA) was obtained in order to determine the best of detection method. The nucleus detection will help pathologists to diagnosis in early stages of cancer. The early detection is very important stage in order to reduce the cancer incidence and mortality. The method that needs to be invented in this study is the detection method. Image detection is the process of partitioning the image into multiple regions. The detection method is object detection and recognition as well as the boundary in images. The segmented Pap Smear image is one of the detection tools with many different methods that generated different results from different issues. The solution was by analysing different existing detection methods in order to compare the dissimilar performance of existing processes. The precision of the system performance needs to be improved in order to invent a new method. As predicted from the result, the innovative construction method must be proposed and compared in order to find accurate, comprehensive measures and proper sampling procedures by the features of the selection method.
Keywords: Detection method; pap smear; detection; review analysis; cervical cancer; nucleus
In the entire world, one of the most common cancers among women at the age of 15 until 44 years is cervical cancer disease. In most cases, it can be healed as soon as it is detected at an early phase of growth [1,2]. Cytological diagnosis with Papanicolaou (Pap) analysis is an excellent method for the detection of risk assessments and the subsequent treatment of cervical cancer. The majority of countries that have been able to reduce the number of mortality related to these cancers have attributed this to a successful cervical cancer screening initiative and appropriate intervention [3]. The Pap test is the main screening method to identify potentially cancerous cells that may lead to cancer [4]. Fig. 1 shows the disease’s location in the women’s body in the lower part of the uterus connecting the vagina, called the cervix, hence the name, cervical cancer.
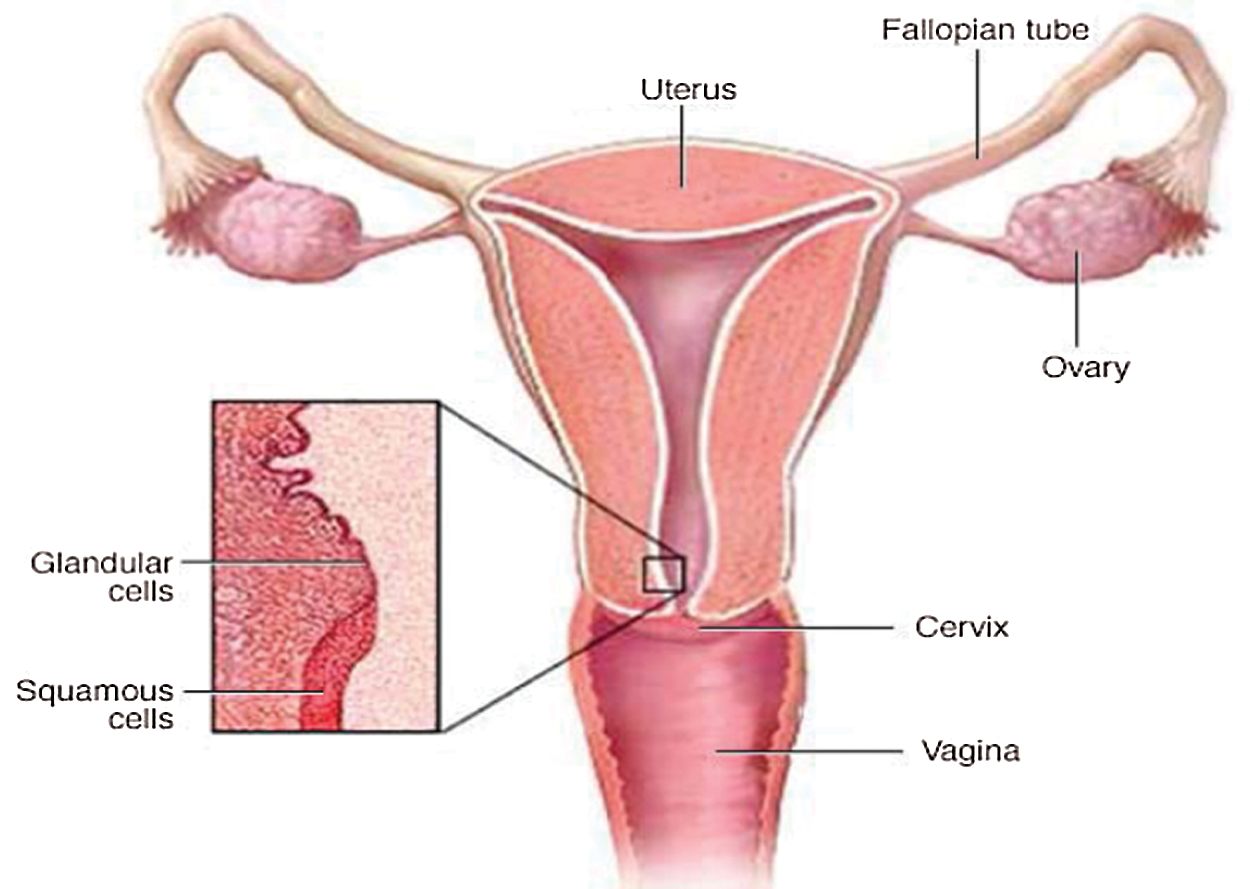
Figure 1: Schematic diagram of cervix and uterus [5]
The Pap test method, which focuses on the nucleus cells’ morphological features, is used to detect potentially abnormal cells inside the cervix. An automated system and effective detection of the nucleus are indispensable for diagnosis [6]. The image databases have been used to design the detection technique. Most researchers used the Herlev University image datasets to improve the design and development process. Herlev Pap database is compiled by Herlev University Hospital (Denmark) and the Technical University of Denmark [7,8]. The database consists of 917 images, manually classified by trained cytotechnicians and physicians in respective groups [9]. The database consists of seven cervical cell classifications, including superficial squamous, intermediate squamous, columnar, mild dysplasia, moderate dysplasia, extreme dysplasia, and in situ carcinoma. Different cell and nucleus features are extracted [10–12]. This research aims to find out features by using computerised techniques to identify the shape, size, and structure of the cell nucleus [13]. Some researchers recorded the evaluation of the method designed to identify the performance of the proposed technique. The analysis performance includes specificity, accuracy, sensitivity, and other few measurement analysis [14,15].
In the thresholding process, the input’s image are convert using a grey level co-occurrence matrix (GLCM). Seven classes of cervical cancer are included in this research. After thresholding of the nucleus and extraction of its features, the feature matrix is transmitted through the neural network to categorise the image data in their relevant categories. The neural network is composed using the backpropagation technique with hidden layers [16]. The overall accuracy since detection, extraction, and classification of features is 92 per cent.
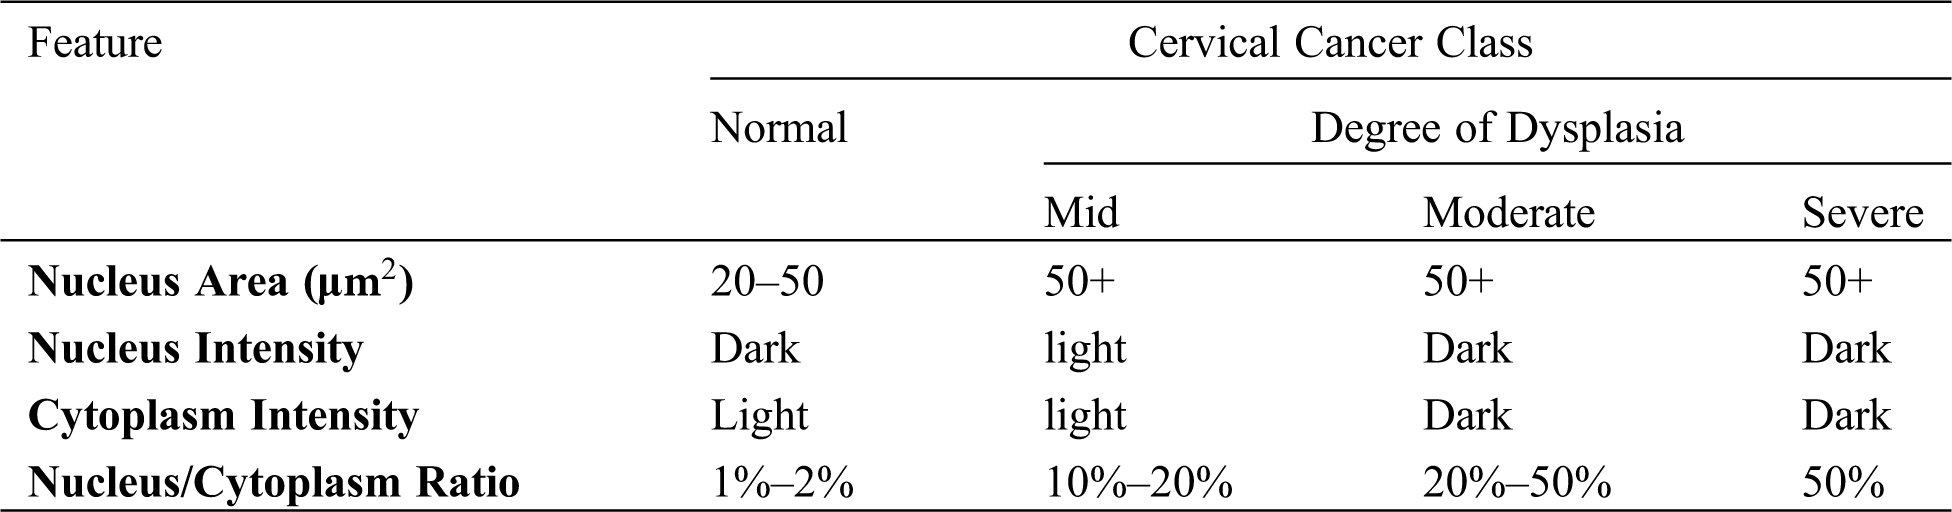
A range of essential basic cell features (Tab. 1). These characteristics are classified as size (cell area, nucleus area, cytoplasm area); shape (nucleus roundness, and cytoplasm roundness); ratio (nucleus/cytoplasm ratio, percentage of empty cells); topology (nucleus distribution, nucleus location); colour strength (cell, nucleus, cytoplasm intensity); and texture (multi-nucleus cells, and others) [17,18].
Table 1: Some of the cell features used for cervical cancer classification [18]
Thus, the studies presented to provide evidence that, according to the Algorithm of Estimation, we used the area of nucleus-to-cytoplasm ratio to detect defective cells. The k-mean clustering process can calculate the location of the nucleus. It is suitable for the detection of the biomedical image. The number of parameters (K) is typically measured by the number of similar strength regions [19]. This idea may be used to further the next invention method to get a better result.
In 2018, a paper from Riana et al. [20] proposed the combination K-means technique with Otsu Technique. This researcher used K-means, the merged technique with the Otsu technique. The results obtained in some cells of overlapping areas may be completely distinctive. While, the results of some other cells will not be promising as they still need further study, in particular, to resolve the presence of inflammatory cells that influence the extraction process.
Any benefits of the proposed approach include using an automated threshold for the identification of overlapping areas. The new concept of using K-means is to detect cytoplasm and the Otsu process for overlapping regions. This research project approach also uses colour features. The overlapping area threshold is automatically performed using the Otsu method and can also be done on a cytoplasm with a diversity level. However, this researcher needs to expand the technique so that the overlapping segment areas are with several inflammatory cells [20].
In contrast, another study found a different technique by using K-means and Bayesian classifier on identifying the inflammatory cell and nucleus based on the categorisation of the image pixel. Three stages have been performed to identify the phase of the nucleus and inflammatory cells throughout the image. The algorithm’s procedures comprise of three phases, i.e., Image Simplification Simplifying by eliminating context, application of K-means Classification, and application of Bayesian Classification. Image Simplification simplifies an image by eliminating the background steps and transforming it into a black-and-white image. The cells and nucleus identified were previously coloured only in black backgrounds [21].
These results indicate the research findings from both Bayesian and K-means classification methods evaluated on sixty images in the current study. It showed that these two techniques could not identify the nucleus, inflammatory cells, and cytoplasm precisely when contrasted with the mixture of the grey-level threshold system. As can be seen from the image analysis outcomes in Fig. 2, in all the images studied, K-Means and Bayesian classification systems displayed outputs that were not as reliable as predicted when the cytoplasm and nucleus had not been wholly identified under certain situations [21]. The effect of K-mean and Bayesian may be used to observe the resulting output.
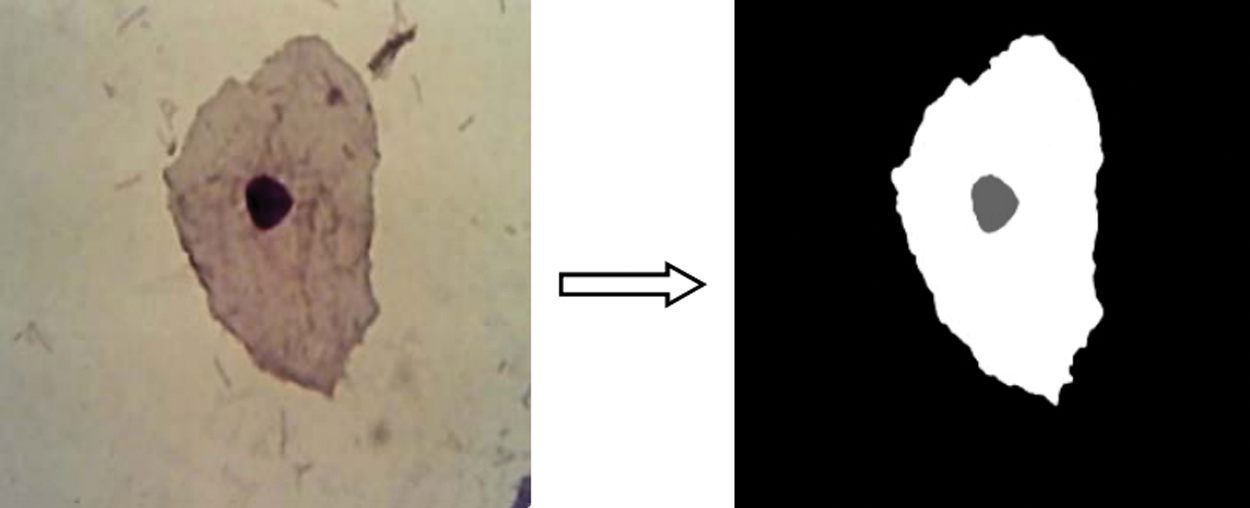
Figure 2: Training image for Bayesian classification [21]
In another study, a different technique was used to increase the reliability of measurement. The technique used is the Fuzzy C-means (FCM) clustering method for individual cell detection in this research study. The Fuzzy C-means clustering technique is used to segment each cell into two or three sections. The findings indicated that their detection approach provided a better set of functions for classification models. However, it is not only precision, but sensitivity is also necessary since it is a sign of fatal false negatives. Based on the results, the detection technique’s features also had excellent sensitivity [22]. Therefore, the excellent sensitivity of image thresholding needs to be defined on how to reach further in designing the new method. Fig. 3a shows the nucleus extracted for the original image, and Fig. 3b shows how the Cytoplasm extracted for the original image from the previous study [22].
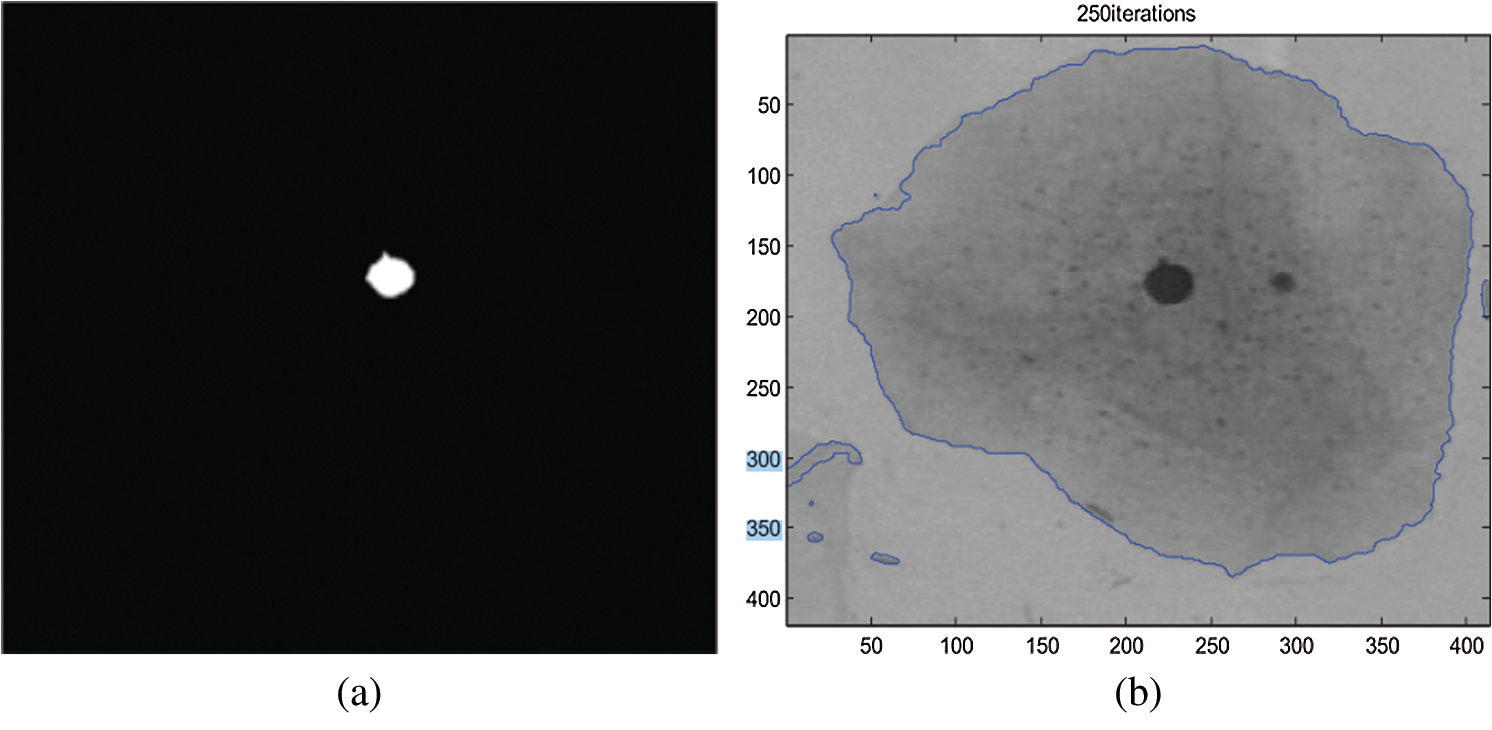
Figure 3: (a) Nucleus extracted for the original image [22] and (b): Cytoplasm extracted for the original image [22]
One of the main detection problems is the overlapping of cytoplasm, which was not well discussed in past research findings. In order to resolve the overlapping problem, this study introduced a robust-shaped learning-based approach to the segment of single cells in Pap smear images to enable automated supervision of cell changes, which is a critical prerequisite for early diagnosis of cervical cancer [23]. In order to consider this research study, the non-overlapping cells would be easier to observe, and further study may need to be acknowledged if the cell image database is not in separate cells. Another recent research focused on the detection with both the nucleus and the cytoplasm as well as the edge enhancement nucleus and cytoplasm texture detection method of cervical fracturing images [24]. Some research studies designed a variety of overlapping cell detection techniques. Identifying the nucleus can be achieved by a common threshold technique since it is the thickest and darkest part of the cell. The valuation of the pixel is around zero to ninety. This value is needed for this study to analyse and experiment with the newly designed method.
Furthermore, another study on cytoplasm observation had been achieved by eliminating the surrounding portion in the image, where nothing lies, i.e., by adjusting the parameters of these pixels as if by eliminating the surrounding portion in the image or by setting the value of these pixels as 255 brings the surrounding transparent, as well as the image, remained. Fig. 4 reveals that 255 made the surrounding transparent, and the picture remained with only the nucleus and the cytoplasm [25]. Fig. 4 shows the analysis of cytoplasm that indicated two separate photos with both nucleus and cytoplasm detected.
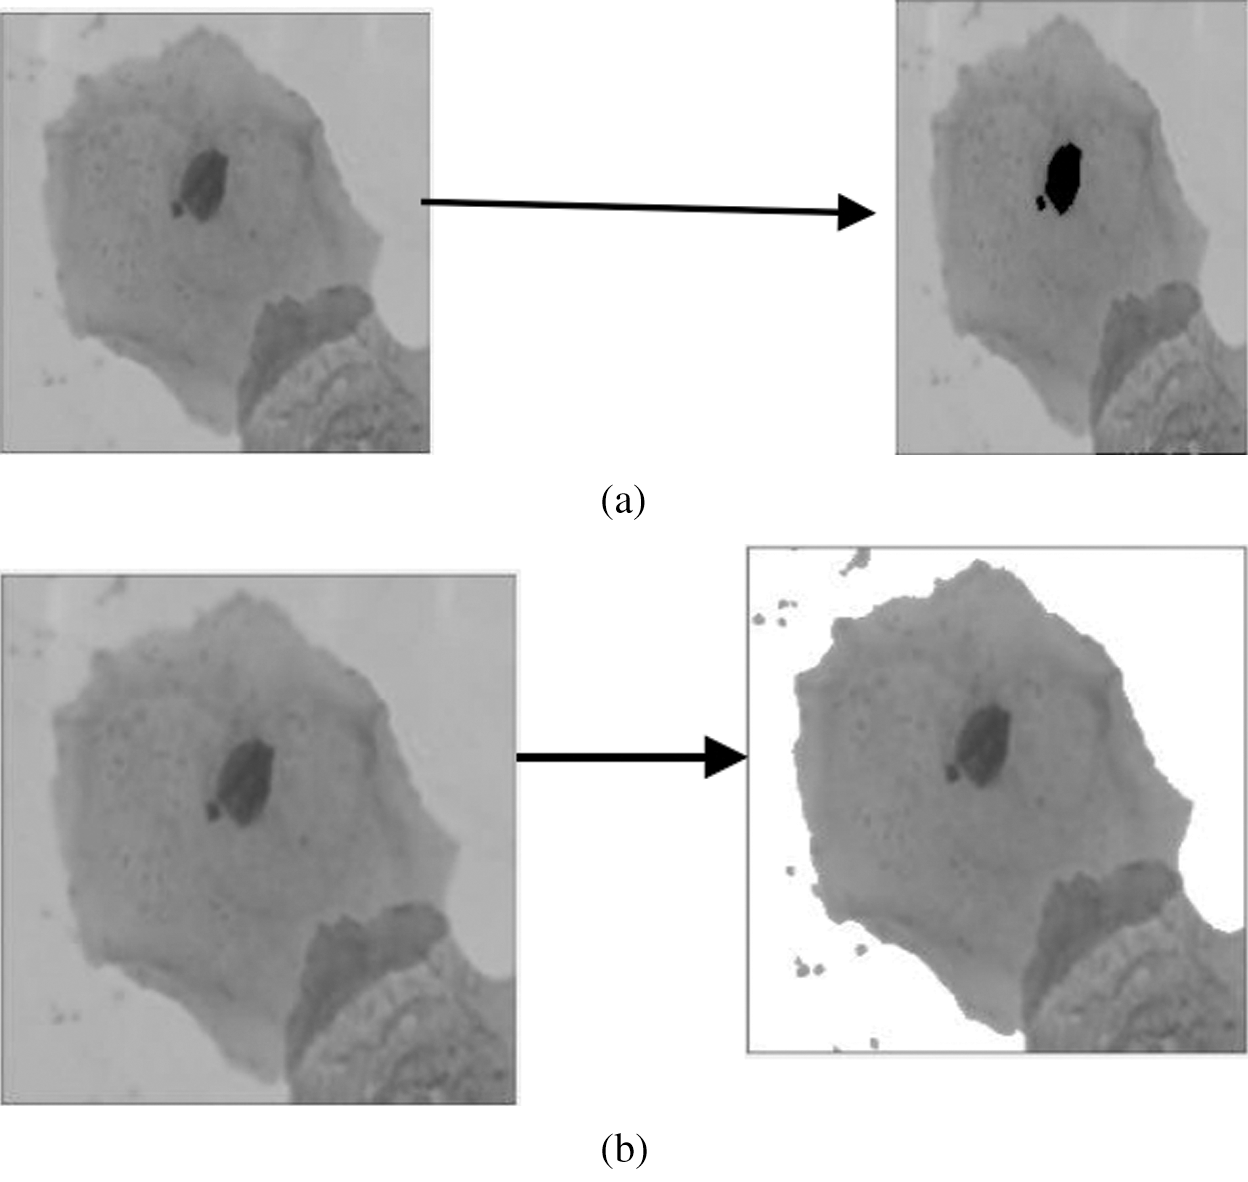
Figure 4: (a) Nucleus detection (Step 1) [25] and (b) Cytoplasm detection (Step 2) [25]
In this case, two separate images of the nucleus and cytoplasm were acquired through the overlapping of Step 1 and Step 2. By doing so, researchers can identify the region overlapped between cells. Fig. 4a indicates the nucleus detection, and Fig. 4b shows the detection of an overlapping region with a cytoplasm image. The small object was eliminated to obtain the overlapping area’s binary image. Moreover, the inventor adds the overlapping region complemented at the cytoplasm portion so that both cytoplasms can be separated. In order to add further separation to both cytoplasms, morphological erosion in the image was conducted [25]. The study then proposed that the overlapping regions were attached to the two cytoplasms to separate the two overlapped nuclei.
On the other side, IoU experiment results with ground truth were tested and different shape features extracted from the segmented nucleus. The classifier of the nucleus based on the form’s characteristics shall be done with the support and comparison of Random Forest Classifiers created with other classification methods and their effects on this database [20].
The performance analysis was evaluated using a method to determine F-measure, Sensitivity, Specificity, Accuracy, and PSNR. The method for identifying image precision is known as Image Quality Assessment (IQA). The IQA is the performance evaluation of the image, which is the essential element of the measure practice [26]. It performs an essential function in a wide range of applications, including compression techniques to computer vision, and many more [27–30]. Eight existing methods were analysed with 139 image databases from the University of Herlev, Denmark. The selected image for this experimted based on a fews criteria such as clear from noise, big resolution and size and shape of nucleus. The processed image databases segmented using the existing method were then written as new segmented images based on the different methods. The segmented image result was then computed with the benchmark image to observe the Image Quality Assessment (IQA). The IQA data were successfully tabulated, and the chart plotter observes the pattern of the performance analysis of each method.
In this section, the PSNR block calculated the peak signal-to-noise ratio in decibels for both images. This ratio was used to calculate the performance between the original and the segmented image. The greater the PSNR, the higher the quality of the compressed or segmented image. The mean square error (MSE) and the peak signal-to-noise ratio (PSNR) were used to measure the compression quality of the image [31]. The MSE denotes a combined square error between the segmented image and the benchmark image, while the PSNR is a method of measuring the peak error. The lower the MSE value, the smaller the error rate. Specificity and sensitivity are statistical measurements commonly used in medical diagnosis devices to classify the image. Accuracy is the percentage of accurately classified objects to the total pool of subjects. Accuracy is by far an instinctual one. Then, the F-measure takes into account both accuracy and sensitivity. It is the harmonic mean of precision and sensitivity. Sensitivity is the ratio of the right positive labeled by the program to all those with the disease. The specificity is correct-the software marks all those are safe. A few image results had been segmented by using the existing method, as shown in Tab. 2. The horizontal side of the table shows seven types of cell classifications. The normal cells are the Normal Superficial, Normal Intermediate, and Normal Columnar. The abnormal cells are Light Dysplasia, Moderate Dysplasia, Severe Dysplasia, and Carcinoma In Situ. The vertical side of the table shows the type of method used to analyse the image detection. The benchmark images show the original image that has not been segmented.
Table 2: The result of the segmented image by using existing method
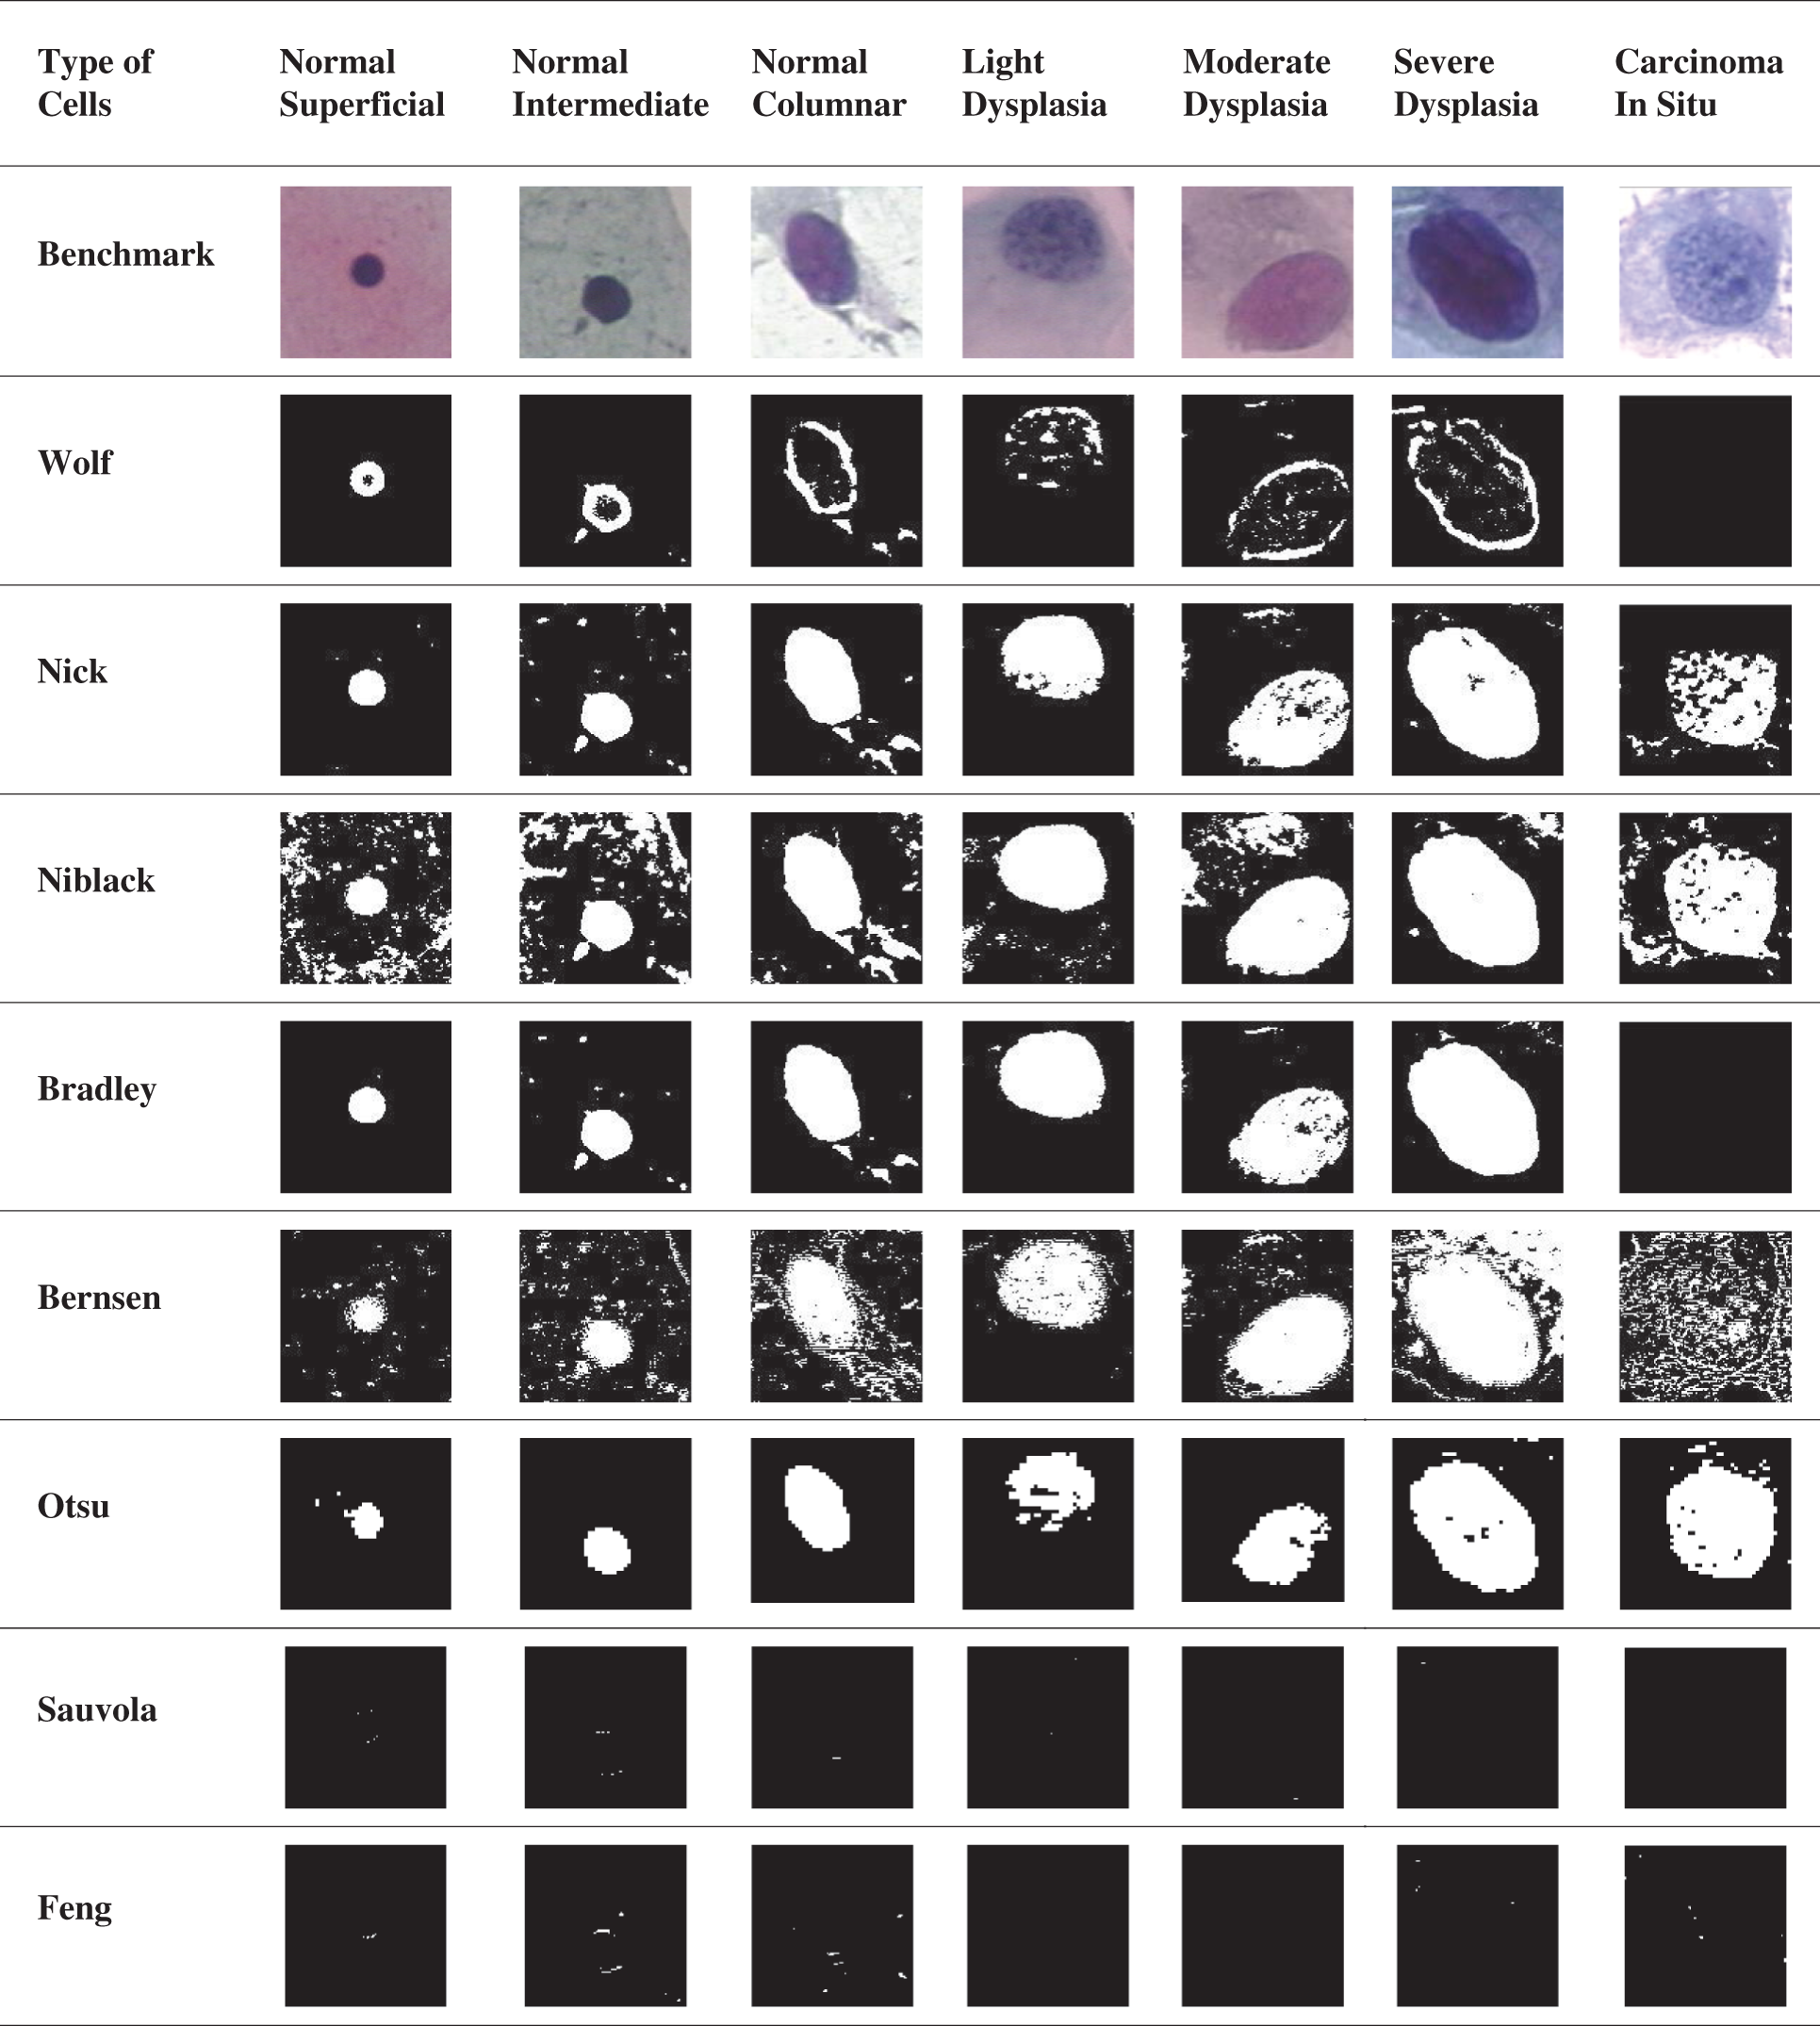
Based on Tab. 2 result, Otsu’s method showed less noise and could detect all nucleus classification types so far. The Niblack’s and Nick’s method performance were almost similar; however, Nick’s method had less noise than Niblack’s method. Although Bradley’s method showed quite a nice result, it failed to detect the Carcinoma cells. Nevertheless, Bernsen’s method needed more improvement in eliminating noise; this method had detected the cell’s boundary in small precision. Furthermore, Wolf’s method also detected the cell boundaries but did not detect the Carcinoma as well. Lastly, the Sauvola and the Feng method mainly were unable to detect the nucleus for this data. The first method evaluated is the Otsu method. The name Otsu comes from the inventor named Nobuyuki Otsu. This method is known as one of the thresholding methods. This method iterates all potential threshold values and measurement of the scatter measure for pixel value on either side of the threshold, such as pixel values dropping in the background or the foreground. Otsu’s method that subsequently results by dividing the cells into three different regions of the history, the nucleus and the cytoplasm in the individual’s adapt region, may be easily identified [8]. Otsu’s techniques have the essential property based entirely on the calculations conducted on an image histogram, an easy to obtain dimensional array [32]. In this analysis, the image database segmented by the Otsu method was written as a new image. The written image was then processed by using IQA to analyse the segmented method’s performance with the benchmark image. The result of IQA was then plotted in a chart to simplify the observation process. The chart of the percentage of Otsu IQA is shown in Fig. 5.
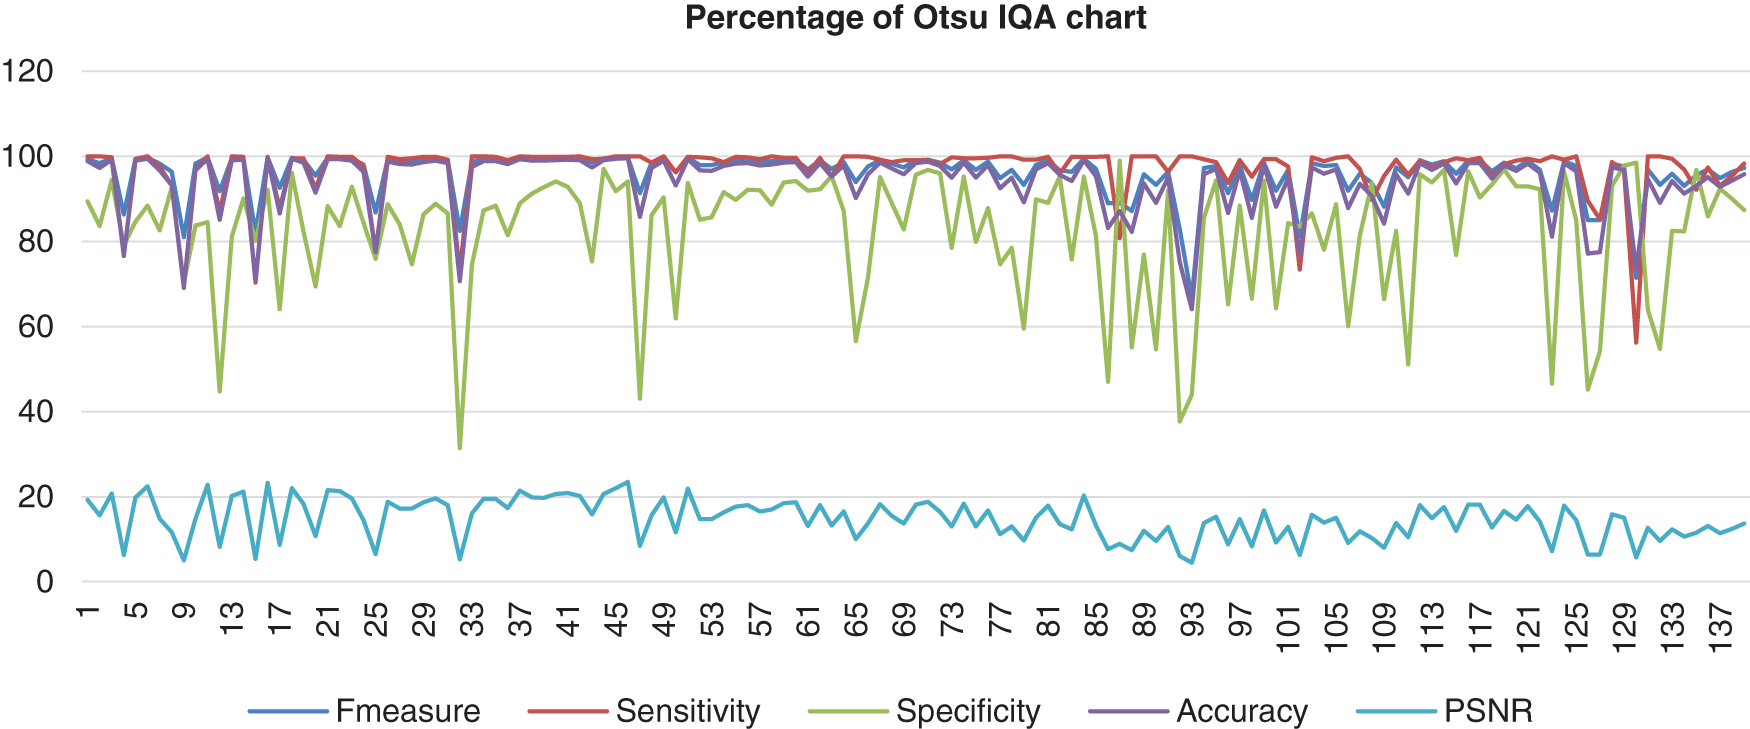
Figure 5: Image quality assessment for Otsu’s method
Based on the result shown in Fig. 5, the Otsu method had a better consistency of the sensitivity, accuracy, and F-measure in the high range around more than 55% to 100%. However, the specificity showed near consistency, but about six images resulted in less than 50% specificity. The PSNR might not be the highest; however, the PSNR range showed better consistency than other methods, and the lowest value of PSNR was still not less than 4.5%. The second method evaluated is the Bernsen method. This method is one of the locally adaptive binarisation techniques built for the detection of images. In this analysis, Bernsen’s locally adaptive binarisation technique was computed and then rewritten for various grayscale images [33]. Bernsen is a specific detection process that calculates the threshold level of the image pixel [34]. This paper shall refer to algorithms (1) from Puneet et al. [35]. The formula used to compute the threshold level is shown below:
where
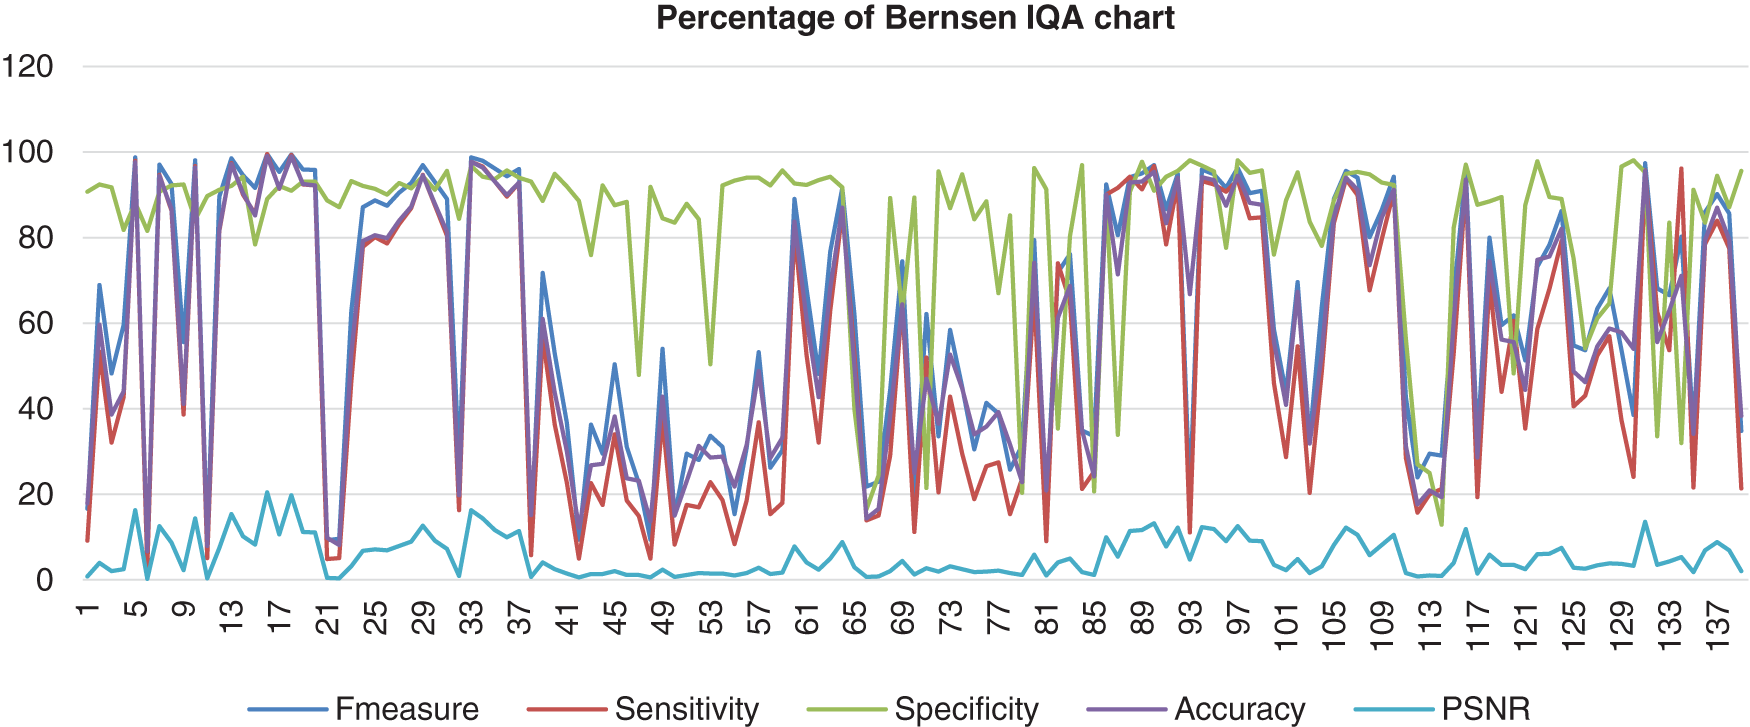
Figure 6: Image quality assessment for Bernsen’s method
This stacked chart shows the result of the image database from Bernsen’s method computed with the benchmark images. There are five different colours used for the segments that distinguish the categories of IQA analysis. Those are F-measure, Sensitivity, Specificity, Accuracy, and PSNR. This method showed less consistency of the sensitivity, accuracy, and F-measure in the high and low range around more than 3% to 100%. Then, the specificity was also less in consistency, but the range was higher than Otsu’s results, which were about 48% until 97% of specificity. However, the PSNR was not excellent because the lowest PNSR was about 0%.
The third method that has been analysed is Nick’s method. Nick’s binarisation acquires the adaptive threshold algorithm from the simple Niblack formula, the father of several local feature threshold techniques [36]. The previous study stated that Nick’s approach had demonstrated outstanding binarisation efficiency for degraded datasets. However, feature extraction threshold techniques, like the Nick algorithm, compute complex, taking considerable time to evaluate input data. The paper also discovered Nick’s local image threshold algorithm for rapid image detection of huge images [37]. The inventor designed a NICK algorithm which is based on the Niblack system by adding the mean square to the variance, as shown below [38]:
Its variance is B, and this approach moves the threshold down by adding the mean square to the variance to eliminate the background noise in the input datasets.
The chart in Fig. 7 shows the result of the image database from Nick’s method computed with the benchmark images. It appears that this method showed that the F-measure, sensitivity, specificity, and accuracy were assembled nearly together. These four analyses started at a high percentage, which reached 100% but then decreased to 0% and not consistently good when the abnormal image was computed. The PSNR for Nick’s method was not a good one because the lowest PSNR value was 0.38%. Even though the highest PSNR value that Nick’s method reached was 27.27%.
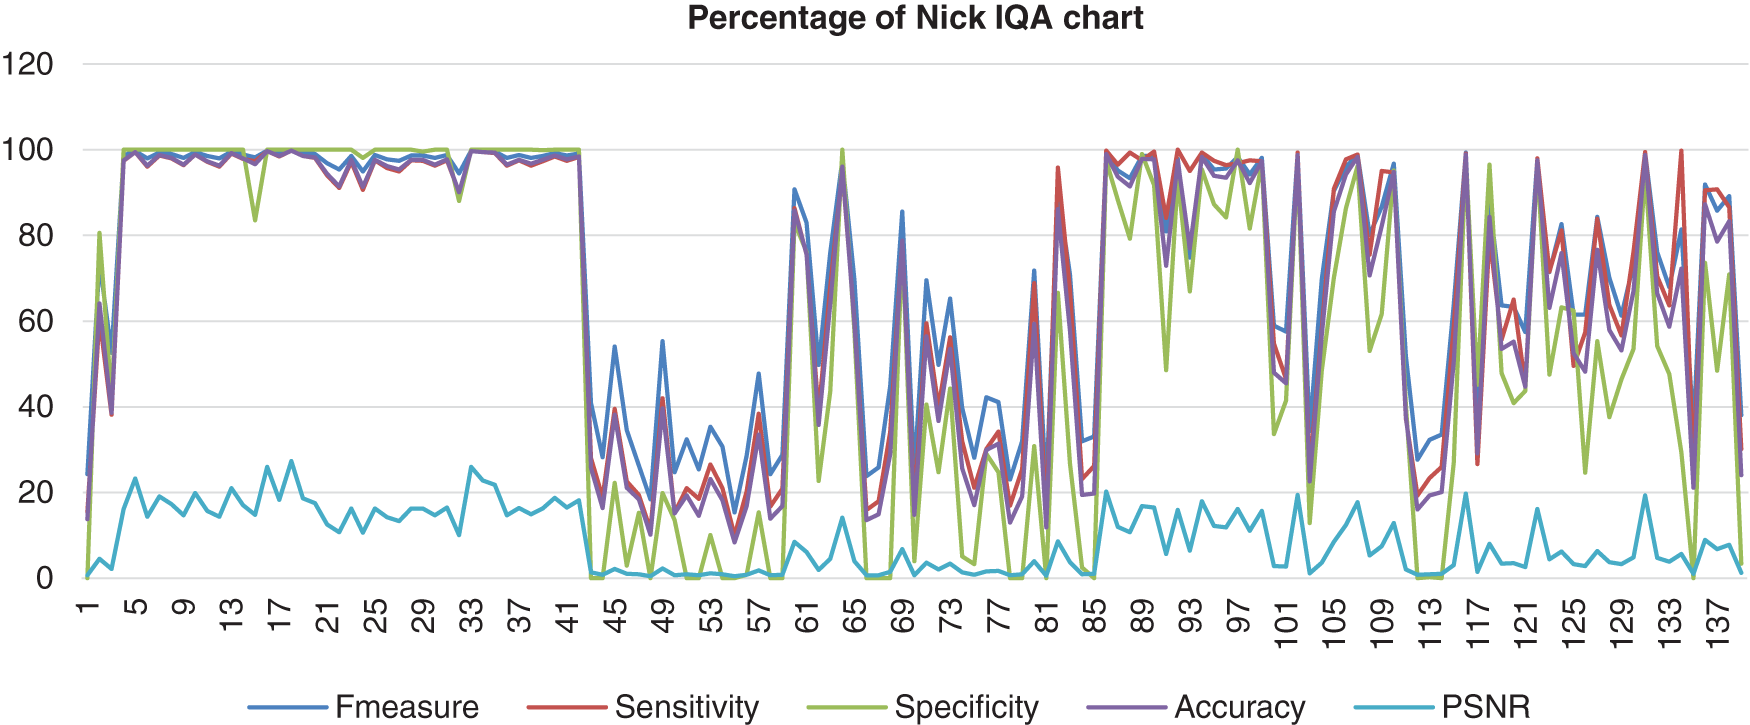
Figure 7: Image quality assessment for Nick’s method
Next, another analysis method is Niblack’s method. This method is known as the parent method of Nick’s method. The goal of the Niblack thresholding method is to achieve improved performance, especially for microscopic examination. It is a local detection algorithm that assimilates the threshold to the local mean and the local standard deviation over a fixed window size across each pixel location [39]. Niblack’s method sets the threshold level for each pixel-wise by sliding a rectangular window over a grey-level image [40]. The size of the rectangle frame can vary. The threshold is determined based on the local mean m as well as the standard deviation S of all pixels in an image and is described as following derivation [40,41]:
Since the NP is the total number of pixels in the grey image [39–42], T represents the threshold level, m is the average pixel value of pi, and k relies on the noise still alive in the background; it may be −0.1 or −0.2 [42].
The chart in Fig. 8 shows the result of the image database from Niblack’s method computed with the benchmark images. Niblack’s method is where Nick’s method inspired from. Even though Nick’s method showed better performance, this method showed fewer differential results than Nick’s method. The F-measure, sensitivity, specificity, and accuracy for this method also assembled nearly together. These four analyses started in high percentage which the specificity reached 100%, the F-measure, accuracy and the sensitivity reached 98%, for the highest percentage. Then it decreased to 0% and not consistently good when the abnormal image computed. The PSNR value was lower than Nick’s method, which the highest value of just 16%.
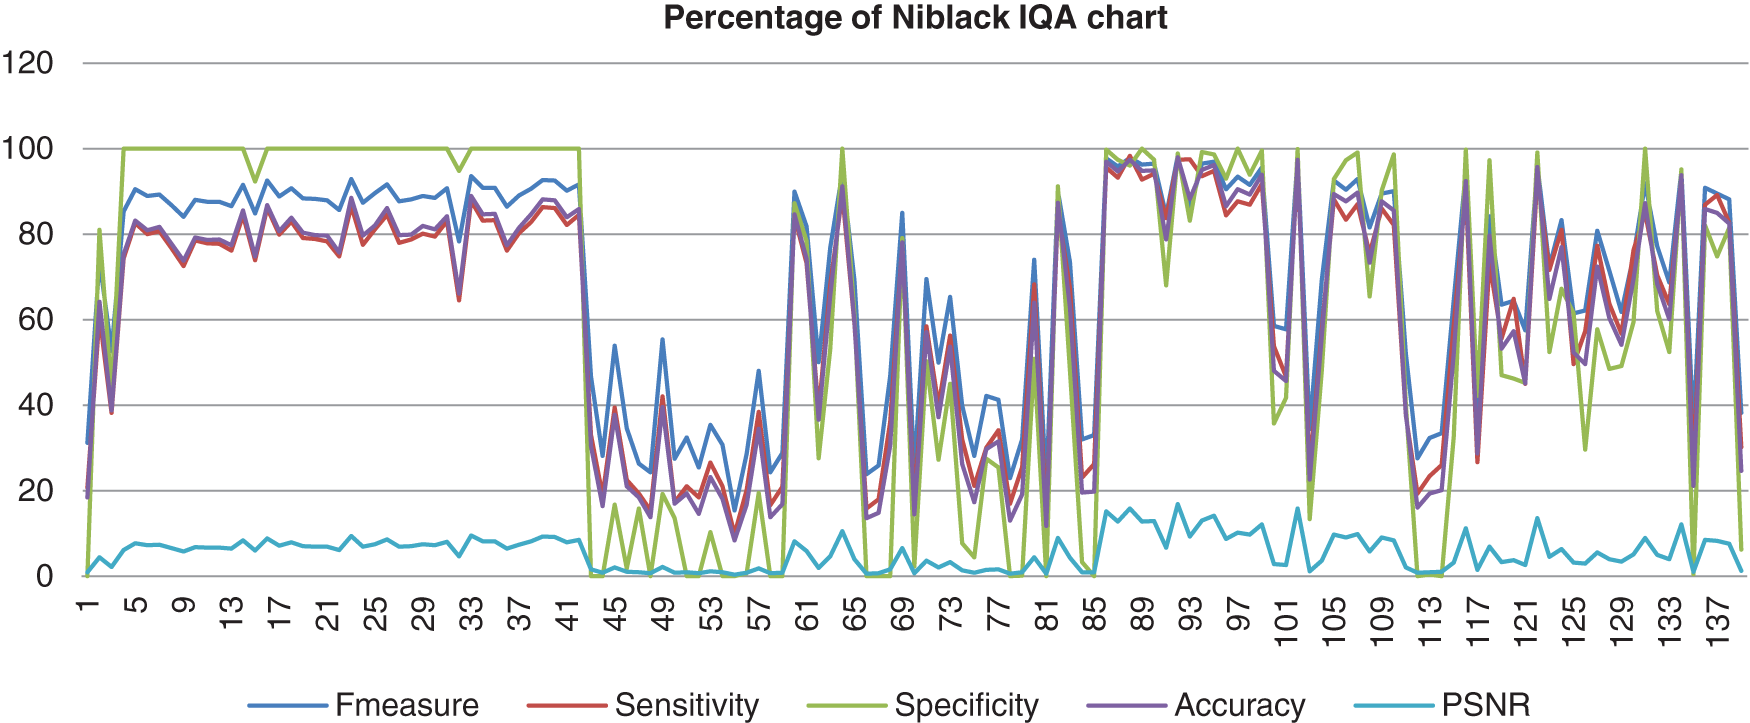
Figure 8: Image quality assessment for Niblack’s method
Then, the fifth method analysis is Bradley’s method. This method is the short idea behind this algorithm because each pixel value is adjusted to black when its brightness is T percent smaller than the standard brightness of the pixel values in the prescribed size window; hence it is adjusted to white. This approach’s benefit is that binary images are subjectively about as beneficial as the Sauvola technique, but the measurement is two times quicker than the Sauvola approach. Sauvola’s method measures local mean as well as local variance, as Bradley’s method measures only local mean. Furthermore, since the variance can be determined with the given variance formula, as shown in Eq. (4):
Computation of the variance re-uses the product of the measurement of the local mean (E(X))² and only measures E(X²). It takes a fair amount of period as the estimation of the local mean. Since the measurement of local mean and variance is the most time-consuming process undertaken by these two methods, Bradley’s technique is two times faster than Sauvola’s technique.
Derek Bradley stated that the Real-time adaptive thresholding method using an integral picture of the source. The methodology is an expansion of Wellner’s previous method. Besides this, our alternative is much more robust to illuminate improvements in the picture. This approach is quick and simple to execute. Bradley’s methodology is ideal for processing live video streams at a real-time frame rate, making it a powerful tool for immersive applications such as virtual reality [43].
This chart in Fig. 9 shows the result of the image database from Bradley’s method computed with the benchmark images. Bradley’s method shows a high percentage of F-measure, sensitivity, specificity, and accuracy, which hit 100%. However, the data scrambled when it reached image number 42 and next known as the abnormal images. The PSNR showed low consistency, which more results indicated that PSNR was 0%.
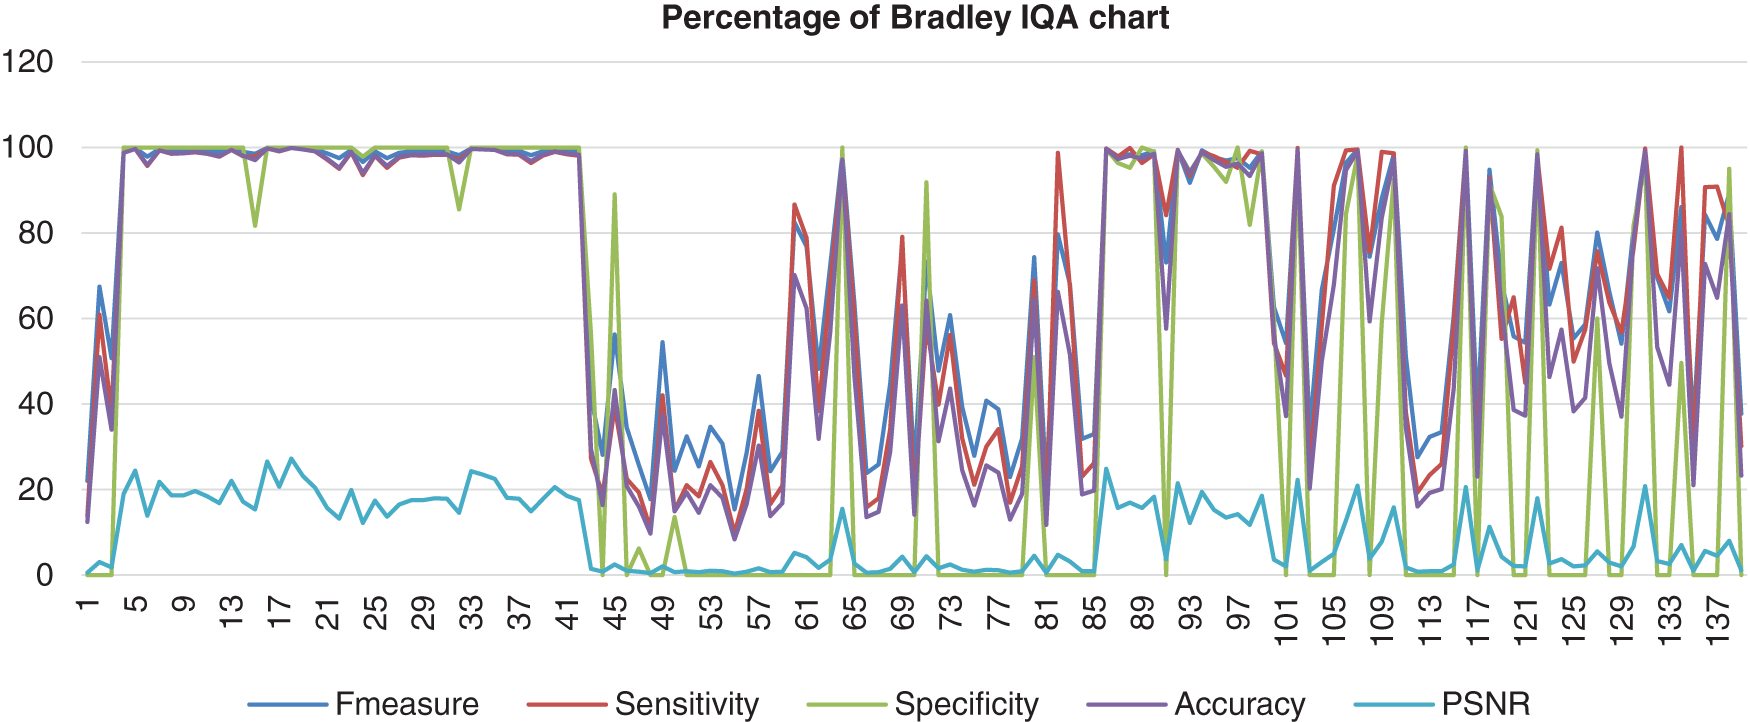
Figure 9: Image quality assessment for Bradley’s method
The sixth method analysed is Wolf’s technique; it solves problems in Sauvola’s technique when the text pixels and the grey-level background are close. It requires a frame or mask to measure the mean and standard deviation for implementing an adaptive threshold. The study found that the experimentally obtained results revealed that the accuracy obtained introduced by the proposed method resulted in 93.19 percent accuracy for morphological operations and 93.30 percent accuracy for the use of local Wolf thresholds [44].
To resolve the problems in Sauvola’s method, Wolf et al. [46] introduce to normalise the contrast and the mean grey value of the image and to measure the threshold as follows:
When k is set to 0.5, M is the lowest grey value of the image, and R is adjusted to the total grey-value standard deviation with all local neighbourhoods (windows). Besides that, deterioration is detected when there is a sharp transformation in background grey values across the image. This is because the values of M and R are measured from the whole picture. Thus, even just a tiny, noisy spot could have a huge effect on the M and R values, eventually computing misleading image detection threshold levels [36].
Fig. 10 shows the result from Wolf’s database that had been computed with the benchmark images. Wolf’s chart shows the F-measure, sensitivity, and accuracy assembled nearly together. However, the Specificity percentage range was quite low and quite far from those three performances, which the lowest point of the specificity is 0%. The PSNR also hit more low points, which was 0%.
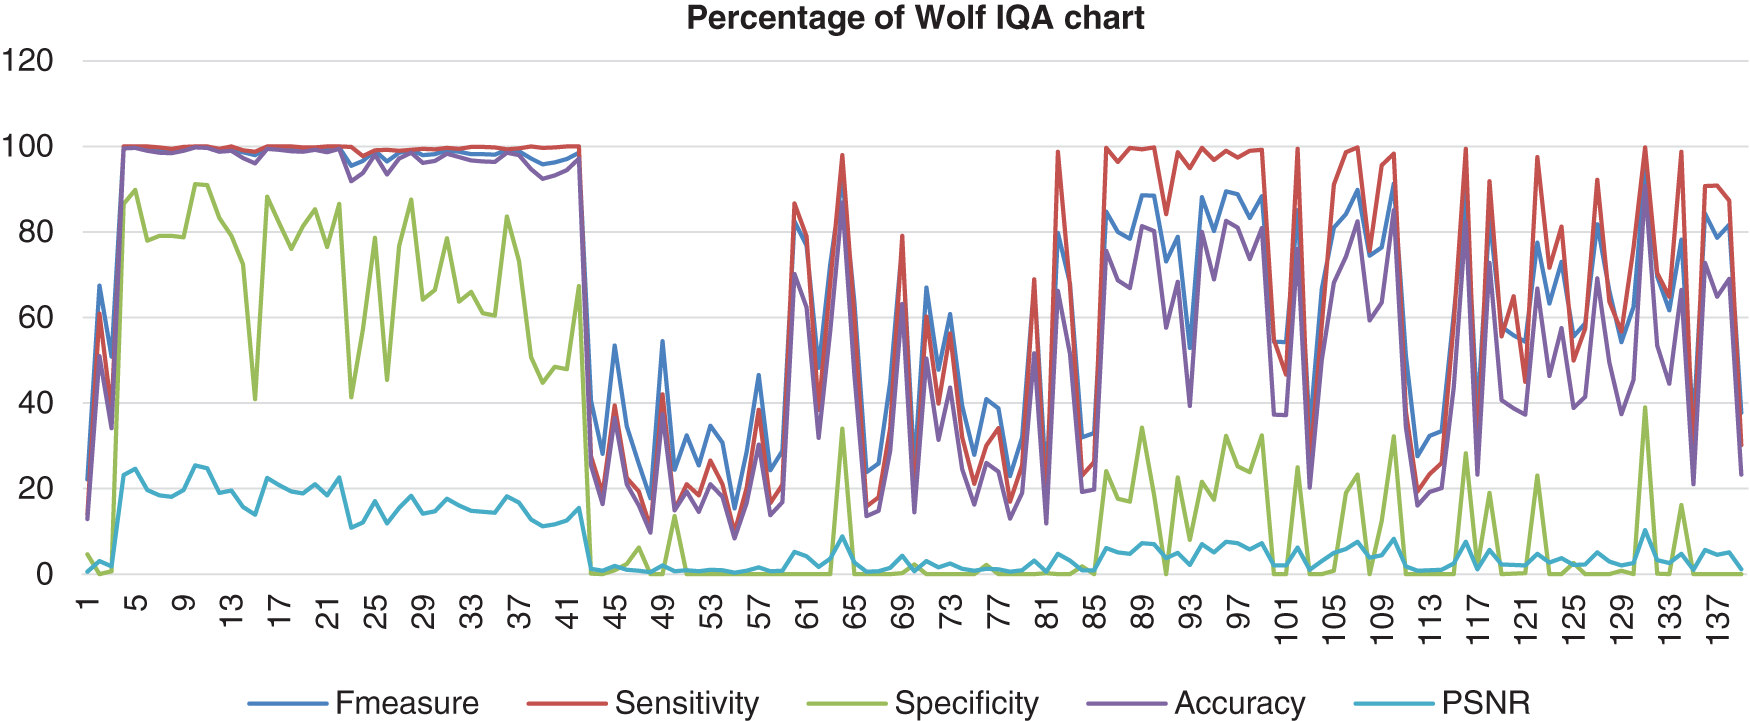
Figure 10: Image quality assessment for Wolf’s method
The next method is the Feng’s adaptive threshold technique. It is appropriate since it can be qualitatively higher than the Sauvola detection algorithm. The Feng approach does, however, contain several parameters that need to be defined [45]. However, this approach has not been widely accepted. Feng’s adaptive threshold method is strengthened by Wolf et al. [46] adaptive threshold technique to accommodate various levels of illumination unevenness. This system uses two local windows, the main window and the secondary window containing the current window [47].
As a result, Fig. 11 shows the result of the image database from Feng’s method computed with the benchmark images. The data shows that the F-measure, sensitivity, and accuracy assembled nearly together but started to be quite far together when at image 85 and next. Then, the specificity range percentage was very low and very far from those three performances, which the lowest point of the specificity was 0%. The poor analysis performance showed that this method could not detect most of the nucleus as well. The PSNR also hit a more low point, which was 0%.
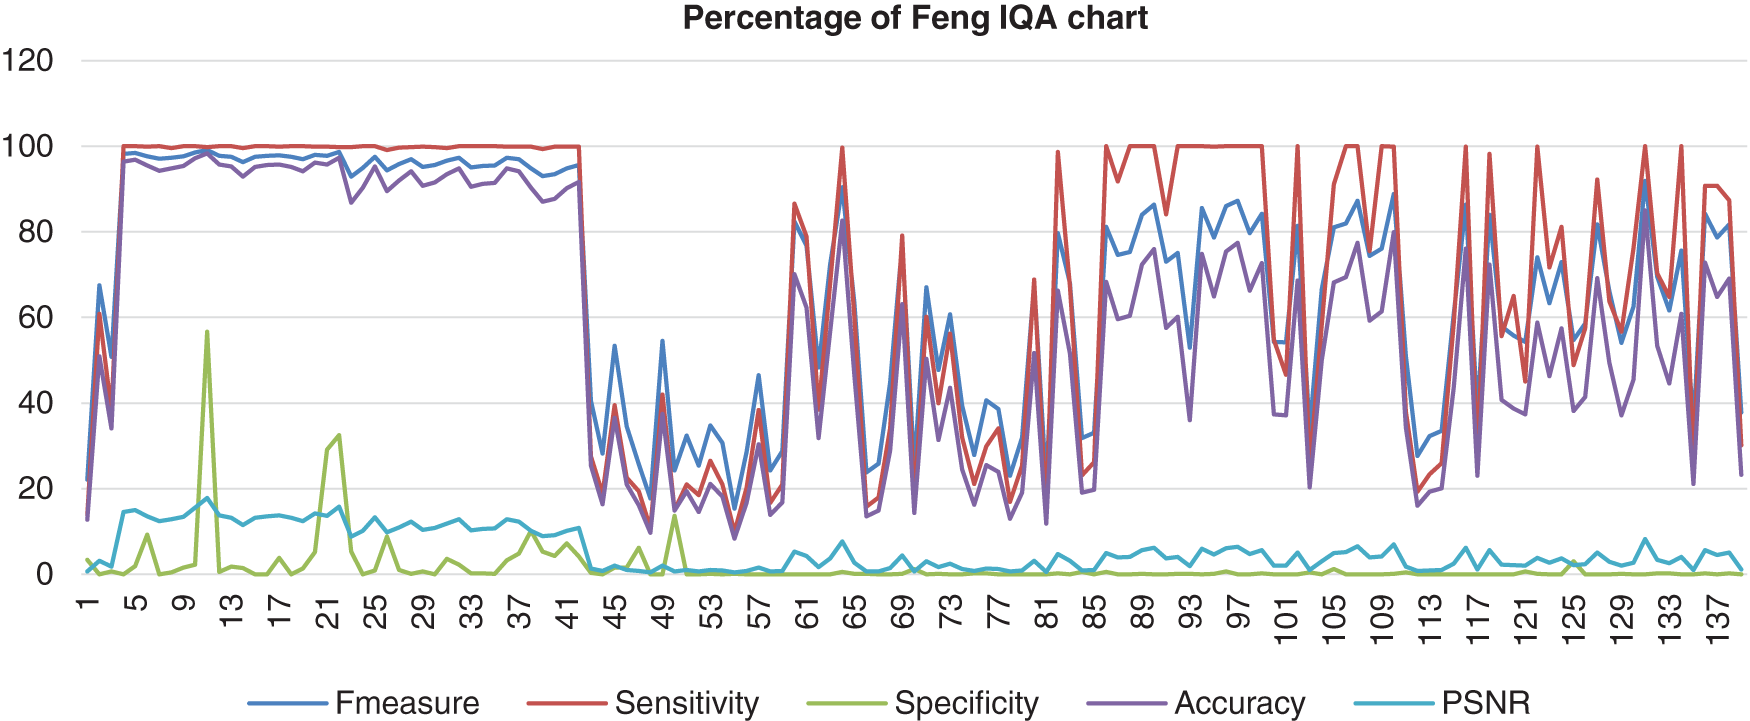
Figure 11: Image quality assessment for Feng’s method
The last method is the Sauvola method, known as the binarisation technique of Sauvola that demonstrates its robustness and efficacy when tested on low-quality databases [48]. In addition, the Sauvola approach can solve the problem of black noise by applying a range of grayscale values in the images, based on the effect on the standard deviation [49]:
R = gray-level (128), m = mean value, Δ = standard deviation and k = 0.1 [49].
Lastly, Fig. 12 shows Sauvola’s image database that had been computed with the benchmark images. The data shows that the F-measure, sensitivity, and accuracy assembled nearly together but started to be quite far together when at image 85 and next. Then, the specificity range percentage was very low and very far from those three performances, which the lowest point of the specificity was 0%. The PSNR also hit a more low point, which was 0%. This shows that Feng’s method performed poorly.

Figure 12: Image quality assessment for Sauvola’s method
In this research study, an algorithm was designed for segmenting the Pap-Smear images. All the eight methods algorithms were performed well, as shown in Tab. 2. Researchers used the image processing method, including detection and different thresholding algorithm in the previously existing methods. Indeed, sophisticated imaging methods based on machine learning algorithms produced an excellent performance. Databases had some drawbacks such as poor quality, noise, and some possibilities of human error. The output may differ depending on the database used in the study. Most of the researchers mixed their designed method with K-mean clustering to layer the nucleus detection process nucleus and solved the Pap Smear detection method. The algorithm designed was studied from the Otsu’s method. The importance of this review analysis for settlement was to analyse various existing detection methods in order to appeal to the different performance of existing processes. In order to invent a new method, the precision of the performance of the system needs improvement. This paper has been made some of the review analysis feasibly grant the interventions from the important study results for the researchers reconciled with the classification technique and the performance in developing the improved algorithm and the excellent systems analysis, relying on the image’s feature nucleus databases.
Funding Statement: This work was supported by the Ministry of Higher Education Malaysia’s funding under the Fundamental Research Grant Scheme (FRGS/1/2018/SKK13/UNIMAP/02/1).
Conflicts of Interest: The authors declare that they have no interest in reporting regarding the present study.
1. Oprisescu, S., Radulescu, T., Sultana, A., Rasche, C., Ciuc, M. (2015). Automatic pap smear nuclei detection using mean-shift and region growing. ISSCS 2015-International Symposium on Signals, Circuits and Systems, pp. 1–4. Romania. [Google Scholar]
2. Nahrawi, N., Mustafa, W. A., Kanafiah, S. N. A. M. (2020). Knowledge of Human Papillomavirus (HPV) and cervical cancer among Malaysia Residents: A review. Sains Malaysiana, 49(7), 1687–1695. DOI 10.17576/jsm-2020-4907-19. [Google Scholar] [CrossRef]
3. Mustafa, W. A., Halim, A., Rahman, K. S. A. (2020). A narrative review: Classification of pap smear cell image for cervical cancer diagnosis. Oncologie, 22(2), 53–63. DOI 10.32604/oncologie.2020.013660. [Google Scholar] [CrossRef]
4. Romli, R., Shahabudin, S., Saddki, N., Mokhtar, N. (2019). Cervical cancer and pap smear screening: Knowledge, attitude and practice among working women in northern state of Malaysia. Medical Journal of Malaysia, 74(1), 8–14. [Google Scholar]
5. Bhan, A., Sharma, D., Mishra, S. (2018). Computer based automatic segmentation of pap smear cells for cervical cancer detection. 2018 5th International Conference on Signal Processing and Integrated Networks, pp. 883–887, Noida, Delhi. [Google Scholar]
6. Yang, X., Wu, J., Yin, Y. (2020). Interacting convolution with pyramid structure network for automated segmentation of cervical nuclei in pap smear images. Proceedings of the International Symposium on Biomedical Imaging, pp. 499–502, Lowa City, Lowa. [Google Scholar]
7. Jantzen, J., Norup, J., Dounias, G., Bjerregaard, B. (2005). Pap-smear benchmark data for pattern classification. Proceedings of the NiSIS, pp. 1–9, Albufeira, Portugal. [Google Scholar]
8. HassanMbaga, A., ZhiJun, P. (2015). Pap smear images classification for early detection of cervical cancer. International Journal of Computer Applications, 118(7), 10–16. DOI 10.5120/20756-3159. [Google Scholar] [CrossRef]
9. Kurnianingsih, Allehaibi, K. H. S., Nugroho, L. E., Widyawan, Lazuardi, L. et al. (2019). Segmentation and classification of cervical cells using deep learning. IEEE Access, 7, 116925–116941. DOI 10.1109/ACCESS.2019.2936017. [Google Scholar] [CrossRef]
10. Ramdhani, Y., Riana, D. (2018). Hierarchical decision approach based on neural network and genetic algorithm method for single image classification of Pap smear. Proceedings of the 2nd International Conference on Informatics and Computing, pp. 1–6. Jayapura, Indonesia. [Google Scholar]
11. William, W., Ware, A., Basaza-Ejiri, A. H., Obungoloch, J. (2019). A pap-smear analysis tool (PAT) for detection of cervical cancer from pap-smear images. BioMedical Engineering OnLine, 18(1), 1–22. DOI 10.1186/s12938-019-0634-5. [Google Scholar] [CrossRef]
12. Sajeena, T. A., Jereesh, A. S. (2016). Automated cervical cancer detection through RGVF segmentation and SVM classification. 2015 International Conference on Computing and Network Communications, pp. 663–669, Trivandrum, Kerala, India. [Google Scholar]
13. Arya, M., Mittal, N., Singh, G. (2016). Cervical cancer detection using segmentation on pap smear images. Proceedings of the International Conference on Informatics and Analytics, pp. 1–5, Puducherry, India. [Google Scholar]
14. Chankong, T. (2018). Automatic classifying of cervical cells using fourier spectral features. Proceedings 2018 4th International Conference on Green Technology and Sustainable Development, pp. 759–762, Ho Chi Minh City, Vietnam. [Google Scholar]
15. Mustafa, W. A., Abdul-Nasir, A. S., Mohamed, Z., Yazid, H. (2018). Segmentation based on morphological approach for enhanced malaria parasites detection. Journal of Telecommunication, Electronic and Computer Engineering, 10(1–16), 15–20. [Google Scholar]
16. Sharma, D., Bhan, A., Goyal, A. (2018). Cervical cancer screening in pap smear images using improved distance regularized level sets. Proceedings of the 2nd International Conference on Trends in Electronics and Informatics, pp. 1445–1448, Tirunelveli, India. [Google Scholar]
17. Mat-Isa, N. A., Mashor, M. Y., Othman, N. H. (2008). An automated cervical pre-cancerous diagnostic system. Artificial Intelligence in Medicine, 42(1), 1–11. DOI 10.1016/j.artmed.2007.09.002. [Google Scholar] [CrossRef]
18. William, W., Basaza-Ejiri, A. H., Obungoloch, J., Ware, A. (2018). A review of applications of image analysis and machine learning techniques in automated diagnosis and classification of cervical cancer from pap-smear images. 2018 IST-Africa Week Conference, pp. 1–11, Gaborone, Botswana. [Google Scholar]
19. Sangworasil, M., Sukkasem, C., Sasivimolkul, S., Suvarnaphaet, P., Pechprasarn, S. et al. (2019). Automated screening of cervical cancer cell images. 11th Biomedical Engineering International Conference, pp. 1–4, Chiang Mai, Thailand. [Google Scholar]
20. Riana, D., Tohir, H., Hidayanto, A. N. (2018). Segmentation of overlapping areas on pap smear images with color features using K-means and otsu methods. Proceedings of the 3rd International Conference on Informatics and Computing, pp. 1–5, Palembang, Indonesia. [Google Scholar]
21. Riana, D., Wahyudi, M., Hidayanto, A. N. (2018). Comparison of nucleus and inflammatory cell detection methods on Pap smear images. Proceedings of the 2nd International Conference on Informatics and Computing, pp. 1–5, Jayapura, Indonesia. [Google Scholar]
22. Kaaviya, S., Saranyadevi, V., Nirmala, M. (2015). PAP smear image analysis for cervical cancer detection. 2015 IEEE International Conference on Engineering and Technology, pp. 1–4, Coimbatore, India. [Google Scholar]
23. Wang, T., Jiang, X., Chen, S., Song, Y., Tan, E. L. et al. (2016). Accurate cervical cell segmentation from overlapping clumps in pap smear images. IEEE Transactions on Medical Imaging, 36(1), 288–300. DOI 10.1109/tmi.2016.2606380. [Google Scholar] [CrossRef]
24. Riana, D., Hidayanto, A. N., Widyantoro, D. H., Mengko, T. L. R., Kalsoem, O. (2018). Segmentation of overlapping cytoplasm and overlapped areas in Pap smear images. 2017 8th International Conference on Information, Intelligence, Systems and Applications, pp. 1–5, Golden Bay Beach Hotel, Larnaca, Cyprus. [Google Scholar]
25. Singh, S. K., Singh, R., Goyal, A. (2019). Semi-automatic segmentation of overlapping cells in pap smear image. Proceedings of the 4th International Conference on Computing Sciences, pp. 161–165, Jalandhar, India. [Google Scholar]
26. Hosu, V., Lin, H., Sziranyi, T., Saupe, D. (2019). KonIQ-10k: An ecologically valid database for deep learning of blind image quality assessment. arXiv, 29, 4041–4056. [Google Scholar]
27. Wang, Z. (2011). Applications of objective image quality assessment methods [Applications Corner]. IEEE Signal Processing Magazine, 28(6), 137–142. [Google Scholar]
28. Sziranyi, T. (2005). Artifact reduction with diffusion preprocessing for image compression. Optical Engineering, 44(2), 027003. DOI 10.1117/1.1849242. [Google Scholar] [CrossRef]
29. Men, H., Lin, H., Hosu, V., Maurer, D., Bruhn, A. et al. (2019). Visual quality assessment for motion compensated frame interpolation. 2019 11th International Conference on Quality of Multimedia Experience, pp. 1–6, Berlin, Germany. [Google Scholar]
30. Dodge, S., Karam, L. (2016). Understanding how image quality affects deep neural networks. 2016 8th International Conference on Quality of Multimedia Experience, pp. 1–6, Lisbon, Portugal. [Google Scholar]
31. Sara, U., Akter, M., Uddin, M. S. (2019). Image Quality Assessment through FSIM, SSIM, MSE and PSNR—A comparative study. Journal of Computer and Communications, 7(3), 8–18. DOI 10.4236/jcc.2019.73002. [Google Scholar] [CrossRef]
32. Gonzalez, R. C., Woods, R. E., Masters, B. R. (2009). Digital image processing, Third Edition. Journal of Biomedical Optics, 14(2), 029901. DOI 10.1117/1.3115362. [Google Scholar] [CrossRef]
33. Eyupoglu, C. (2017). Implementation of Bernsen’s locally adaptive binarization method for gray scale images. Journal of Science and Technology, 7(2), 68–72. [Google Scholar]
34. Madhuri Latha, G. (2012). An improved bernsen algorithm approaches for license plate recognition. IOSR Journal of Electronics and Communication Engineering, 3(4), 1–5. DOI 10.9790/2834-0340105. [Google Scholar] [CrossRef]
35. Puneet, P., Garg, N. (2013). Binarization techniques used for grey scale images. International Journal of Computer Applications, 71(1), 8–11. DOI 10.5120/12320-8533. [Google Scholar] [CrossRef]
36. Khurshid, K., Siddiqi, I., Faure, C., Vincent, N. (2009). Comparison of Niblack inspired Binarization methods for ancient documents. Proceedings of SPIE-IS&T Electronic Imaging, 7247, 1–9. DOI 10.1117/12.805827. [Google Scholar] [CrossRef]
37. Najafi, M. H., Murali, A., Lilja, D. J., Sartori, J. (2016). GPU-Accelerated nick local image thresholding algorithm. Proceedings of the International Conference on Parallel and Distributed Systems, pp. 576–584, Wuhan, China. [Google Scholar]
38. Kim, H., Ahn, E., Cho, S., Shin, M., Sim, S. H. (2017). Comparative analysis of image binarization methods for crack identification in concrete structures. Cement and Concrete Research, 99, 53–61. DOI 10.1016/j.cemconres.2017.04.018. [Google Scholar] [CrossRef]
39. Ramudu, K., Krishna Reddy, V. V., Abdul Rahim, B. (2015). Niblack method based segmentation for microscopic imagery. International Journal of Electrical and Electronics Engineers, 7(1), 23–29. [Google Scholar]
40. Subashini, P., Sridevi, N. (2011). An optimal binarization algorithm based on Particle Swarm Optimization. International Journal on Soft Computing and Engineering, 1(4), 32–36. [Google Scholar]
41. Bin Rais, N., Hanif, M. S., Taj, I. A. (2004). Adaptive thresholding technique for document image analysis. Proceedings of INMIC 2004–8th International Multitopic Conference, pp. 61–66, Lahore, Pakistan. [Google Scholar]
42. Kaur, E. N., Kaur, E. R. (2011). A review on various methods of image thresholding. International Journal of Computer Science and Engineering, 3(10), 3441. [Google Scholar]
43. Bradley, D., Roth, G. (2011). Adaptive thresholding using the integral image. Journal of Graphics Tools, 12(2), 13–21. DOI 10.1080/2151237X.2007.10129236. [Google Scholar] [CrossRef]
44. Mostafa, A., Elfattah, M. A., Fouad, A., Hassanien, A. E., Hefny, H. (2016). Wolf local thresholding approach for liver image segmentation in CT images. Advances in Intelligent Systems and Computing, 427, 641–651. DOI 10.1007/978-3-319-29504-6_59. [Google Scholar] [CrossRef]
45. Feng, M. L., Tan, Y. P. (2004). Contrast adaptive binarization of low quality document images. IEICE Electronics Express, 1(16), 501–506. DOI 10.1587/elex.1.501. [Google Scholar] [CrossRef]
46. Wolf, C., Jolion, J. M. (2004). Extraction and recognition of artificial text in multimedia documents. Pattern Analysis and Applications, 6(4), 309–326. DOI 10.1007/s10044-003-0197-7. [Google Scholar] [CrossRef]
47. Nacereddine, N., Boulmerka, A., Mhamda, N. (2019). Advances in intelligent systems and computing, vol. 892, pp. 46–54. Springer Nature Switzerland. [Google Scholar]
48. Mustafa, W. A., Yazid, H., Jaafar, M. (2018). An improved sauvola approach on document images binarization. Journal of Telecommunication, Electronic and Computer Engineering, 10(2), 43–50. [Google Scholar]
49. Sauvola, J., Pietikäinen, M. (2000). Adaptive document image binarization. Pattern Recognition, 33(2), 225–236. DOI 10.1016/S0031-3203(99)00055-2. [Google Scholar] [CrossRef]
 | This work is licensed under a Creative Commons Attribution 4.0 International License, which permits unrestricted use, distribution, and reproduction in any medium, provided the original work is properly cited. |