| Oncologie |
DOI: 10.32604/oncologie.2021.018705
ARTICLE
Predictive Value of p62 Protein in the Recurrence of Oral Squamous Cell Carcinoma
1Department of Stomatology, Beijing Tiantan Hospital, Capital Medical University, Beijing, China
2Department of Oral and Maxillofacial-Head and Neck Oncology, Beijing Stomatological Hospital, Capital Medical University, Beijing, China
*Corresponding Author: Hao Wang. Email: wh_ttkq@163.com
Received: 12 August 2021; Accepted: 21 October 2021
Abstract: Background: Tumor recurrence is one of the major problems that affect the postoperative efficacy of oral squamous cell carcinoma (OSCC) treatment. Autophagy is known to have a dual-sided effect on tumors. However, studies on autophagy and prognosis are limited. The purpose of this study is to analyze the relationship between autophagy and OSCC recurrence. Materials and Methods: 72 patients with OSCC were followed for 5 years after curative surgery. Tissue specimens from each patient were divided into tumor, normal, and marginal groups. Autophagy protein expression was assessed by western blotting and immunofluorescence. Statistical significance was evaluated using the chi-square test. The Kaplan-Meier method was employed to construct a survival curve, and the log-rank test was used to compare survival rates. Cox regression was utilized to describe independent prognostic risk factors. ROC analysis was performed to evaluate the utility of p62 and LC3II expression in assessing OSCC recurrence. Results: Correlations were observed between survival rates and T stage (p = 0.00439), lymph node metastasis (p < 0.001), tumor differentiation (p = 0.00423), and changes in p62 expression (p < 0.001). Multivariate analysis showed lower p62 protein expression in the tumor group compared to the normal group with a higher risk of recurrence (RR = 3.713), and lower p62 protein expression was found in the marginal group compared to the tumor group, with a lower risk of recurrence (RR = 0.170). Conclusion: Expression of p62 protein is one of the important factors influencing relapse in OSCC patients and can be used as an early predictor of OSCC relapse.
Keywords: Oral squamous cell carcinoma; autophagy; prognosis; p62
Oral squamous cell carcinoma (OSCC) is the second most malignant tumor with the worst prognosis in head and neck cancer (HNC) [1]. Despite recent advances in treatment modalities, the five-year survival rate of OSCC has not improved. Tumor recurrence leads to poor prognosis [2]. In China, the overall survival rate is within the range of 50%–70% [3]. Identifying recurrence factors of OSCC is an emerging issue in clinic practice.
To date, extensive local resection and intraoperative frozen section for marginal assessment have become the first choice for therapeutic surgery, coupled with the anatomical reconstruction of the head and neck [4]. Major challenges, such as low survival rate and poor prognosis, emphasize the need to propose novel therapeutic strategies. In 2011, Guo et al. [5] proposed the concept of “autophagy addiction”, which suggests that targeting autophagy and mitochondrial metabolism are valuable new approaches for aggressive cancers. In 2018, Zhu et al. [6] suggested that the autophagy-related gene expression profiles may be a biological indicator for the prognosis of OSCC. Under this background, we collected clinical information, tissue specimens and post-operative follow-up data of OSCC patients, and assessed expression changes of autophagy marker proteins in an attempt to investigate the correlation between autophagy protein expression and OSCC recurrence.
The following inclusion criteria for patients were: (I) previously received treatment for OSCC, (II) underwent surgical treatment, (III) neither chemotherapy nor radiotherapy was administered prior to surgery, and absence of distant metastases was confirmed by PET scan, (IV) primary OSCC was diagnosed by preoperative and postoperative pathologic examination. Complete clinicopathological and follow-up data were carefully retrieved from the medical archives of Beijing Tiantan Hospital, Beijing, China and Beijing Capital Medical University School of Stomatology, Beijing, China. Recurrence was defined as local recurrence in situ, regional lymph node metastasis, and death caused by OSCC. The recurrence time was determined by the duration from first pathological diagnosis to pathologic confirmation of recurrence.
The exclusion criteria were: (I) patients too old to suffer or refuse surgery treatment, (II) history of renal failure and hepatitis and poor performance status, (III) patients who died of other diseases within five years after surgery, (IV) lost to follow-up due to failure to re-examine on time or change in contact information.
Based on these criteria, 72 eligible patients (40 males and 32 females) were enrolled. After the consent of the patient and their family members, the tumor was surgically excised, and pathological examination was performed. Approval for tissue collection and patient clinical information for medical research purposes was granted by the Ethics Committee of the Beijing Tiantan Hospital, Capital Medical University (Approval No. KY2013-015-02).
Tumor, node, and metastasis classification were assessed according to the American Joint Committee on Cancer 7th edition criteria [7], and further classified as Stages I, II, III, and IV. Broders’ classification was used to evaluate histology tissues stained with hematoxylin/eosin and divided cell differentiation into highly, moderately, or poorly differentiated.
Besides common parameters, such as age, gender, date of diagnosis, date of primary operation, last follow-up date, date of recurrence, and tumor sites, the main variables used in our study were pathological T stage, N stage, degree of differentiation, and expression of autophagy protein.
Biopsy specimens were excised from three regions: normal tissue, more than 20 mm from the resection edge, surgical margin tissue between tumor and normal tissue (1–5 mm) [8], and center tumor tissue of OSCC. Specimens from the same patient were divided into tumor group (T), normal group (N), and marginal group (M) for comparison to minimize the effect of individual and anatomical site differences. Specimens were stored in liquid nitrogen within 10 min after surgery.
2.3 Western Blot Analysis and Immunofluorescence Staining
To accurately estimate autophagic activity, it is essential to determine autophagic flux. In our study, we used microtubule-associated protein light chain 3 (LC3) as an autophagosome marker [9]. LC3-I is conjugated to phosphatidylethanolamine to form LC3-II, which is indicative of autophagosome formation [10]. Due to weak expression of LC3-I [11], glyceraldehyde 3-phosphate dehydrogenase (GAPDH) was used to calculate the amount of LC3-II (LC3-II/GAPDH). At the same time, sequestosome-1 (SQSTM1, also known as p62) binds to LC3 and is selectively degraded by autophagy, so that degradation of p62 is another marker to monitor autophagy flux [9].
The OSCC specimens were lysed in a complex buffer (Roche, Switzerland) and then centrifuged at 15,000 g at 4°C. Bicinchoninic acid protein assay kit (Pierce Biotechnology, Rockford, IL, USA) was used for protein concentration assay. The lysates, contained 40 μg protein, were loaded into 10% bis-Tris SDS-PAGE gels for each lane and transferred onto polyvinylidene fluoride membranes (Merck Millipore, Burlington, MA, USA). After being blocked in buffered saline, the membranes were incubated with antibodies against LC3-II (1:1,000; Thermo Fisher Scientific, Waltham, MA, USA), p62 (1:10,000; Abcam, Cambridge, UK), and GAPDH (1:8,000; Sigma-Aldrich, St. Louis, MO, USA), followed by incubation with horseradish peroxidase-conjugated secondary antibodies (Santa Cruz Biotechnology, Santa Cruz, CA, USA). The immunoreactive band intensity was quantitated using Image-Pro Plus 6.0 (Media Cybernetics, Rockville, MD, USA).
Prior to immunofluorescence staining, specimens were prepared into 5 μm frozen sections. Sections were incubated with anti-LC3-II (1:300) and anti-p62 (1:400) overnight, then developed with Alexa Fluor 594 chicken anti-rabbit IgG (1:200) and photographed with a confocal microscope (LSM 880 with Airyscan; Carl Zeiss Microscopy, Thornwood, NY, USA).
2.4 Follow-Up and Statistical Analysis
Patients were followed for five years until 2019 by out-patient re-examination.
The SPSS software (version 21.0; IBM Corp., Armonk, NY, USA) and SigmaPlot software (version 14.0; Systat Software, Inc., San Jose, CA, USA) were used for statistical analysis. Statistical significance of recurrence and autophagy expression was evaluated using the chi-square test. The Kaplan-Meier method was employed to draw a survival curve, and log-rank test was used to compare survival rates among T, N and M groups. ROC analysis was performed to evaluate the clinical utility of p62 and LC3-II expression for OSCC recurrence. Cox regression was utilized to describe independent prognostic risk factors of OSCC. All p-values were bilatetal, and p-values less than 0.05 were considered statistically significant.
3.1 Clinicopathologic and Histologic Features of Patients with OSCC
The clinicopathologic characteristics of 72 OSCC patients are summarized in Table 1. There were 40 (54.795%) males and 32 (43.836%) females (1.25:1). The age range was 25–81 years, and median age was 63 years.
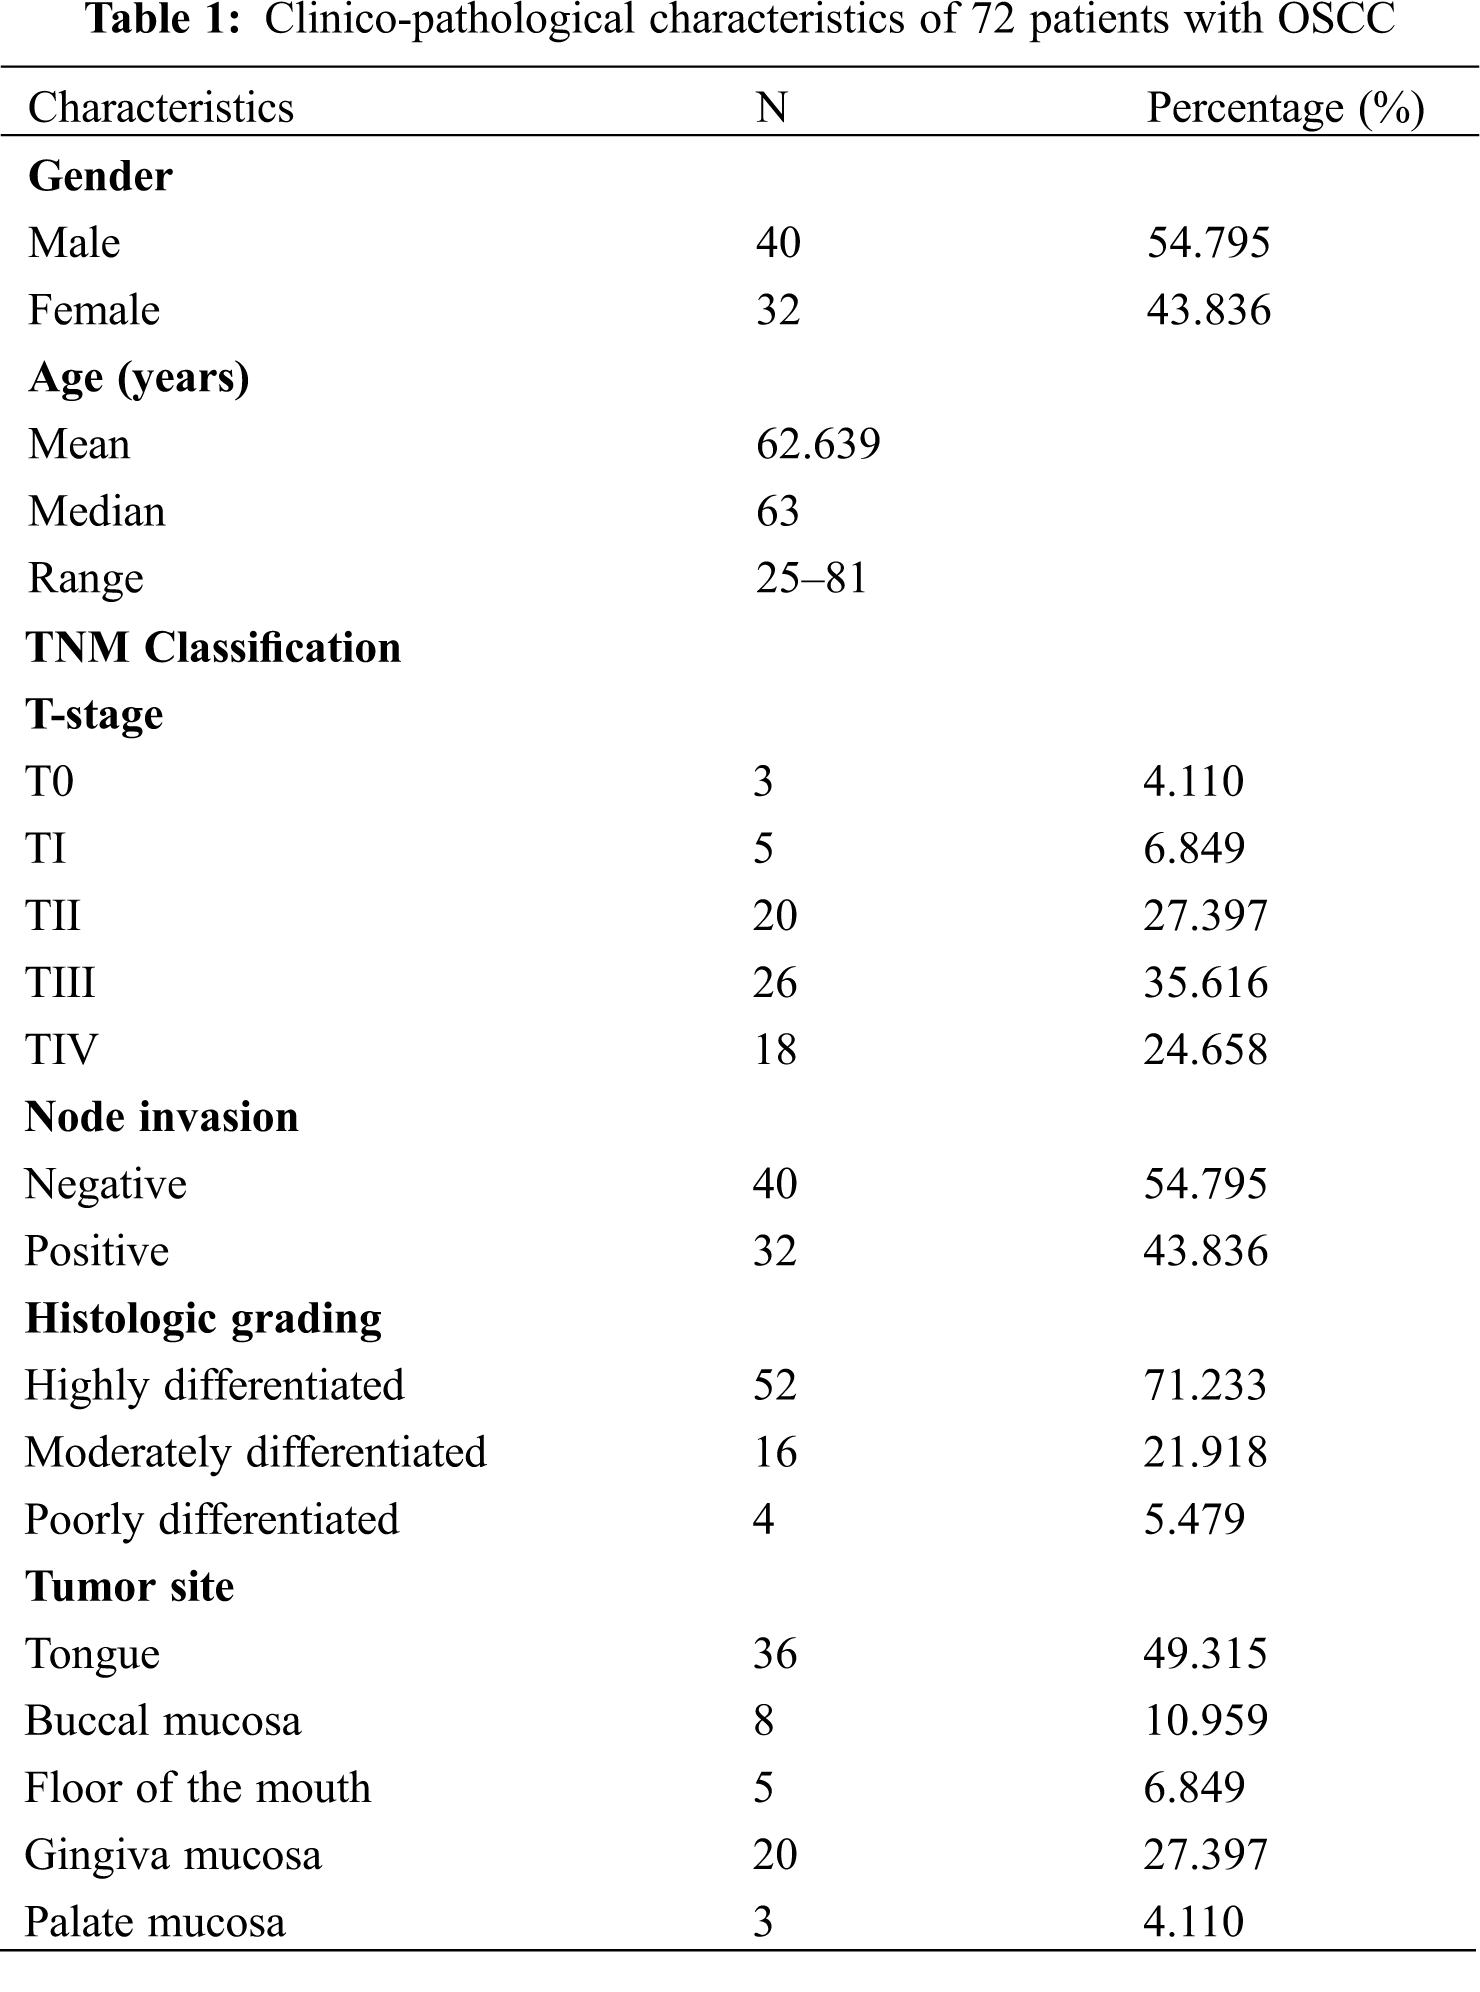
The highest incidence site of OSCC was the tongue (49.315%), followed by the gingival mucosa (27.397%), buccal mucosa (10.959%), floor of the mouth (6.849%), and palate mucosa (4.110%). In terms of TNM stage and histological differentiation, 26 patients (35.616%) had T-III tumors, 20 patients (27.397%) had T-II, while T-IV, T-I, and T-0 were observed in 18 cases (24.658%), 5 cases (6.849%) and 3 cases (4.110%), respectively. No lymph node metastases were found in 40 patients (54.795%), while 32 patients (43.836%) had positive lymph node metastases. 52 patients were described as highly differentiated, 16 patients were moderately differentiated, and 4 patients were poorly differentiated.
3.2 Comparison of Autophagy Marker Proteins in Different Regions
3.2.1 Expression of LC3 in OSCC Patients
Immunofluorescence qualitative detection and semiquantitative analysis of protein electrophoresis revealed that the number of LC3-II-positive puncta was markedly higher in tumor and marginal groups than in the normal group (red arrows, Fig. 1A). Western blotting revealed LC3-II expression was significantly higher in marginal (p < 0.0001) and tumor groups (p < 0.0001) than in the normal group (Figs. 1B and 1C). However, comparison among the T, N, and M groups did not show any significant difference in LC3-II expression between relapsed and non-relapsed patients (Fig. 1D).
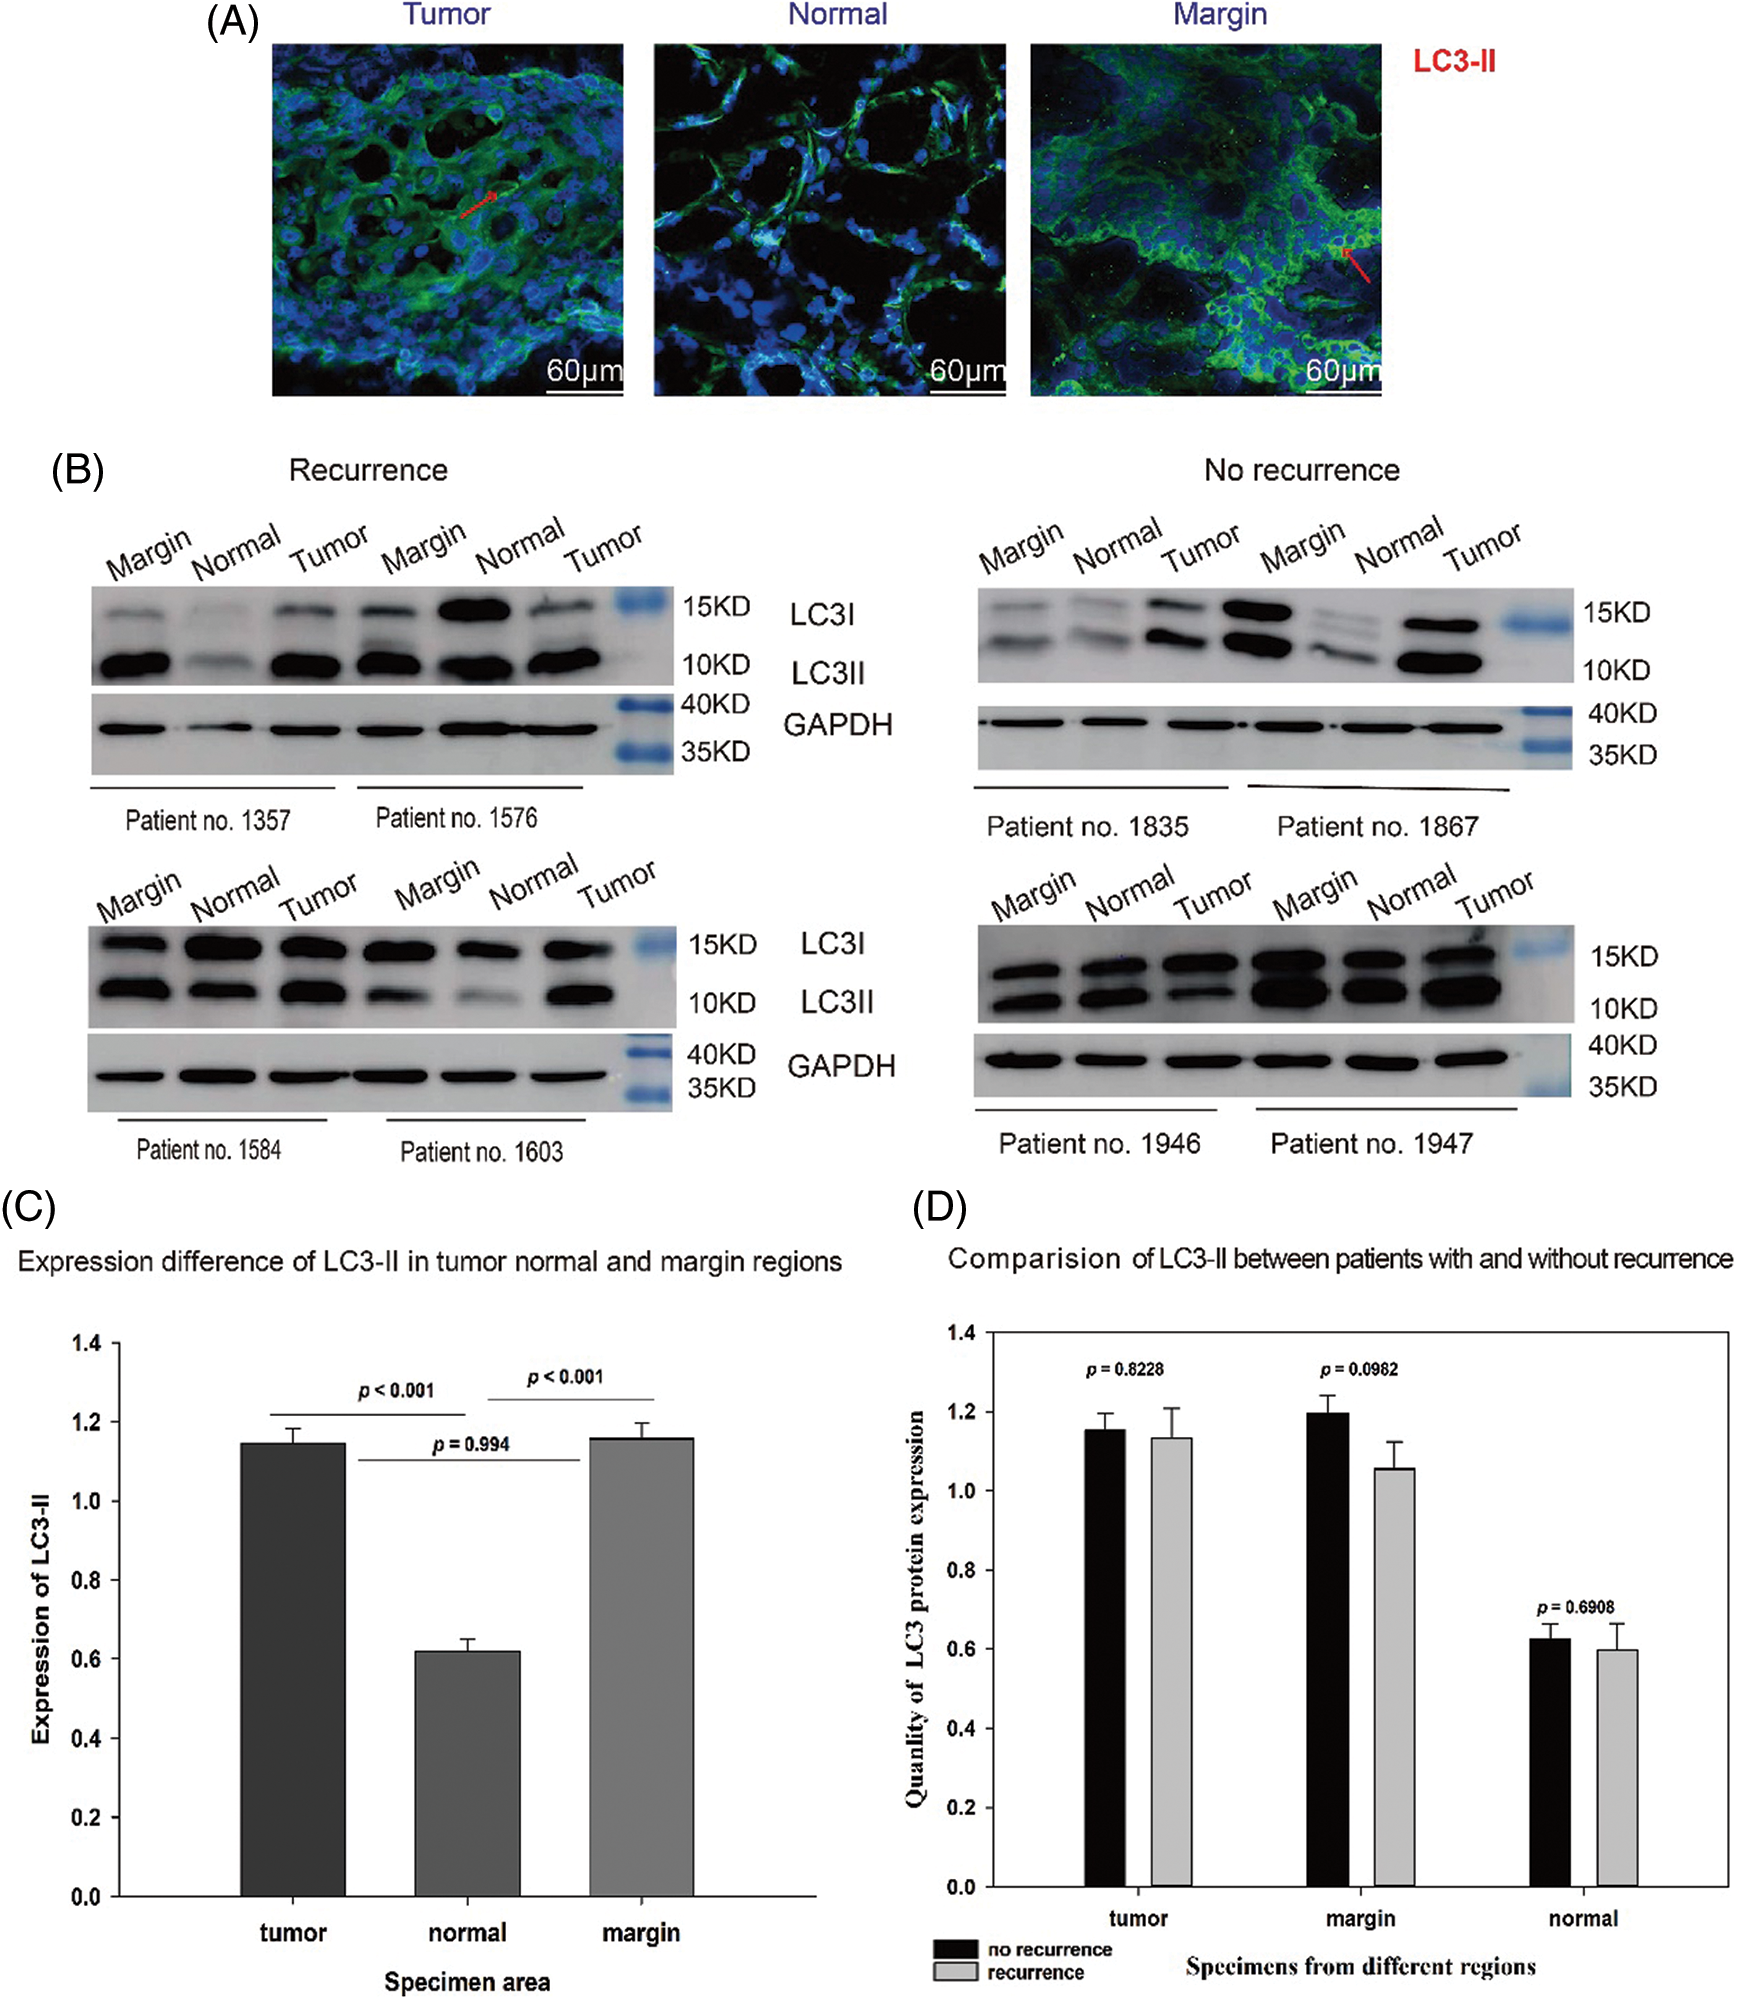
Figure 1: Expression of LC3-I/II in OSCC patients. (A) LC3-II dots in green marked with a red arrow in the tumor, normal, and marginal tissue by IF. It shows that in tumor and marginal region green fluorescent dots can be observed easily than in normal region. (B) Western blot assay showing the expression of LC3-I/II protein in the tumor, normal, and marginal tissue, which compared between patients with recurrence and non-recurrence. All protein bands were randomly selected from 72 samples. T: tumor N: normal M: marginal. (C) The expression difference of LC3-II in different regions. In T group, the expression value (MEAN ± SD) was 1.147 ± 0.0367; in N group, the value was 0.619 ± 0.0321; in M group, the value was 1.157 ± 0.0381. (D) The expression difference of LC3-II between no-recurrence patients and recurrence patients. In T group, the value of no-recurrence vs. recurrence was 1.1520 ± 0.0423 vs. 1.1330 ± 0.0749; in M group, the value of no-recurrence vs. recurrence was 1.1960 ± 0.0450 vs. 1.0550 ± 0.0682; in N group, the value of no-recurrence vs. recurrence was 0.6270 ± 0.0365 vs. 0.5980 ± 0.0672
3.2.2 Expression of p62 in OSCC Patients
In terms of p62 protein, a higher number of p62-positive puncta was observed in marginal and tumor groups than in the normal group (red arrows Fig. 2A). Western blotting also showed that p62, above the yellow line, was significantly upregulated in marginal (p = 0.003) and tumor groups (p < 0.001) (Figs. 2B and 2C). Similarly, comparison among the T, N, and M groups did not indicate any significant differences in p62 expression between relapsed and non-relapsed patients (Fig. 2D).
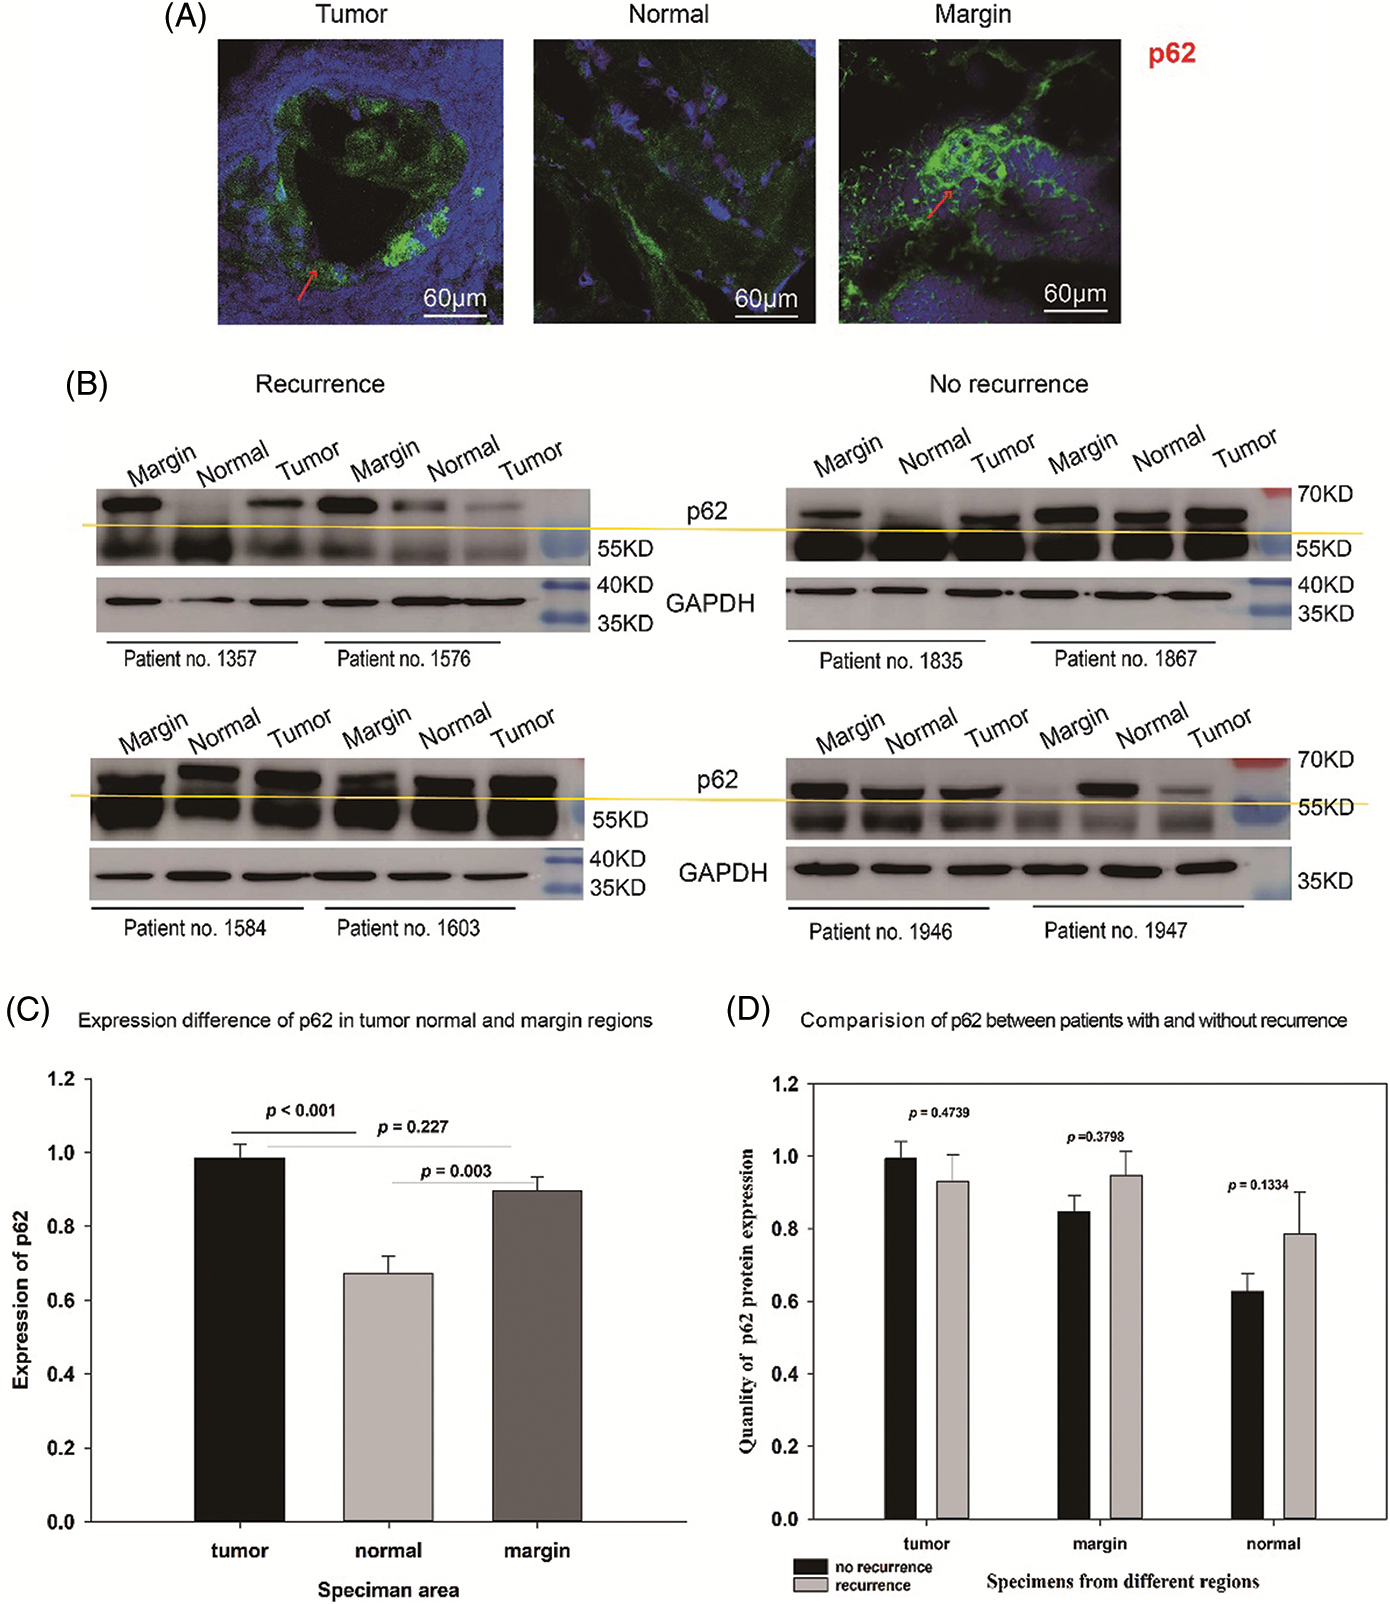
Figure 2: Expression of p62 in OSCC patients. (A) p62 dots in green marked with red arrow in tumor, normal, and marginal tissue by IF. It shows that in tumor and marginal region green fluorescent dots can be observed easily than in normal region. (B) Western blot assay showing the expression of p62 protein (above the yellow line) in tumor, normal, and marginal tissue, which compared between patients with recurrence and non-recurrence. All protein bands were randomly selected from 72 samples. T: tumor N: normal M: marginal. (C) The expression difference of p62 in different regions. In T group, the expression value (MEAN ± SD) was 0.984 ± 0.0382; in N group, the value was 0.671 ± 0.0475; in M group, the value was 0.895 ± 0.0375. (D) The expression difference of p62 between no-recurrence patients and recurrence patients. In T group, the value of no-recurrence vs. recurrence was 0.9940 ± 0.0467 vs. 0.9310 ± 0.0736; in M group, the value of no-recurrence vs. recurrence was 0.8470 ± 0.0452 vs. 0.9480 ± 0.0664; in N group, the value of no-recurrence vs. recurrence was 0.6270 ± 0.0489 vs. 0.7870 ± 0.1130
3.2.3 Correlation of p62 Expression with Recurrence of OSCC
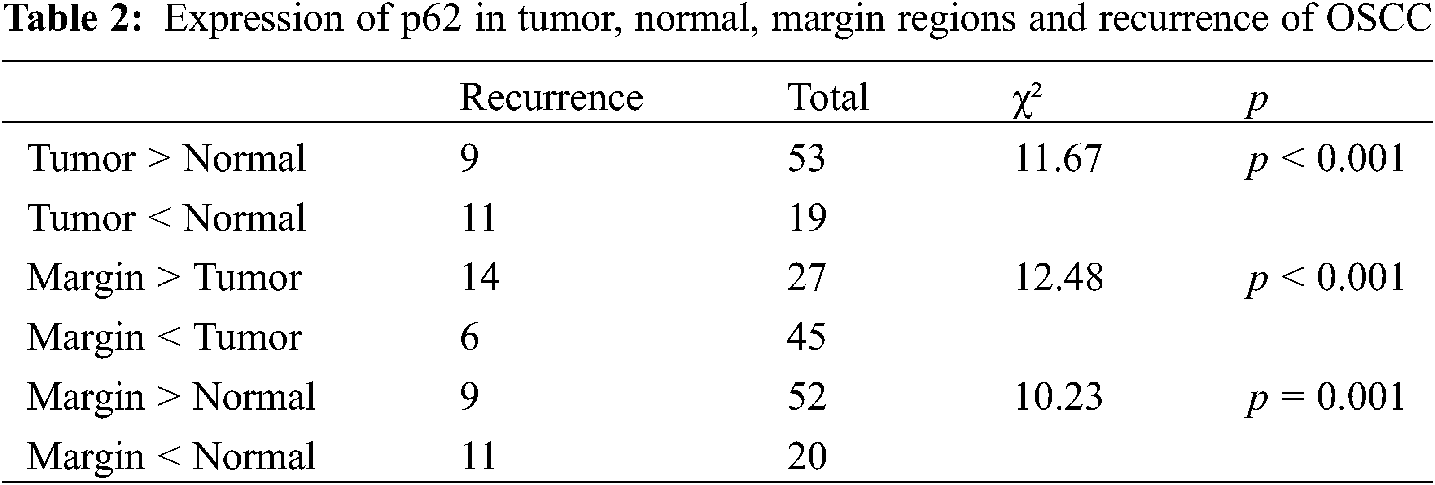
Correlation between the level of p62 expression in each of two groups and the number of patients who relapsed was revealed (Table 2). Between the tumor and normal groups, p62 expression was higher in the tumor group with 9 relapsed patients, while p62 expression was higher in normal group with 11 relapsed patients (p < 0.001). Between the tumor and marginal groups, p62 expression was higher in the tumor group with 6 relapsed patients; otherwise, p62 expression was higher in the marginal group, with 14 relapsed patients (p < 0.001). Lastly, comparing the marginal group with the normal group, higher levels of p62 expression in marginal group was accompanied by 9 relapsed patients, while higher levels of p62 expression in normal group was associated with 11 relapsed patients (p = 0.001).
3.2.4 Correlation of LC3-II Expression with Recurrence of OSCC
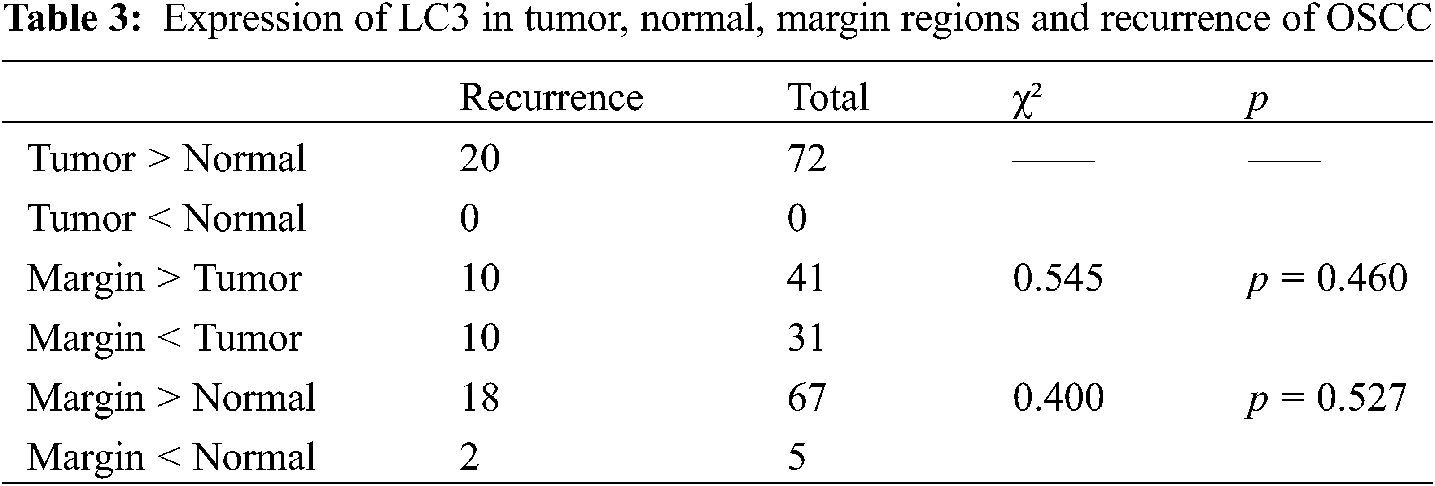
In terms of LC3-II expression, we found there was no significant difference in the pairwise comparison of tumor, normal, and marginal groups (Table 3).
3.3 Univariate Analysis between Clinicopathological Variables and p62 Expression and Survival Rate
72 patients were followed up, 20 with recurrence (including death caused by OSCC, in-situ recurrence, and lymph node metastasis), and the overall survival rate was as high as 72.23% (Fig. 3A).
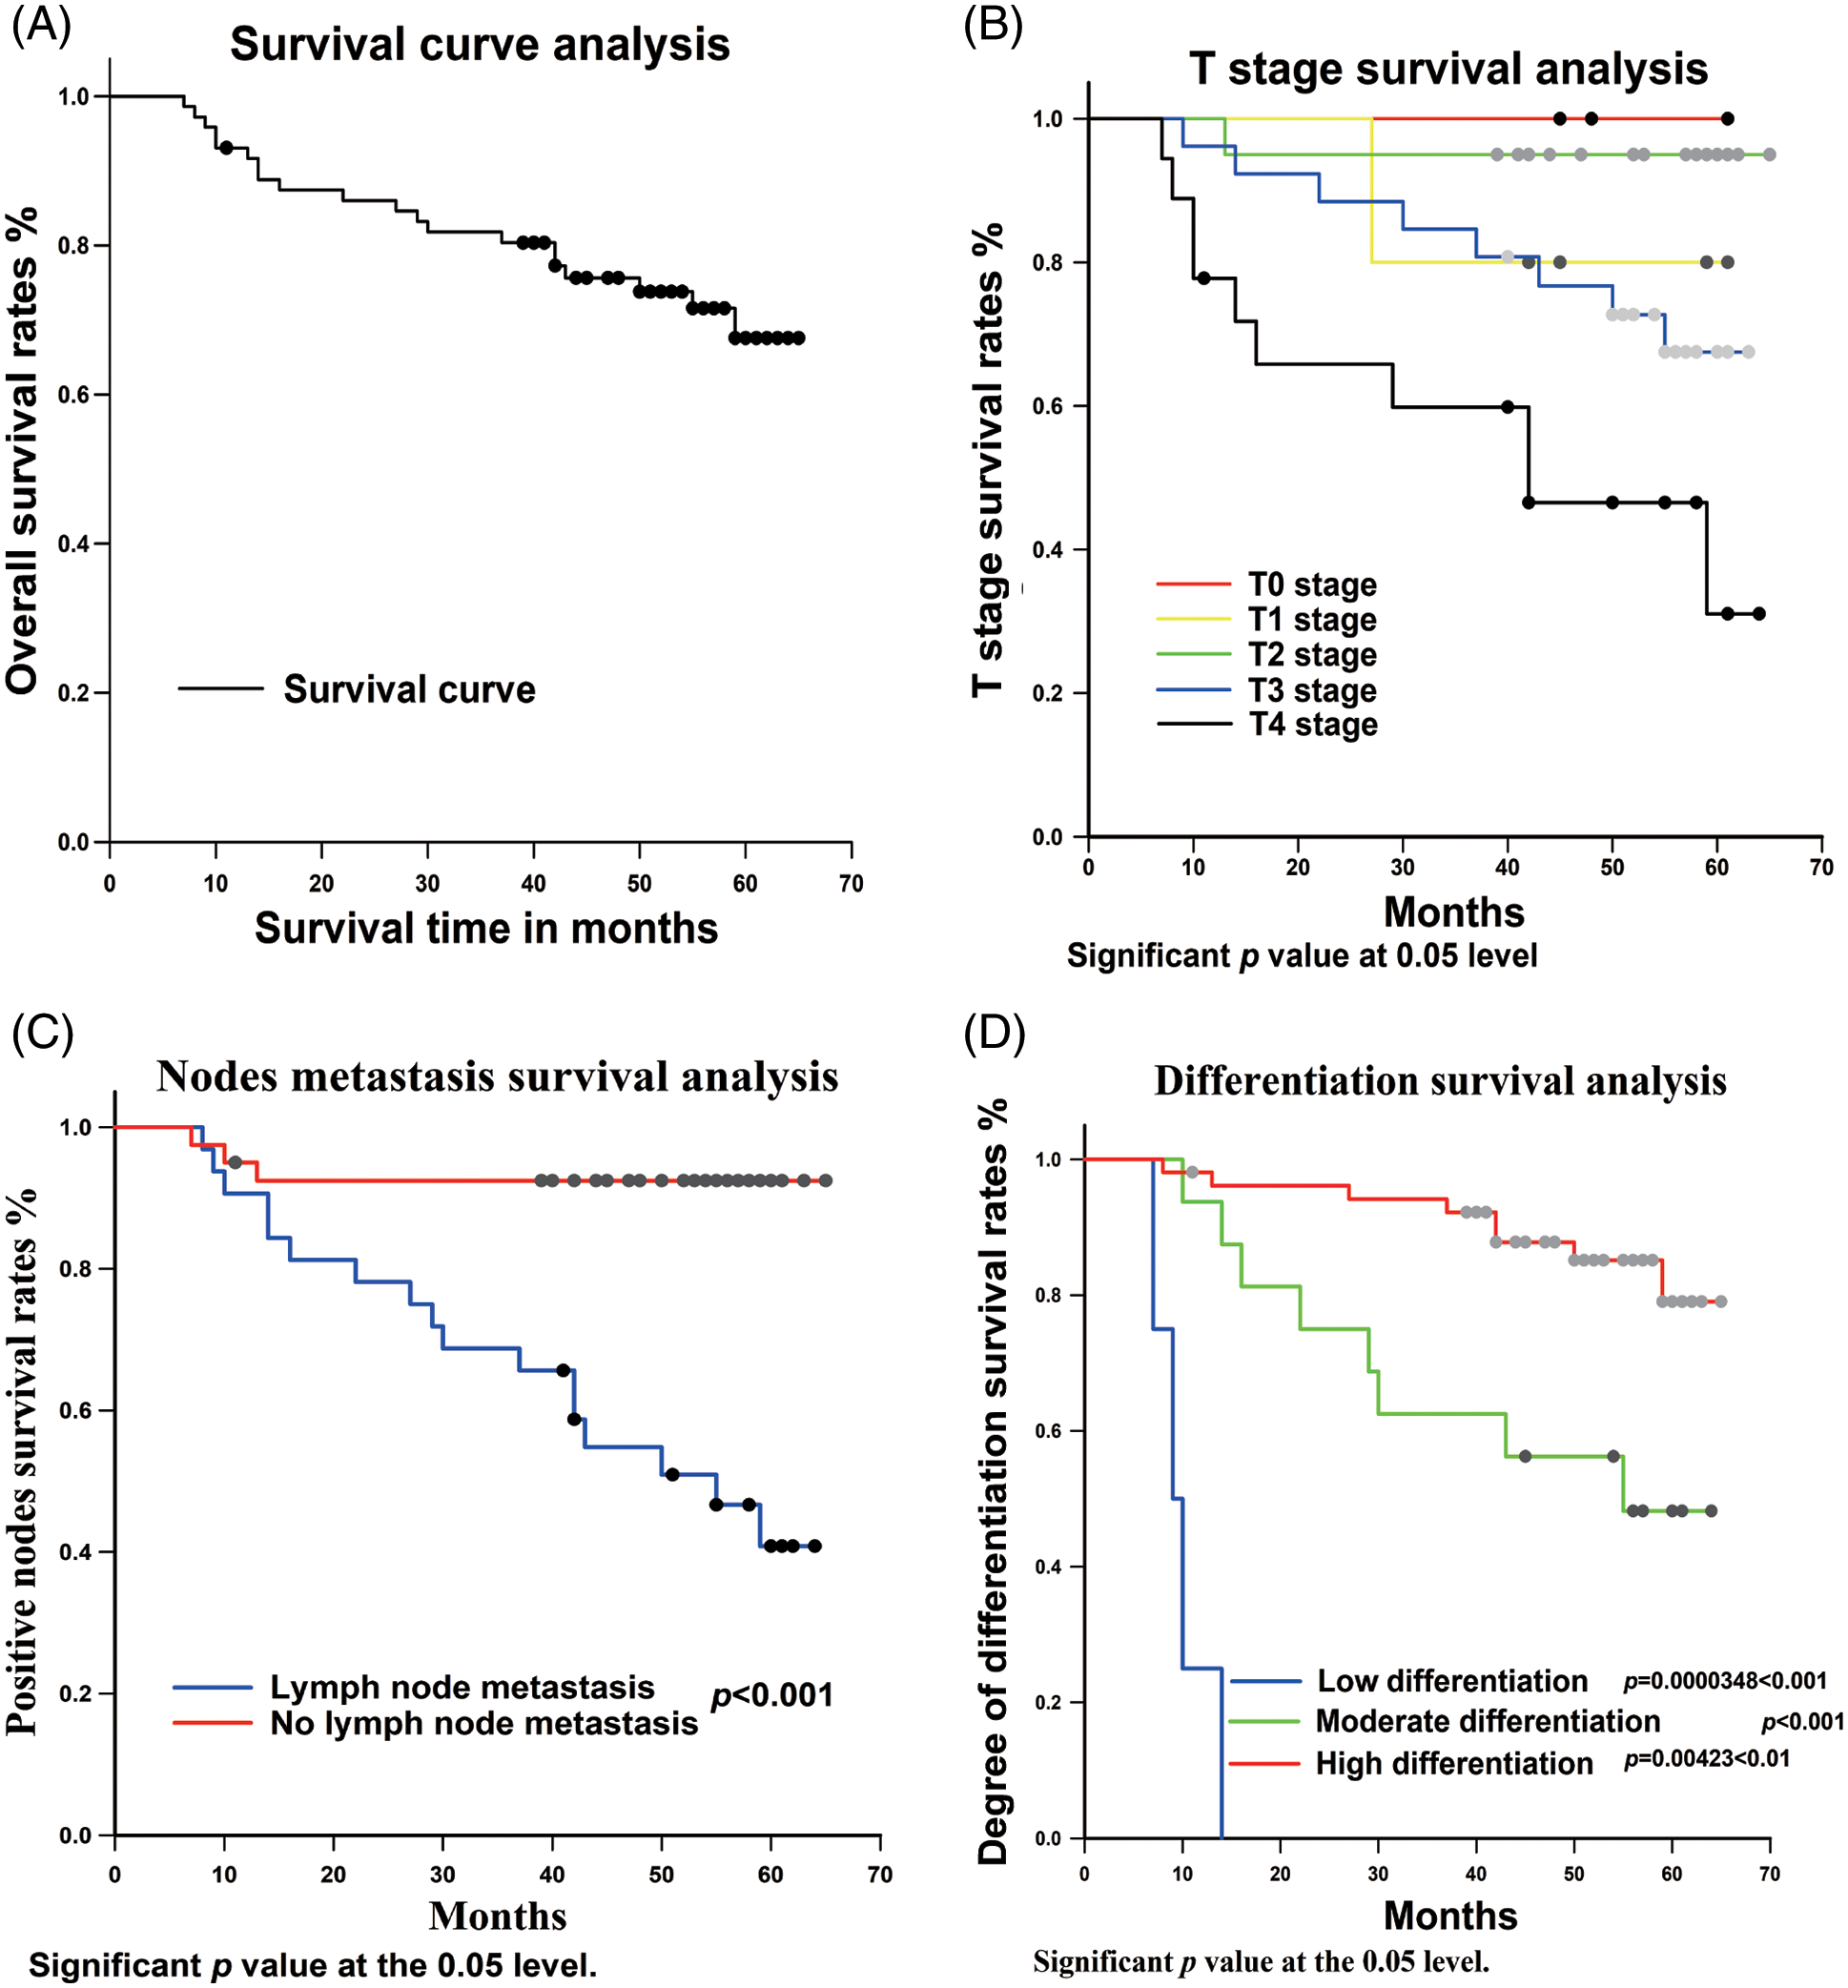
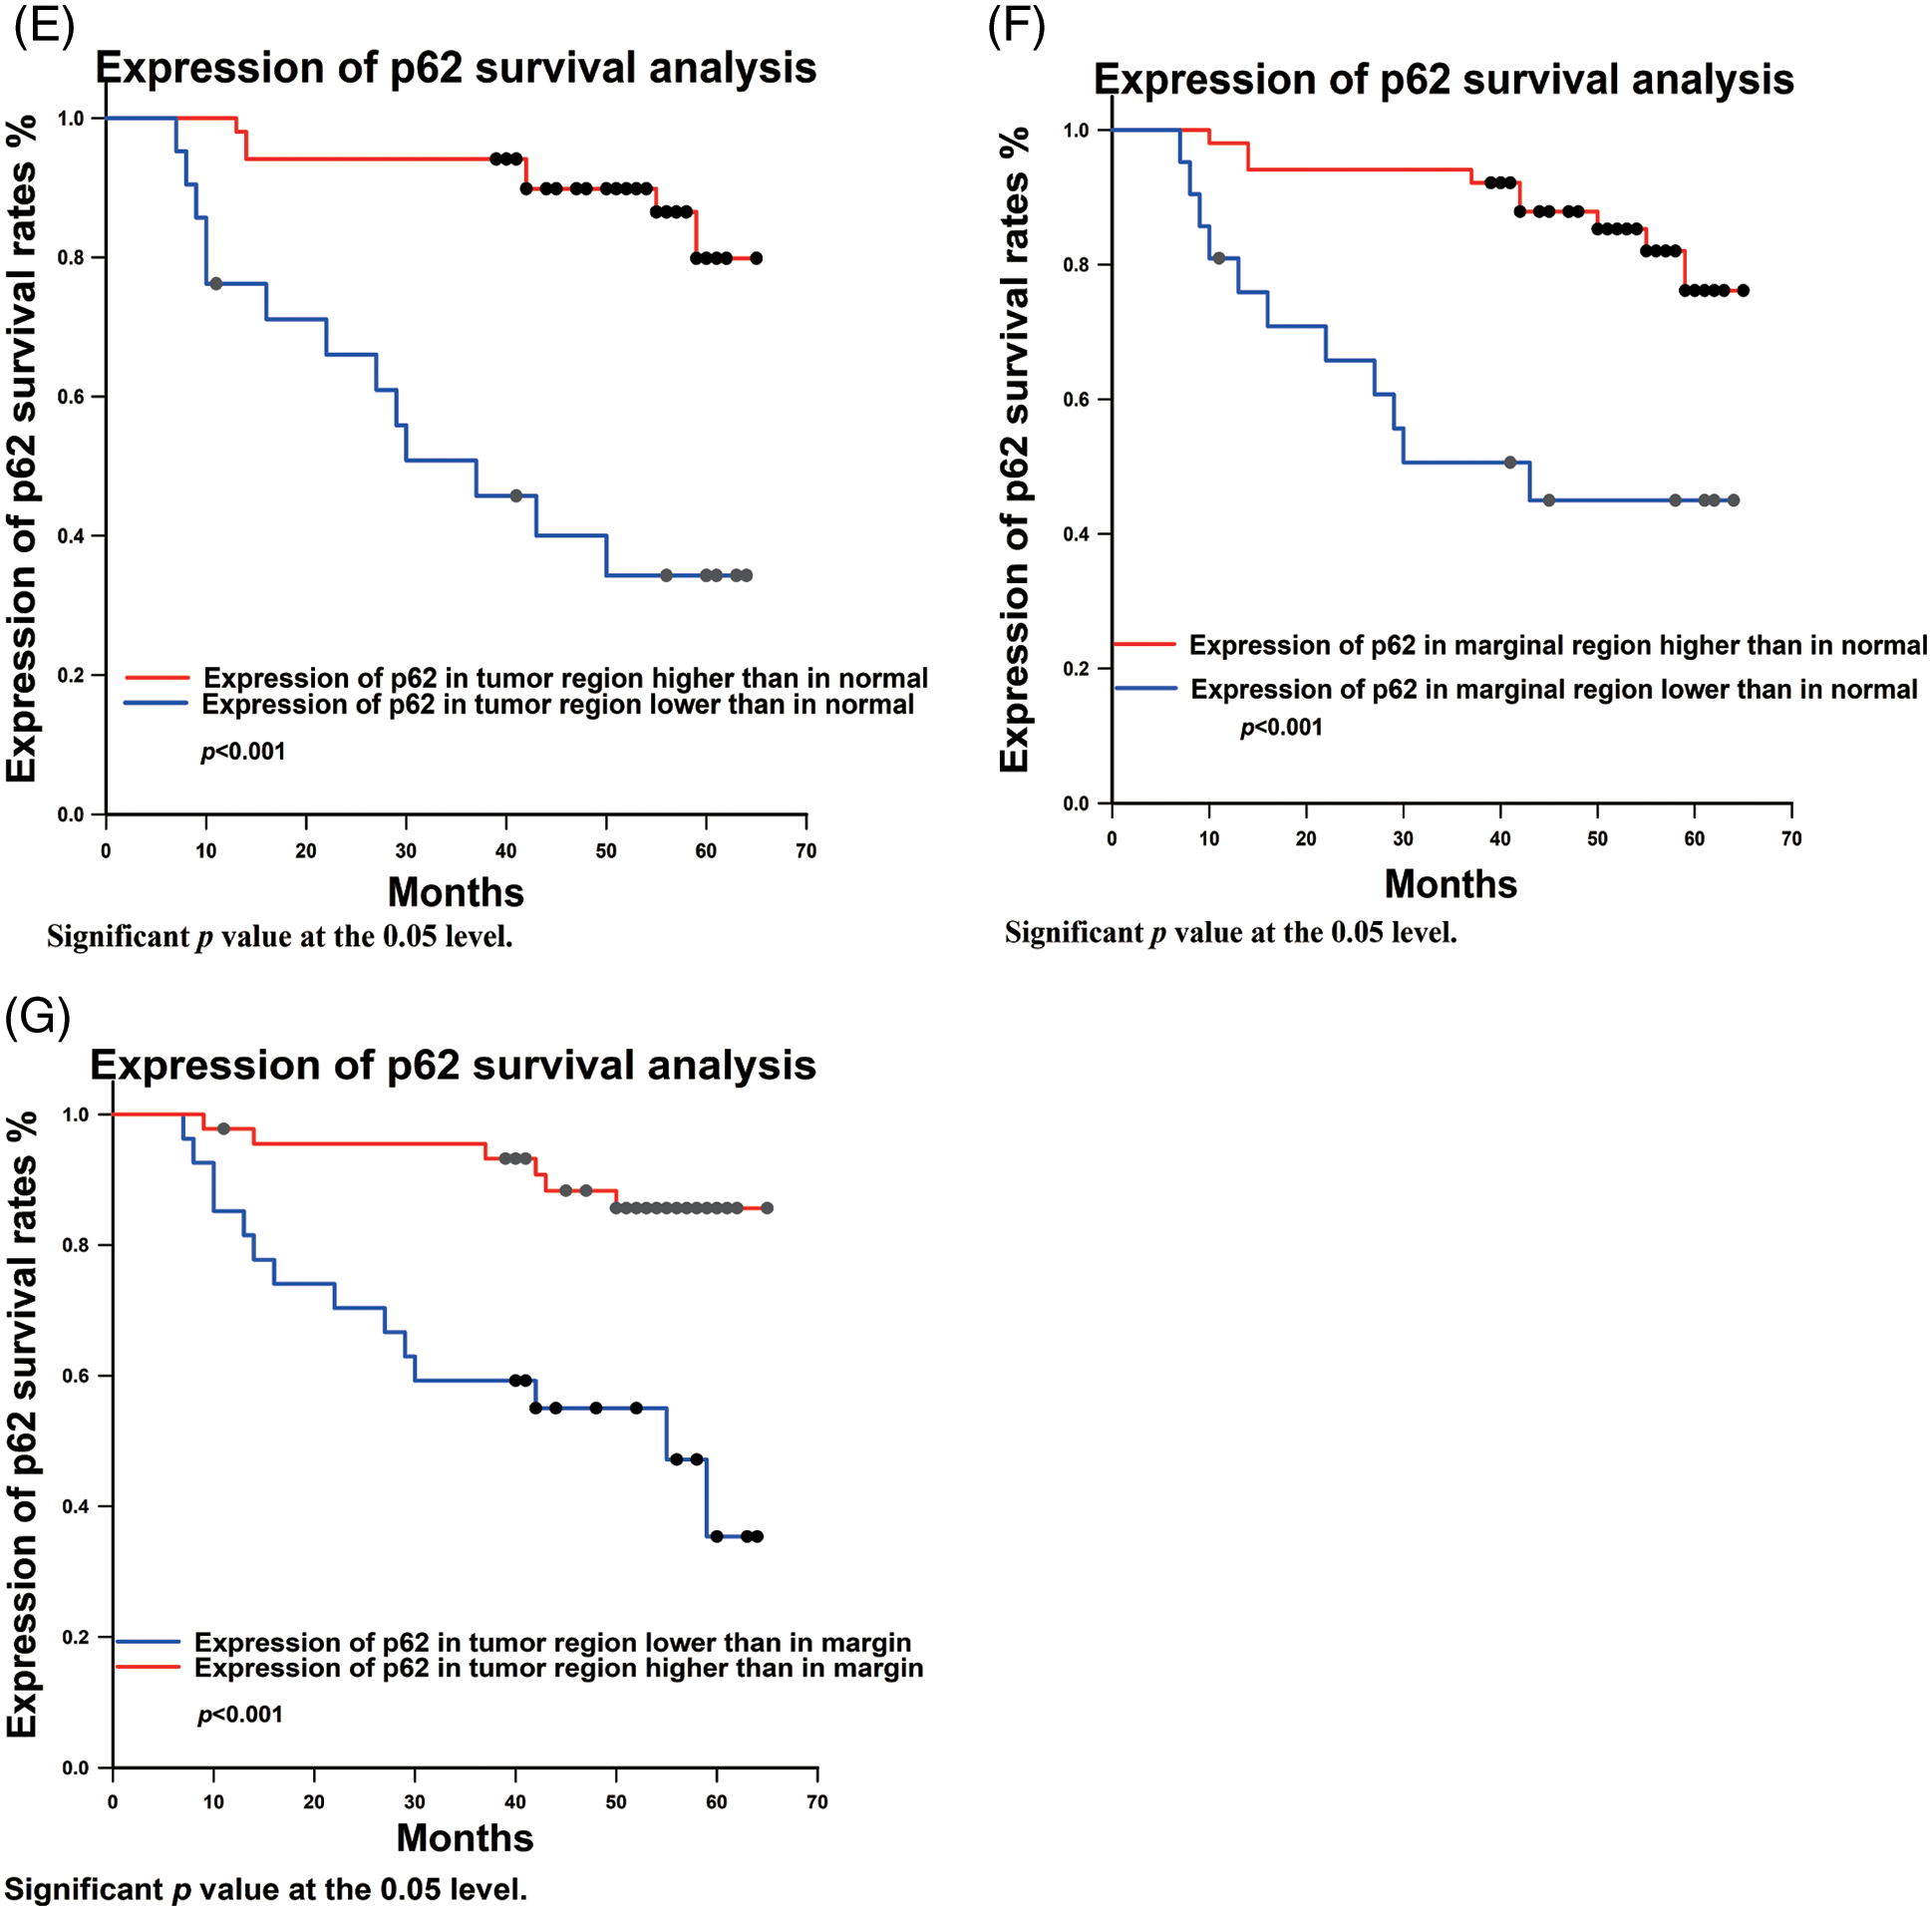
Figure 3: Univariate analysis between clinicopathological variables and p62 expression and survival rate. (A) total survival analysis; (B) Tumor stage survival analysis; (C) nodes metastasis survival analysis; (D) Degree of differentiation of OSCC survival analysis; (E–G): expression of p62 in different regions survival analysis
On this basis, the possible prognostic risk factors, i.e., T stage, lymph node metastasis, tumor differentiation, and p62 protein expression, were analyzed using univariate cox regression.
3.3.1 Univariate Analysis of T Stage and Survival Rate
In this study, we analyzed the relationship between primary tumor size and OSCC prognosis. The results showed that the higher the tumor stage, the worse the postoperative prognosis (Fig. 3B). There was a statistical difference between TII and TIV (p = 0.00439 < 0.05), whereas no statistical differences between TI and TII (p = 0.831), TIII and TIV (p = 0.334), TI and TIV (p = 0.632) were observed.
3.3.2 Univariate Analysis of Lymph Node Metastasis and Survival Rate
In terms of lymph node metastasis, the statistical results showed that there was a statistical difference in the prognostic effect between those with and without lymph node metastasis (p < 0.001) (Fig. 3C).
3.3.3 Univariate Analysis of Tumor Differentiation Degree and Survival Rate
According to the analysis of tumor differentiation, it was shown that the prognosis for patients with highly differentiated tumors was significantly better than those with moderate and low differentiation (Fig. 3D). The p value between highly and moderately differentiated tumors was p = 0.00423 < 0.01, between highly and poorly differentiated p < 0.001, and between moderately and poorly differentiated p = 0.0000348 < 0.001.
3.3.4 Univariate Analysis of Differences in p62 Differentiation and Survival Rate
p62 expression in tumor, marginal, and normal regions and survival rates exhibited statistical differences. Statistical analysis revealed that prognosis was worse when p62 expression was lower in the tumor region compared to the normal region (p < 0.001) (Fig. 3E). Similarly, analyzing the ratio of p62 expression from tumor region to normal region (T/N) (p < 0.001), and tumor region to marginal region (T/M) (p < 0.001), there is better prognosis with a higher ratio of p62 expression (Figs. 3F, 3G).
3.4 ROC Analysis for Test Assessment
ROC analysis was used to evaluate the sensitivity and specificity of our test. An area under the ROC curve (AUC) of 0.5 indicates that the test has no discriminating ability, while an AUC of 1.0 shows that a test has strong discriminatory power.
In terms of p62 expression compared between tumor and normal regions, the AUC was 0.726, while the AUC comparing the marginal and normal regions was 0.669 (Fig. 4A). When LC3-II protein was considered, the AUC values were 0.892 and 0.890 when comparing tumor to normal sites and marginal to normal sites, respectively (Fig. 4B).
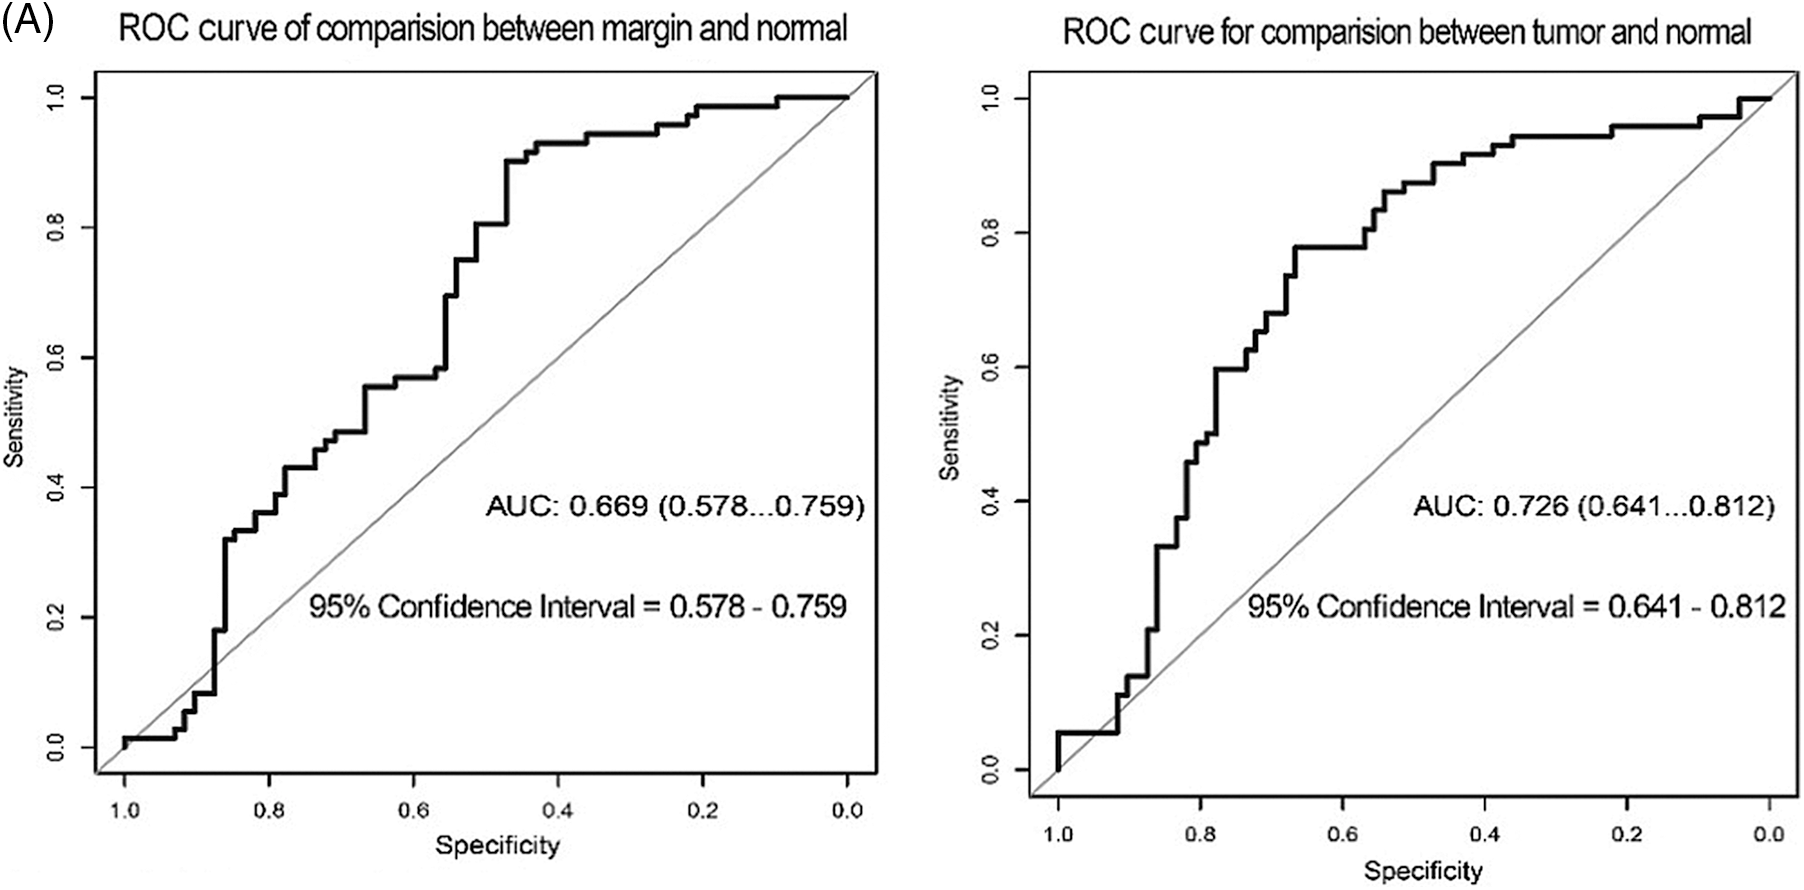
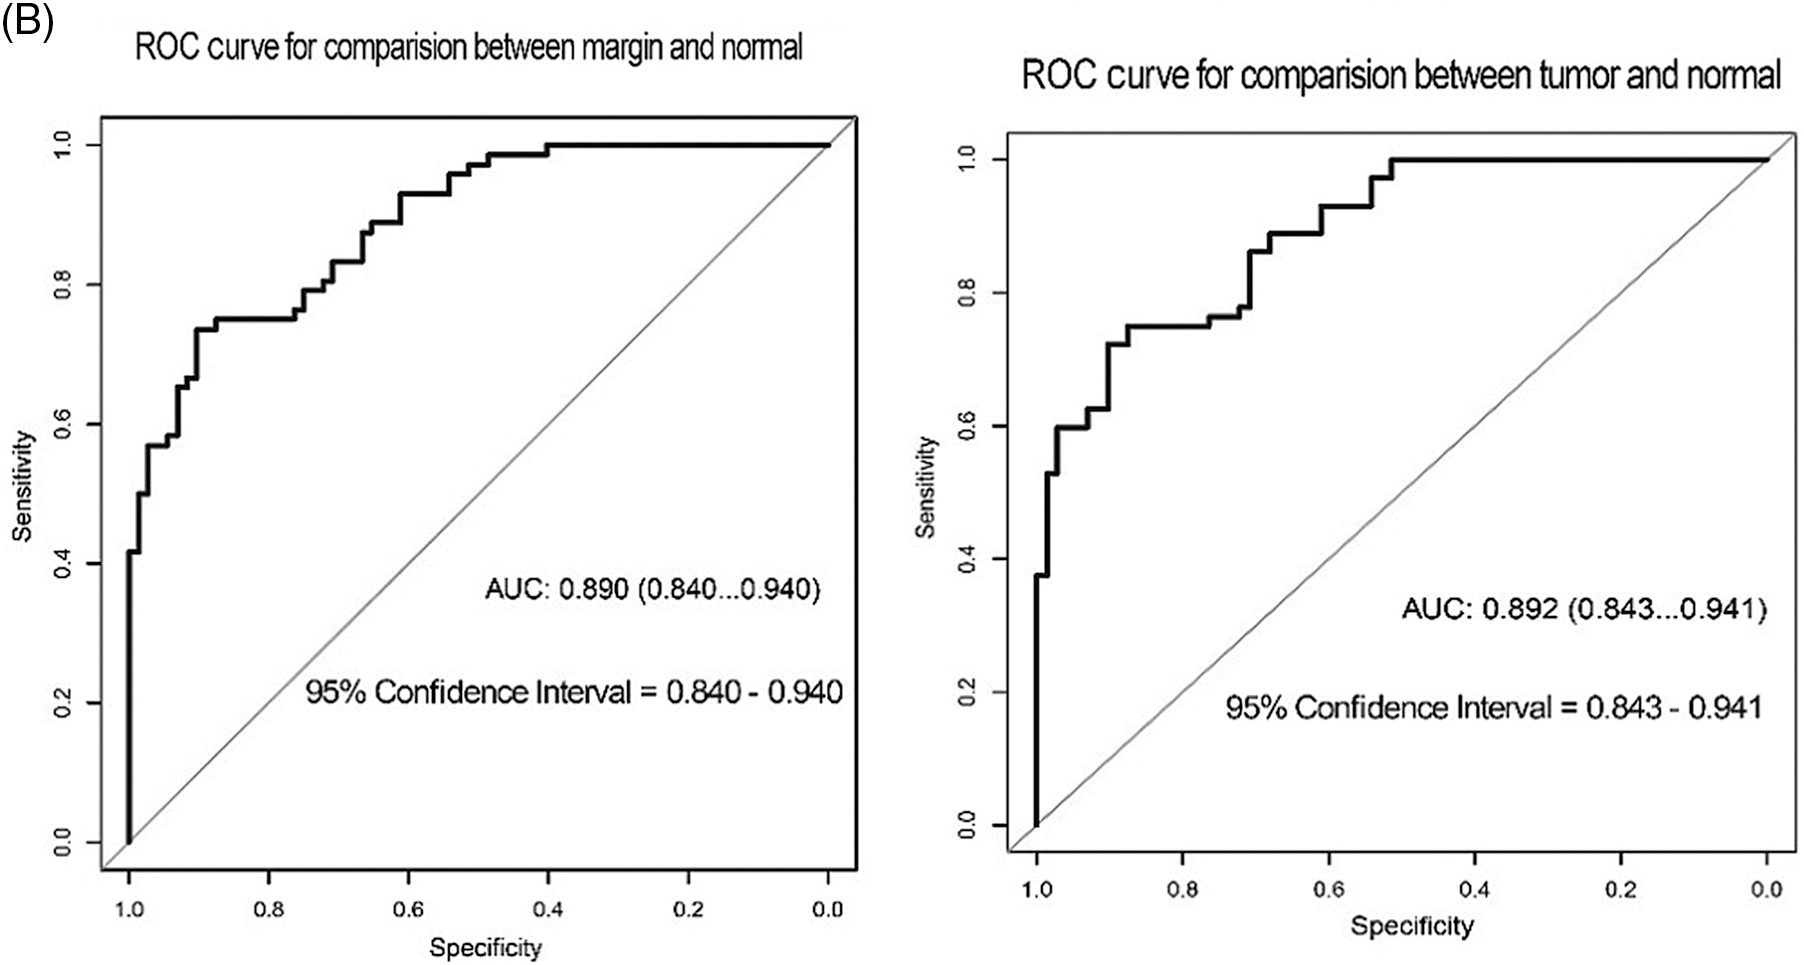
Figure 4: ROC curve test for the correlation of p62 and LC3-II expression with recurrence of OSCC. (A) ROC for p62 expression (B) ROC for LC3II expression
3.5 Cox Multivariate Analysis of Survival and Other Clinicopathological Variables and p62 Expression
The multivariate cox hazard regression model revealed that the meaningful variables included lymph node metastasis, degree of differentiation, and p62 protein expression in different tissues (Table 4).
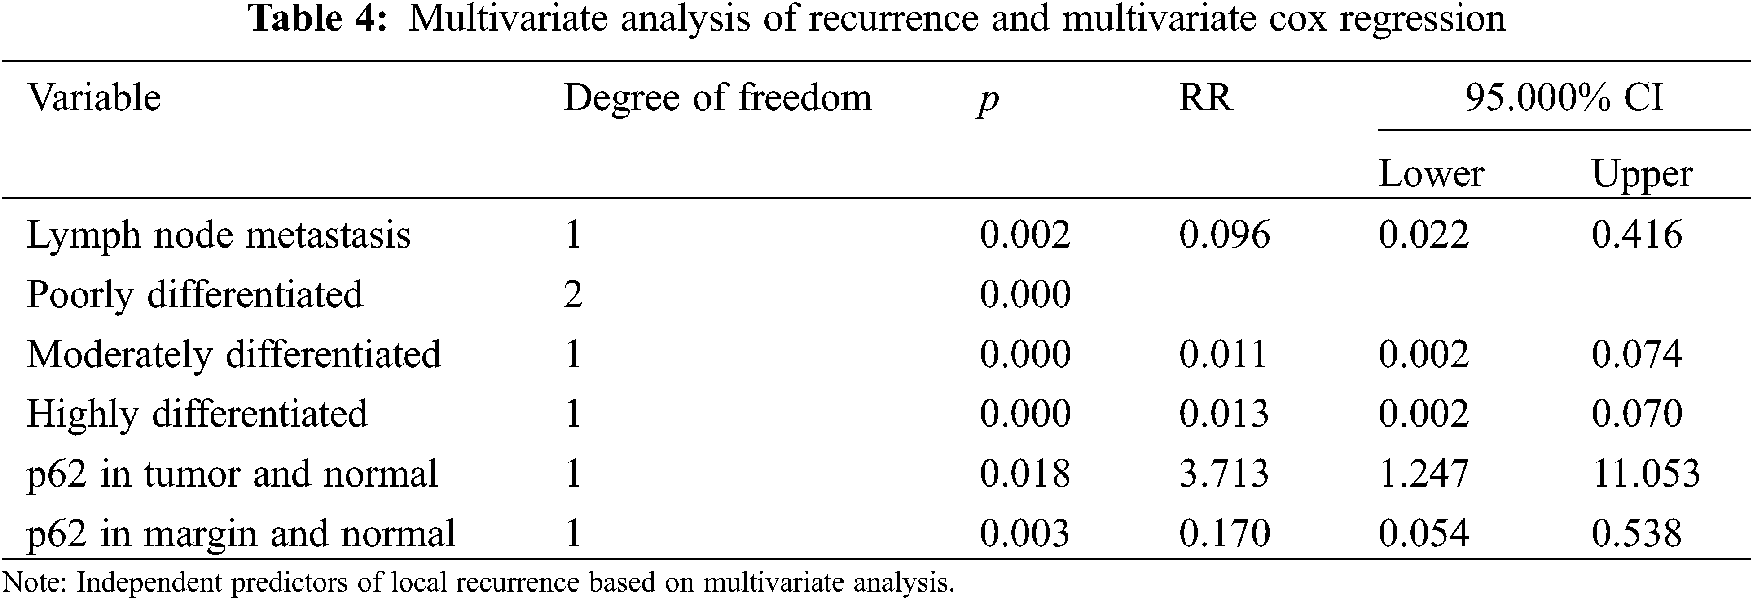
p62 protein was an independent prognostic factor that was correlated with poor overall survival of OSCC patients. When expression of p62 protein in tumor group was lower than in normal group, there was a higher risk of recurrence (RR = 3.713, 95% CI: 1.247–11.053). When p62 protein expression in marginal group was lower than in tumor group, there was a lower risk of recurrence (RR = 0.170, 95% CI: 0.054–0.538).
Risk analysis of prognosis also revealed that lymph node metastasis is an independent risk factor. Compared with the occurrence of lymph node metastasis, the risk of recurrence and poor prognosis without lymph node metastasis was lower (RR = 0.096, 95% CI: 0.022–0.416). In terms of degree of differentiation, moderately and the highly differentiated OSCC showed a lower risk of recurrence than poorly differentiated OSCC (RR = 0.011, 95% CI: 0.002–0.074; RR = 0.013, 95% CI: 0.002–0.070, respectively).
Autophagy is a dynamic process for degradation of cytosolic components in eukaryotic cells, which function is to eliminate misfolded/degrade proteins and damaged/aged organelles in order to maintain intracellular homeostasis [12].
At physiological conditions, basal autophagy maintains the relatively low levels of p62 due to continuous degradation together with the target cargo by the lysosomal system. Autophagy inhibition can cause p62 accumulation and p62 upregulation and/or reduced degradation have been linked with tumor formation, cancer promotion as well as in resistance to therapy [13]. Conversely, degradation of p62 during autophagy is critical for the restriction of p62-linked tumorigenesis [14]. Whether autophagy is an executioner or a savior is often determined in a context- and cell type dependent manner [15]. We also found that p62 protein was significantly elevated in OSCC patients with recurrence. We hypothesize that autophagic activity varies by tissue environment. High p62 expression in tumor and margin tissues restricted autophagic activity, increased aggregates of damaged proteins and organelles. On the other hand, the lower the expression in normal region, the better the prognosis This may be attributed to that low expression of p62 and physiological autophagic activity preventing the gradual accumulation of damaged proteins and organelles in normal tissue.
In our study, univariate analysis showed that the overall survival rate was related to the expression difference of p62 protein among different groups. We found that higher p62 protein expression in tumor and marginal tissues than in normal tissue is associated with a better prognosis.
Recently, Wang et al. [16] found that disulfiram can trigger excessive autophagy and induce cell death in OSCC. This conclusion is based on the belief that in some cancer types, cancer initiation and progression can be suppressed by autophagy [17]. In fact, autophagy is known to be a double-edged sword as a tumor suppressor and tumor promoter. Evidence showed that on the first stages in tumorigenesis, autophagy is regarded as a tumor suppressor; as tumor cells grow, autophagy can promote survival of tumor cell in hypoxic microenvironment through recycling of molecules in order to meet with altered metabolic requirements of cancer cell.
The association of high levels of p62 with tumorigenesis and poor prognosis has been reported in many papers. Yan et al. [18] reported that not only are high levels of p62 observed in tumor promotion, but these are strongly implicated in causing resistance to cancer therapy. Indeed, in human ovarian cancer cells, higher p62 expression levels may indicate insufficient autophagy for p62 degradation, which may also lead to resistance to apoptosis [19] In esophageal squamous cell carcinoma (ESCC) tissues, high p62 expression levels enhance cell apoptosis resistance and thus promote tumor growth. Feng et al. [20] reported that targeting high p62 expression is a reasonable strategy for the treatment of hepatocellular carcinoma (HCC). Our results, together with these reports, support that accumulation of p62 was observed in breast cancer, prostate cancers, HCC, and OSCC.
Interestingly, in 2017, Terabe et al. [21] believed that LC3 and p62 protein are associated with postoperative recurrence and poor prognosis. However, in our study, we did not find any significant differences in LC3-II expression among different regions.
Furthermore, the correlation of tumor margin tissue status to tumor recurrence has also been assessed. In 2018, Buchakjian et al. [22] emphasized the need to evaluate specimen marginal regions after oral cavity squamous cell carcinoma (OCSCC) resection. Subsequently, Hosni et al. [23] confirmed that patients with microscopic positive margins with cancer cell have a higher risk of relapse. Marginal status in OSCC is not only an important predictor for the recurrence, but also for patient overall survival with recurring disease [24]. In our study, tissue specimens from marginal region were also collected to improve the objectivity and veracity of the experiment.
AUC is a global measure of the ability of a test to discriminate whether a specific condition is present or not [25]. As shown in the results, AUC values were within the range of 0.669–0.892. This means that although our research has a certain degree of credibility. However, it still has shortcomings that need to be improved. First, a larger sample size and longer observation time need to be included. Second, the definition of tumor margin remains obscure [22], and precise margin sites are hardly achievable during operation. To achieve more reliable scientific results, larger scale and more in-depth studies need to be done.
Currently, the main treatment modality for oral squamous cell carcinoma is local expanded resection. Comparison of p62 expression levels in postoperative marginal area tissues and primary foci tissues can be used as a feasible technique to predict postoperative recurrence. High expression of p62 in postoperative normal tissue would be a poor prognostic indicator compared to tumor and margin regions.
Author Contributions and Acknowledgement: Thanks to Mr. Gao and Mrs. Wang for the guidance in the experiment; thanks to Prof. Wang for the study design and data analysis by Dr. Sun; thanks to Dr. Yang and Dr. Su for the specimen collecting. At last, thanks LetPub Company for English language editing.
Ethics Approval and Informed Consent Statement: This study was approved by the Ethics Committee of Ethics Committee of the Beijing Tiantan Hospital, Capital Medical University (Approval No. KY2013-015-02). And Informed consent was obtained from all subjects involved in the study and a written informed consent has been obtained from the patient(s) to publish this paper.
Availability of Data and Materials: All data are presented in the article and can be accessed by communicating with the corresponding author.
Funding Statement: Thanks to the support from the National Natural Science Foundation of China (81870907) and National Key Research and Development Program (2016YFC1301604).
Conflicts of Interest: The authors declare that they have no conflicts of interest to report regarding the present study.
1. Siegel, R. L., Miller, K. D., Jemal, A. (2020). Cancer statistics, 2020. CA: A Cancer Journal For Clinicians, 70(1), 7–30. DOI 10.3322/caac.21590. [Google Scholar] [CrossRef]
2. Safi, A. F., Kauke, M., Grandoch, A., Nickenig, H. J., Zöller, J. E. et al. (2017). Analysis of clinicopathological risk factors for locoregional recurrence of oral squamous cell carcinoma–Retrospective analysis of 517 patients. Journal of Cranio-Maxillo-Facial Surgery, 45(10), 1749–1753. DOI 10.1016/j.jcms.2017.07.012. [Google Scholar] [CrossRef]
3. Chen, W., Zheng, R., Zuo, T., Zeng, H., Zhang, S. et al. (2016). National cancer incidence and mortality in China, 2012. Chinese Journal of Cancer Research, 28(1), 1–11. DOI 10.3978/j.issn.1000-9604.2016.02.08. [Google Scholar] [CrossRef]
4. Gharat, S. A., Momin, M., Bhavsar, C. (2016). Oral squamous cell carcinoma: Current treatment strategies and nanotechnology-based approaches for prevention and therapy. Critical Reviews in Therapeutic Drug Carrier Systems, 33(4), 363–400. DOI 10.1615/CritRevTherDrugCarrierSyst.2016016272. [Google Scholar] [CrossRef]
5. Guo, J. Y., Chen, H. Y., Mathew, R., Fan, J., Strohecker, A. M. et al. (2011). Activated Ras requires autophagy to maintain oxidative metabolism and tumorigenesis. Genes & Development, 25(5), 460–470. DOI 10.1101/gad.2016311. [Google Scholar] [CrossRef]
6. Zhu, L., Yan, D., Chen, Y., Chen, S., Chen, N. et al. (2020). The identification of autophagy-related genes in the prognosis of oral squamous cell carcinoma. Oral Diseases, 26(8), 1659–1667. DOI 10.1111/odi.13492. [Google Scholar] [CrossRef]
7. Edge, S. B., Compton, C. C. (2010). The American joint committee on cancer: The 7th edition of the AJCC cancer staging manual and the future of TNM. Annals of Surgical Oncology, 17(6), 1471–1474. DOI 10.1245/s10434-010-0985-4. [Google Scholar] [CrossRef]
8. Dillon, J. K., Brown, C. B., McDonald, T. M., Ludwig, D. C., Clark, P. J. (2015). How does the close surgical margin impact recurrence and survival when treating oral squamous cell carcinoma? Journal of Oral and Maxillofacial Surgery, 73(6), 1182–1188. DOI 10.1016/j.joms.2014.12.014. [Google Scholar] [CrossRef]
9. Yoshii, S. R., Mizushima, N. (2017). Monitoring and measuring autophagy. International Journal of Molecular Sciences, 18(9), 1865. DOI 10.3390/ijms18091865. [Google Scholar] [CrossRef]
10. Kabeya, Y., Mizushima, N., Ueno, T., Yamamoto, A., Kirisako, T. et al. (2000). LC3, a mammalian homologue of yeast Apg8p, is localized in autophagosome membranes after processing. The EMBO Journal, 19(21), 5720–5728. DOI 10.1093/emboj/19.21.5720. [Google Scholar] [CrossRef]
11. Jiang, P., Mizushima, N. (2015). LC3- and p62-based biochemical methods for the analysis of autophagy progression in mammalian cells. Methods, 75, 13–18. DOI 10.1016/j.ymeth.2014.11.021. [Google Scholar] [CrossRef]
12. Boya, P., Reggiori, F., Codogno, P. (2013). Emerging regulation and functions of autophagy. Nature Cell Biology, 15(7), 713–720. DOI 10.1038/ncb2788. [Google Scholar] [CrossRef]
13. Islam, M. A., Sooro, M. A., Zhang, P. (2018). Autophagic regulation of p62 is critical for cancer therapy. International Journal of Molecular Sciences, 19(5), 1405. DOI 10.3390/ijms19051405. [Google Scholar] [CrossRef]
14. Kocaturk, N. M., Akkoc, Y., Kig, C., Bayraktar, O., Gozuacik, D. et al. (2019). Autophagy as a molecular target for cancer treatment. European Journal of Pharmaceutical Sciences, 134(1), 116–137. DOI 10.1016/j.ejps.2019.04.011. [Google Scholar] [CrossRef]
15. Liu, J., Fan, L., Wang, H., Sun, G. (2016). Autophagy, a double-edged sword in anti-angiogenesis therapy. Medical Oncology, 33(1), 10. DOI 10.1007/s12032-015-0721-9. [Google Scholar] [CrossRef]
16. Wang, Z., Jiang, H., Cai, L. Y., Ji, N., Zeng, X. et al. (2021). Repurposing disulfiram to induce OSCC cell death by cristae dysfunction promoted autophagy. Oral Diseases, 27(5), 1148–1160. DOI 10.1111/odi.13652. [Google Scholar] [CrossRef]
17. Levy, J., Towers, C. G., Thorburn, A. (2017). Targeting autophagy in cancer. Nature Reviews. Cancer, 17(9), 528–542. DOI 10.1038/nrc.2017.53. [Google Scholar] [CrossRef]
18. Yan, X. Y., Zhang, Y., Zhang, J. J., Zhang, L. C., Liu, Y. N. et al. (2017). p62/SQSTM1 as an oncotarget mediates cisplatin resistance through activating RIP1-NF-κB pathway in human ovarian cancer cells. Cancer Science, 108(7), 1405–1413. DOI 10.1111/cas.13276. Epub 2017 Jun 25. [Google Scholar] [CrossRef]
19. Yu, H., Su, J., Xu, Y., Kang, J., Li, H. et al. (2011). p62/SQSTM1 involved in cisplatin resistance in human ovarian cancer cells by clearing ubiquitinated proteins. European Journal of Cancer, 47(10), 1585–1594. DOI 10.1016/j.ejca.2011.01.019. [Google Scholar] [CrossRef]
20. Feng, L., Chen, M., Li, Y., Li, M., Hu, S. et al. (2021). Sirt1 deacetylates and stabilizes p62 to promote hepato-carcinogenesis. Cell Death & Disease, 12(4), 405. DOI 10.1038/s41419-021-03666-z. [Google Scholar] [CrossRef]
21. Terabe, T., Uchida, F., Nagai, H., Omori, S., Ishibashi-Kanno, N. et al. (2018). Expression of autophagy-related markers at the surgical margin of oral squamous cell carcinoma correlates with poor prognosis and tumor recurrence. Human Pathology, 73, 156–163. DOI 10.1016/j.humpath.2017.11.019. [Google Scholar] [CrossRef]
22. Buchakjian, M. R., Ginader, T., Tasche, K. K., Pagedar, N. A., Smith, B. J. et al. (2018). Independent predictors of prognosis based on oral cavity squamous cell carcinoma surgical margins. Otolaryngology Head and Neck Surgery, 159(4), 675–682. DOI 10.1177/0194599818773070. [Google Scholar] [CrossRef]
23. Hosni, A., Huang, S. H., Chiu, K., Xu, W., Su, J. et al. (2019). Predictors of early recurrence prior to planned postoperative radiation therapy for oral cavity squamous cell carcinoma and outcomes following salvage intensified radiation therapy. International Journal of Radiation Oncology, Biology, 103(2), 363–373. DOI 10.1016/j.ijrobp.2018.09.013. [Google Scholar] [CrossRef]
24. Weckx, A., Riekert, M., Grandoch, A., Schick, V., Zöller, J. E. et al. (2019). Time to recurrence and patient survival in recurrent oral squamous cell carcinoma. Oral Oncology, 94(3), 8–13. DOI 10.1016/j.oraloncology.2019.05.002. [Google Scholar] [CrossRef]
25. Hoo, Z. H., Candlish, J., Teare, D. (2017). What is an ROC curve? Emergency Medicine Journal, 34(6), 357–359. DOI 10.1136/emermed-2017-206735. [Google Scholar] [CrossRef]
 | This work is licensed under a Creative Commons Attribution 4.0 International License, which permits unrestricted use, distribution, and reproduction in any medium, provided the original work is properly cited. |