| Sound & Vibration |
DOI: 10.32604/oncologie.2022.020259
ARTICLE
Racial Bias Can Confuse AI for Genomic Studies
1Institute for Advanced Studies in Humanities and Social Science, Beihang University, Beijing, 102206, China
2School of Law, Hubei University, Wuhan, 430062, China
3School of Astronautics, Beihang University, Beijing, 102206, China
4Department of Orthodontics, Peking University School of Stomatology, Beijing, 100034, China
*Corresponding Author: Xiaomo Liu. Email: momo96@163.com
Received: 13 November 2021; Accepted: 21 February 2022
#These authors contributed equally
Abstract: Large-scale genomic studies are important ways to comprehensively decode the human genomics, and provide valuable insights to human disease causalities and phenotype developments. Genomic studies are in need of high throughput bioinformatics analyses to harness and integrate such big data. It is in this overarching context that artificial intelligence (AI) offers enormous potentials to advance genomic studies. However, racial bias is always an important issue in the data. It is usually due to the accumulation process of the dataset that inevitability involved diverse subjects with different races. How can race bias affect the outcomes of AI methods? In this work, we performed comprehensive analyses taking The Cancer Genome Atlas (TCGA) project as a case study. We construct a survival model as well as multiple artificial intelligence prediction models to analyze potential confusion caused by racial bias. From the genomic discovery, we demonstrated cancer associated genes identified from the major race hardly overlap with the discoveries from minor races from the same causal gene discovery model. We demonstrated that the biased racial distribution will greatly affect the cancer-associated genes, even taking the racial identity as a confounding factor in the model. The prediction models will be potentially risky and less accurate due to the existence of racial bias in projects. Cancer genes from the overall patient model with strong racial bias will be less informative to the minor races. Meanwhile, when the racial bias is less severe, the major conclusion from the overall analysis can be less useful even for the major group.
Keywords: Racial bias; The Cancer Genome Atlas (TCGA); survival analysis; artificial intelligence
Large datasets, such as The Cancer Genome Atlas (TCGA) [1], Accelerating COVID‑19 Therapeutic Interventions and Vaccines (ACTIV) [2], and UK biobank [3], have been widely adopted in computational genomic studies for uncovering inherent biological mechanisms behind complex diseases. Conventional computational approaches that use predefined rules can hardly handle such complex data sets. As a result, there is a growing need for computational approaches that can handle the analysis of complex, heterogeneous, and high-dimensional data sets and provide accurate solutions in a fast and cost-effective manner. AI models trained in a data-driven manner are able to learn to extract unrecognized patterns or hard-to-detect relationships without requiring explicit rules, which makes them widely applied in genomic studies [4–8].
The accuracy of an AI technique is highly dependent on the reliability and quality of the training data. However, imbalanced data is inevitable in large scale data sets and may affect the outcome of the AI models. Among all imbalanced data, racial imbalance is one of the most commonly faced factor within various large scale data sets. The main reason of the racial bias is that these large datasets are accumulated from multiple clinical centers around the world [9], and inevitability involved diverse subjects with different races. Although race was regarded as a poor marker of genomics for years, it is now regarded as an incomplete understanding of human genetic variation [10]. Various correlations between race and diseases have been discovered [11–14], and genomic differences between races have been found to play a role in multiple genome-wide association studies (GWAS) [15–17] in various ways.
However, opinions on how artificial intelligence algorithms will be affected by racial bias in genomic studies are divided. One side believed that AI models can be particularly vulnerable to biased training sets, because medical/clinical data are especially costly to produce and label [18]. The underrepresentation of minor populations in data sets used to develop or train AI algorithms will lead to clear patterns of discrimination against minor patients [19]. Others held that race may be imprecisely and inappropriately used as a biological or epidemiological risk factor [20]. On the contrary, disparities based on socioeconomic status should be consider more by AI models than race in biomedical studies [21].
Existing understanding of race and human genetics [22] have not led to clear guidelines for AI applications in genomic studies. But one thing is certain, the performance of an AI model trained on one specific race is significantly reduced when tested on another race [23]. In fact, before being applied to genomics studies, researchers have developed many methods to deal with data imbalance when training AI models [24–29]. Among them, some approaches have already been applied in biomedical studies [30,31]. Another subtle insertion of race into AI-based approach involves integration of genomics and clinical data to acquire multi-dimensional input [6]. However, it is usually resource intensive and is hard to be applied to large-scale population.
In this work, we took the TCGA dataset as a case study and conducted a comprehensive investigation of the effects of race imbalance on the statistical and machine learning analytical strategies and discoveries of the project. We quantitatively evaluated how the racial bias could affect the biological outcomes by conducting racial-biased tests in two respective machine learning tasks, i.e., the causal gene discoveries [32] and patient survivorship predictions [33]. In the causal gene discoveries, we found causal genes identified from overall populations were significantly different from those on minor race samples only, even using the race identity as a confounding adjustment. In the patient survivorship prediction task, we found the models constructed on the whole large dataset had reasonable performances on the major races but showed poor accuracies for minor race samples using a wide range of artificial intelligence (AI) algorithms. These conclusions imply that, when we treat patients from minor race groups, the biological discoveries or application models will be potentially risky and less accurate because of the existence of racial bias in projects.
2.1 Research Setting, Sample and Data
We use TCGA dataset as our original data. TCGA was launched by NCI and NHGRI. It was designed to identify genetic mutations for cancer progression [34,35]. It is now becoming a benchmark to enhance the ability to diagnose and treat cancer at the basis of the genetic level [36,37]. The dataset includes 31 cancer types and each cancer contains transcriptomics data collected by different hospitals and institutes with various racial backgrounds.
Fig. 1A provided an overall race population distribution of TCGA regardless of the cancer types. There are 11056 patients in total, among which white people represent the largest proportion. The second-largest race group is Black or African American; however, the population size is only less than 1/7 of the white population size. Other minor races contain even much smaller patient numbers. Overall, samples in TCGA cancer data exhibit a strong racial bias. Fig. 1B indicates that for most cancer types, the major races accounted for more than 50% while the minor races generally had a proportion lower than 5%. However, we also notice there were several cancers where patients showed less severe racial bias.
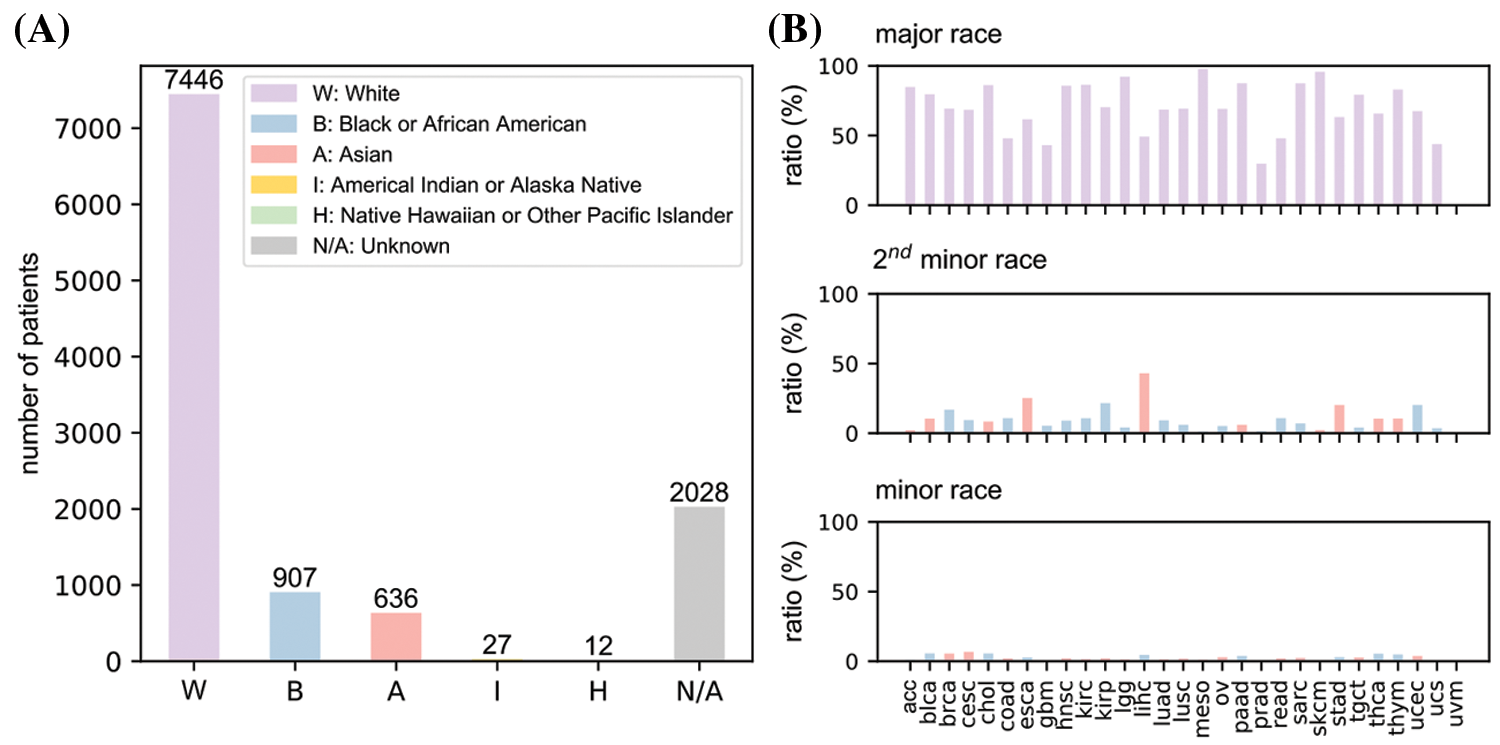
Figure 1: An overview of race distribution in TCGA dataset. (A) Overall patient number from different races in the dataset. (B) Proportions of major, minor and second minor races for all 31 cancer types. uvm data is empty because it lacks race information. Full names of cancers were listed in Table 1
We conduct a three-step research paradigm to investigate the effects of race imbalance on the statistical and machine learning analysis, as is illustrated in Fig. 2.
• Step 1: Data pre-processing. In this step, we analyze the population distribution of every cancer of TCGA and divide them into three sub-groups according to their major population ratio, i.e., weak bias, moderate bias, and strong bias.
• Step 2: Causal gene discoveries. In this step, we conduct cox proportional-hazards [38] models for every sub-group regarding their sex, age, race, cancer stage, and genes to determine their most significant genes. These genes are regarded as causal genes.
• Step 3: Survivorship predictions. In this step, we construct four different types of AI models to predict the survivorship of patients. The models are trained or developed based on the previously determined significant genes.
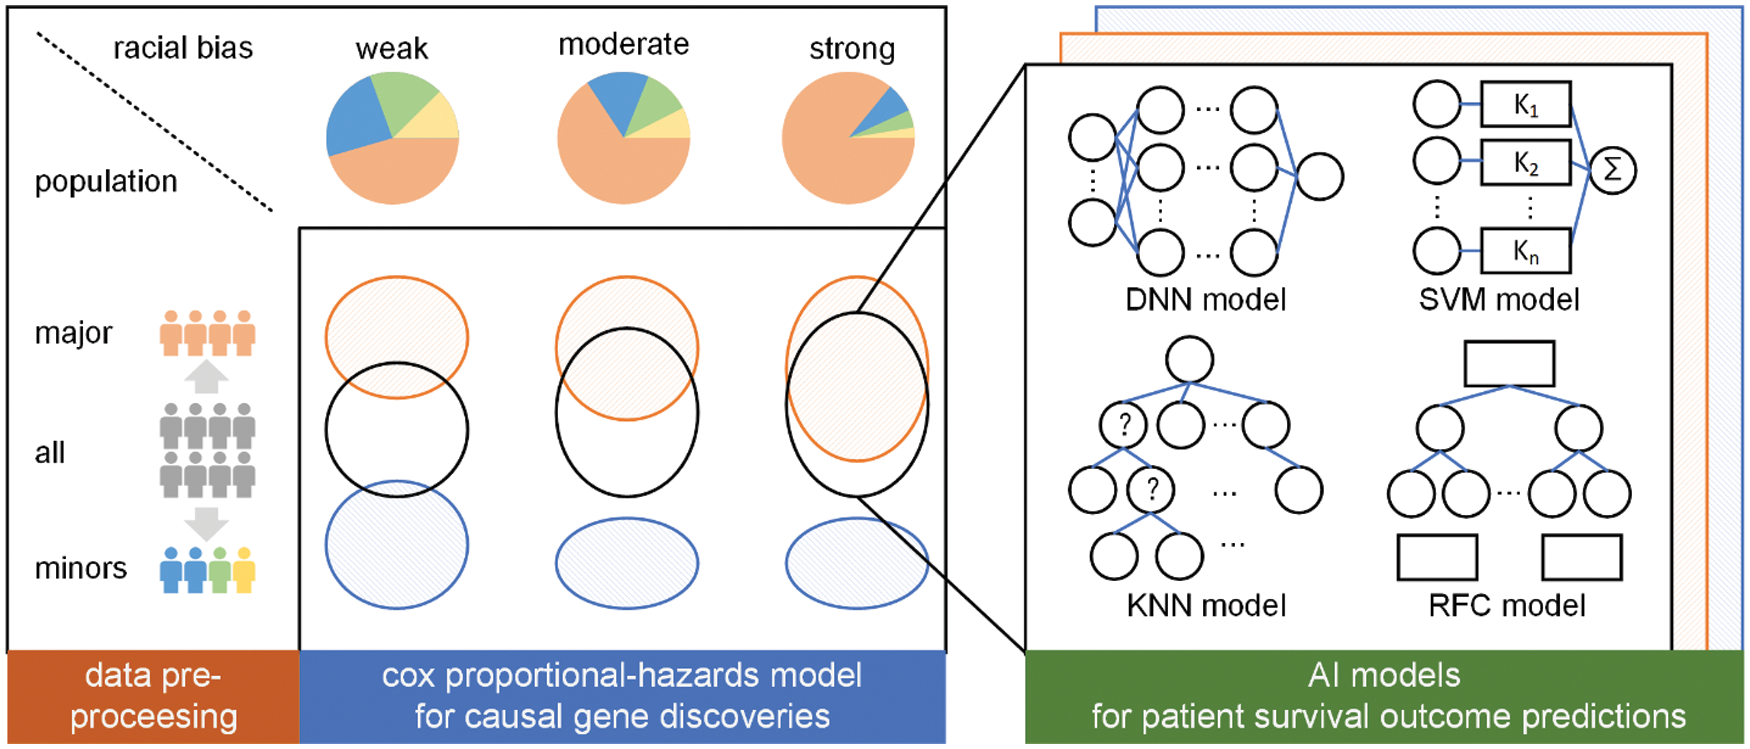
Figure 2: The overall research paradigm
Racial bias index is a discrete indicator defined based on the population proportion of the major race (PPMR). It is used to evaluate the severity of racial bias of the population of a certain cancer in the TCGA dataset. For each cancer type, the major race is defined as the race with the largest population. Therefore, the population proportion of the major race can be easily calculated by dividing the major race population by total population. Racial bias index is defined as: strong (PPMR ≥ 75%), moderate (75% > PPMR ≥ 50%), and weak (50% > PPMR). The selection of the two thresholds (i.e., 50% and 75%) is empirically determined according to the actual race distribution of TCGA dataset to obtain balanced cancer sub-groups. Cancers can be categorized into one of the three sub-groups according to their racial bias index, i.e., they are cancers with either week racial bias, moderate racial bias, or strong racial bias.
The significances of genes are evaluated by their p-values calculated during survival analysis. We reorder genes according to their p-value from low to high and select genes above the significance threshold for subsequent survivorship predictions. The significance threshold used here is to limit numbers, not values. For example, the top 10 genes are selected if the significance threshold is set to be 10. We use number instead of value to select genes because it is easier to construct AI models with equal number of inputs for prediction.
We strictly abide to the previously discussed research paradigm consisting of data pre-processing, causal gene discoveries, and survivorship predictions.
The cancers were categorized into strong, moderate, and weak bias categories and were analyzed separately according to the racial bias index.
For each cancer, the patient information and cancer sample information of the TGCA pan-cancer dataset are separately stored in two text files. We link them together into one file according to the patient ID and sample ID. Then, we extract the RNA sequence median zscore of each gene and attach them with the above linked file to form a gene specific data sheet.
At the cancer level, we firstly remove the entire cancer genomic data if there exists any N/A data within race, sex, age, cancer stage, gene zscore, or survival status. Because the subsequent survival analysis requires inputs with not N/A data. Then, we discard the cancer if its minor races population is less than 10. Because data imbalance and data insufficiency problems are severe for model training.
At the gene level, we drop the gene if its zscore is missing, and we calculate the average zscore of the gene if we encounter two or more zscores corresponding to the gene. Finally, we convert all the non-digital value into digital format. For example, sex information is converted into 0 (for female) and 1 (for male), and race information is converted into 0 (for white), 1 (for Asian), 2 (for Black or African American), etc.
The entire data pre-processing flow chart is illustrated in Fig. 3.
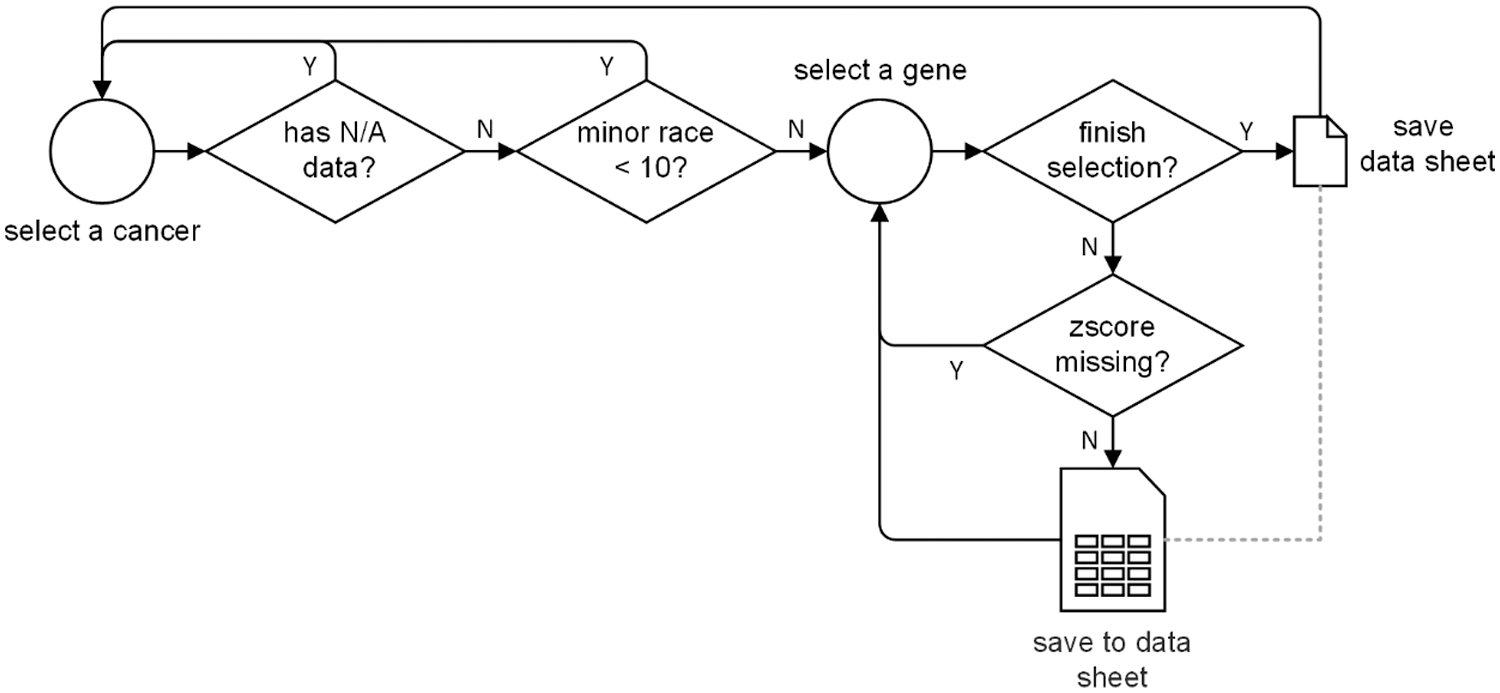
Figure 3: The data pre-processing process
We take survival analysis for each cancer data sheet to account for the contributions of sex, age, race, cancer stage, and genes to the cancer development for each cancer type in TCGA transcriptomics data. We separately built three survival models, each based on different race populations. After the survival analysis, the contributions of each factor can be quantified and sorted by Wald test using p-values. The top significant cancer genes that greatly impacted the three sub-groups can be identified respectively according to the previously defined significance threshold (10 for subsequent analysis and 16/32/64 for Appendix).
We use survival 3.2-11 R package to construct the cox proportional hazards model for each of gene specific data file in every cancer. The covariates to be analyzed are sex, age, race, cancer stage, and gene zscore. The cox
In the equation, t represents the survival time, h(t) is the hazard function determined by the set of covariates (xsex, xage, xrace, xcancer_stage, xgene_zscore), coefficients (b1, b2, …, b5) measure the impact (i.e., the effect size) of covariates, h0(t) is the baseline hazard, which corresponds to the value of the hazard if all the covariates are equal to zero.
We want to describe how the covariates jointly impact on survival. We perform a multivariate Cox regression analysis. We include all 5 factors mentioned above into the multivariate model. A Cox regression of time to death on the time-constant covariates is specified as follows:
cox<-coxph(Surv(time,status)~sex+age+race+cancer_stage+gene, data=TGCA)
summary(cox)
After survival analysis, we can get the p-value of every gene w.r.t. the three sub-groups of different race bias. We sort genes in ascending order according to their p-values, and get the most significant genes that affect the cancer survival status according to the predefined significance threshold.
2.3.3 Survivorship Predictions
After acquiring the top significant genes, we construct four representative machine learning models, i.e., Deep Neural Network (DNN) model [39], Support-Vector Machine (F) model [40], K-Nearest Neighbor (KNN) model [41], and Random Forest Classification (RFC) model [42], to extensively test the prediction performances. Similar to the previously constructed survival models, we also develop four AI models for each of the population groups to analyze and compare their prediction performances. To be more specific, the inputs of all 4 models are the zscores of the most significant genes. The single output is the survival status of the cancer in binary format, i.e., 1 for survival and 0 for not survival.
We assume that the significant threshold is Ni, which is equal to the number of inputs. The DNN model is a simple 3 layer fully-connected network with layers size of {Ni-64-16-1} and with ReLU activation function. The DNN model is trained by Adam optimizer. The SVM model has an RBF kernel with parameters C = 1 and γ = 0.01. The KNN model uses k = 10 neighbors. The RFC model uses 10 trees in the forest, and uses Gini impurity to measure the quality of a split. The number of features to consider when looking for the best split is the square root of Ni.
Before training, all the patient data are divided into a train set and a test set using a ratio of 8:2. Then, both the train set and the test set are further divided into 2 sets corresponding to patient races: the major set and the minor set. We can obtain 6 datasets after the 2-step division. All models are trained 10 times to get an average performance by following a 5-fold cross-validation manner.
In order to verify the effectiveness of the sample reweighting method commonly applied in AI models when handling unbalanced data, we weigh the importance of each sample based on their racial attendance rates. We calculate the weight of minor race samples mw by the following equation:
where N* is the number of patients of the subscript race. The weight of major race samples is 1.
Fig. 4 illustrate the racial bias of all cancers in TCGA. Fig. 4A shows the population of both the major race (purple bars) and other races of all cancers (gray bars). Fig. 4B shows the detailed three sub-groups division result of all cancers according to significance threshold equal to 10. Further results involving significance thresholds of 16, 32, and 64 are given in Appendix.
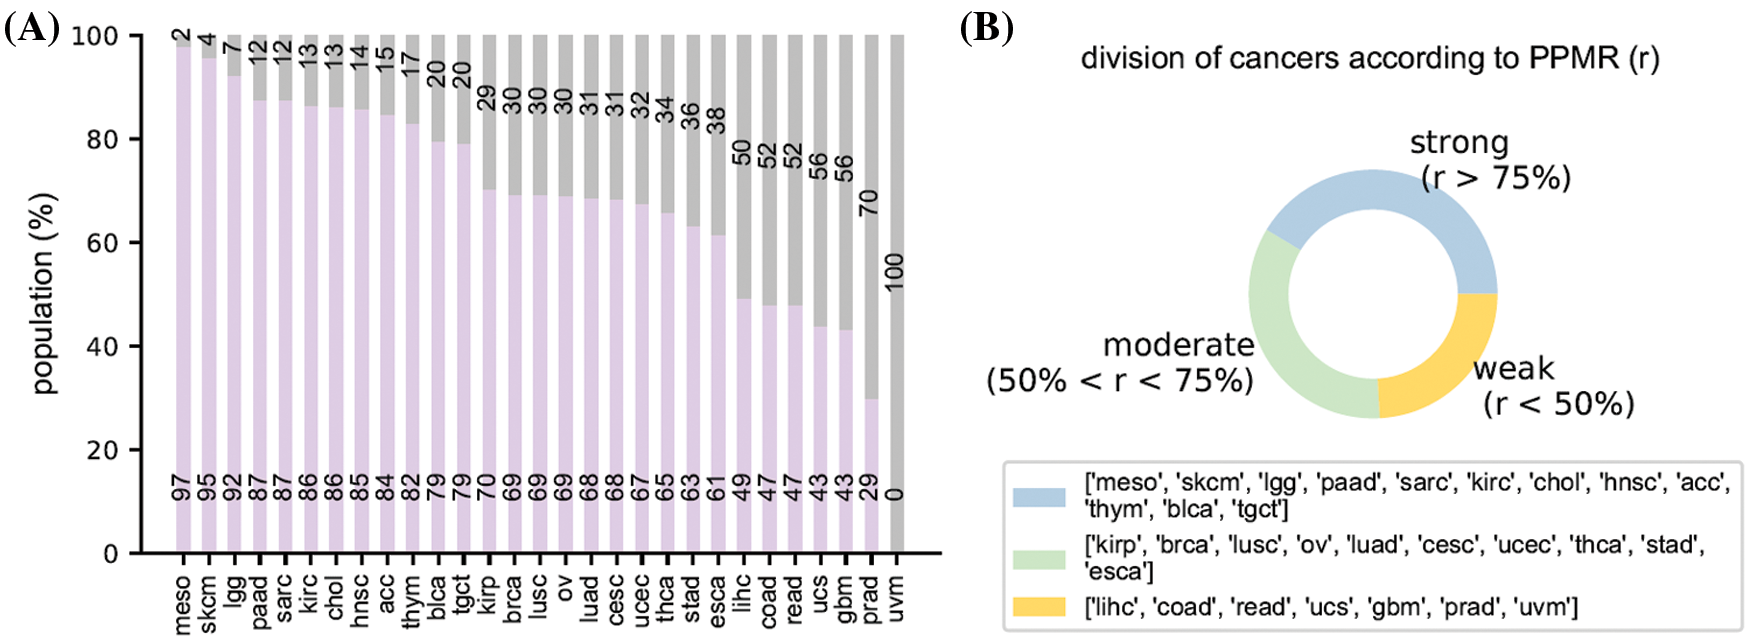
Figure 4: Racial bias of all cancers. (A) the population of the major race and the other races. (B) The division result of all cancers according to the population proportion of major race
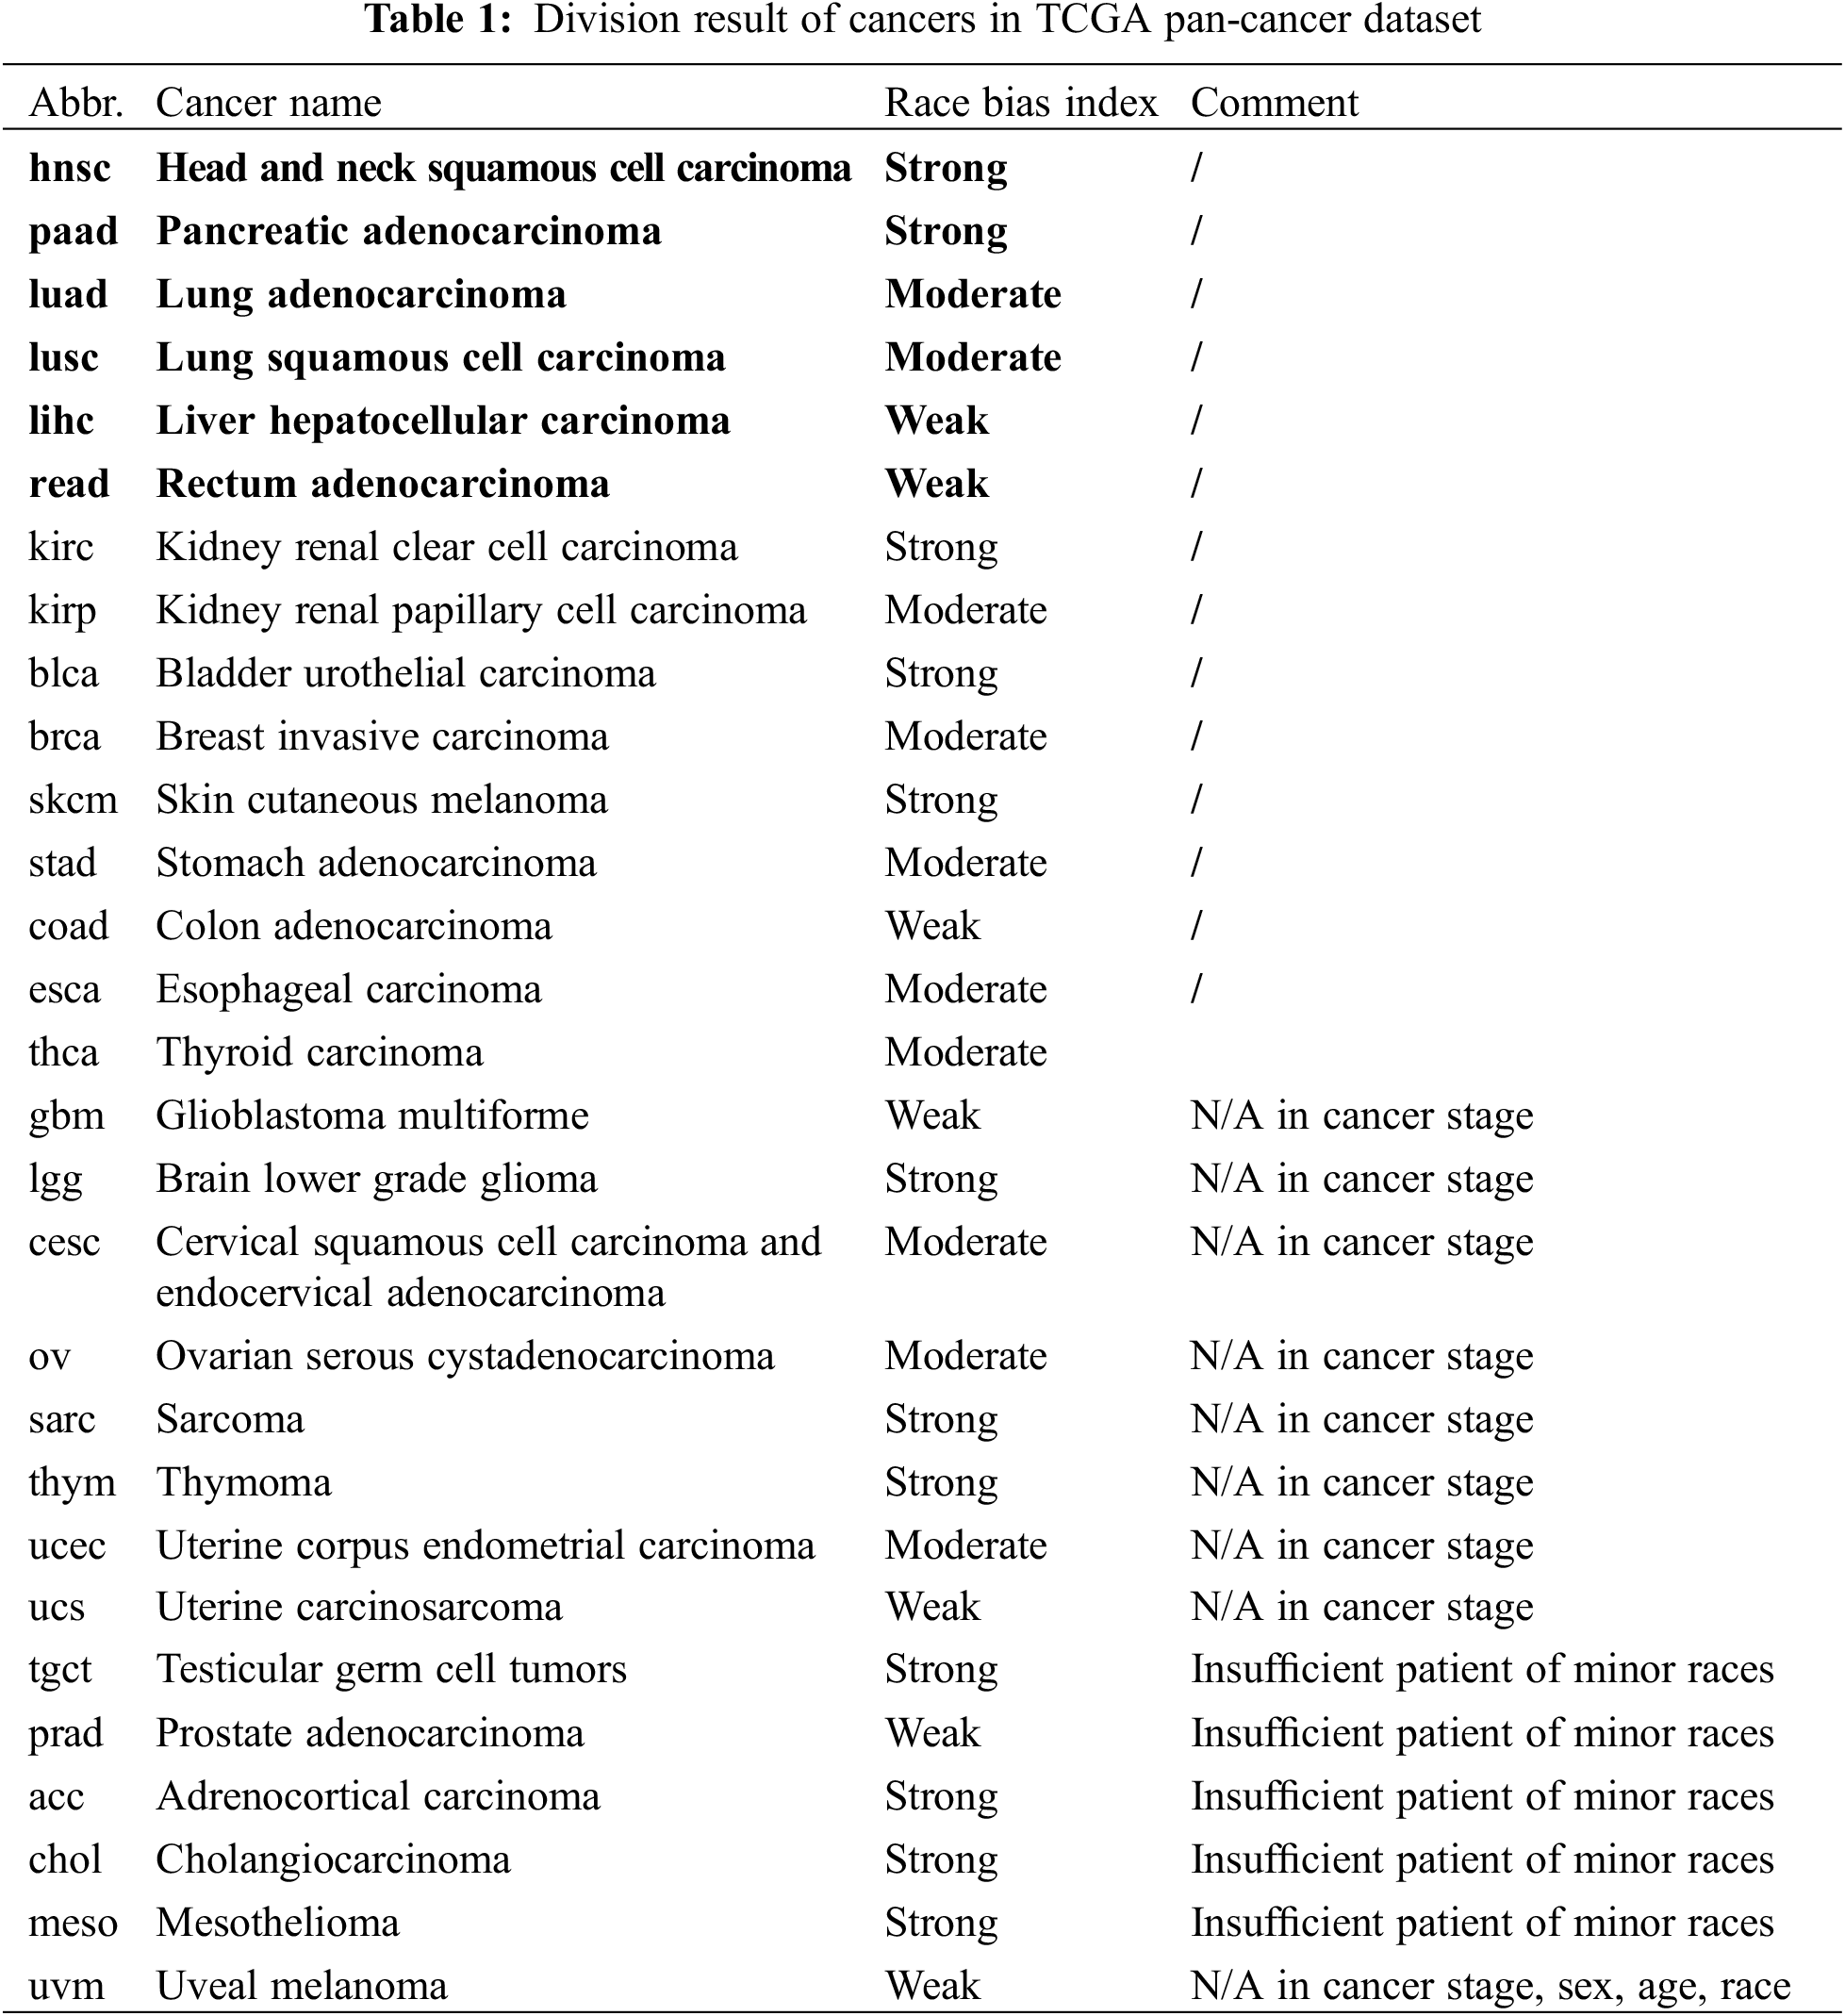
Regarding to the above-mentioned racial bias index, we have acc, blca, chol, hnsc, kirc, lgg, meso, paad, sarc, skcm, lgct, and thym cancer types in strong racial bias category, brca, cesc, esca, kirp, luad, lusc, ov, stad, thca, and ucec in moderate racial bias category, and coad, gbm, lihc, prad, read, ucs, and uvm in weak racial bias category, respectively. The detailed division is shown in Table 1. We select 6 representative cancers for subsequent analysis (bold texts in Table 1). Analysis results of the latter 9 cancers are discussed in Appendix. The remaining cancers are discarded due to N/A data or insufficient minor race patients. The various levels of race imbalance in different cancer types provided a great opportunity for us to evaluate the effects from various bias levels.
3.2 Effects of Racial Bias on Cancer Gene Discoveries
Two cancer types from each category (hnsc and paad from strong; luad and lusc from moderate; lihc and read from weak) were selected for illustration. The top 10 significant genes (significant threshold is set to be 10) were selected to plot their overlaps among each other (Fig. 5A). For cancer types with strong racial bias, results from all patients shared many cancer genes with analysis on major race only while the model cannot identify any shared genes from the minor group. This represented that the conclusions drawn from the overall population can be largely applicable to the major race but not to the minor race. For the cancer types with moderate racial bias, the shared cancer gene number between all and major populations is decreasing and again there is no overlapped gene between all and minor. For cancer types with weak bias, the overall analysis also identified genes that were detectable from analysis on minor races. Fig. 5B provided the proportion statistic of overlapped genes between all/major and all/minor for all cancer types in three bias levels. See Figs. S1 and S2 in Appendix for similar results concerning the top 16/32/64 significant genes.
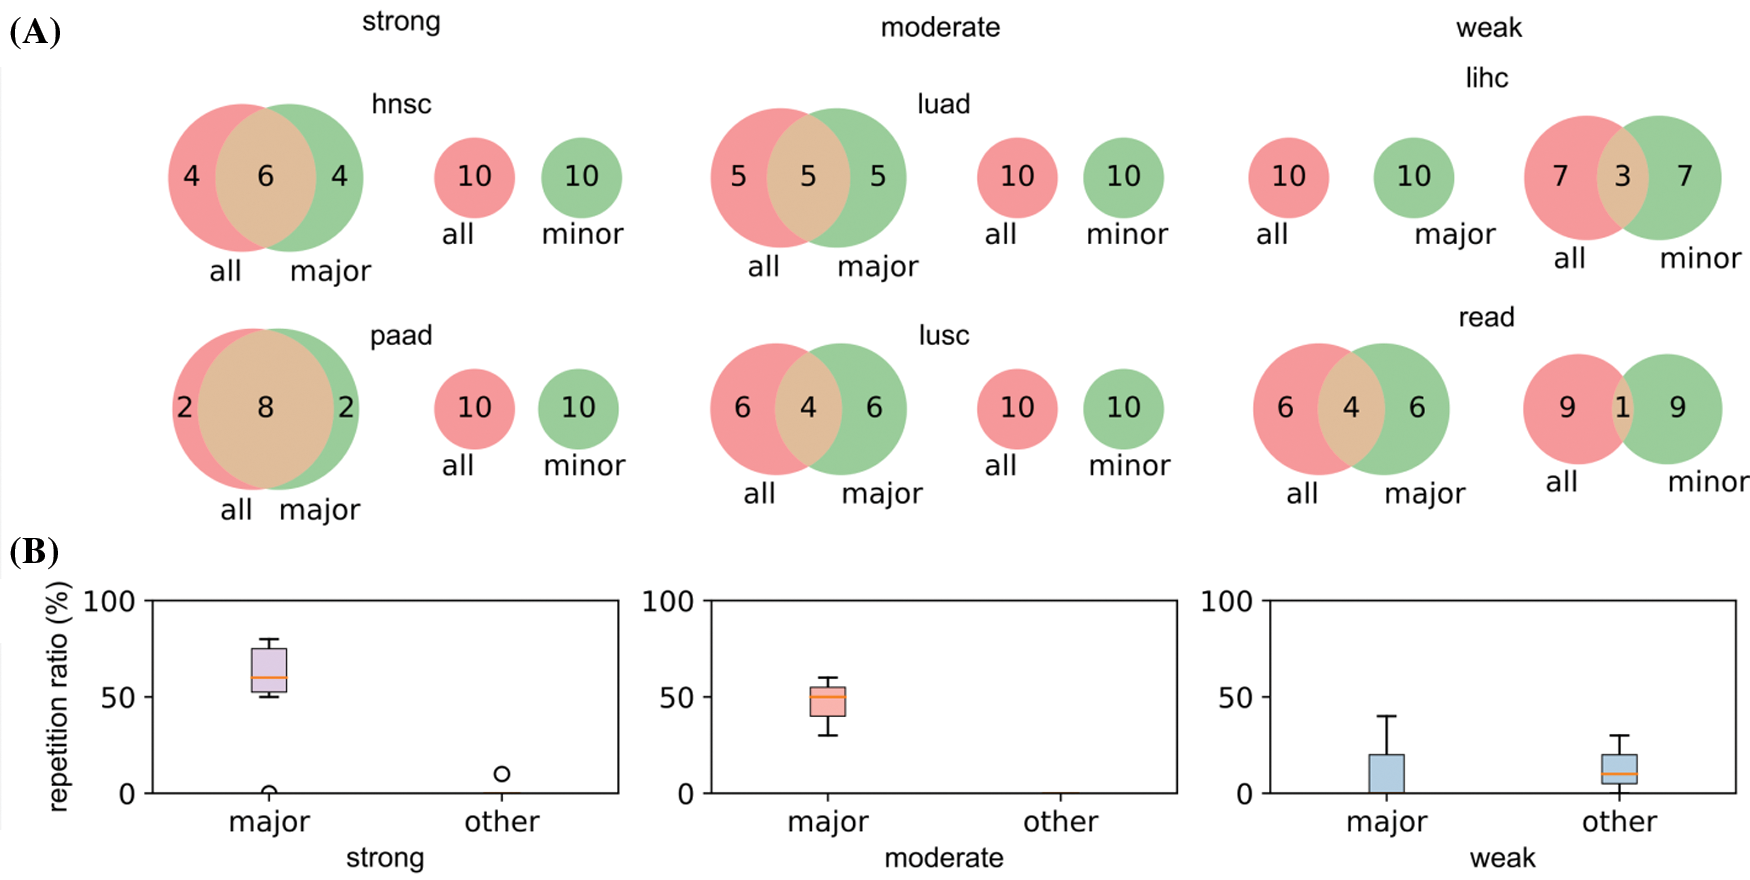
Figure 5: Relations of the top 10 significant genes of the selected six cancers after survival analysis. (A) Venn diagrams reflecting the similarity and overlap of gene number and composition of major and minor races w.r.t. all races. (B) Boxplot diagrams reflecting the repetition of most significant genes between all patients and major race patients, and between all patients and minor races patients
Based on the analyses, we demonstrated with the strong race bias, the cancer genes from the overall patient model will be less informative to the minor races. Meanwhile, when the race bias is less severe, the major conclusion from the overall analysis can be less useful even for the major group.
3.3 Effects of Racial Bias on Survivorship Predictions
The differences in prediction accuracies on data with all, major and minor populations represented the transferability of biological conclusions from the training groups to the test groups (Fig. 6). For models trained on all patients but tested on all/major/minor race populations (first row of Fig. 6), accuracies of all and major groups were similar even the racial bias levels were different (from left to right: strong, moderate, weak racial bias). However, in the test on minor races, accuracies decreased a lot when the racial bias was strong. We observed similar trends for models trained on major patients only (second row of Fig. 6). This indicated that for prediction tasks, the major race group was easy to dominate classification models. Therefore, models fitted on all patients or the major group performed similarly. For models training on minor race patients only (third row of Fig. 6), we observed higher accuracies on minor survival predictions as expected. And when the racial bias level was weak (lihc and read), tested accuracies for all or major also increased. The analysis and prediction result of the selected six cancers concerning the top 16/32/64 significant genes were provided in Fig. S3. The analysis and prediction result of the rest of the cancers concerning the top 16/32/64 significant genes were provided in Fig. S4.
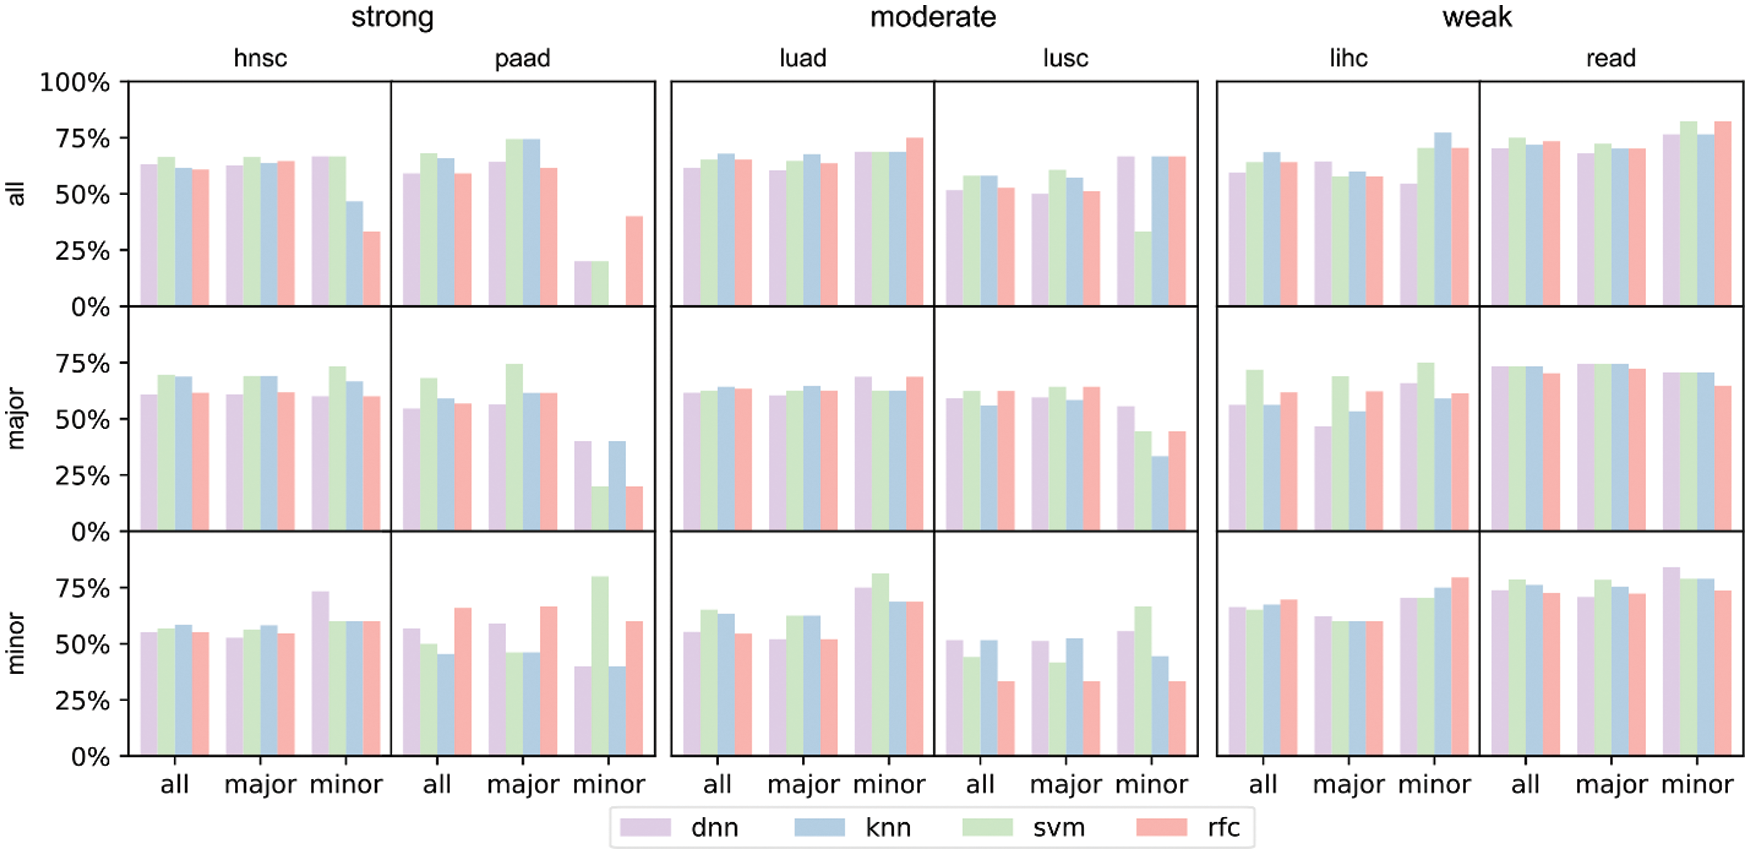
Figure 6: Prediction accuracies of 4 models trained on different training sets under the three major racial bias situations. The first row refers to models trained on all training set, the second row refers to models trained on major training set, and the third row refers to models trained on minor training set. The input number of all 4 models is 10, i.e., inputting the zscores of the 10 most significant genes. The first two columns refer to prediction result on hnsc and paad, both of which are strong major racial bias cancers. The center two columns are result on moderate major racial bias cancers. The latter two columns are results on weak major racial bias cancers
From the results, we concluded that when considering all collected samples and neglecting the racial differences, survival prediction can be strongly biased towards the major race group and yields poor prediction accuracies for the minor, when the major group occupied >50% of the sample size. However, when the race bias is relatively weak (major <50%), the trained models on all patients showed reasonable accuracies on both major and minor races.
We select hnsc and paad to show the survivorship prediction performance with or without sample reweighting. We select these two cancers because they suffer from strong racial bias. The prediction accuracies of the DNN models considering 64 inputs are shown in Fig. 7. hnsc has 440 major race patients and 60 minor race patients as training samples, so the minor weight is 440/60 = 7.33. Similarly, paad has 117 major race patients and 12 minor race patients as training samples with the minor weight of 117/12 = 9.75. The result indicates that the survivorship prediction accuracy of minor race patients cannot be improved by simply applying the sample reweighting under certain circumstances.
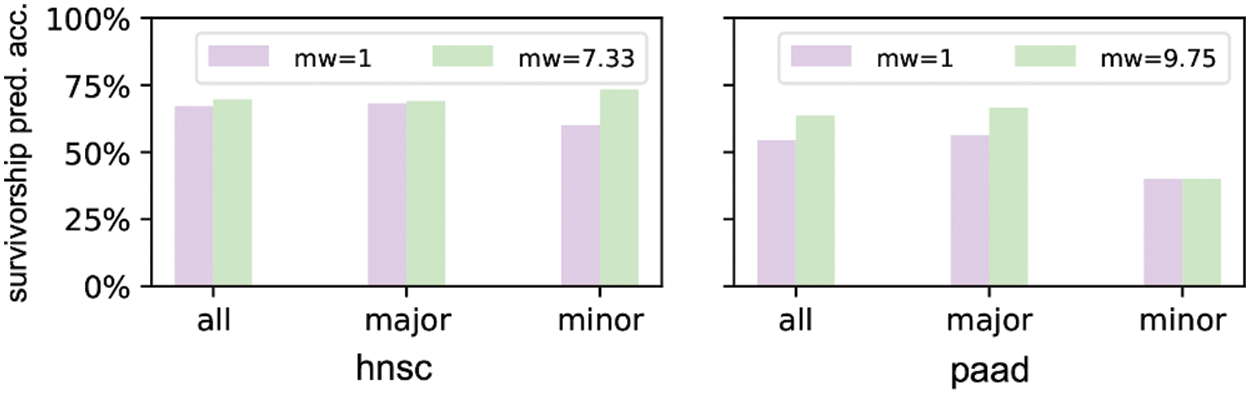
Figure 7: Prediction accuracies of DNN models trained without/with sample reweighting
In this work, we studied how the imbalance of races affected AI algorithms on genomic analyses. The biased distribution of different races in large-scale data is highly risky to favor majority groups. This challenge is especially inevitable when studies involve less-common diseases here patient samples are valuable. In other words, the minority groups might not share the benefits from the costly and long-term dataset.
In the current context, we considered major metrics (causal genes that are associated with certain cancer types, and prediction accuracy of cancer survivorship) that are closely related to the cancer studies. We note these results can only reflect partial effects on biased race distribution. Other metrics, such as classical machine learning accuracy and F score, might express differences in a different aspect.
In results, we observed that the conclusion can be quite different for different AI approaches. This is because tested algorithms were constructed based on various loss functions and can be yield diverse outcomes for the same but complex input data like human genomes. However, we noticed the performances can be much stable when the imbalance level is weak. This highlighted the effects from severe imbalance data to the methods’ accuracies. We also observed that applying sample reweighting can improve the performances of AI models for minor groups, but this method fails when racial bias become extremely severe. Although many methods to alleviate data imbalance have been proposed in the field of machine learning [28–31] from the perspective of samples, evaluation indicators, and algorithms, we should not completely rely on these methods to solve the problem of racial bias. Because some methods that is effective in other fields for AI models may further exacerbate issues of bias in clinical studies. Examples of these methods include fine-tuning of AI models by oversampling under-represented groups and introducing racial information into model as input to adjust prediction results [19]. Contrary to the latter example, AI models should be trained to reduce its direct dependence on sensitive attributes, such as race, gender, income, etc. [18].
Biases may arise due to the availability of data, the way data are processed and combined, the way questions are formulated, and pre-existing biases in society [4]. Therefore, careful tests and well-prepared data are needed when applying the conclusions of genomic analyses to minor groups. It has been reported that bias is likely mitigated by carefully choosing appropriate databases and applying data harmonization methods [13], but methods like this are like addressing symptoms but not root causes. To fully address the issue of racial bias in AI models for clinical use, a top-down intervention involving regulatory bodies and publishing standards are claimed to be required [19]. Among them, a fundamental principle to hold is to increase the awareness of the significance of the logic of ethics, especially when there is a contradiction between the logic of technology which pursues the speed of development, and the logic of ethics which guarantee everyone’s rights to enjoy the technology’s achievement. The idea of this principle is highly crucial for the change of unfairness inherent in medical programs with large-scale datasets. To address this issue, a series of institutional designs can be added. For instance, concerning the data collection, we can make extra efforts to collect the minority’s data since the small number of samples is a source of potential bias and limits the interpretation of results [14]; concerning the data process, we can set up an independent algorithm auditing process to check if there is lower accuracy for the vulnerable people; concerning the result interpretation, researches need to be cautious when applying the conclusion to minor races; concerning the application of the project outcomes, race must be a key patient information for doctors to consider [20,43,44].
The results also inspire us to explore why the challenge happens from the view of project management. By referring to the TCGA data policy, we can see that TCGA highly values ethical issues. However, it seems that the privacy issue represents all the ethical concerns in TCGA data policy. TCGA program has made fine regulations to protect patients’ privacy. From BCR to DCC which are established by TCGA to integrate all tissues and clinical data into the form ready for direct genetic research, a highly sensitive awareness to privacy protection can be noted. However, privacy is only one part of AI ethics. For the TCGA program which is highly valued by the national institutions, it seems incomprehensible for the neglection of the algorithm fairness that increasingly becomes the hot issue in AI ethics [31]. The reason can be the nature of the genomic programs themselves. The collection of genomic data is not as easy as the collection of the data used for AI technologies in other fields, such as facial recognition or automatic speech recognition. For example, the generation of the cancer information of TCGA dataset are based on the miserable individual experience, and the production of their clinical annotation and extensive genomic data are based on the well-enacted regulations. Therefore, it is necessary to make the best of each patient’s genomic information. However, achieving algorithm fairness might mean sacrificing the value of the majorities’ data. It is the insurmountable difficulties for this issue. Because even if the researchers will aware of their blind spot and implicit biased assumptions, they still need to reconstruct the model based on existing biased data, which means the possibility of slowing down the whole genetic research progress.
To summarize, this paper discusses the race imbalance problem that could bias the AI model for multiple types of genomics studies. This conclusion is substantiated by racial-biased tests in two respective machine learning tasks: causal gene discoveries task and patient survivorship predictions task. In the causal gene discoveries task, significant genes of minor race patients are almost entirely different from those of major race patients. In the survivorship prediction task, AI models yield diverse but trending outcomes for the same but complex human genomes input, which highlights the effects from severe imbalance data to the methods’ accuracies. Racial bias problem can be technically alleviated before and during training, but it should not be completely hoped for, especially when the imbalance is severe.
This study provided a quantitative insight of race bias effects on TGCA and will be valuable to offer guidance for genomic population study design. The conclusions from this work can be extended to other large biological and medical research projects that are not limited in genomics. However, the effect degree of imbalance bias in a new dataset can be dramatically different and must be calibrated independently.
Acknowledgement: The results shown here are in whole or part based upon data generated by the TCGA Research Network: https://www.cancer.gov/tcga.
Authorship Statement: The authors confirm contribution to the paper as follows: study conception and design: Beifen Dai; data collection and curation: Zhihao Xu; analysis and interpretation of results: Zhihao Xu; methodology: Hongjue Li; project Administration: Xiaomo Liu; resources: Jinsong Cai; software: Hongjue Li; supervision: Xiaomo Liu; validation: Jinsong Cai; visualization: Bo Wang; draft manuscript preparation: Beifen Dai and Zhihao Xu; review and editing: Beifen Dai and Hongjue Li. All authors reviewed the results and approved the final version of the manuscript.
Ethics Approval and Informed Consent Statement: Not applicable.
Funding Statement: The work was supported by: Tribology Science Fund of State Key Laboratory of Tribology [Grant No. SKLTKF19B11]. https://www.tsinghua.edu.cn/dpien/info/1092/1040.htm. National Natural Science Foundation of China [Grant No. 81400561]. https://www.nsfc.gov.cn/english/site_1/index.html.
Conflicts of Interest: The authors declare that they have no conflicts of interest to report regarding the present study.
1. Tomczak, K., Czerwińska, P., Wiznerowicz, M. (2015). The cancer genome atlas (TCGAAn immeasurable source of knowledge. Contemporary Oncology, 19(1A), A68. DOI 10.5114/wo.2014.47136. [Google Scholar] [CrossRef]
2. Collins, F. S., Stoffels, P. (2020). Accelerating COVID-19 therapeutic interventions and vaccines (ACTIVAn unprecedented partnership for unprecedented times. JAMA, 323(24), 2455–2457. DOI 10.1001/jama.2020.8920. [Google Scholar] [CrossRef]
3. Sudlow, C., Gallacher, J., Allen, N., Beral, V., Burton, P. et al. (2015). UK biobank: An open access resource for identifying the causes of a wide range of complex diseases of middle and old age. PLoS Medicine, 12(3), e1001779. DOI 10.1371/journal.pmed.1001779. [Google Scholar] [CrossRef]
4. Gulfidan, G., Beklen, H., Arga, K. Y. (2021). Artificial intelligence as accelerator for genomic medicine and planetary health. OMICS: A Journal of Integrative Biology, 25(12), 745–749. DOI 10.1089/omi.2021.0170. [Google Scholar] [CrossRef]
5. Coccia, M. (2020). Deep learning technology for improving cancer care in society: New directions in cancer imaging driven by artificial intelligence. Technology in Society, 60(2), 101198. DOI 10.1016/j.techsoc.2019.101198. [Google Scholar] [CrossRef]
6. Fang, C., Xu, D., Su, J., Dry, J. R., Linghu, B. (2021). DeePaN: Deep patient graph convolutional network integrating clinico-genomic evidence to stratify lung cancers for immunotherapy. npj Digital Medicine, 4(1), 14. DOI 10.1038/s41746-021-00381-z. [Google Scholar] [CrossRef]
7. Schulz, S., Woerl, A., Jungmann, F., Glasner, C., Stenzel, P. et al. (2021). Multimodal deep learning for prognosis prediction in renal cancer. Frontiers in Oncology, 11, 394. DOI 10.3389/fonc.2021.788740. [Google Scholar] [CrossRef]
8. Coccia, M. (2019). Artificial intelligence technology in cancer imaging: Clinical challenges for detection of lung and breast cancer. Journal of Social and Administrative Sciences, 6(2), 82–98. [Google Scholar]
9. Zhu, L., Wang, H., Jiang, C., Li, W., Zhai, S. et al. (2020). Clinically applicable 53-gene prognostic assay predicts chemotherapy benefit in gastric cancer: A multicenter study. EBioMedicine, 61(5), 103023. DOI 10.1016/j.ebiom.2020.103023. [Google Scholar] [CrossRef]
10. Edwards, A. W. F. (2003). Human genetic diversity: Lewontin’s fallacy. BioEssays, 25(8), 798–801. DOI 10.1002/(ISSN)1521-1878. [Google Scholar] [CrossRef]
11. Monterroso, P., Moore, K. J., Sample, J. M., Sorajja, N., Domingues, A. et al. (2022). Racial/ethnic and sex differences in young adult malignant brain tumor incidence by histologic type. Cancer Epidemiology, 76, 102078. DOI 10.1016/j.canep.2021.102078. [Google Scholar] [CrossRef]
12. Lazarides, A. L., Visgauss, J. D., Nussbaum, D. P., Green, C. L., Blazer, D. G. et al. (2018). Race is an independent predictor of survival in patients with soft tissue sarcoma of the extremities. BMC Cancer, 18(1), 488. DOI 10.1186/s12885-018-4397-3. [Google Scholar] [CrossRef]
13. Chande, A. T., Nagar, S. D., Rishishwar, L., Mariño-Ramírez, L., Medina-Rivas, M. A. et al. (2021). The impact of ethnicity and genetic ancestry on disease prevalence and risk in Colombia. Frontiers in Genetics, 12, 690366. DOI 10.3389/fgene.2021.690366. [Google Scholar] [CrossRef]
14. Kassam, I., Tan, S., Gan, F. F., Saw, W. Y., Tan, L. W. L. et al. (2021). Genome-wide identification of cis DNA methylation quantitative trait loci in three Southeast Asian populations. Human Molecular Genetics, 30(7), 603–618. DOI 10.1093/hmg/ddab038. [Google Scholar] [CrossRef]
15. Lachance, J., Berens, A. J., Hansen, M. E., Teng, A. K., Tishkoff, S. A. et al. (2018). Genetic hitchhiking and population bottlenecks contribute to prostate cancer disparities in men of African descent. Cancer Research, 78(9), 2432–2443. DOI 10.1158/0008-5472.CAN-17-1550. [Google Scholar] [CrossRef]
16. Lim, J. Y. S., Bhatia, S., Robison, L. L., Yang, J. J. (2014). Genomics of racial and ethnic disparities in childhood acute lymphoblastic leukemia. Cancer, 120(7), 955–962. DOI 10.1002/cncr.28531. [Google Scholar] [CrossRef]
17. Yang, J. J., Cheng, C., Devidas, M., Cao, X., Fan, Y. et al. (2011). Ancestry and pharmacogenomics of relapse in acute lymphoblastic leukemia. Nature Genetics, 43(3), 237–241. DOI 10.1038/ng.763. [Google Scholar] [CrossRef]
18. Zou, J., Schiebinger, L. (2018). AI can be sexist and racist—It’s time to make it fair. Nature, 559(7714), 324–326. DOI 10.1038/d41586-018-05707-8. [Google Scholar] [CrossRef]
19. Kapur, S. (2021). Reducing racial bias in AI models for clinical use requires a top-down intervention. Nature Machine Intelligence, 3(6), 460. DOI 10.1038/s42256-021-00362-7. [Google Scholar] [CrossRef]
20. Braun, L., Saunders, B. (2017). Avoiding racial essentialism in medical science curricula. AMA Journal of Ethics, 19(6), 518–527. DOI 10.1001/journalofethics.2017.19.6.peer1-1706. [Google Scholar] [CrossRef]
21. Beltrami, A., Hilliard, A., Green, A. L. (2022). Demographic and socioeconomic disparities in pediatric cancer in the United States: Current knowledge, deepening understanding, and expanding intervention. Cancer Epidemiology, 76(6), 102082. DOI 10.1016/j.canep.2021.102082. [Google Scholar] [CrossRef]
22. Yaylacı, Ş., Roth, W. D., Jaffe, K. (2021). Measuring racial essentialism in the genomic era: The genetic essentialism scale for race (GESR). Current Psychology, 40(8), 3794–3808. DOI 10.1007/s12144-019-00311-z. [Google Scholar] [CrossRef]
23. Liu, K. L., Wu, T., Chen, P. T., Tsai, Y. M., Roth, H. et al. (2020). Deep learning to distinguish pancreatic cancer tissue from non-cancerous pancreatic tissue: A retrospective study with cross-racial external validation. The Lancet Digital Health, 2(6), e303–e313. DOI 10.1016/S2589-7500(20)30078-9. [Google Scholar] [CrossRef]
24. ICML ’07 & ILP ’07: The 24th Annual International Conference on Machine Learning held in conjunction with the 2007 International Conference on Inductive Logic Programming was held in Corvalis Oregon USA. Association for Computing Machinery, New York, NY, United States. [Google Scholar]
25. Shen Z., Cui P., Zhang T., Kunag K. (2020). Stable learning via sample reweighting. Proceedings of the AAAI Conference on Artificial Intelligence, 34(4), 5692–5699. DOI 10.1609/aaai.v34i04.6024. [Google Scholar] [CrossRef]
26. Krawczyk, B. (2016). Learning from imbalanced data: Open challenges and future directions. Progress in Artificial Intelligence, 5(4), 221–232. DOI 10.1007/s13748-016-0094-0. [Google Scholar] [CrossRef]
27. Kamiran, F., Calders, T. (2012). Data preprocessing techniques for classification without discrimination. Knowledge and Information Systems, 33(1), 1–33. DOI 10.1007/s10115-011-0463-8. [Google Scholar] [CrossRef]
28. Xu, T., White, J., Kalkan, S., Gunes, H. (2020). Investigating bias and fairness in facial expression recognition. European Conference on Computer Vision, pp. 506–523. Cham: Springer. [Google Scholar]
29. Wang, M., Deng, W. (2020). Mitigating bias in face recognition using skewness-aware reinforcement learning. Proceedings of the IEEE/CVF Conference on Computer Vision and Pattern Recognition, pp. 9322–9331. [Google Scholar]
30. Zhang, L., Yang, H., Jiang, Z. (2018). Imbalanced biomedical data classification using self-adaptive multilayer ELM combined with dynamic GAN. Biomedical Engineering Online, 17(1), 1–21. DOI 10.1186/s12938-018-0604-3. [Google Scholar] [CrossRef]
31. Puyol-Antón, E., Ruijsink, B., Piechnik, S. K., Neubauer, S., Petersen, S. E. et al. (2021). Fairness in cardiac mr image analysis: An investigation of bias due to data imbalance in deep learning based segmentation. International Conference on Medical Image Computing and Computer-Assisted Intervention, pp. 413–423. Cham: Springer. [Google Scholar]
32. Zhang, J., Lu, H., Zhang, S., Wang, T., Zhao, H. et al. (2021). Leveraging methylation alterations to discover potential causal genes associated with the survival risk of cervical cancer in TCGA through a two-stage inference approach. Frontiers in Genetics, 12, 667877. DOI 10.3389/fgene.2021.667877. [Google Scholar] [CrossRef]
33. Liu, J., Lichtenberg, T., Hoadley, K. A., Poisson, L. M., Lazar, A. J. et al. (2018). An integrated TCGA pan-cancer clinical data resource to drive high-quality survival outcome analytics. Cell, 173(2), 400–416. DOI 10.1016/j.cell.2018.02.052. [Google Scholar] [CrossRef]
34. Zhang, G., Wang, Y., Chen, B., Guo, L., Cao, L. et al. (2019). Characterization of frequently mutated cancer genes in Chinese breast tumors: A comparison of Chinese and TCGA cohorts. Annals of Translational Medicine, 7(8), 179. DOI 10.21037/atm.2019.04.23. [Google Scholar] [CrossRef]
35. Gao, C., Zhuang, J., Zhou, C., Li, H., Liu, C. et al. (2019). SNP mutation-related genes in breast cancer for monitoring and prognosis of patients: A study based on the TCGA database. Cancer Medicine, 8(5), 2303–2312. DOI 10.1002/cam4.2065. [Google Scholar] [CrossRef]
36. Tomczak, K., Czerwińska, P., Wiznerowicz, M. (2015). The cancer genome atlas (TCGAAn immeasurable source of knowledge. Contemporary Oncology, 19(1A), A68–A77. DOI 10.5114/wo.2014.47136. [Google Scholar] [CrossRef]
37. Cline, M. S., Craft, B., Swatloski, T., Goldman, M., Ma, S. et al. (2013). Exploring TCGA pan-cancer data at the UCSC cancer genomics browser. Scientific Reports, 3(1), 1–6. DOI 10.1038/srep02652. [Google Scholar] [CrossRef]
38. Therneau, T. M., Grambsch, P. M. (2000). Modeling survival data: Extending the cox model. New York: Springer. [Google Scholar]
39. Hao, J., Kim, Y., Mallavarapu, T., Oh, J. H., Kang, M. (2019). Interpretable deep neural network for cancer survival analysis by integrating genomic and clinical data. BMC Medical Genomics, 12(10), 1–13. DOI 10.1186/s12920-019-0624-2. [Google Scholar] [CrossRef]
40. Zhang, S., Li, X., Zong, M., Zhu, X., Wang, R. (2017). Efficient kNN classification with different numbers of nearest neighbors. IEEE Transactions on Neural Networks and Learning Systems, 29(5), 1774–1785. DOI 10.1109/TNNLS.2017.2673241. [Google Scholar] [CrossRef]
41. Suthaharan, S. (2016). Support vector machine. Machine Learning Models and Algorithms for Big Data Classification, pp. 207–235. Boston, MA: Springer. [Google Scholar]
42. Christo, V. E., Nehemiah, H. K., Brighty, J., Kannan, A. (2020). Feature selection and instance selection from clinical datasets using co-operative co-evolution and classification using random forest. IETE Journal of Research, 1–14. DOI 10.1080/03772063.2020.1713917. [Google Scholar] [CrossRef]
43. Dehon, E., Weiss, N., Jones, J., Faulconer, W., Hinton, E. et al. (2017). A systematic review of the impact of physician implicit racial bias on clinical decision making. Academic Emergency Medicine, 24(8), 895–904. DOI 10.1111/acem.13214. [Google Scholar] [CrossRef]
44. Plessas, A. (2019). To what extent do patients’ racial characteristics affect our clinical decisions? Evidence-Based Dentistry, 20(4), 101–102. DOI 10.1038/s41432-019-0062-1. [Google Scholar] [CrossRef]
Appendix
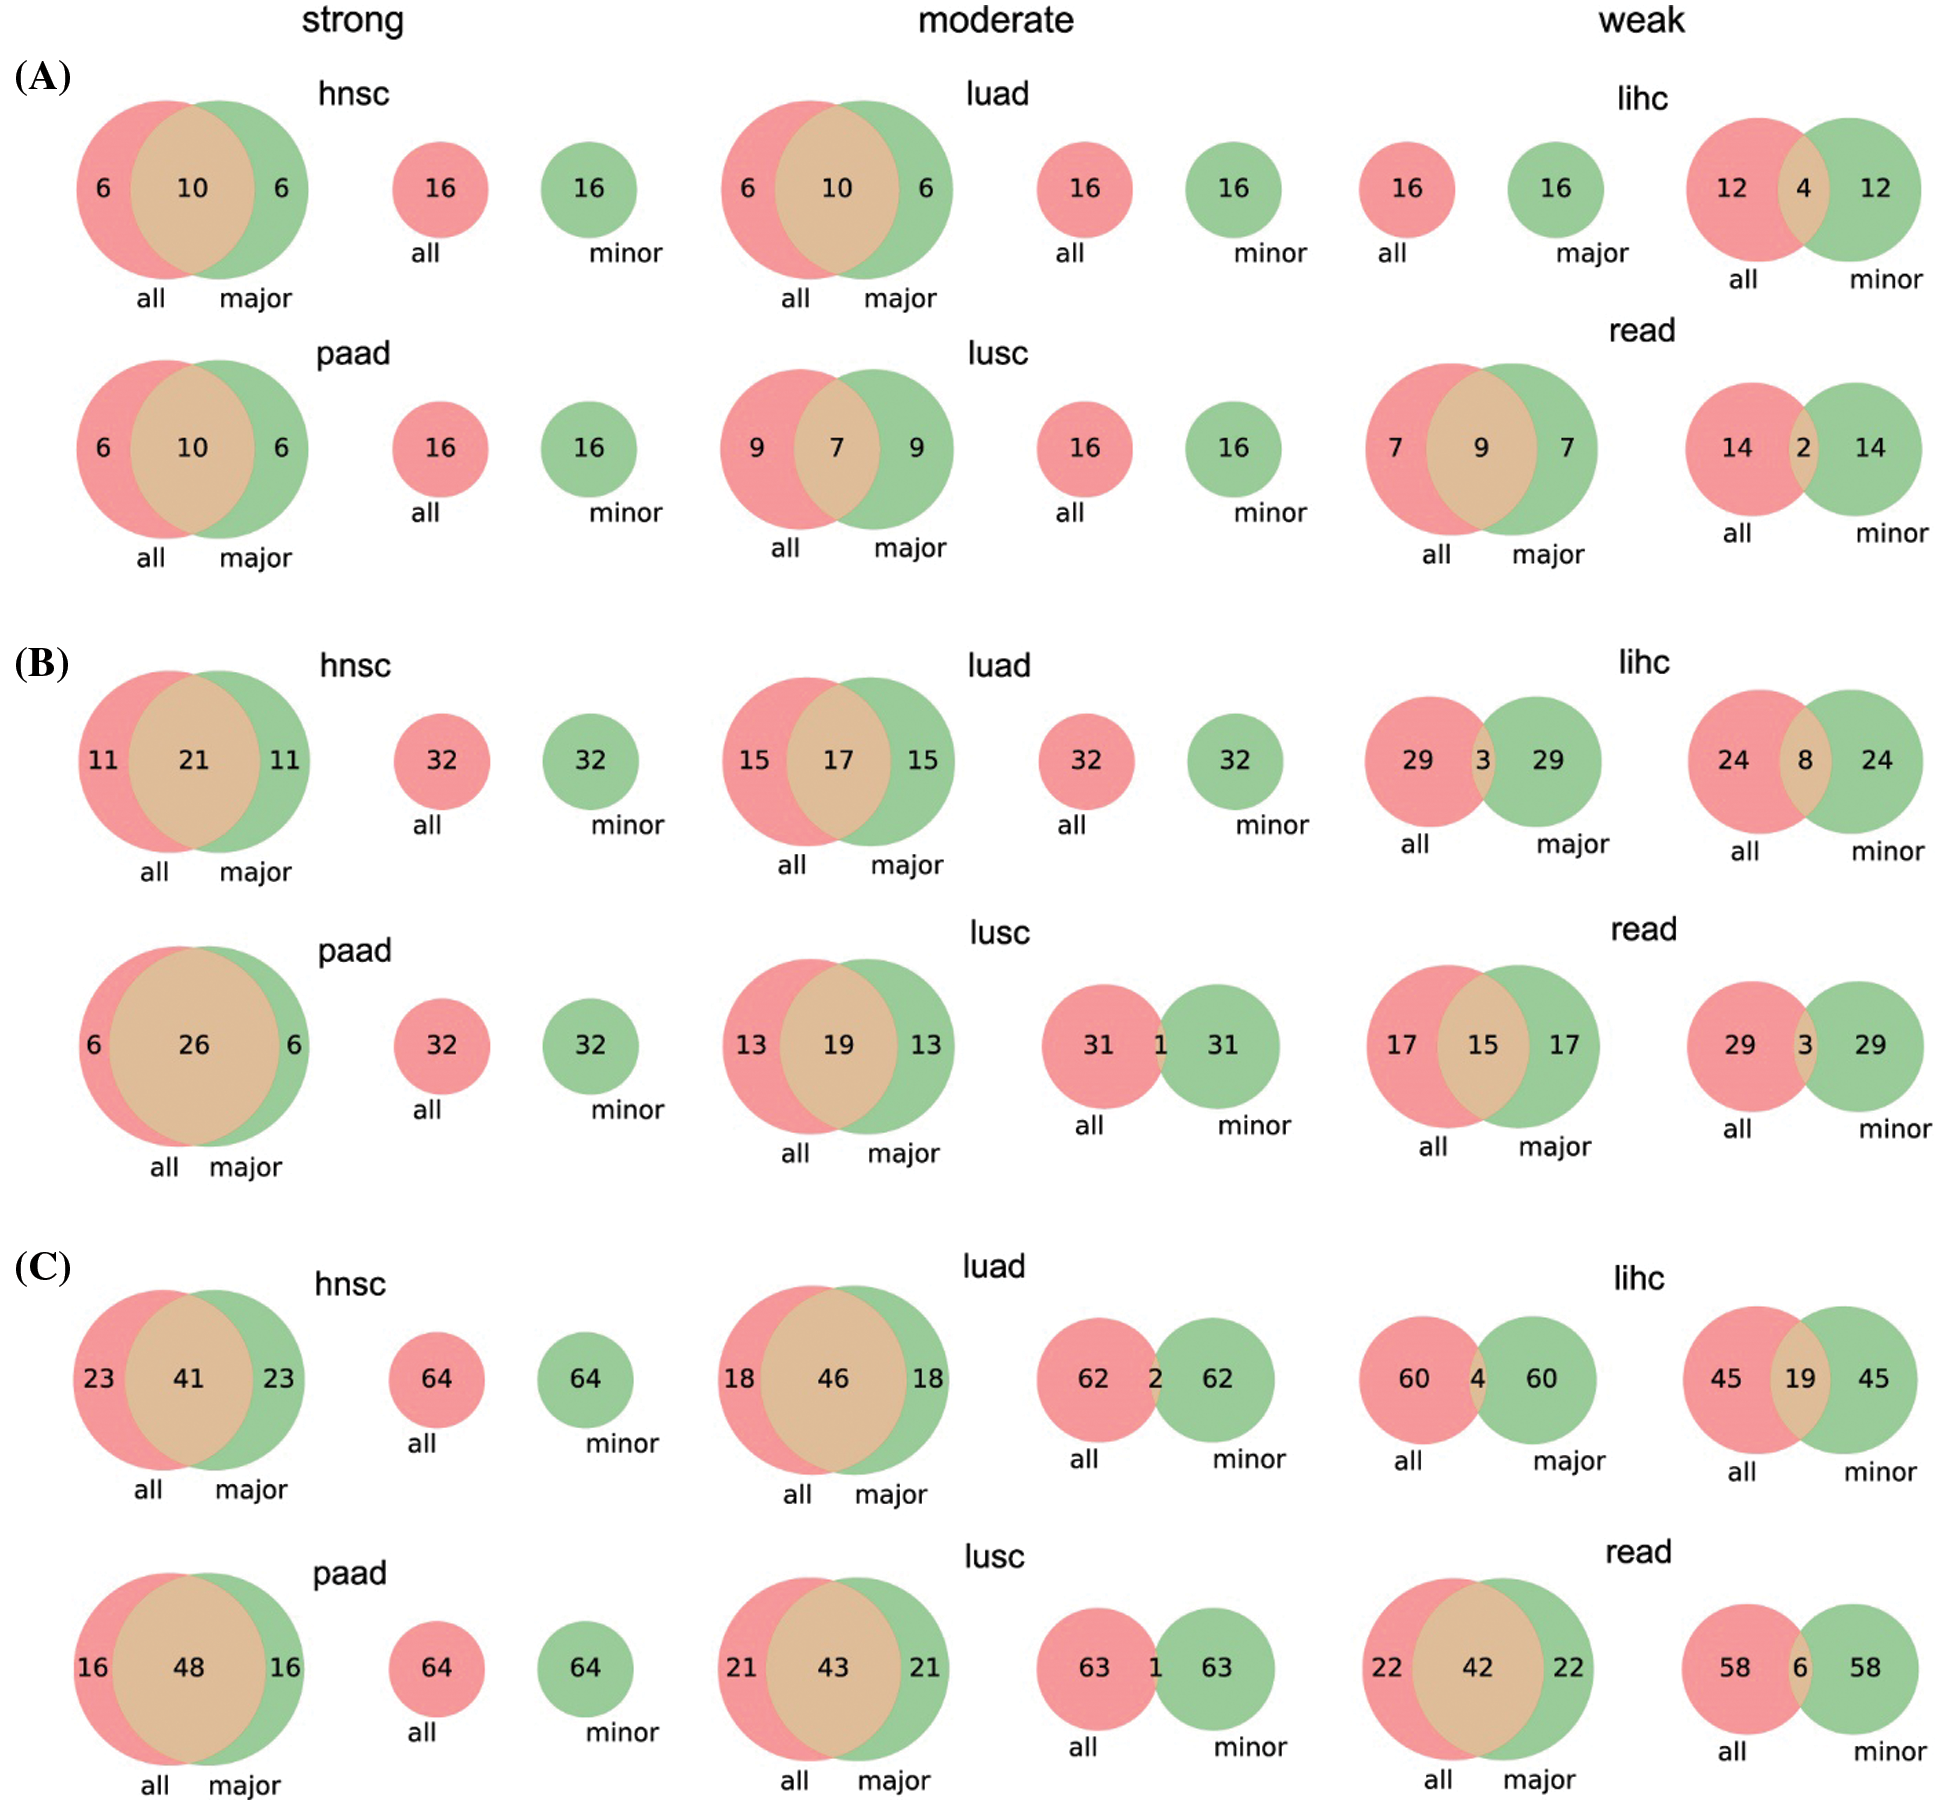
Figure S1: Venn diagrams of top 16 (A), 32 (B), and 64 (C) significant genes between the three parts of patients. We only give the number of genes in each proportion for simplicity
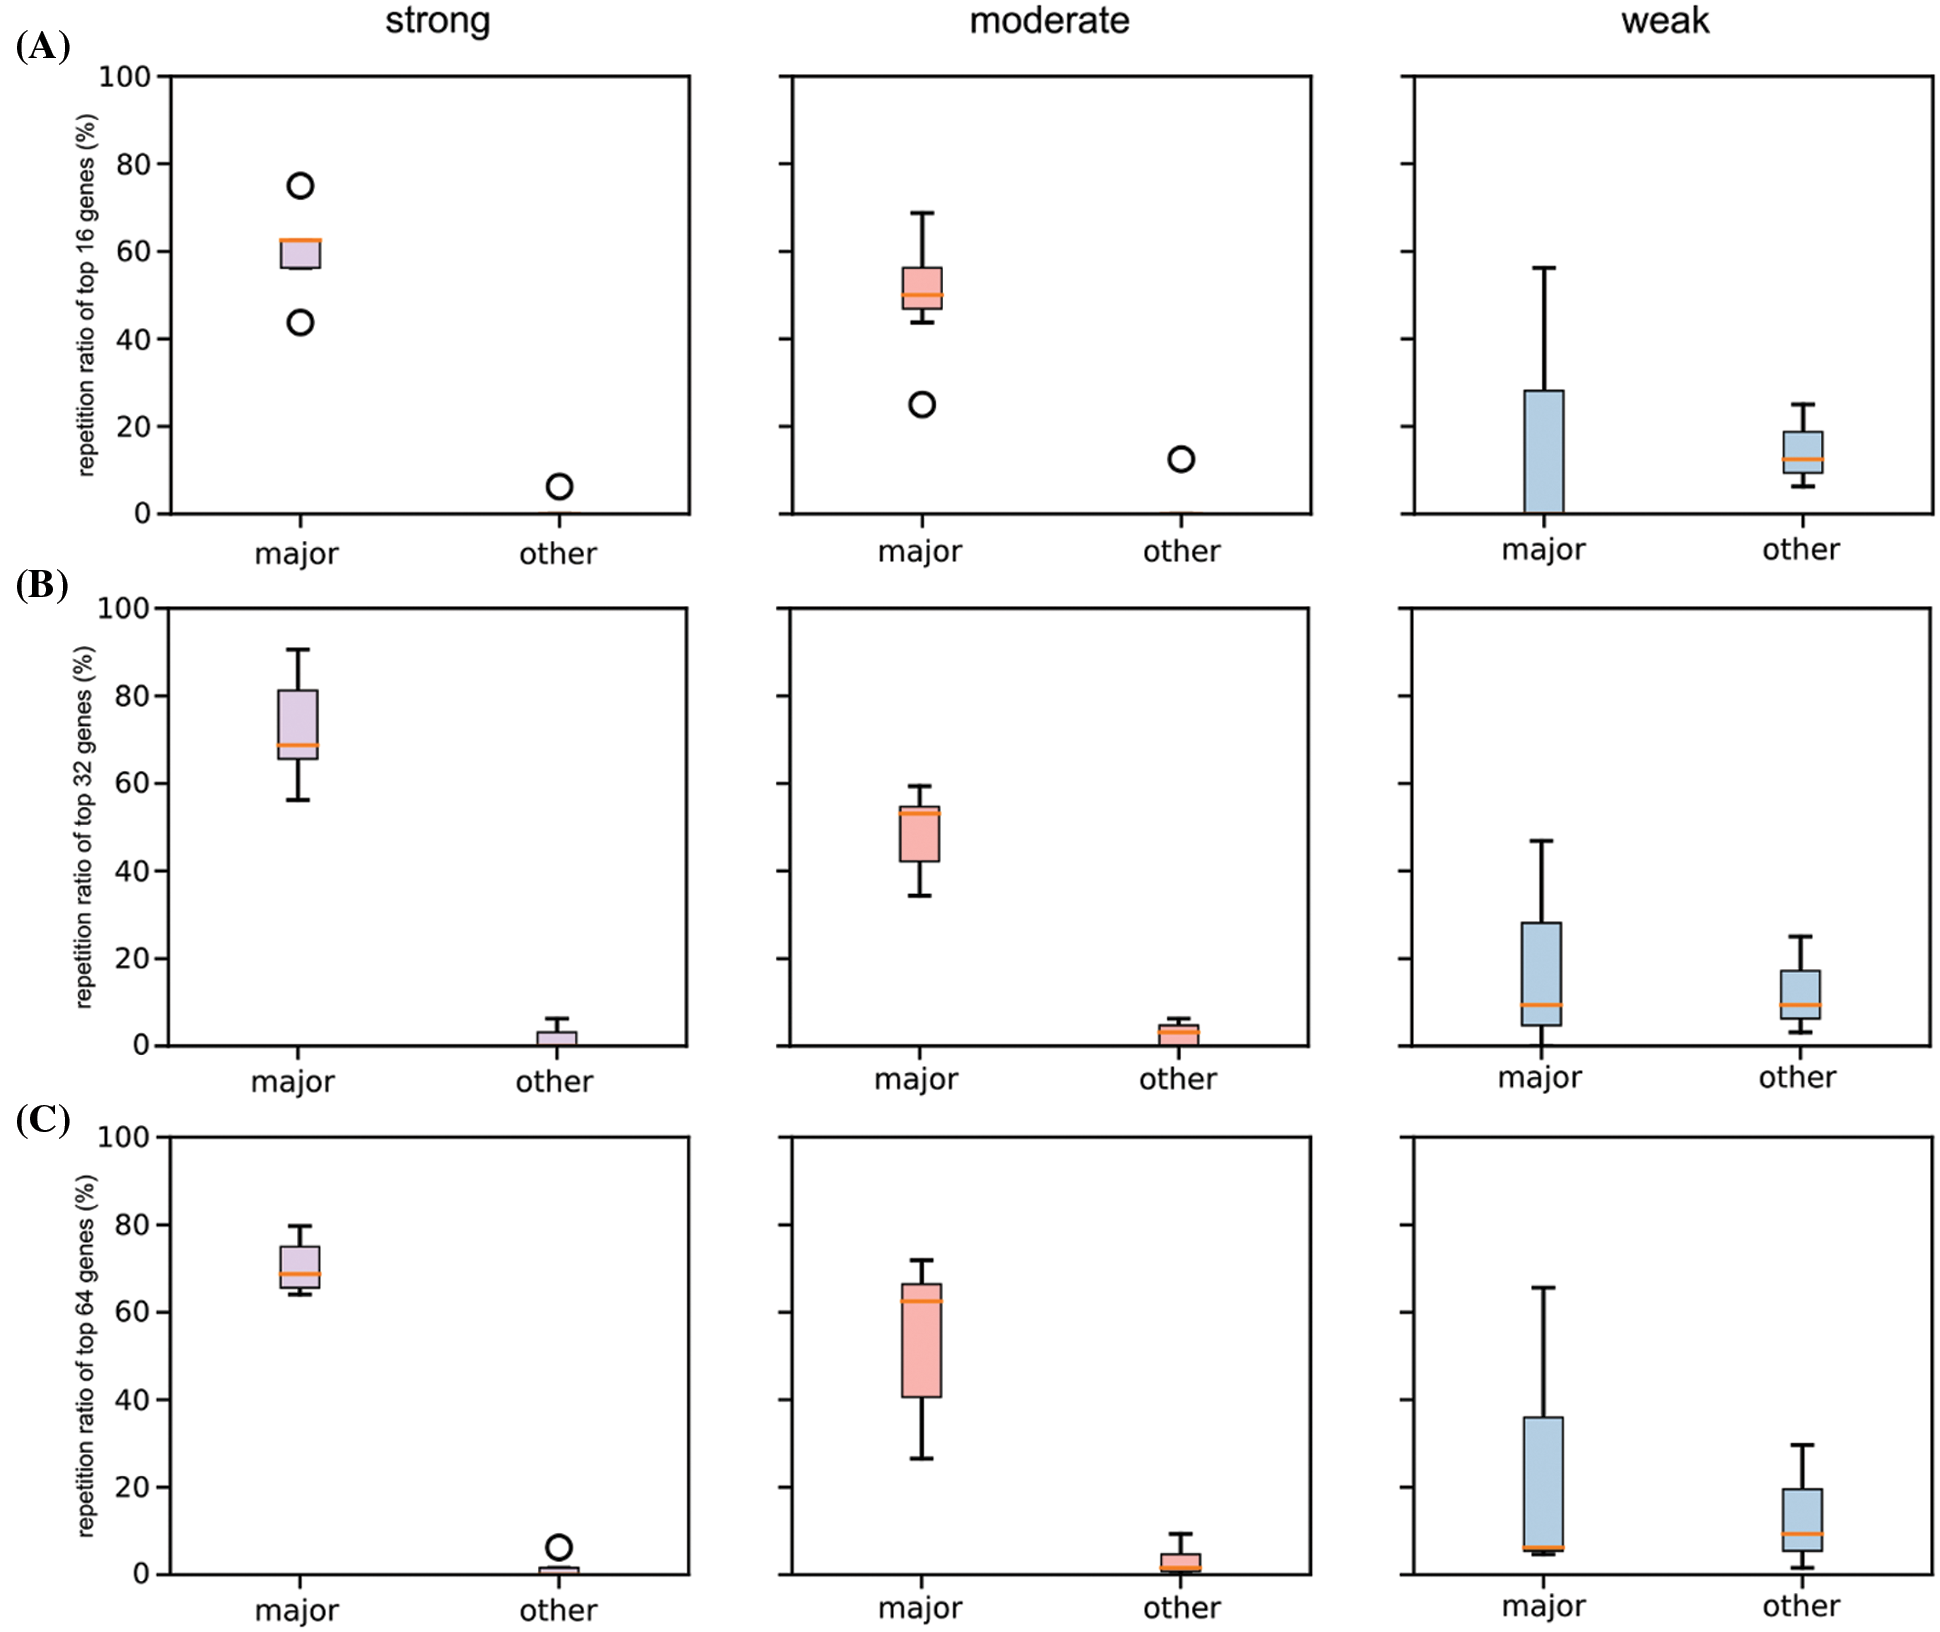
Figure S2: Boxplot of repetition ratios of the selected six cancers concerning top 16 (A), 32 (B), and 64 (C) significant genes
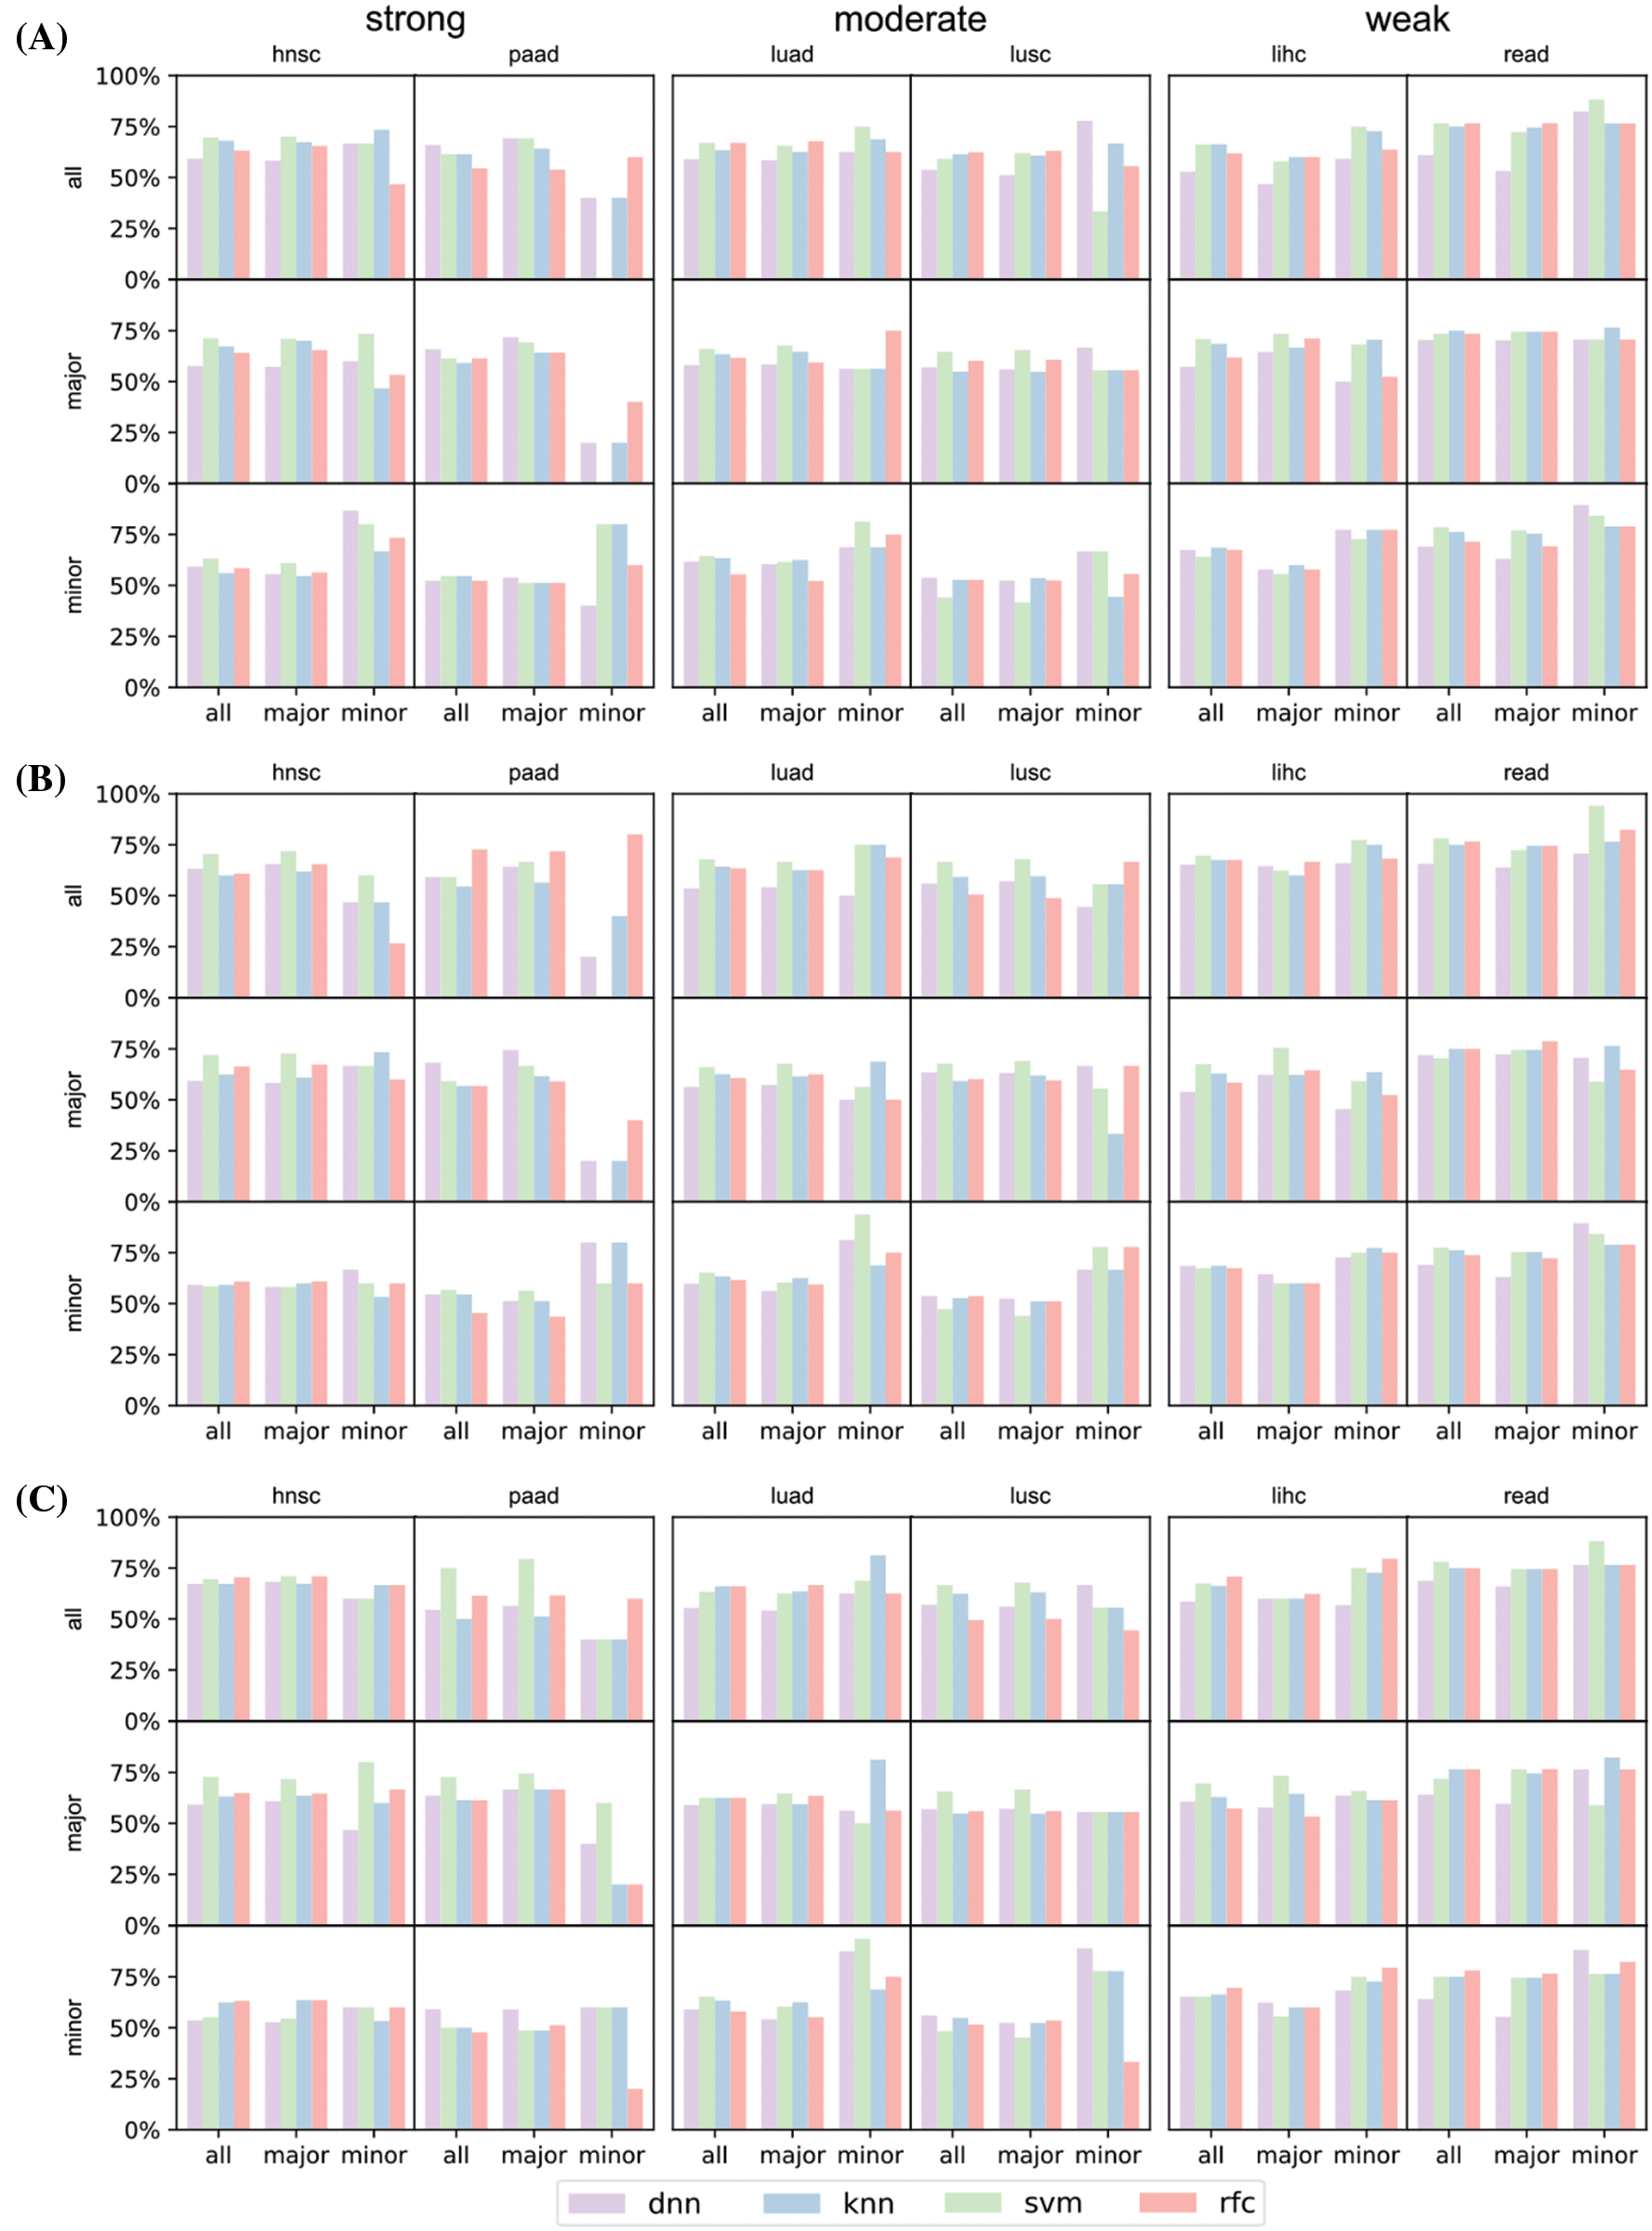
Figure S3: Prediction result of the selected six cancers (hnsc, lihc, luad, lusc, paad, and read) concerning top 16 (A), 32 (B), and 64 (C) significant genes
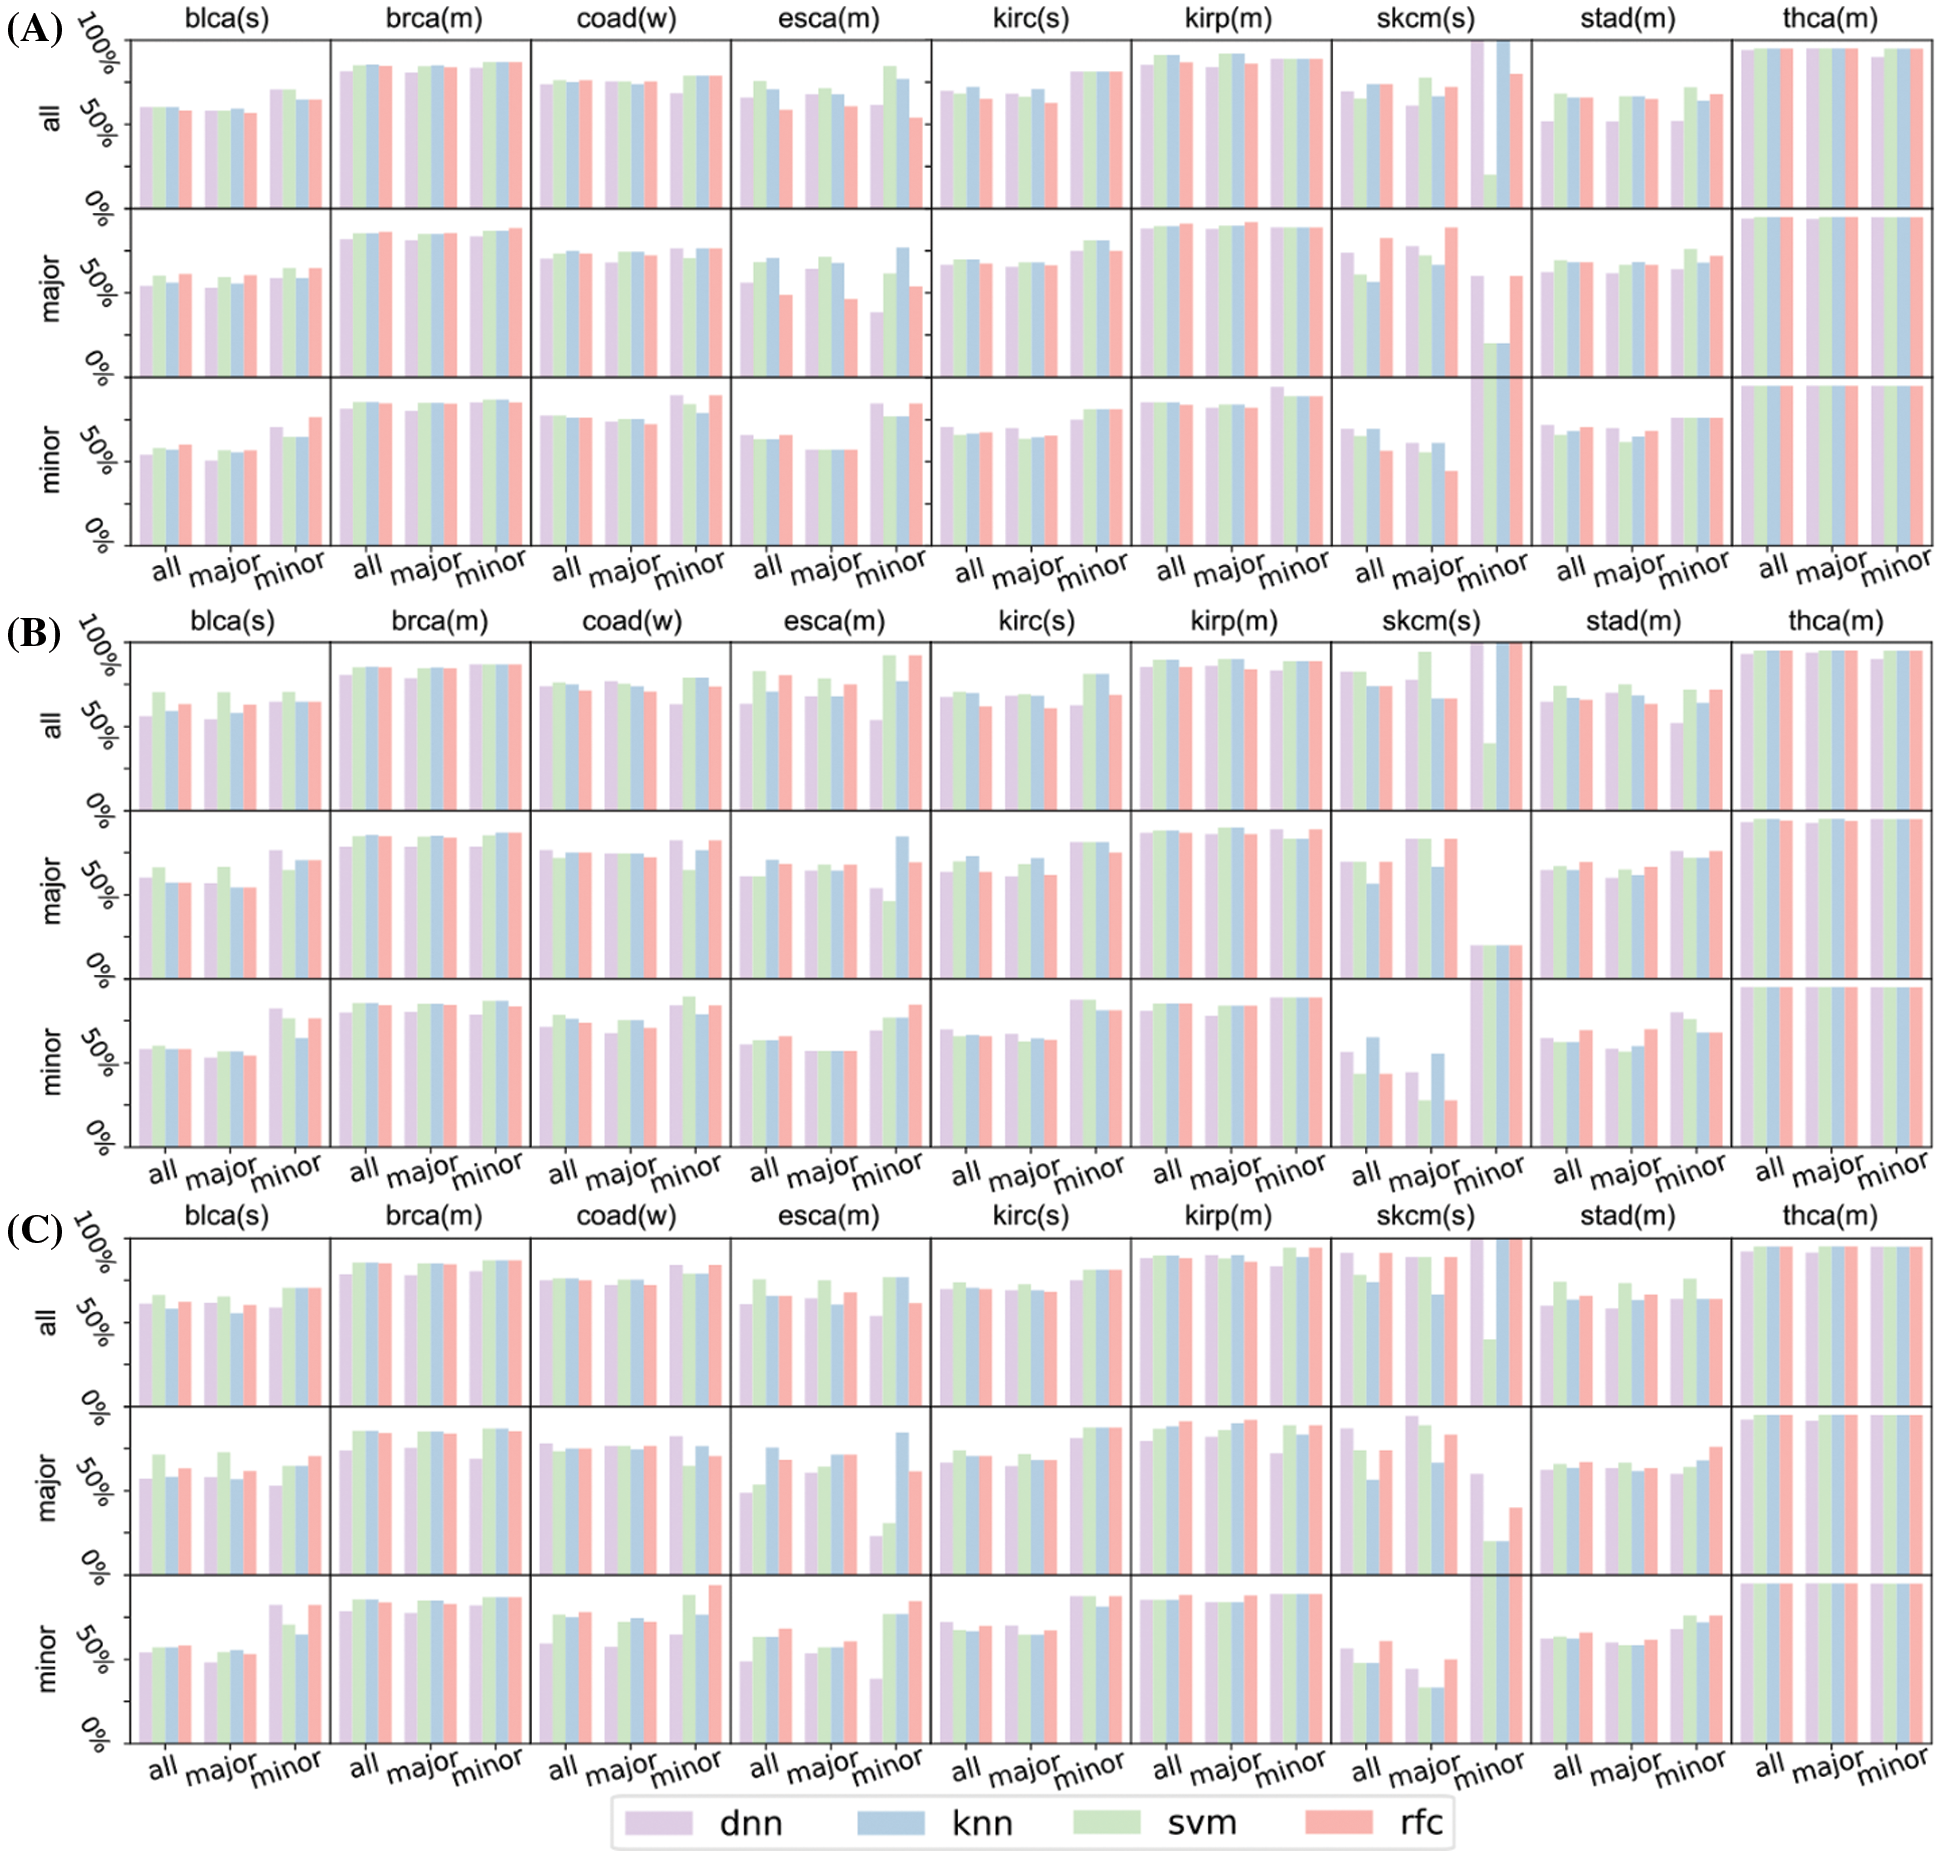
Figure S4: Prediction result of the rest of the nine cancers (blca, brca, coad, esca, kirc, kirp, skcm, stad, and thca) concerning top 16 (A), 32 (B), and 64 (C) significant genes. In these figures, characters after gene names refer to their race types: ‘(s)’ means strong major race bias, ‘(m)’ means moderate major race bias, ‘(w)’ means weak major race bias. skcm has only 11 patients of minor races, its test set of minor races has only 5 patients. The insufficient number of test patients makes the prediction of the survival status fluctuates greatly
 | This work is licensed under a Creative Commons Attribution 4.0 International License, which permits unrestricted use, distribution, and reproduction in any medium, provided the original work is properly cited. |