| Oncologie |
DOI: 10.32604/oncologie.2022.021256
ARTICLE
An ISSA-RF Algorithm for Prediction Model of Drug Compound Molecules Antagonizing ERα Gene Activity
1College of Mathematics and Information Science, Zhengzhou University of Light Industry, Zhengzhou, 450002, China
2College of Electrical and Information Engineering, Zhengzhou University of Light Industry, Zhengzhou, 450002, China
*Corresponding Authors: Xiaoli Guo. Email: xlguo@zzuli.edu.cn; Yong Li. Email: liyong3880@163.com
Received: 05 January 2022; Accepted: 25 April 2022
Abstract: Objectives: The ERα biological activity prediction model is constructed by the compound molecular data of the anti-breast cancer therapeutic target ERα and its biological activity data, which improves the screening efficiency of anti-breast cancer drug candidates and saves the time and cost of drug development. Methods: In this paper, Ridge model is used to screen out molecular descriptors with a high degree of influence on the biological activity of Erα and divide datasets with different numbers of the molecular descriptors by screening results. Random Forest (RF) is trained by Root Mean Square Error (RMSE) and Coefficient of determination (
Keywords: Anti-breast cancer drug candidates; machine learning; ridge regression; random forest; sparrow search algorithm
In recent years, with the rapid development of human society, the global environment has been irreversibly destroyed and bring various diseases that have never been seen before [1]. Drug therapy is an important means to control and treat diseases. Traditional drug research and development cycle is long and the efficiency is low [2]. To reduce the cost and time of drug development, Quantitative Structure-Activity Relationship models (QSAR) are often used to construct drug compounds and target cell activity in drug discovery and development. The model is then used to predict target cell activity corresponding to new or structurally altered drug compounds. The candidate drug compound molecules are screened out according to the predicted biological activity value of the target cell, so as to achieve the purpose of computer-aided selection of the candidate drug compound.
Breast cancer [3] is a common female disease and one of the cancers with a higher mortality rate. In the early 1970s, Pietras discovered that estrogen can rapidly up-regulate the cAMP level of endometrial cells through cell membrane binding sites, and therefore speculated that there is a membrane ER. For the first time, the definition of Estrogen Receptor (ER) has been elaborated. Afterwards, estrogen was confirmed to be directly related to the malignant proliferation of breast cancer cells, and the viewpoint that breast cancer cells depend on estrogen receptors for growth was recognized. ERα is an important target for the treatment of breast cancer, if it is possible to find suitable drug candidates based on ERα activity value and molecular related factors of candidate drug compounds, it will become an effective method. In recent years, the use of machine learning [4,5] in the medical field provides an effective way for drug research and development. Machine learning can study the potential relationship between ERα activity and drug compound molecules, and build a Quantitative Structure-Activity Relationship model (QSAR) of anti-breast cancer drug candidates in order to select suitable drug compound molecules, which can not only improve the time efficiency but also provide a variety of options for the development of anti-breast cancer drugs.
Machine learning is a method in which a computer automatically finds rules from the input data and can predict unknown data through such rules. It has powerful big data computing capabilities and plays an important role in data processing and data mining. In previous studies, machine learning has a strong application background in classification in the medical field. Jiang et al. [6] used the annealing algorithm and Random Forest (RF) to determine the optimal characteristics of BCRP inhibitors, and used four machine learning methods, deep learning methods, and integrated learning methods to predict BCRP inhibitors, and then evaluated the drug’s effectiveness. The results showed that the Support Vector Machine(SVM) classifier showed the best classification effect, the Mathew’s Correlation Coefficient(MCC) value of the test set was 0.812, and the Area Under Curve (AUC) value was 0.958. Che et al. [7] used three non-integrated machine learning algorithms, Back Propagation Neural Network (BP) and three Boosting series algorithms to predict prostate cancer. The results showed that the Decision Trees model in the non-integrated algorithm is the best with an accuracy rate of 0.933, and Extreme Gradient Boosting model (XGBoost) in the Boosting series of algorithms is the best with an accuracy rate of 0.957. Wang et al. [8] used word vector representation technology to characterize the main feature data, and then used the XGBoost model to learn the correlation between the features to identify the pathogens of food-borne diseases. The results showed that the precision rate and recall rate are 68%. Lu et al. [9] used Support Vector Machine (SVM), K-Nearest Neighbor (K-NN), Decision Trees and other methods to construct classification models for neuraminidase (NA) inhibitors and non-neuraminidase inhibitors. The results showed that the SVM algorithm gave the optimal prediction accuracy is 92.6%.
Machine learning does not have such a significant application background in prediction in the medical field and the main reason is that the feature dimension of the medical data set is large, which has a complicated impact on the prediction results, and the prediction results cannot achieve accurate prediction. This reflects from the side that the main purpose of prediction in the medical field is to assist medical experiments. Sheridan et al. [10] mainly discussed the applicability of XGBoost in QSAR model in the paper and use Grid algorithm to optimize the model parameters. The experimental average determination coefficient (
The widespread use of machine learning [12–14] provides a new direction for drug research and development, and the idea of integrated learning has gradually developed in the field of machine learning. The idea of ensemble learning is to solve the shortcomings of a single model and to integrate multiple models to avoid the limitations of a single model. Random Forest(RF) is one of ensemble learning.
Since there are many training parameters for the integrated learning RF model, most scholars will train the parameters that have a greater impact on the model. Zheng et al. [15] chosed to train the n_estimators and max_depth in the coal spontaneous combustion temperature prediction model, but this did not give full play to the random selection of features by RF and the influence of the parameter max_features on the model was not considered. Most scholars believe that the choice of max_features will reduce the diversity of a single decision tree and reduce the accuracy of the RF model, so if we choose max_features, we should consider the above two aspects at the same time.
In this paper, Sparrow Search Algorithm (SSA) is combined with RF model, and adaptive weights are added to the SSA finder position update formula, and an ISSA-RF model is proposed. Before the training data was input into the model, the Ridge model was used to screen out molecular descriptors that had a greater impact on the activity of the ERα gene. Since the number of molecular descriptor inputs is uncertain, the dataset is divided by combinations of screening features with different numbers. These data are then trained using the RF model alone with RMSE and
In order to verify the accuracy of the model, Genetic Algorithm Optimized Support Vector Machine (GA-SVM), Back Propagation Neural Network (BP), and Extreme Gradient Boosting (XGBoost) were used to construct a quantitative prediction model for the biological activity of drug compound molecules on Erα in this paper. After experimental comparison, the ISSA-RF model proposed in this paper is superior to the other three models, which can improve the efficiency of screening candidate drug molecules while ensuring the accuracy of prediction, and provides a new idea for the construction of QSAR in terms of model optimization.
This paper introduces Principles and Methods (Data Source, Data Preprocessing, Basic Models, Model Construction and Model Evaluation Index) in the third part, and displays the experimental results in the fourth part Analysis of Results, and the fifth part is the Conclusion of the article.
The data in this article comes from the DrugBank drug molecule database at the University of Alberta [16]. In order to all readers to view the data, we have put the data on the github website (https://github.com/Li519445444/candidate-drug-data-source/tree/master). This data set provides:
a) The biological activity data of 1974 drug compounds on ERα and the biological activity value of the compound against ERα including IC50 and pIC50. The unit of IC50 is nM. The smaller the value, the greater the biological activity and the more effective it is to inhibit ERα activity. The pIC50 is the negative logarithm of the IC50, and this value is usually positively correlated with biological activity, that is, the larger the pIC50 value, the higher the biological activity. Generally, the pIC50 is used to indicate the biological activity.
b) 729 molecular descriptor information for 1974 drug compounds. The molecular descriptor of a compound is a series of parameters used to describe the structure and properties of the compound, including physical and chemical properties (such as molecular weight, LogP, etc.), topological structure characteristics (such as the number of hydrogen bond donors, the number of hydrogen bond acceptors, etc.) and so on.
In view of the problem of non-standard data standards, this paper adopts the following measures to solve the problem:
a) Through data observation, it is found that there are columns with all 0 values in the data. Therefore, 729 molecular descriptors whose information is all 0 are eliminated. Because these descriptors have no role in feature screening and prediction and they have no practical significance in drug development.
b) The values of drug compound molecules have a high degree of dispersion and there are abnormal values. In order to improve the accuracy of the model prediction, this paper uses the RobustScaler function to scale the features by robust statistical information to the abnormal data. Before and after data processing are shown in the Fig. 1.
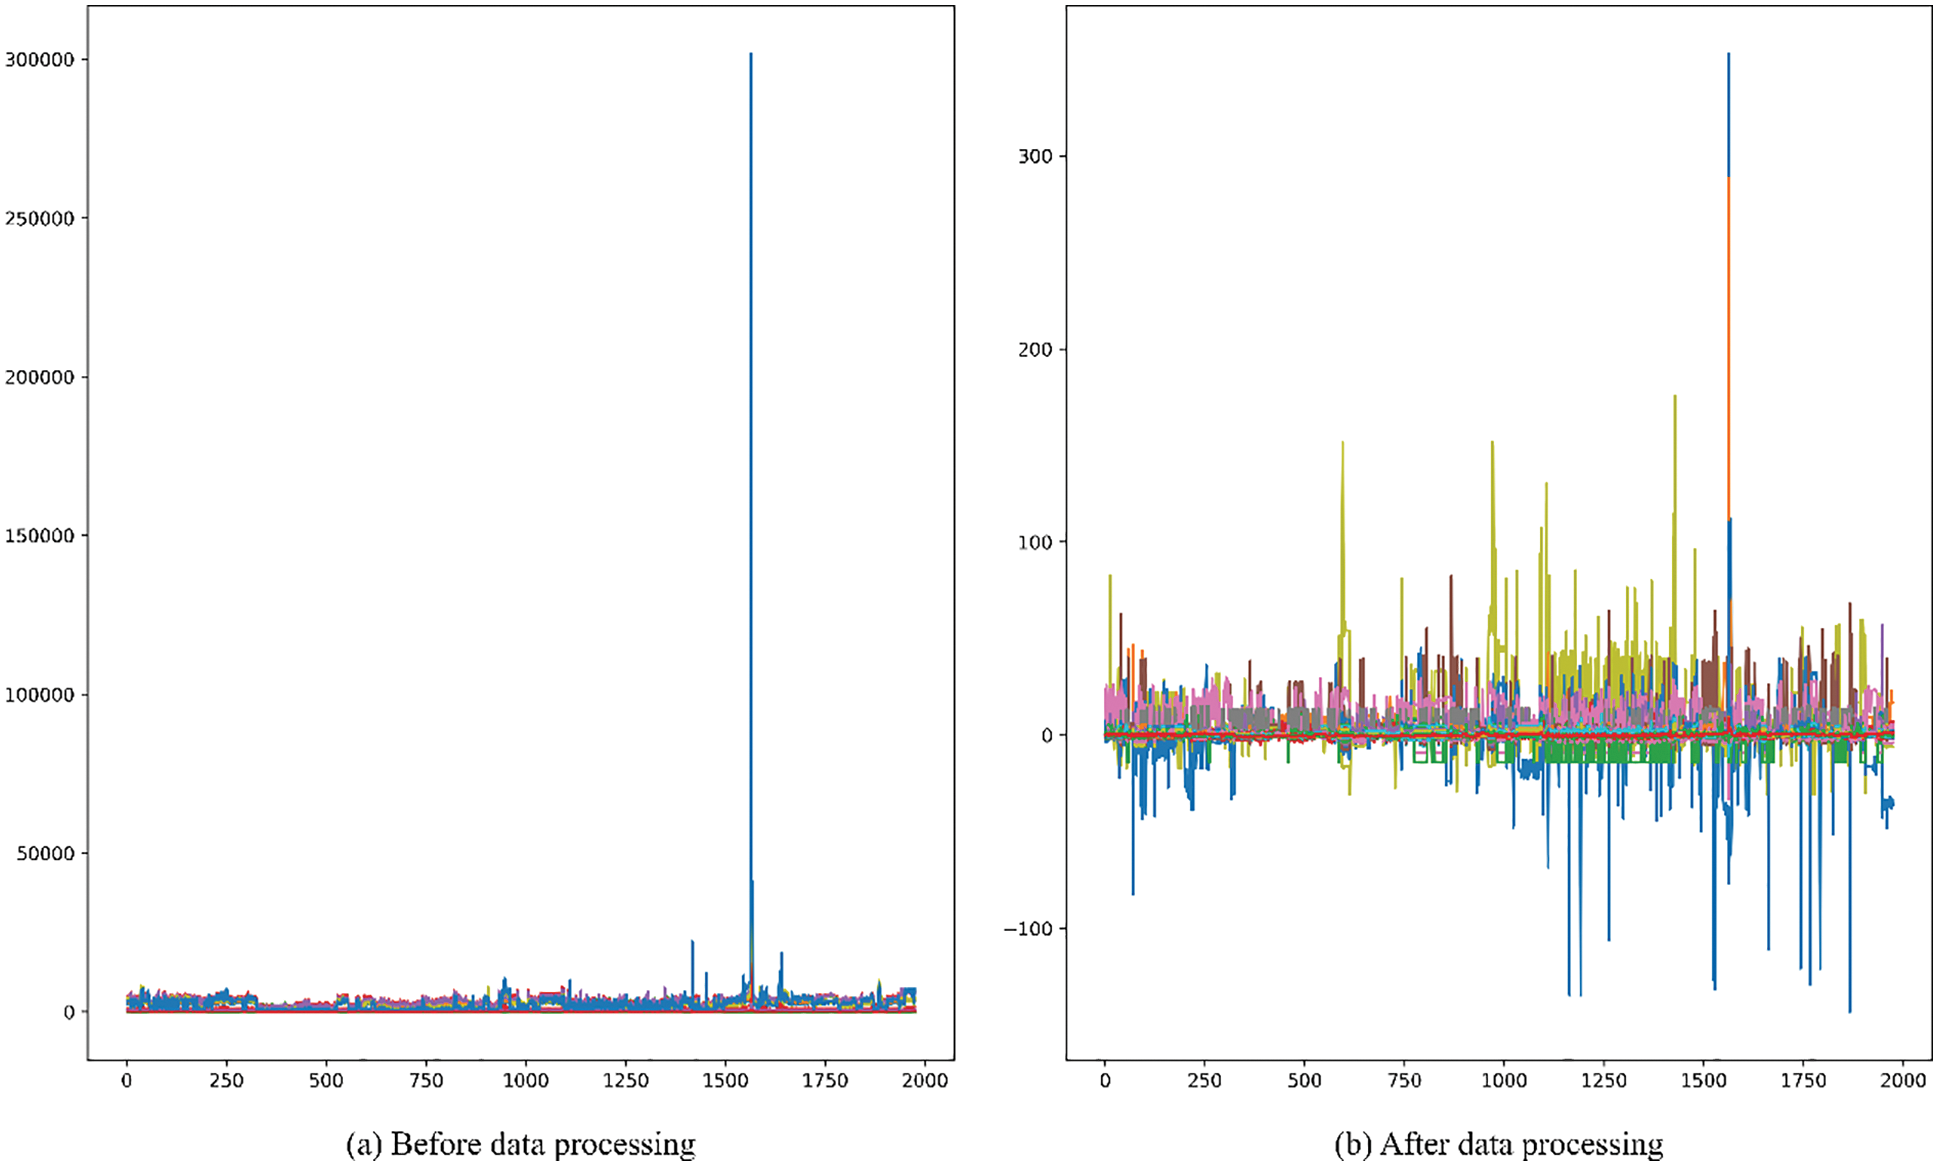
Figure 1: Before and after data standardization
When inputting high-dimensional features into machine learning models, there will be some features in the model that are not related to the training target or the features are redundant [17], and these redundant features not only make the prediction results of the algorithm inaccurate, but also consume computing time and computer memory. There are many excellent algorithms for the selection of data features, such as: Lasso [18], Ridge, Principal Component Analysis [19], etc. This paper adopts Ridge algorithm which is faster in calculation and better in effect.
Enumerate the expression form of the ridge regression algorithm, in Eq. (1),
Take the value of the minimum penalty likelihood function as the estimated value of the regression coefficient, in Eq. (2), The penalty is
When m is 2, that is the Ridge penalty item. The expression form of Ridge regression can be obtained in Eq. (3).
In Ridge regression, the high-dimensional data
3.3.2 Sparrow Search Algorithm
Sparrow Search Algorithm (SSA) [20] is a group behavior algorithm inspired by the foraging behavior and anti-predation behavior of sparrows. Individuals in the population are divided into discoverers, followers and alerters according to the division of labor. The discoverers mainly provide foraging directions and areas for the entire population. The followers follow the discoverers to forage. The alerters are responsible for monitoring the foraging area. The optimization of the model parameters is achieved through the process of updating the position of the three.
Suppose the total number of sparrow individuals is
The discoverers are responsible for guiding the population to find food and guiding the population to a safe location. The location update formula is as follows:
In Eq. (5),
The followers will always follow the discoverers and compete for food resources in order to obtain more food resources. When the fitness of the discoverers is low, the followers will move to other positions, The follower’s position update formula is as follows:
In Eq. (6),
When the population realizes the danger, alerters will quickly make an anti-predation response. The update formula of the position of the alerters is as follows:
In Eq. (7),
3.3.3 Random Forest Prediction Model
Random Forest (RF) [21] is a flexible and easy-to-use machine learning algorithm. It uses multiple regression trees as a basis for training and incorporates the idea of bagging. In the tree training process, random feature selection is used to reduce the correlation between sample features, thereby solving the problem of overfitting of a single decision tree model, so that the model has a better prediction effect. The basic process sees Fig. 2 below.
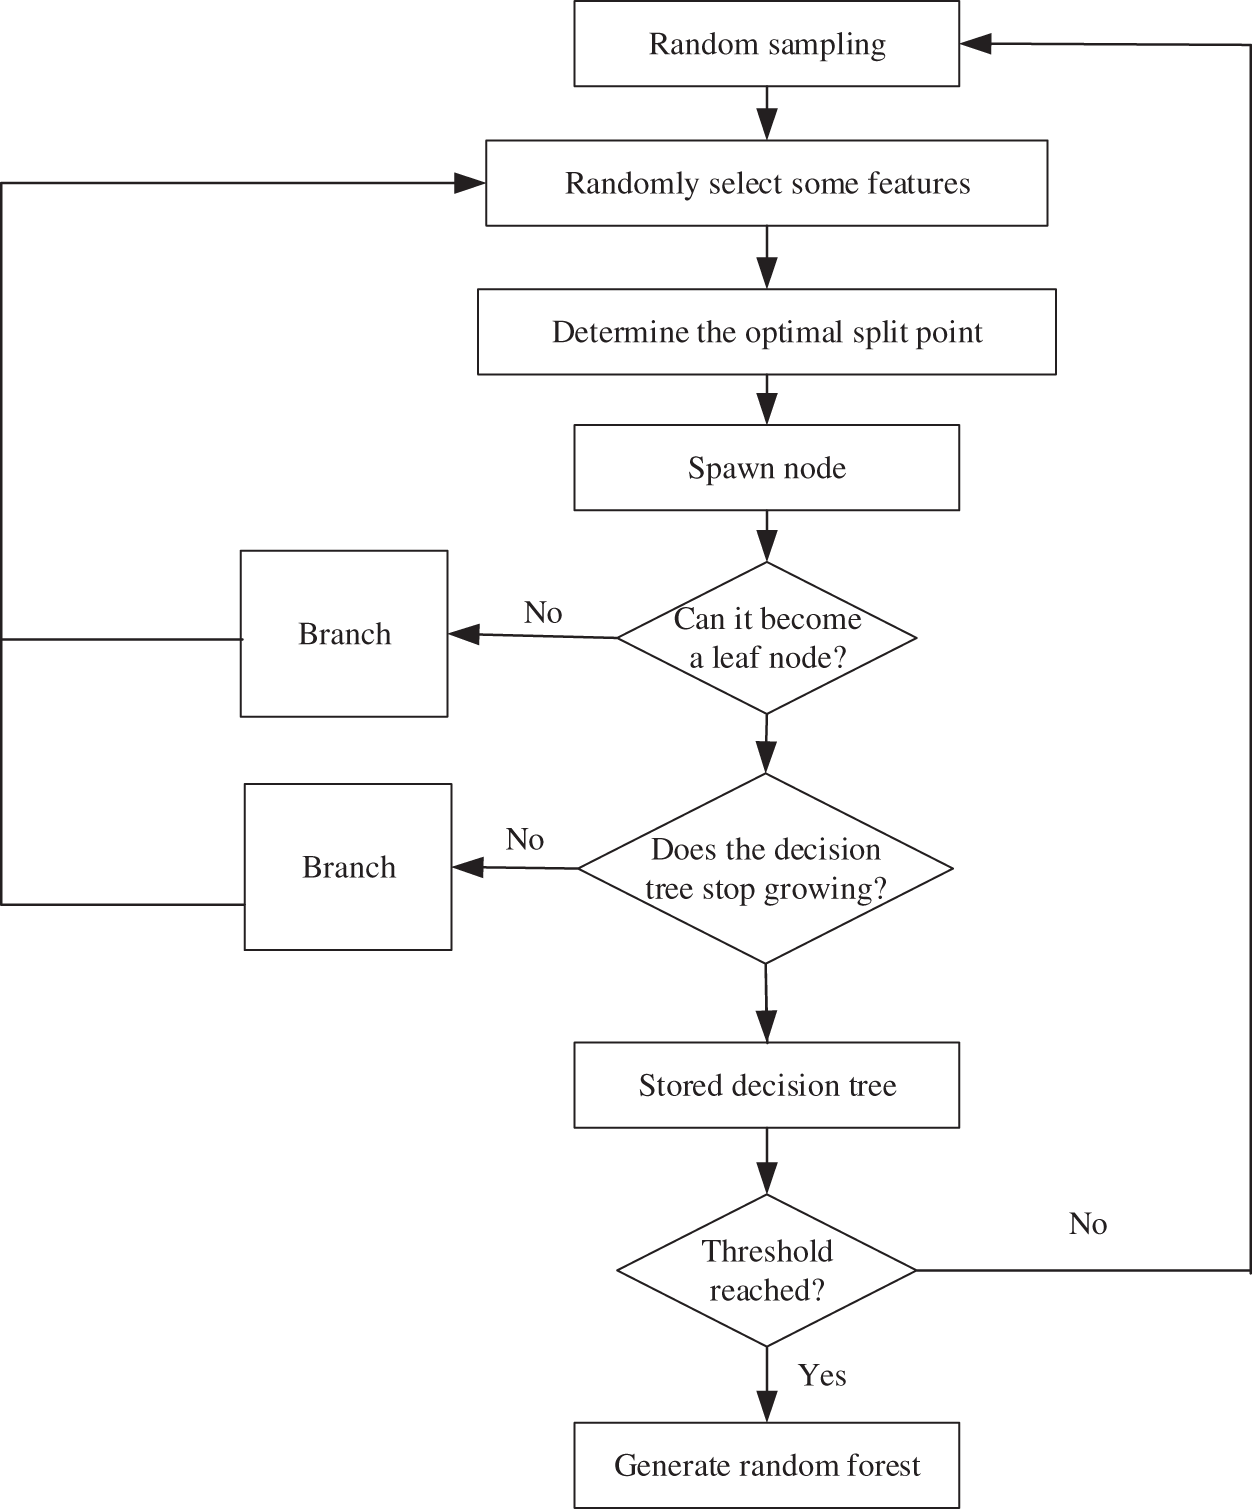
Figure 2: Random Forest algorithm flow
From the flowchart, we can see the Random Forest generation process, and the details are presented below:
a) Random replacement sampling in training samples from the original training set, repeating S times;
b) Use these S data sets as training sets to train S CART tree models;
c) If the feature dimension is M, specify a constant m, randomly select m feature subsets from M features, and each time the tree is split, select the best from these m features;
d) The generated S decision trees are formed into a random forest to ensure that each tree grows to the maximum extent;
e) For classification problems, the classification results are generated by voting by S CART trees. For regression problems, the mean value of the prediction results of S trees is used as the final prediction result.
In addition, the Random Forest incorporates the bootstrap idea when selecting samples, that is, sampling with replacement. The out-of-bag data generated by the bootstrap algorithm can be used to test the generalization ability of the model.
For the establishment of this model, this paper adopts predictive Random Forest, selects the optimal feature
In Eq. (8),
The smaller the
3.4.1 Molecular Descriptor Screening
Ridgecv model is trained using 5-fold cross-validation and training regression coefficients are sorted by the size. The larger the regression coefficient, the higher the influence of the molecular descriptor on the change of biological activity. The top 20 molecular descriptors are shown in the Fig. 3. In this paper, the top 20 to 100 drug compound variables with a high degree of influence are selected through the sorted characteristic regression coefficients and divide into features_num at intervals of 10 features. features_num = [20,30,40,50,60,70,80,90,100]. Divide the dataset by features_num and put the divided dataset into the model for training.
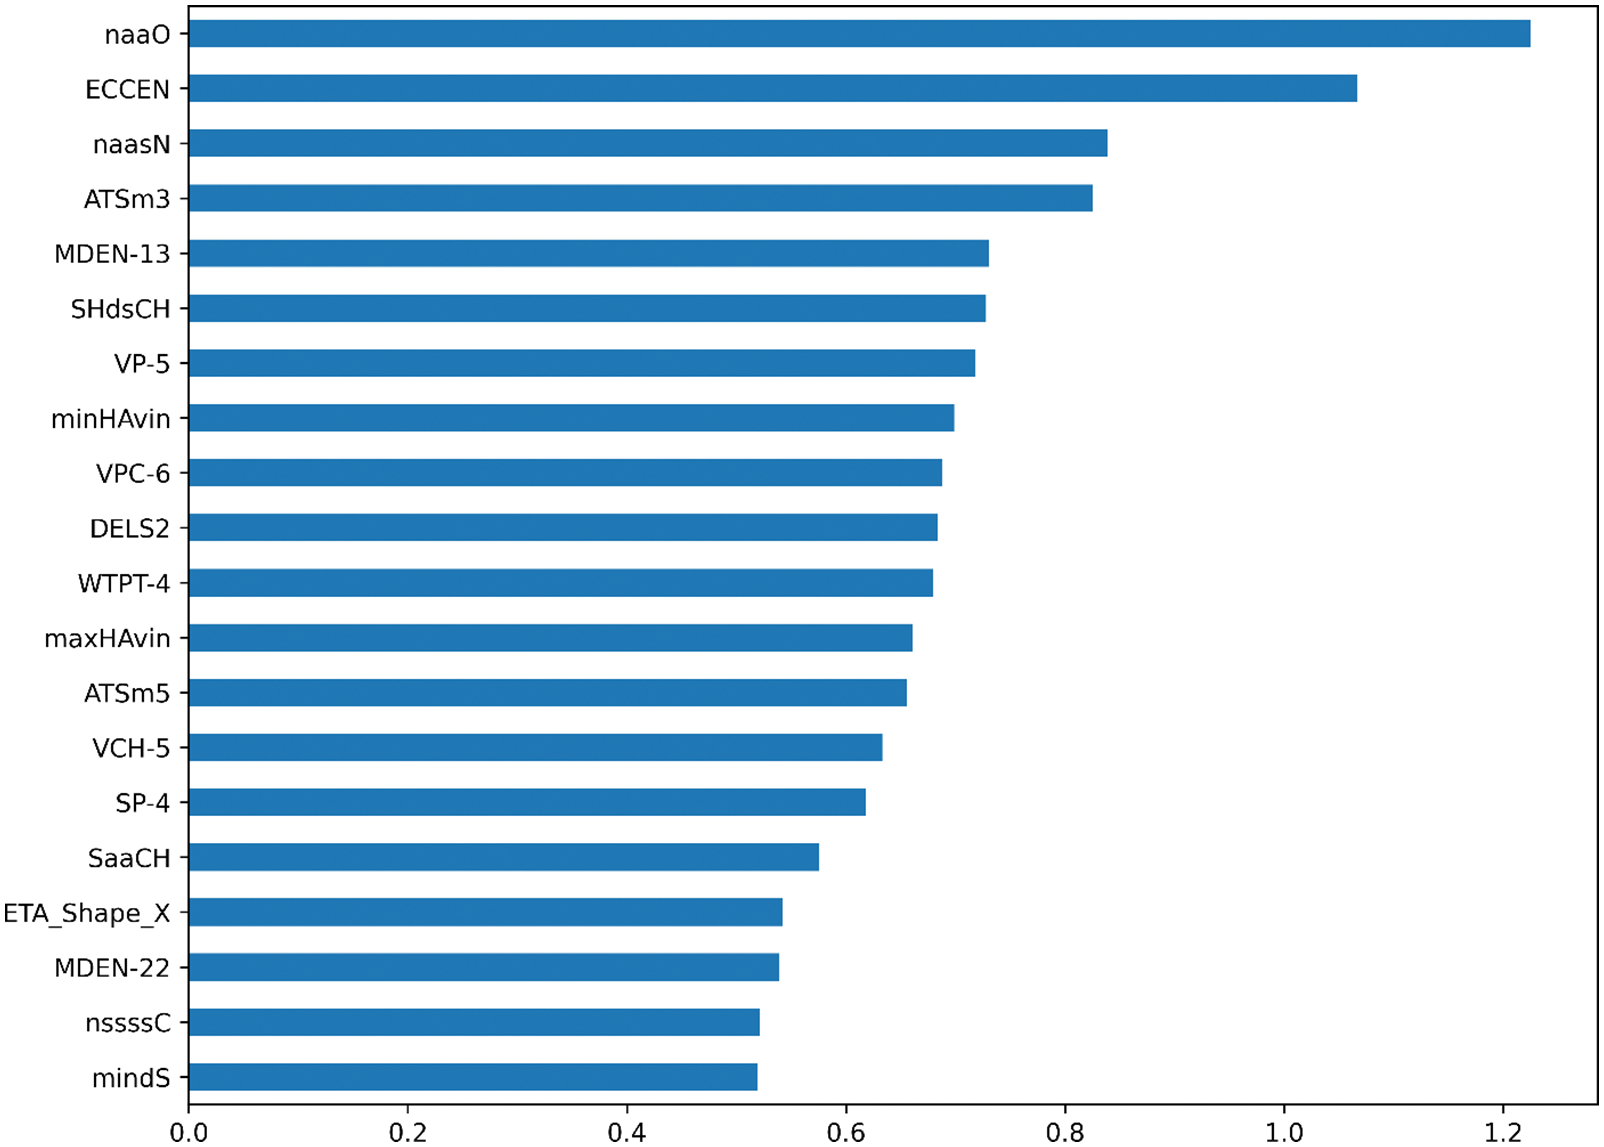
Figure 3: The importance of molecular description of each variable on biological activity is ranked in the top 20
Like other intelligence optimization algorithms, SSA has the problem of easily falling into local optimum. In the later stage of the traditional SSA algorithm iteration, the position between the three sparrows will be updated in a small range near the optimal point, which is prone to the situation that the position update in a small range is stagnant. To solve this problem, this paper proposes an Improved Sparrow Search Algorithm(ISSA). We add dynamic adaptive weights to the sparrow finder position update formula to optimize the local exploration problem of the model. The formula is as follows:
In Eq. (12),
It can be seen from Fig. 4 that
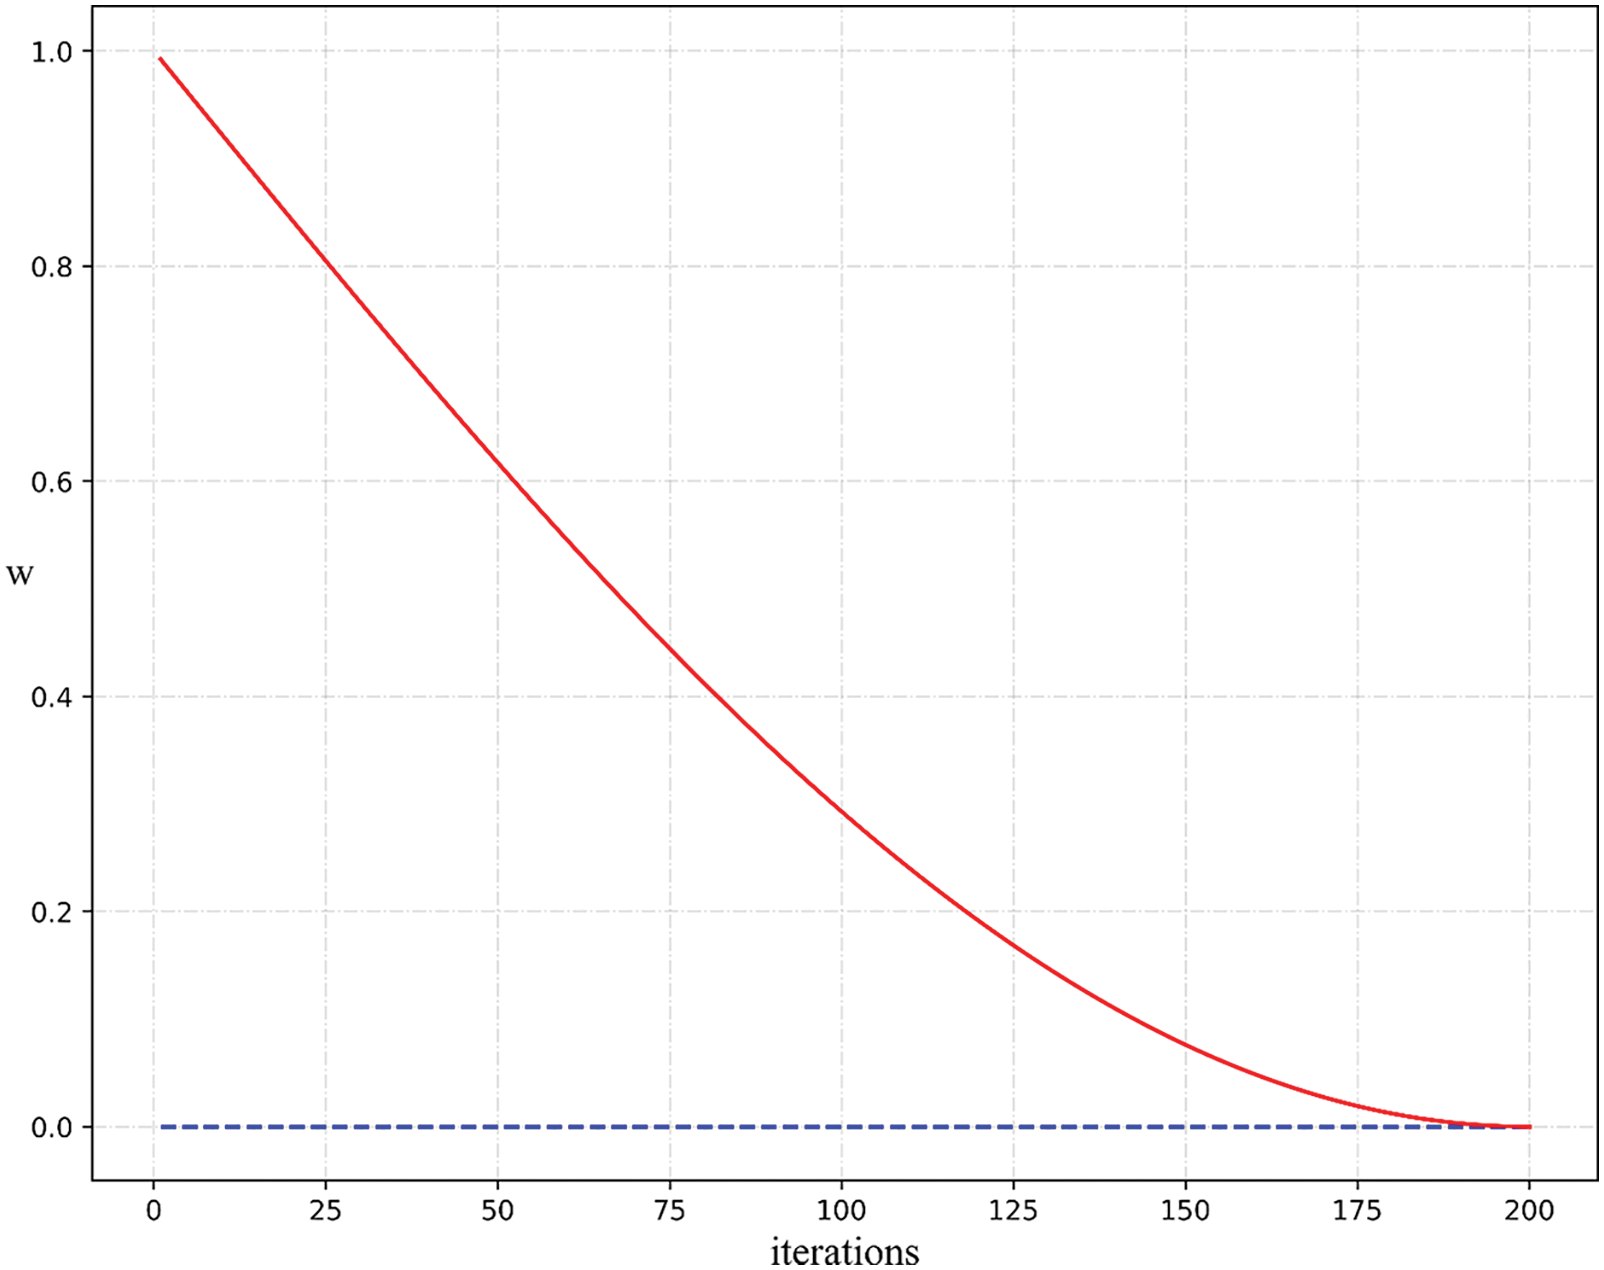
Figure 4: Eq. (12) curve
In order to illustrate the convergence effect of the ISSA algorithm proposed in this paper, this paper uses the Rosenbrock function to conduct simulation experiments. When it is a binary function, as shown in Fig. 5. The Rastrigin formula is as follows:
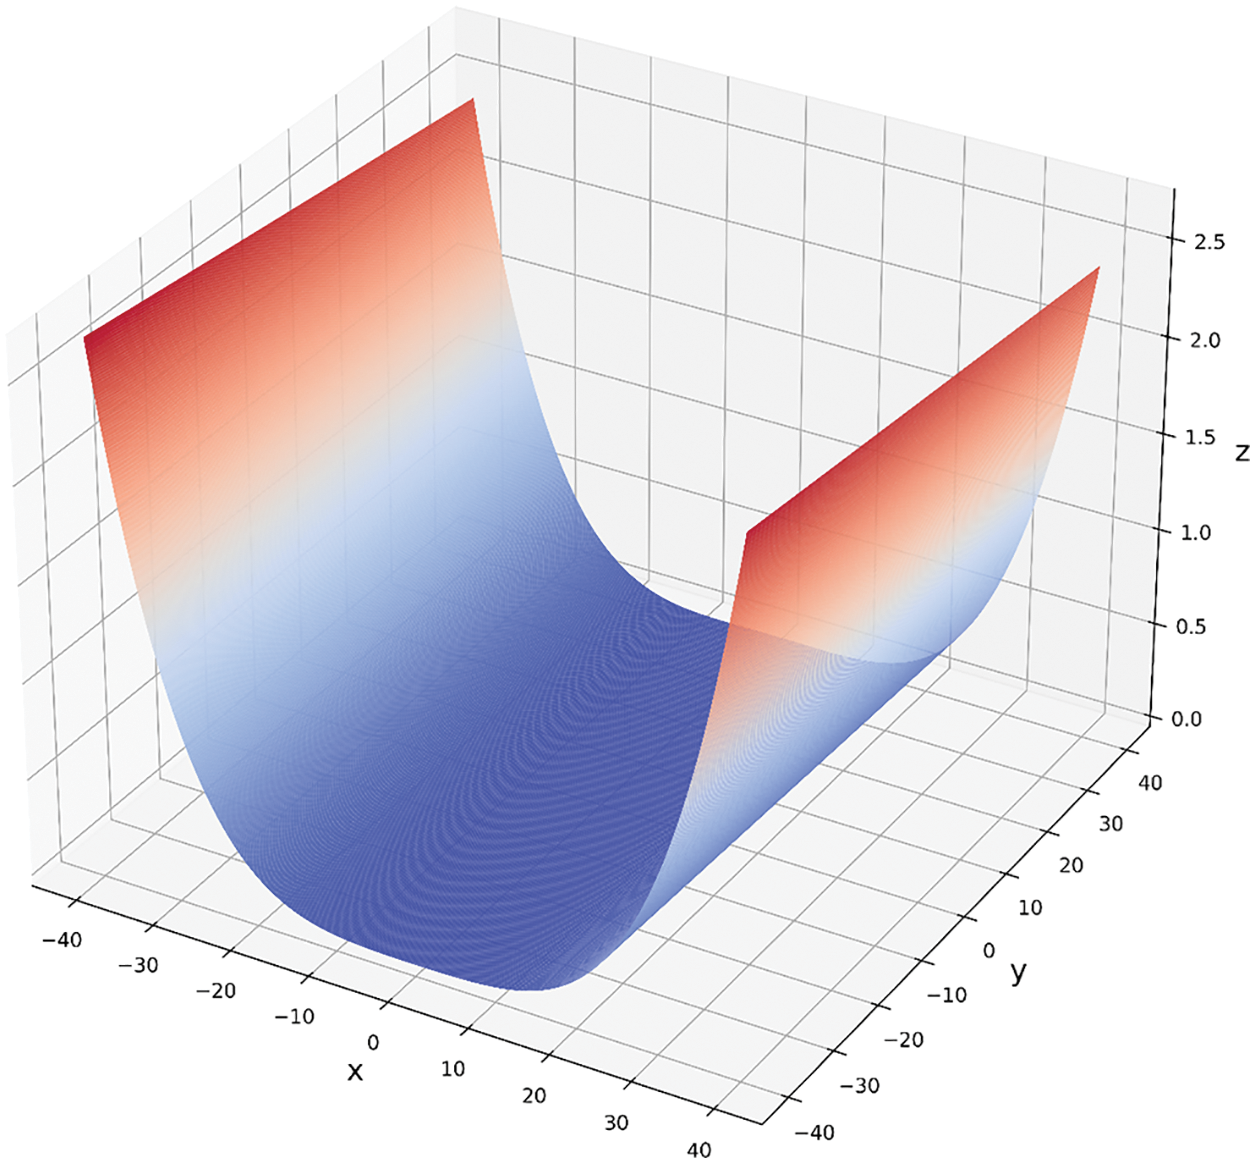
Figure 5: Rosenbrock binary function
In this paper, the independent fitness convergence training of the Rosenbrock function is performed, and the results are shown in Fig. 6. Within 500 iterations, SSA reached the convergence state at 27 iterations, and the convergence fitness value precision reached 10e−7, while ISSA reached the convergence state at 41 iterations, and the convergence fitness value precision reached 10e−23. The fitness convergence accuracy is much higher than that of SSA, which shows that the improved ISSA algorithm has much higher convergence fitness accuracy than the ordinary SSA algorithm.
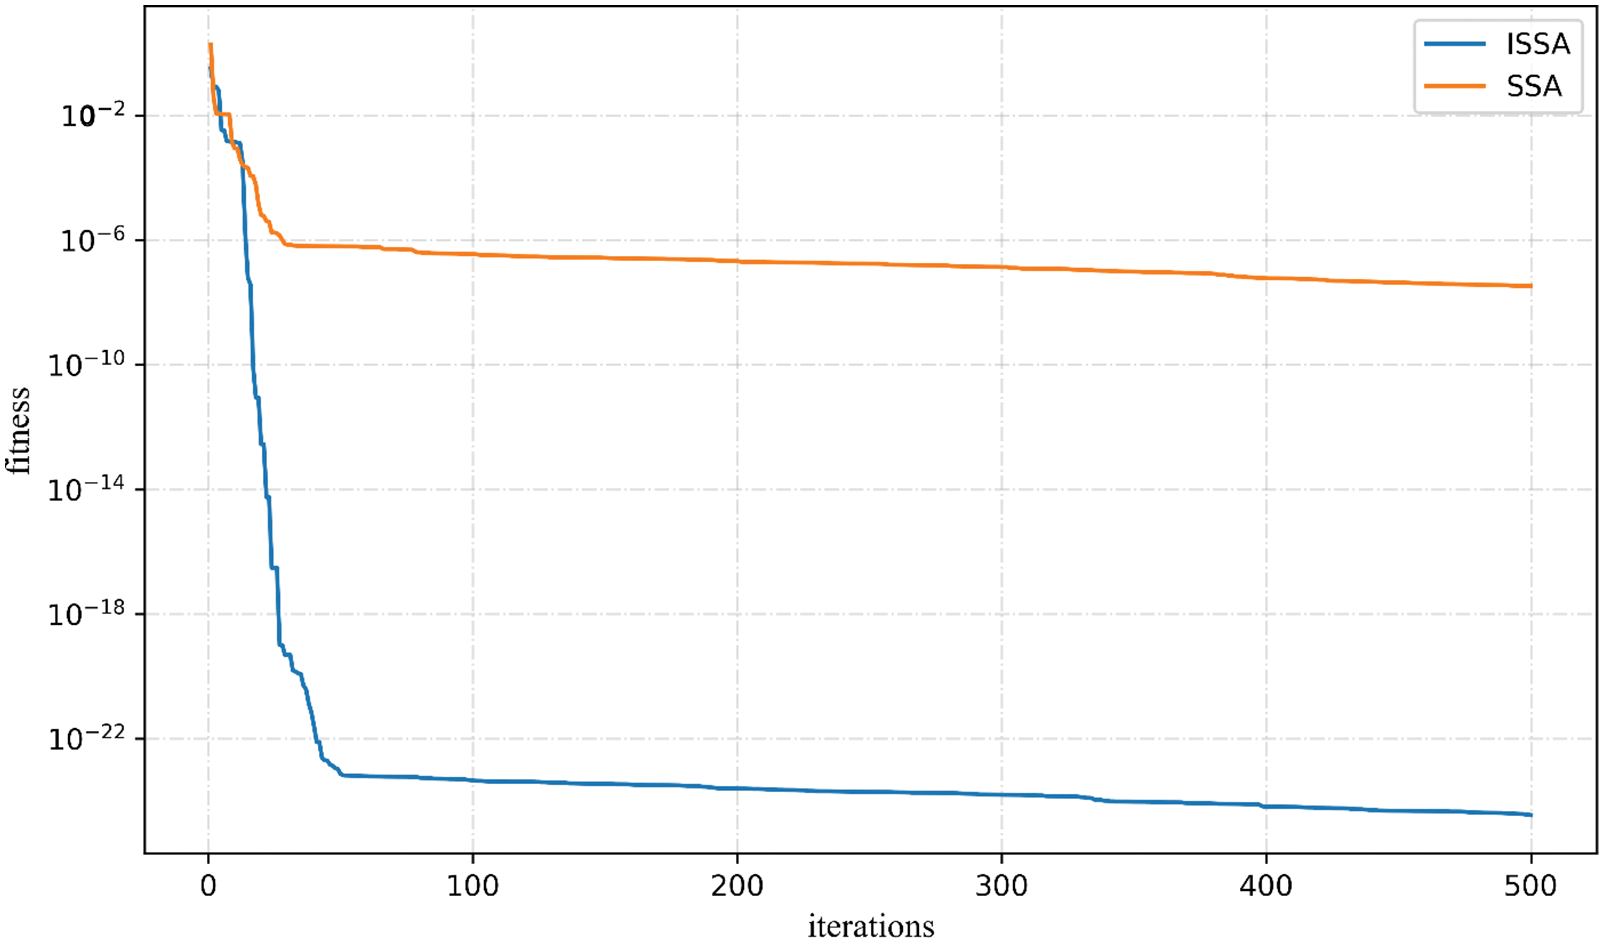
Figure 6: SSA, ISSA to Rosenbrock function convergence curve
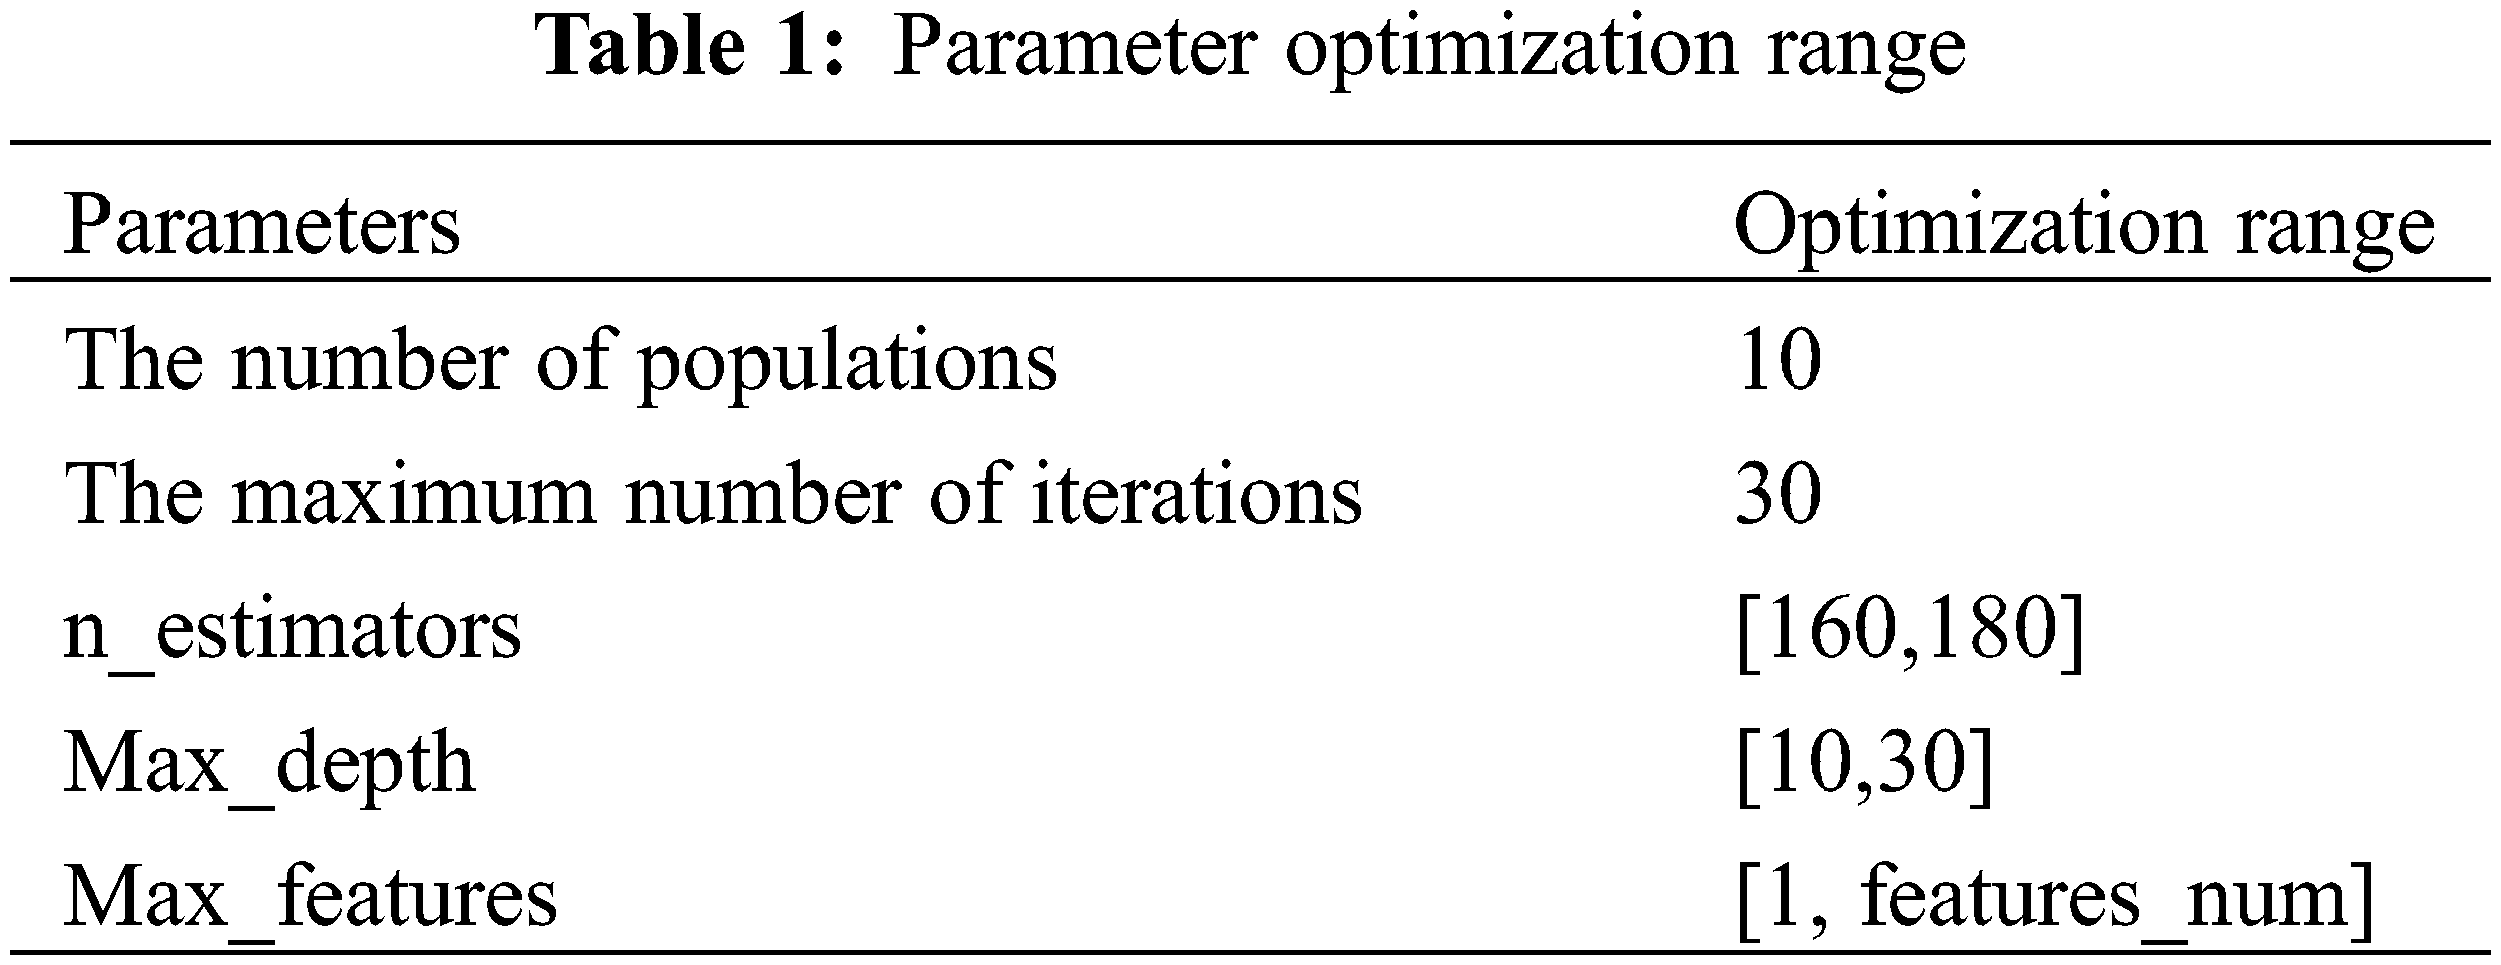
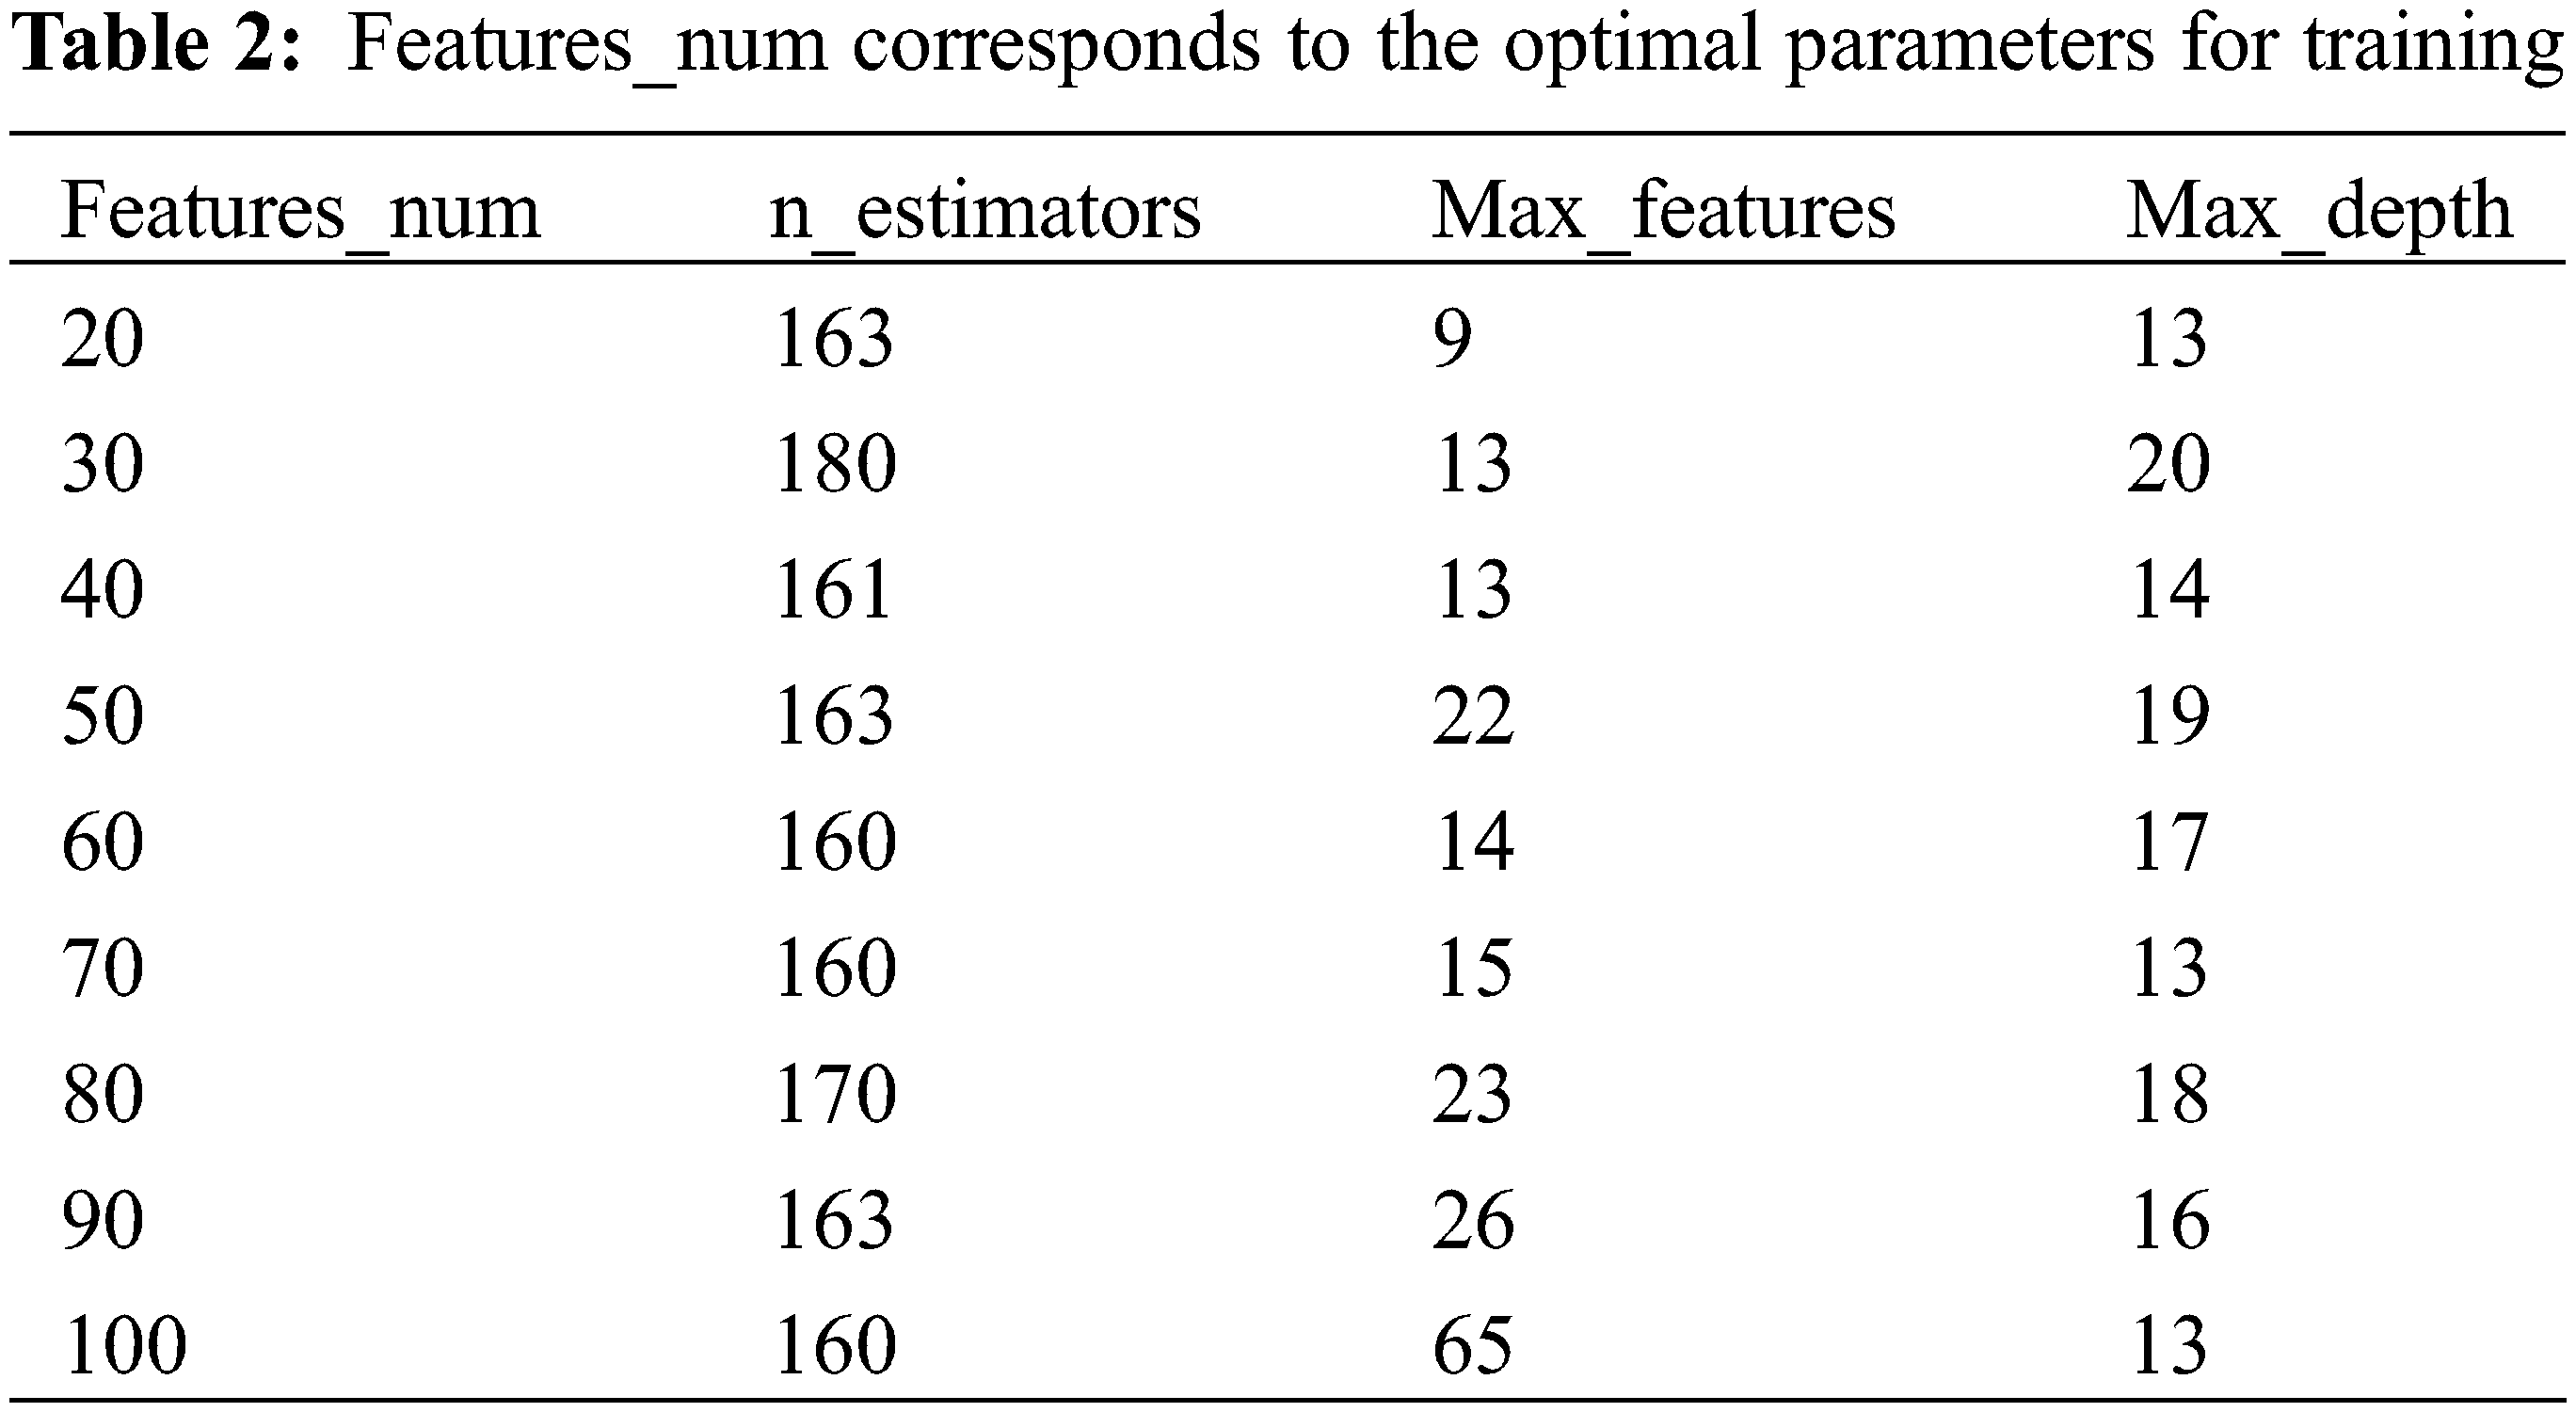
Considering the time benefit and model accuracy of ISSA algorithm parameter optimization, too large an optimization range will lead to long model training time, and too small an optimization range will lose model accuracy, so it is necessary to limit the optimization range of parameters. Among the parameters required by the RandomForestRegressor function, n_estimators, max_depth, and max_features have a greater impact on the accuracy of the RF model. The parameters of max_depth and n_estimators are limited to the optimization range by using RF model training with MSE and
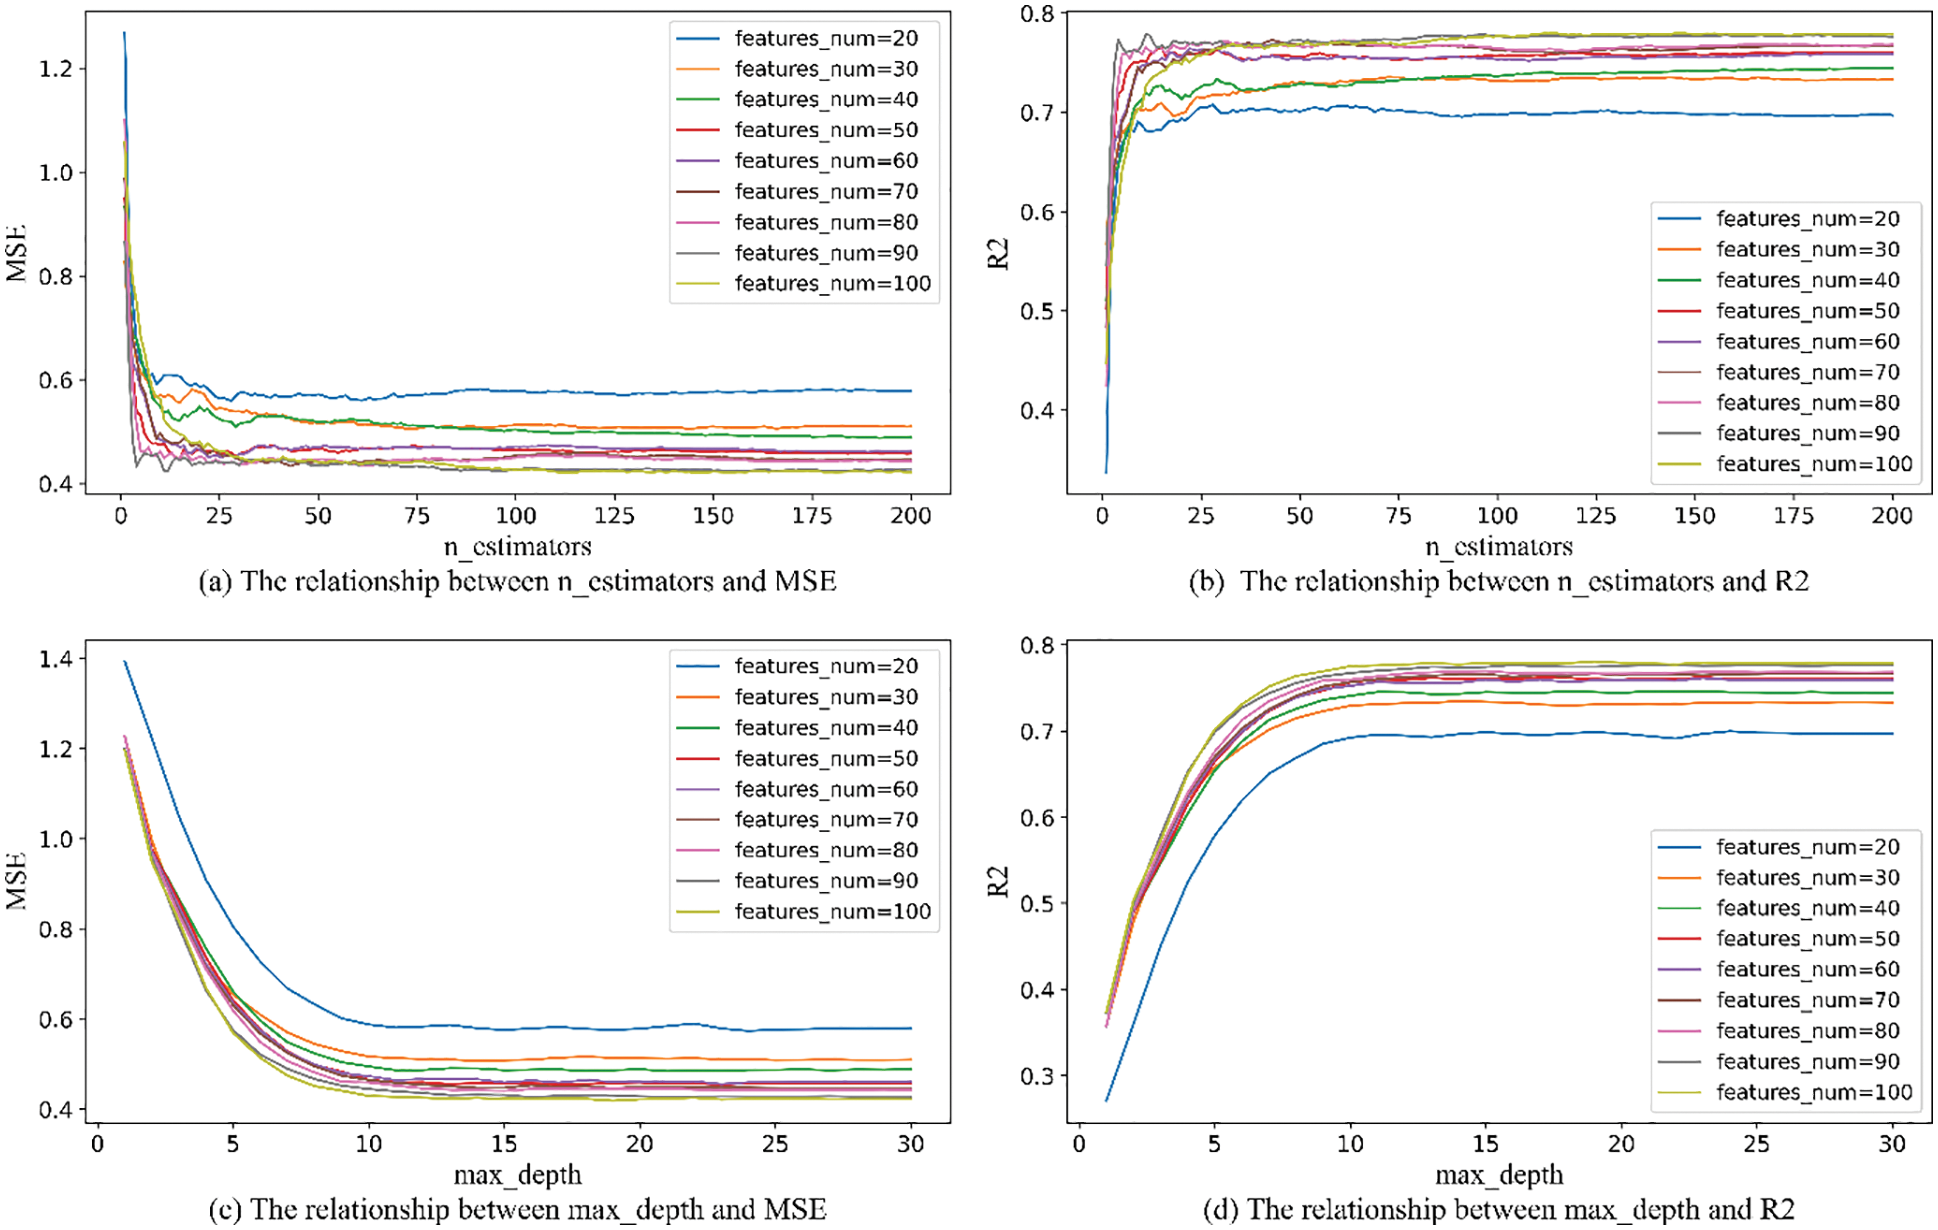
Figure 7: The relationship between the number of features_num and n_estimators and max_depth
This paper combines the ISSA with the RF algorithm to optimize the parameters of the RF model. First, the sparrow population is initialized. The the RF model is trained to calculate its fitness value. This paper sets the fitness function as the RMSE of RF model training and each iteration searches towards a position with a lower RMSE. Update the positions of discoverers, follower and alerters through the change of fitness value until the training termination condition is met. Finally, the ERα gene activity was predicted by the RF model with optimal parameters, and the model was tested by the validation set. The predicted model structures of the drug compound molecules that antagonize the activity of the ERα gene by the ISSA-RF model are shown in Fig. 8.
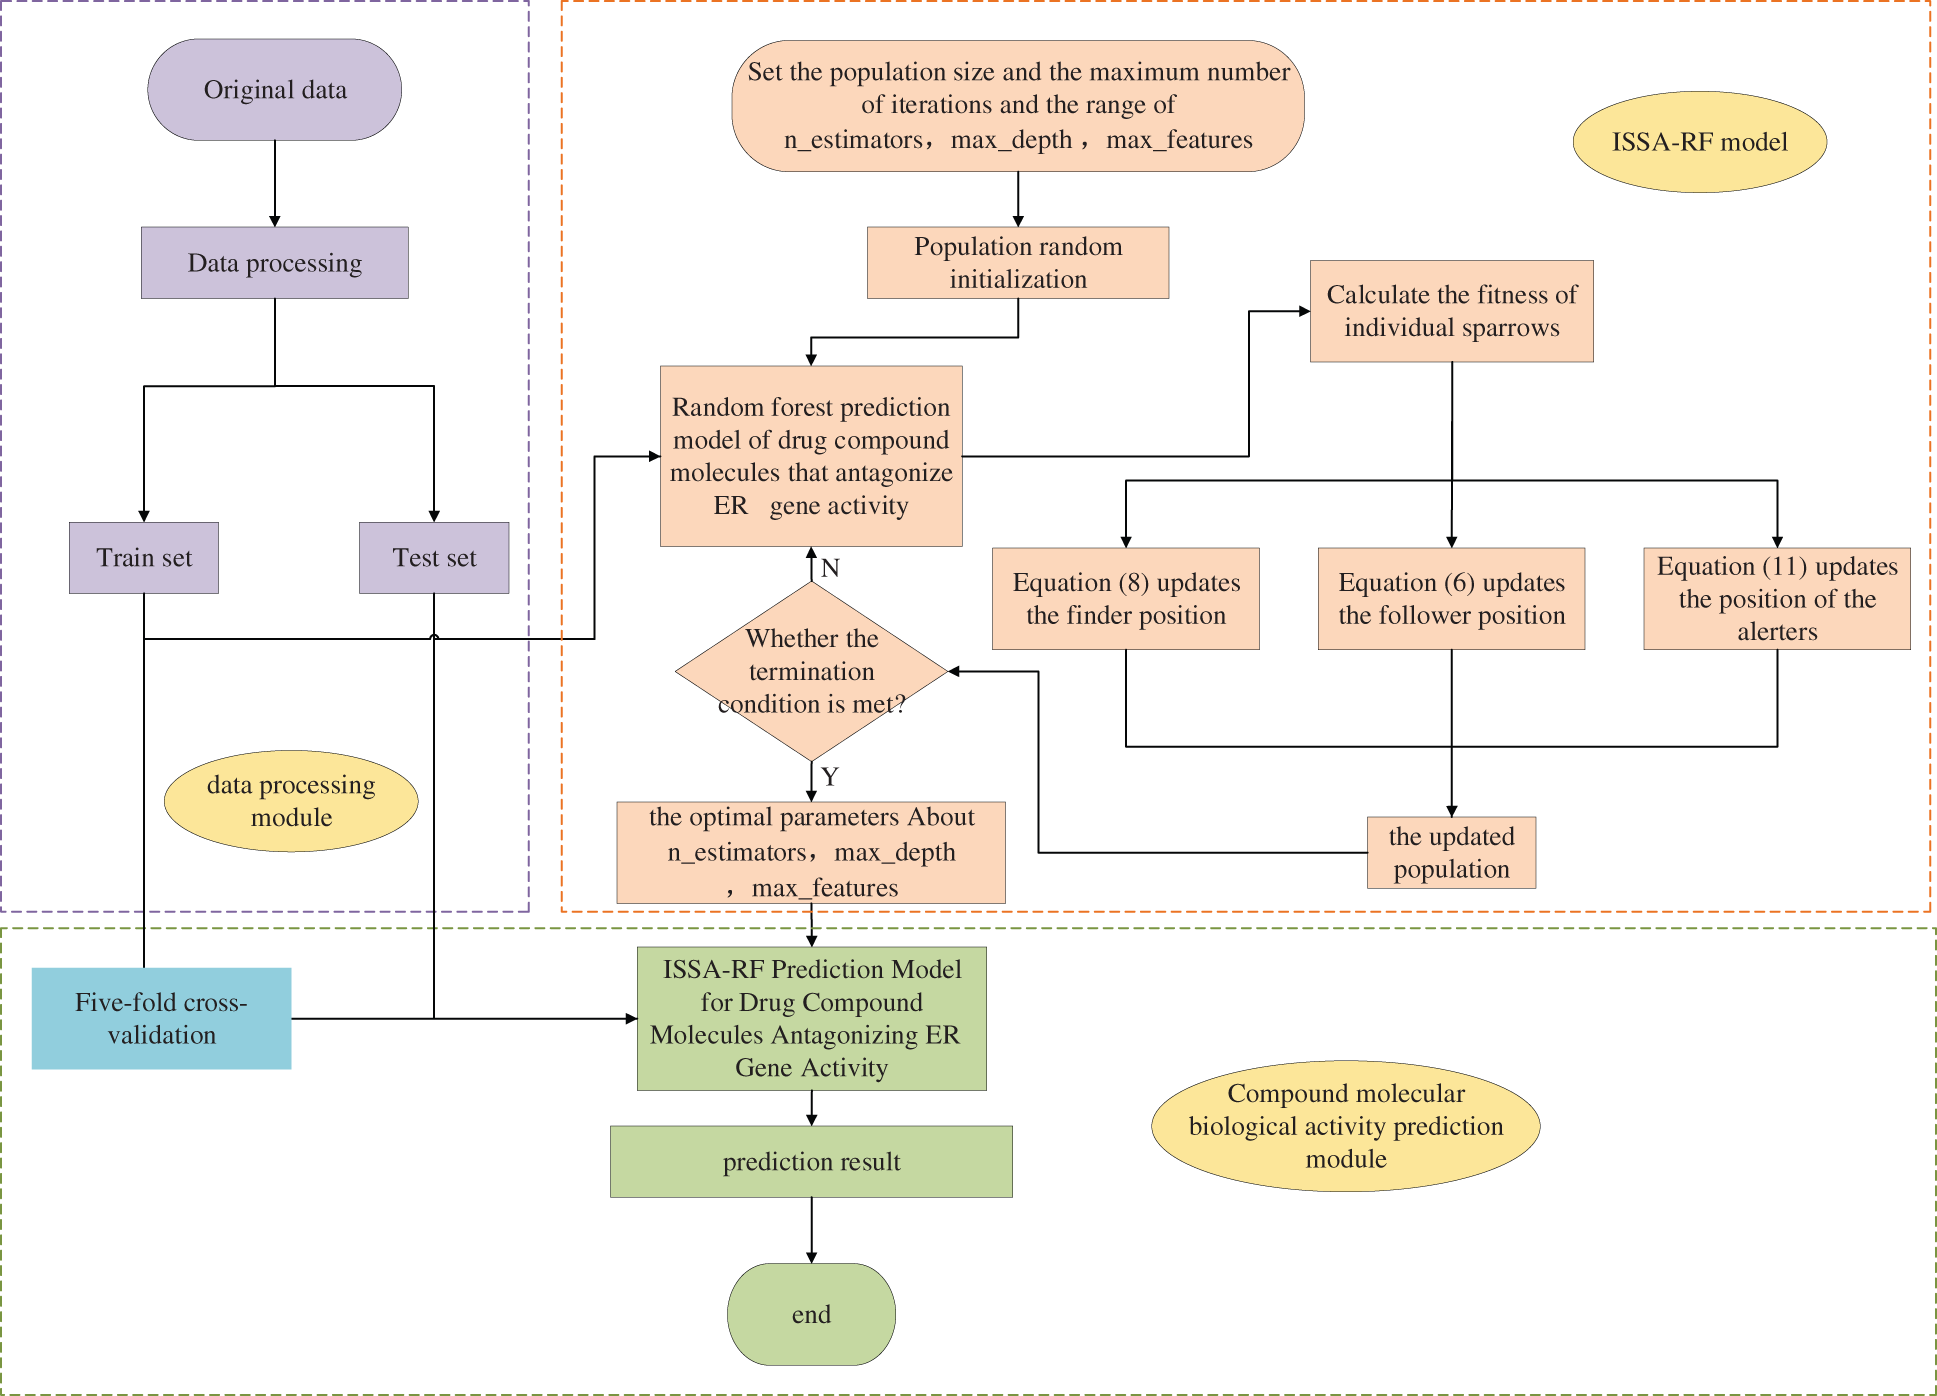
Figure 8: ISSA-RF model flowchart
In order to objectively evaluate the prediction effect of the established quantitative prediction model of biological activity, we introduce several model evaluation indicators to evaluate the accuracy of the model such as Mean Square Error (MSE), Mean Absolute Error (MAE), Mean Absolute Percentage Error (MAPE), Root Mean Square Error (RMSE), Coefficient of determination (
In the formula,
4.1 Results of ISSA-RF Predictions
In this paper, 85% of the data is used as Train set, 15% of the data is used as Test set, the random seed parameter random_state is 0, and a 5-fold cross-validation model is used with
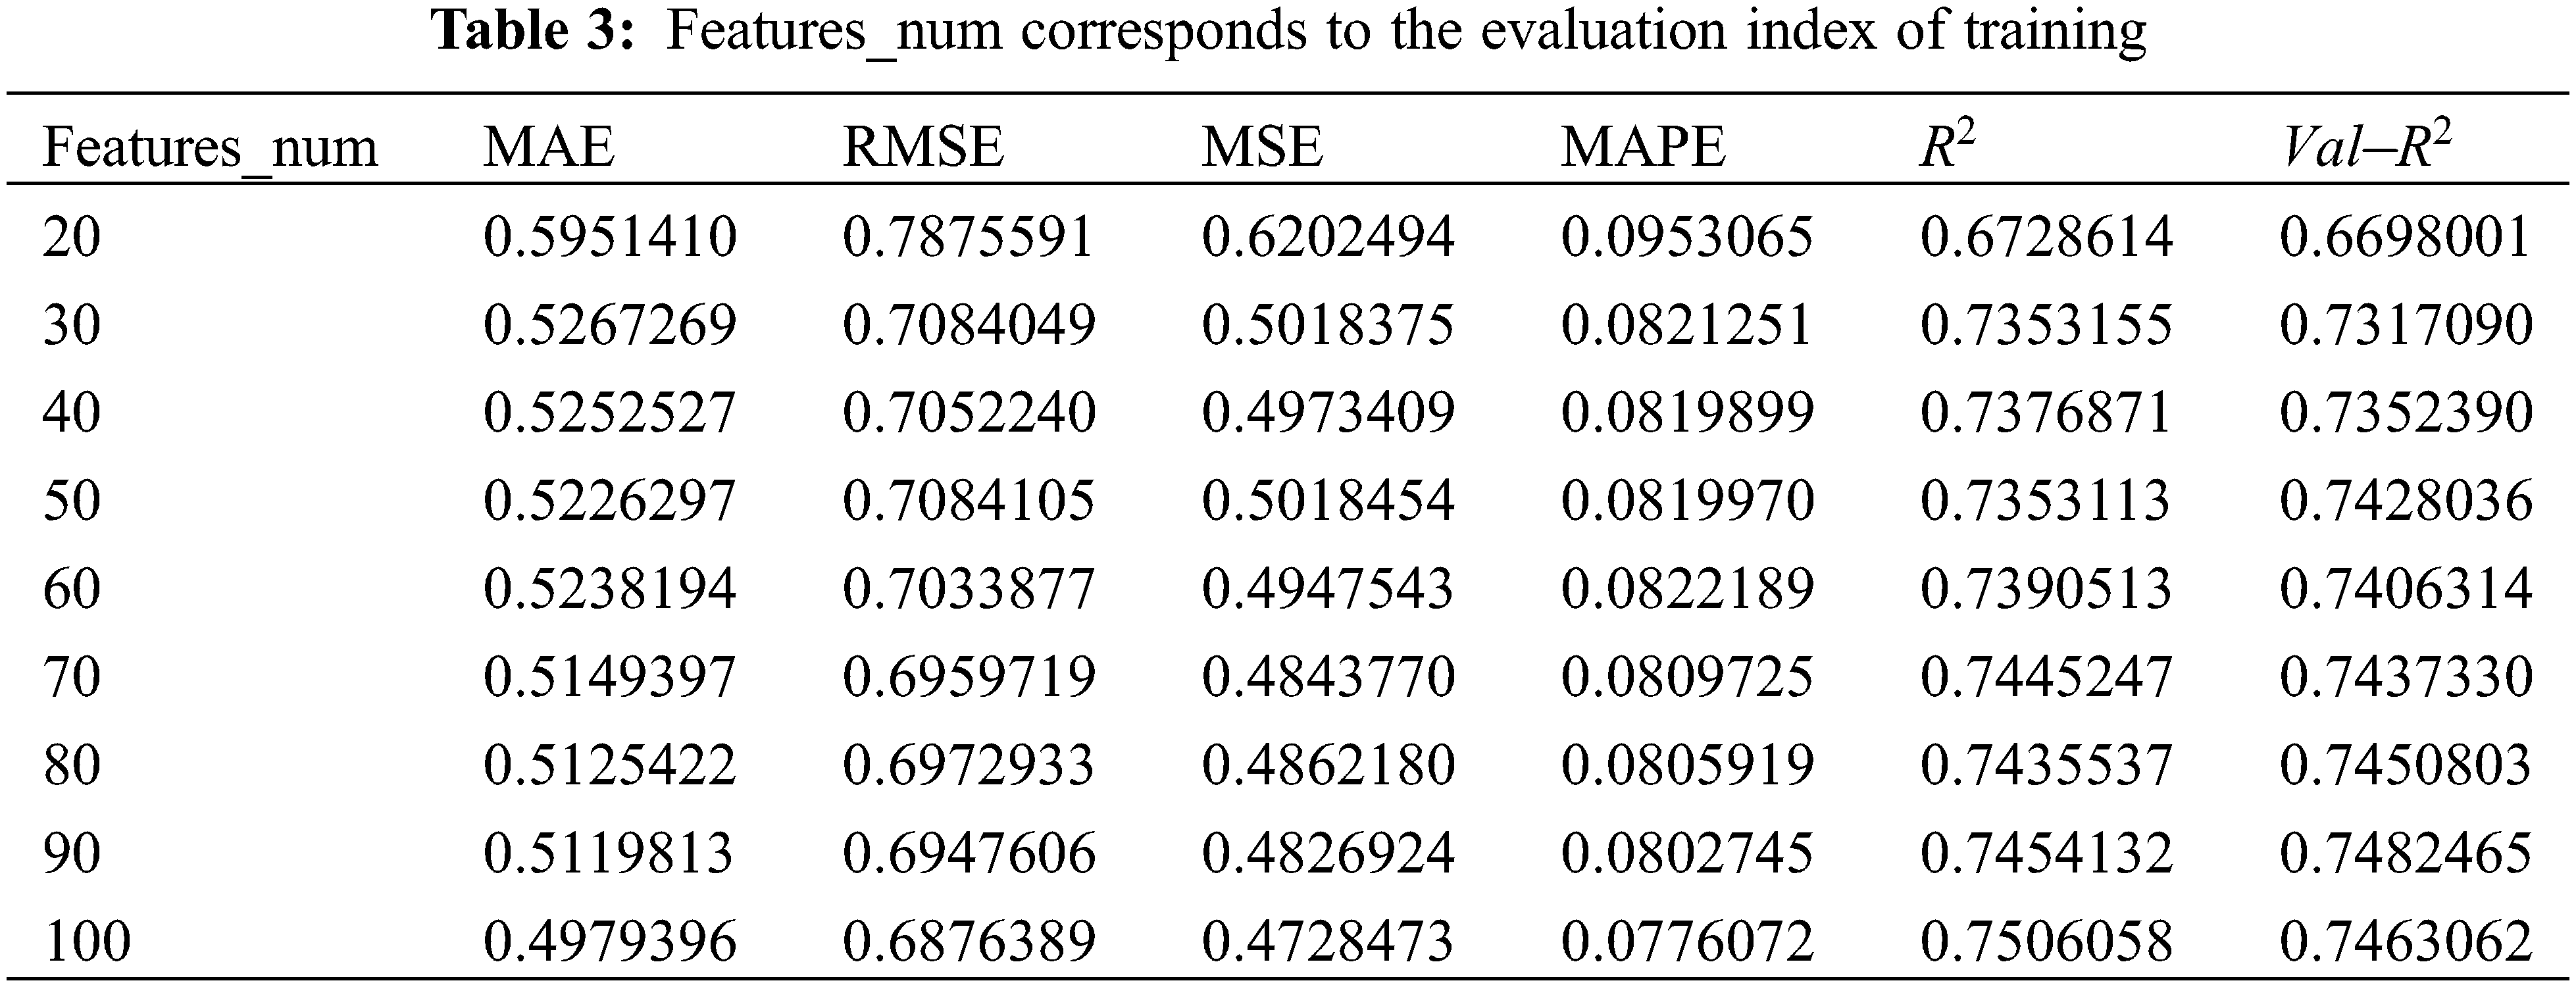
As can be seen from Fig. 9, when features_num is increased from 20 to 30, the overall prediction effect is significantly improved. After that, the overall prediction effect is slowly improved with the increase of features_num, but the improvement effect is not obvious, which means that the number of features will increase the performance of model within a specific range. prediction accuracy. When features_num = 100, the effect is the best that RMSE is 0.6876389 and
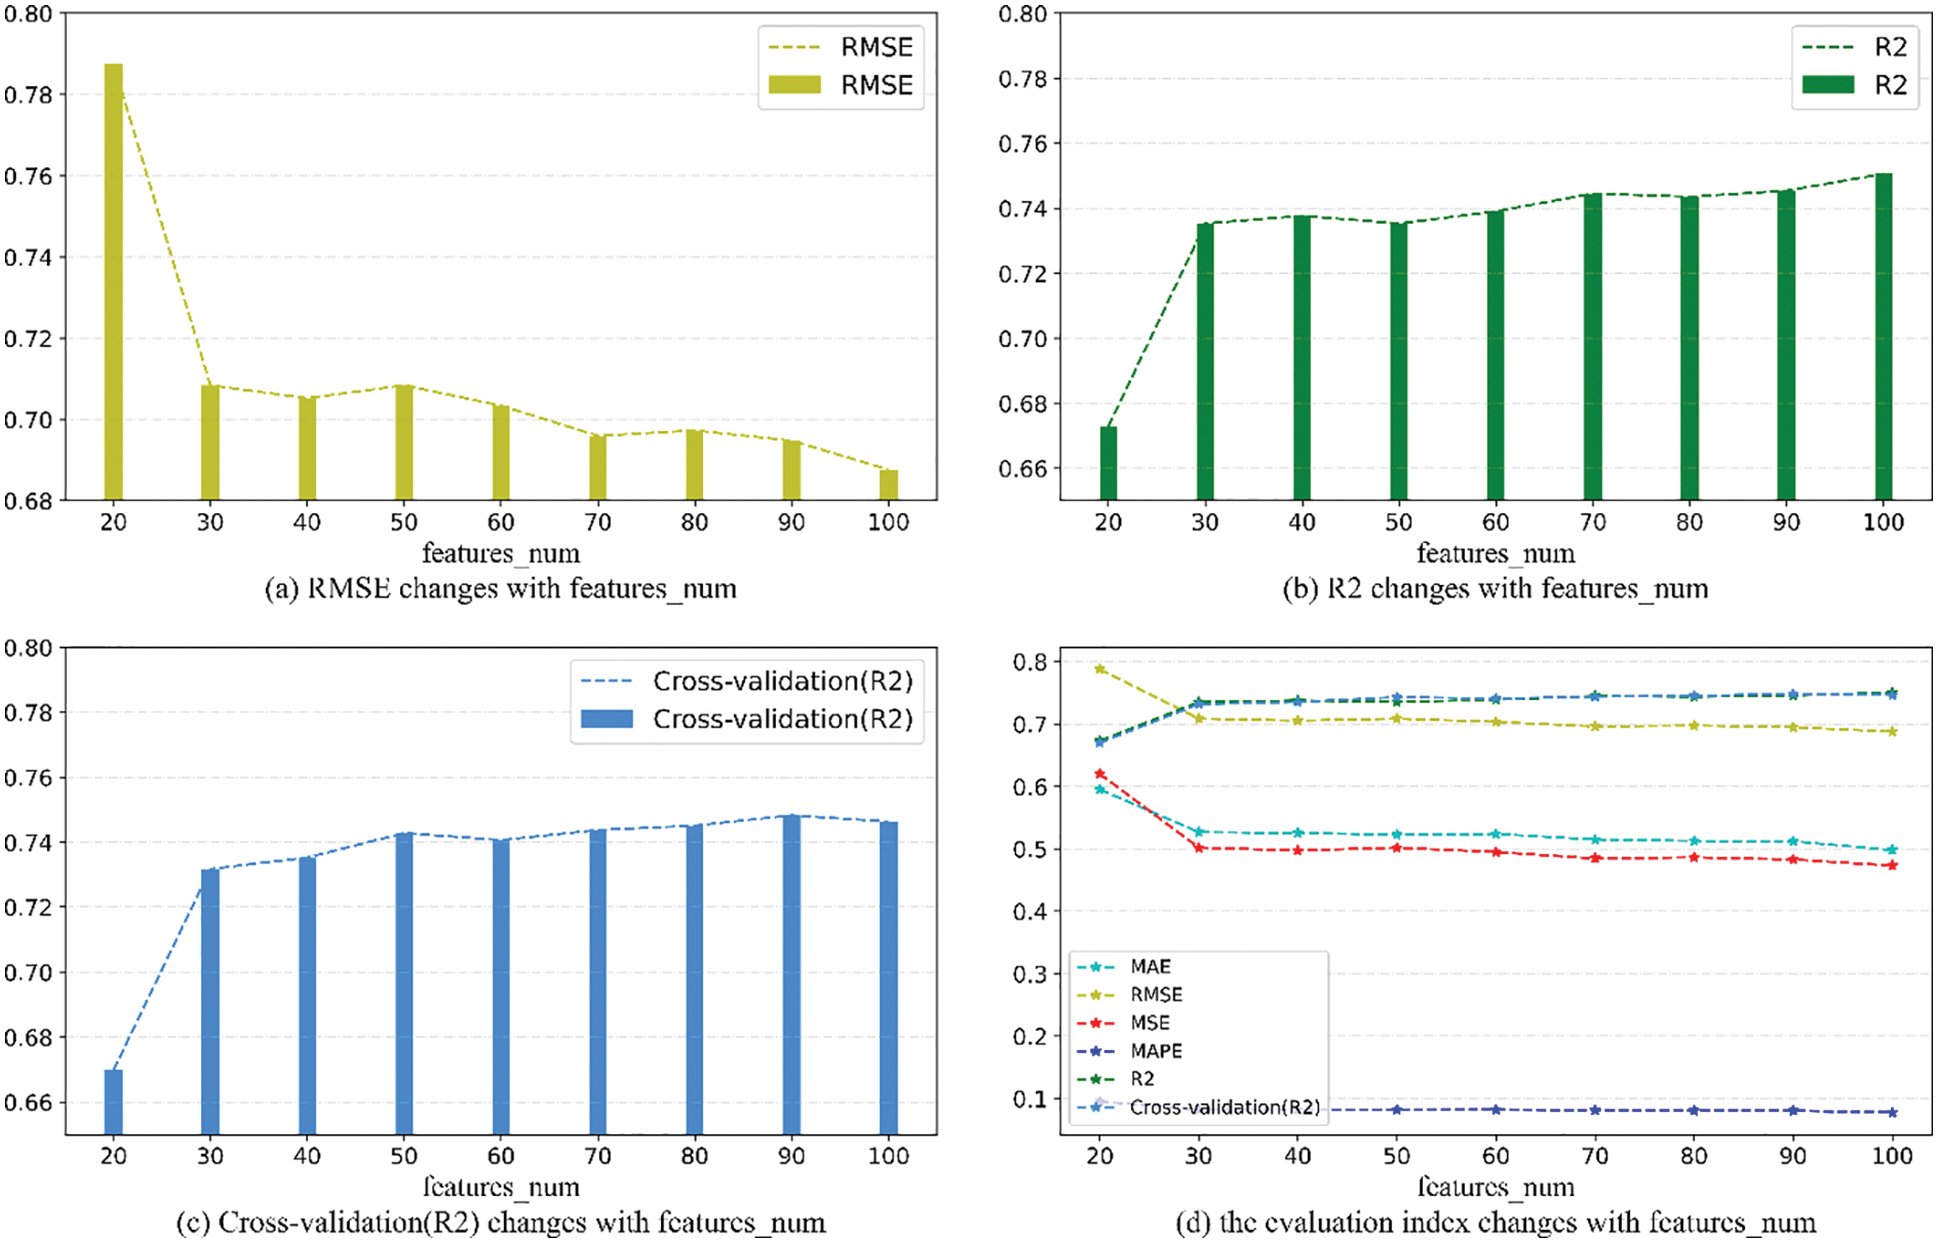
Figure 9: Evaluation metrics visualization
In order to verify the accuracy of the quantitative prediction model for ERα biological activity constructed by ISSA-RF model, GA_SVM, BP and XGBoost were introduced in this paper to predict the biological activity of ERα. Under the same experimental conditions, the three models are trained using the top 20, 50, and 100 molecular descriptors with a high degree of influence. The model evaluation is shown in Table 4. The comparison between the predicted results and the actual value results is shown in Fig. 10.
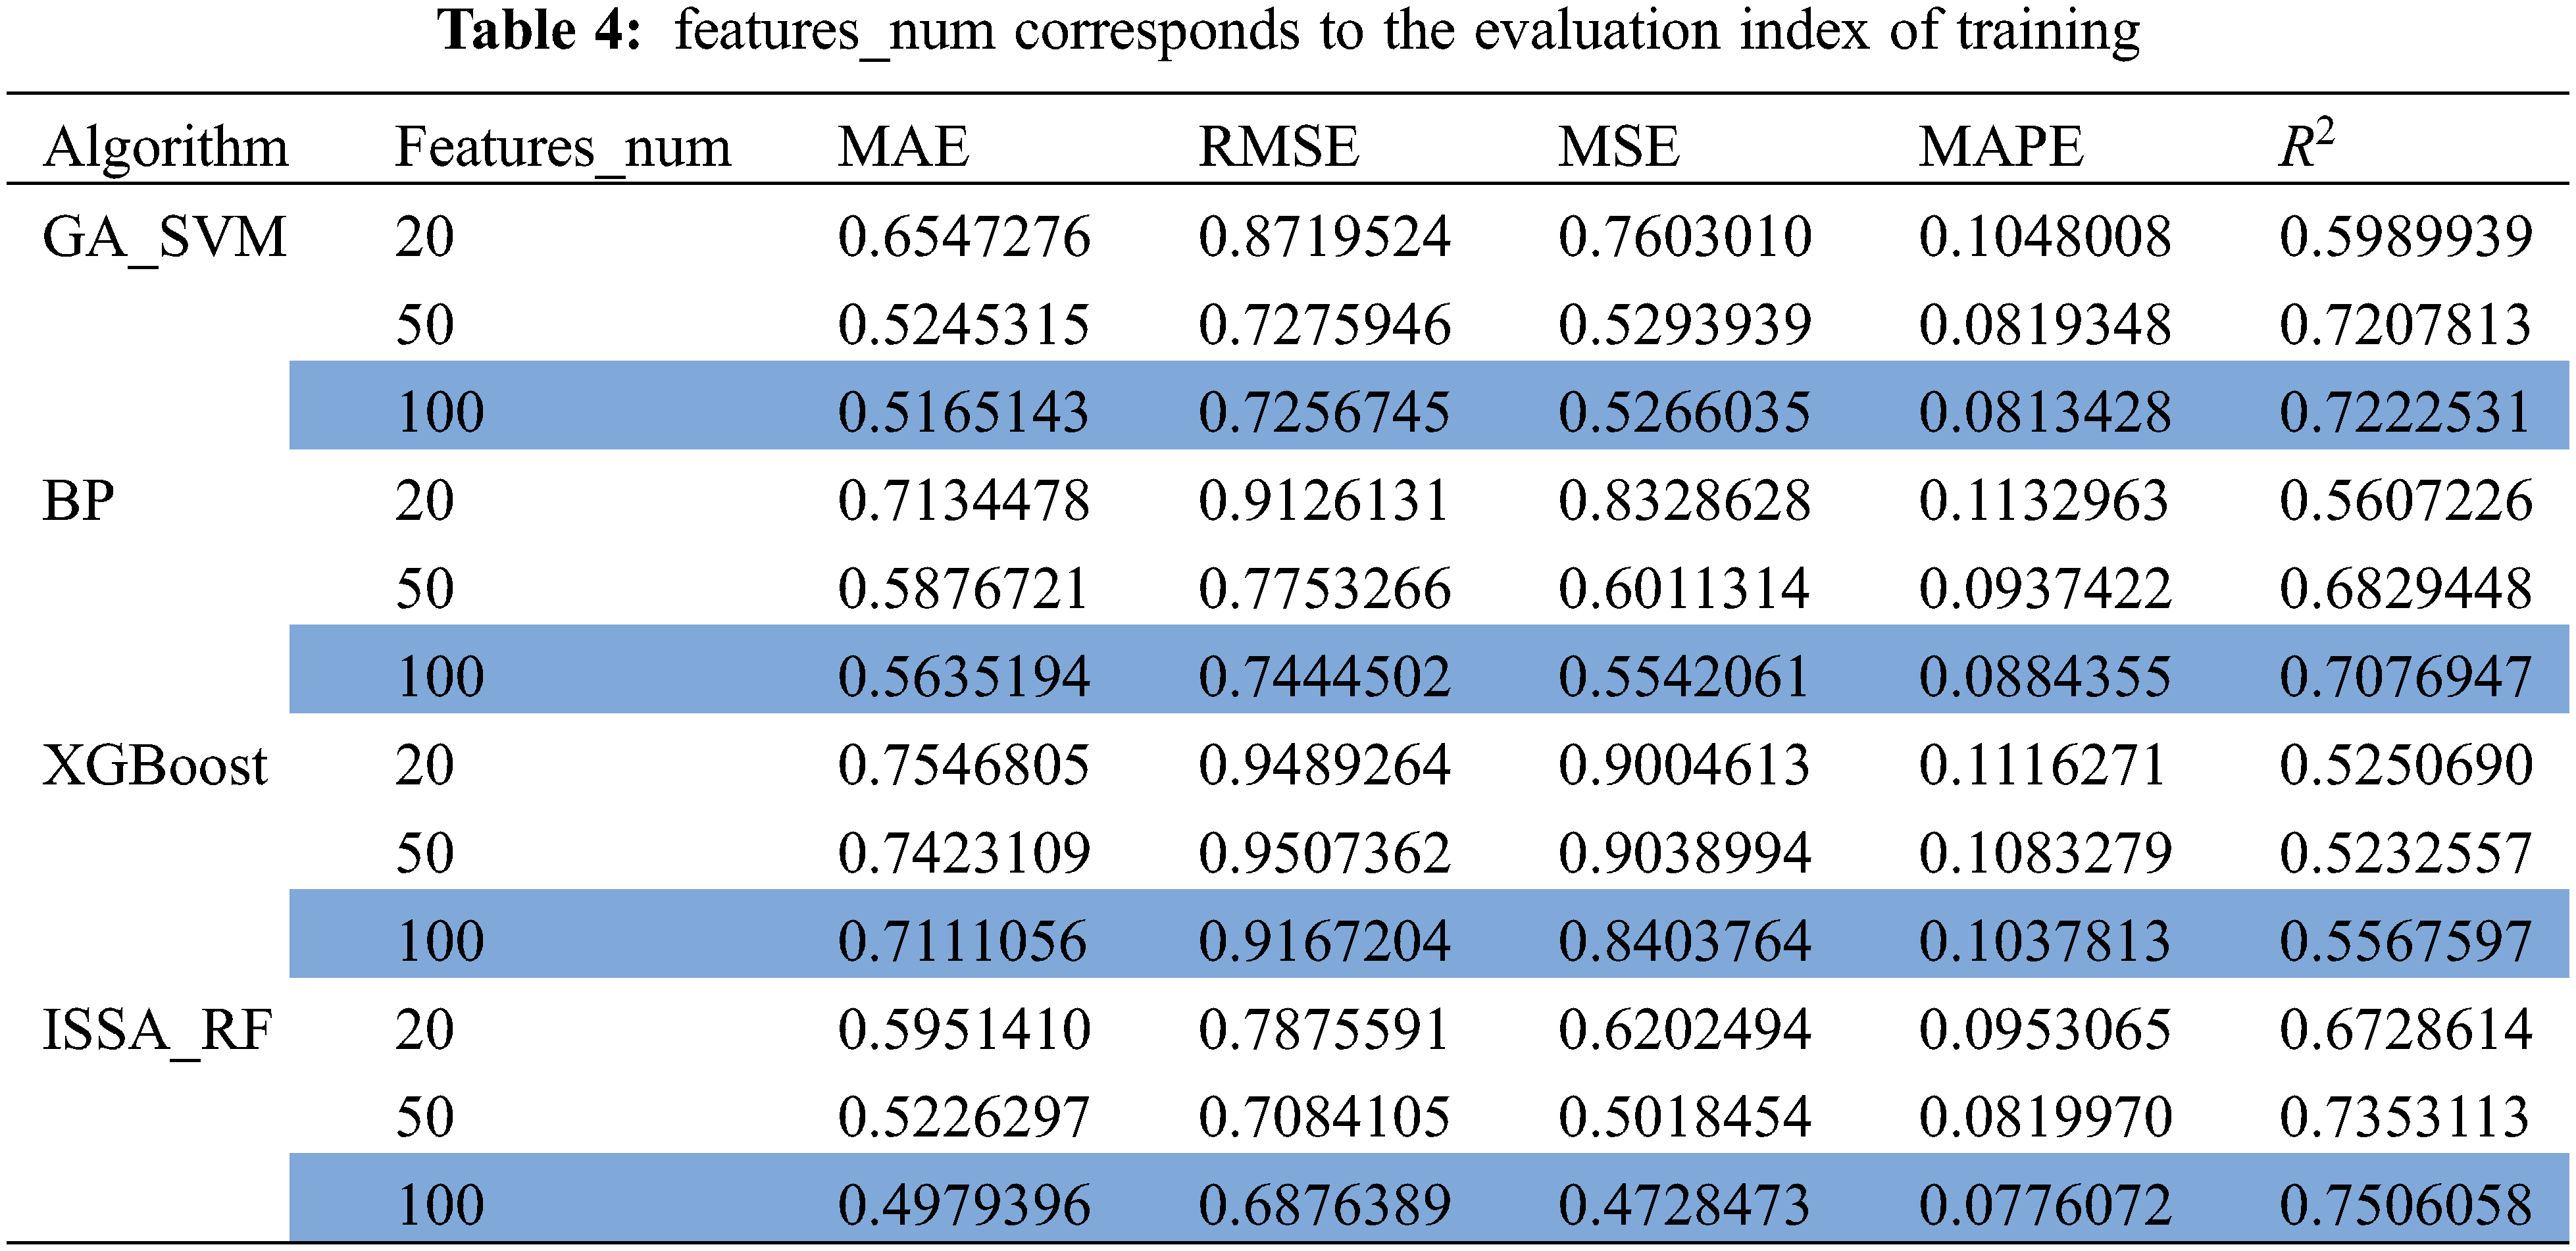
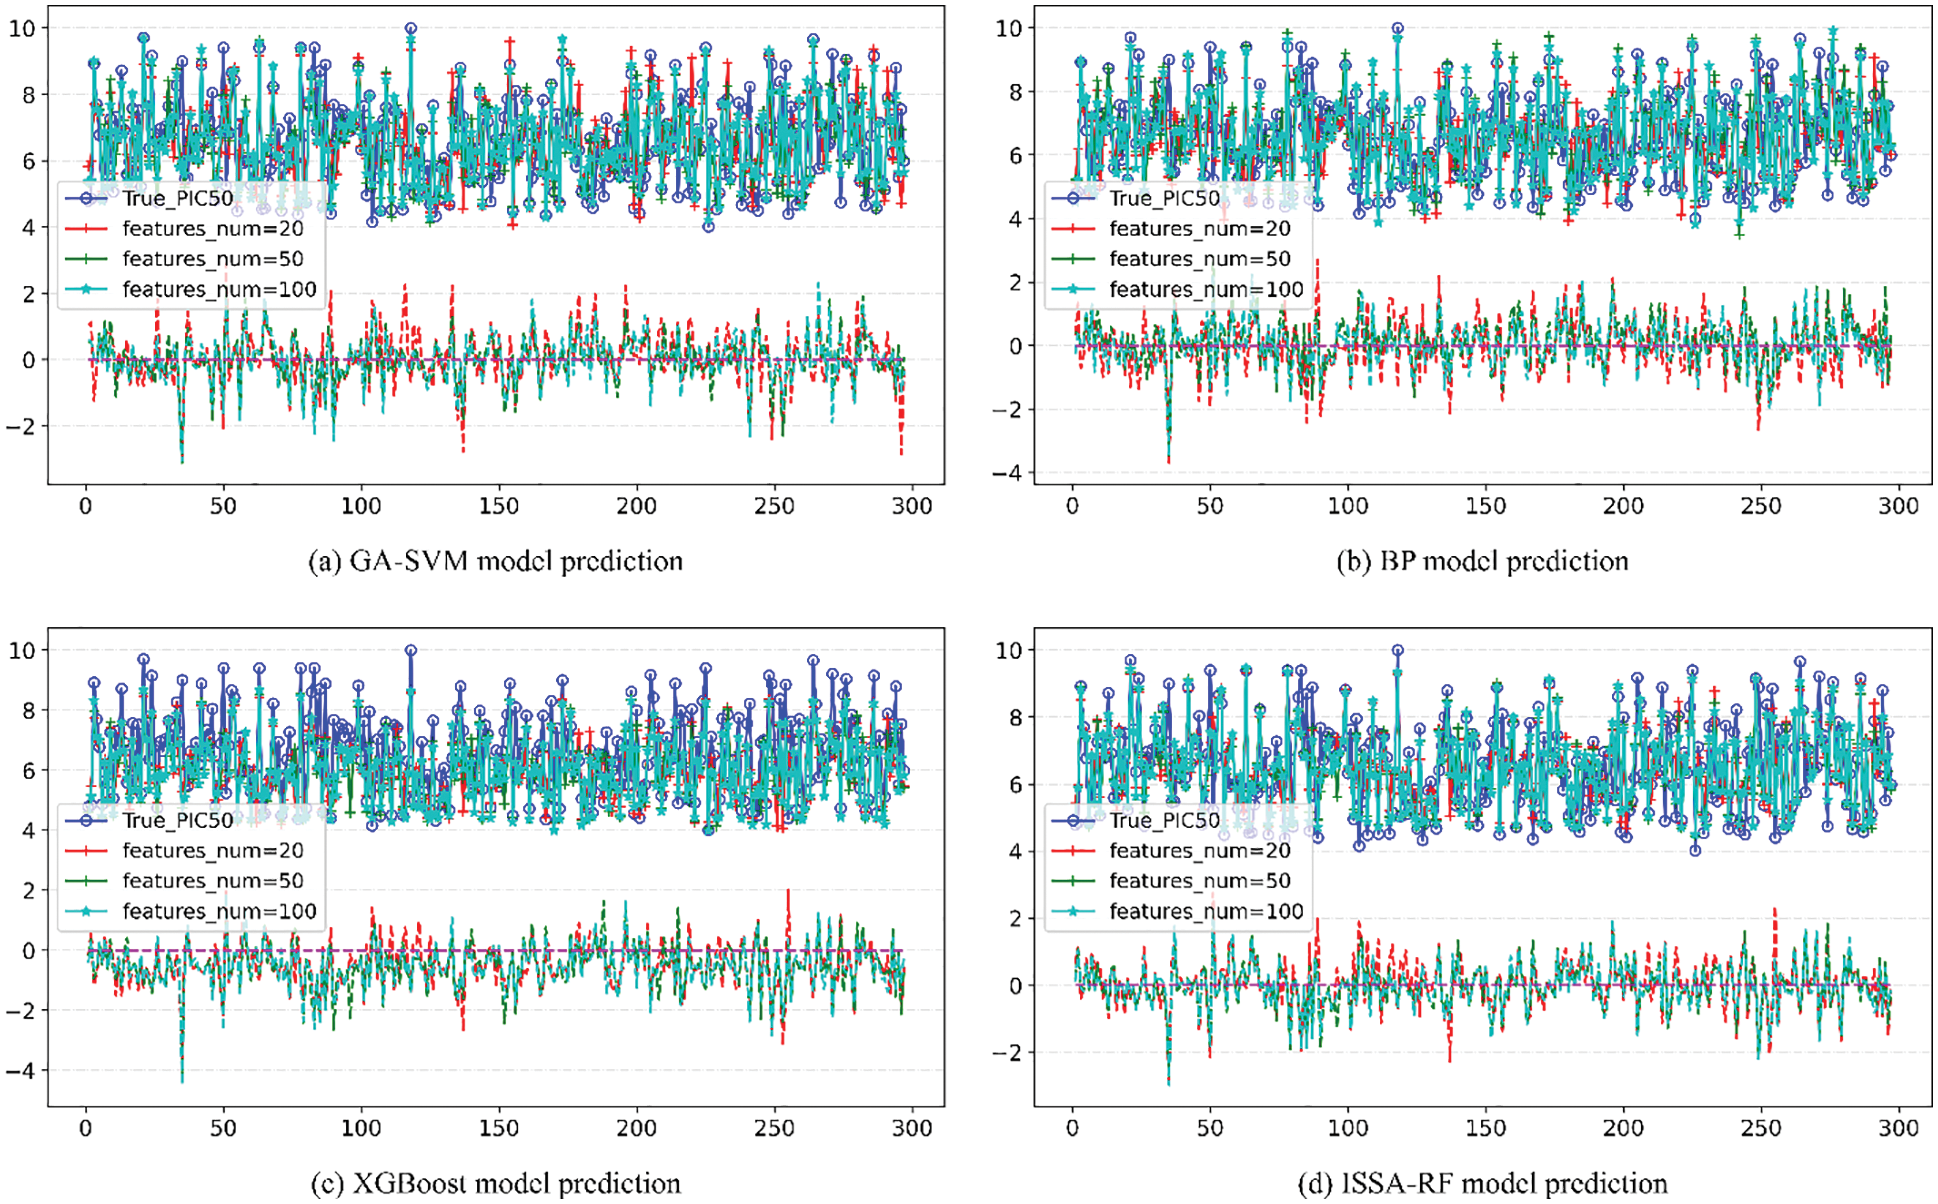
Figure 10: Comparison of pIC50 predicted value and true value of other models
The upper part of each image in Fig. 10 is the line of comparison between the predicted value and actual value of pIC50 of the model under different number of features, and the lower part is the difference between the predicted value and actual value of pIC50 of the model under different number of features Error line. According to the comparison figure, it can be seen that the predicted value of pIC50 of the model established by ISSA-RF algorithm is in good agreement with the actual value. After comparing the model evaluation results, it can be seen that different algorithm models achieve the best results when features_num = 100. The detail image when features = 100 is shown in Fig. 11. Under the same experimental conditions, the ISSA-RF model proposed in this paper
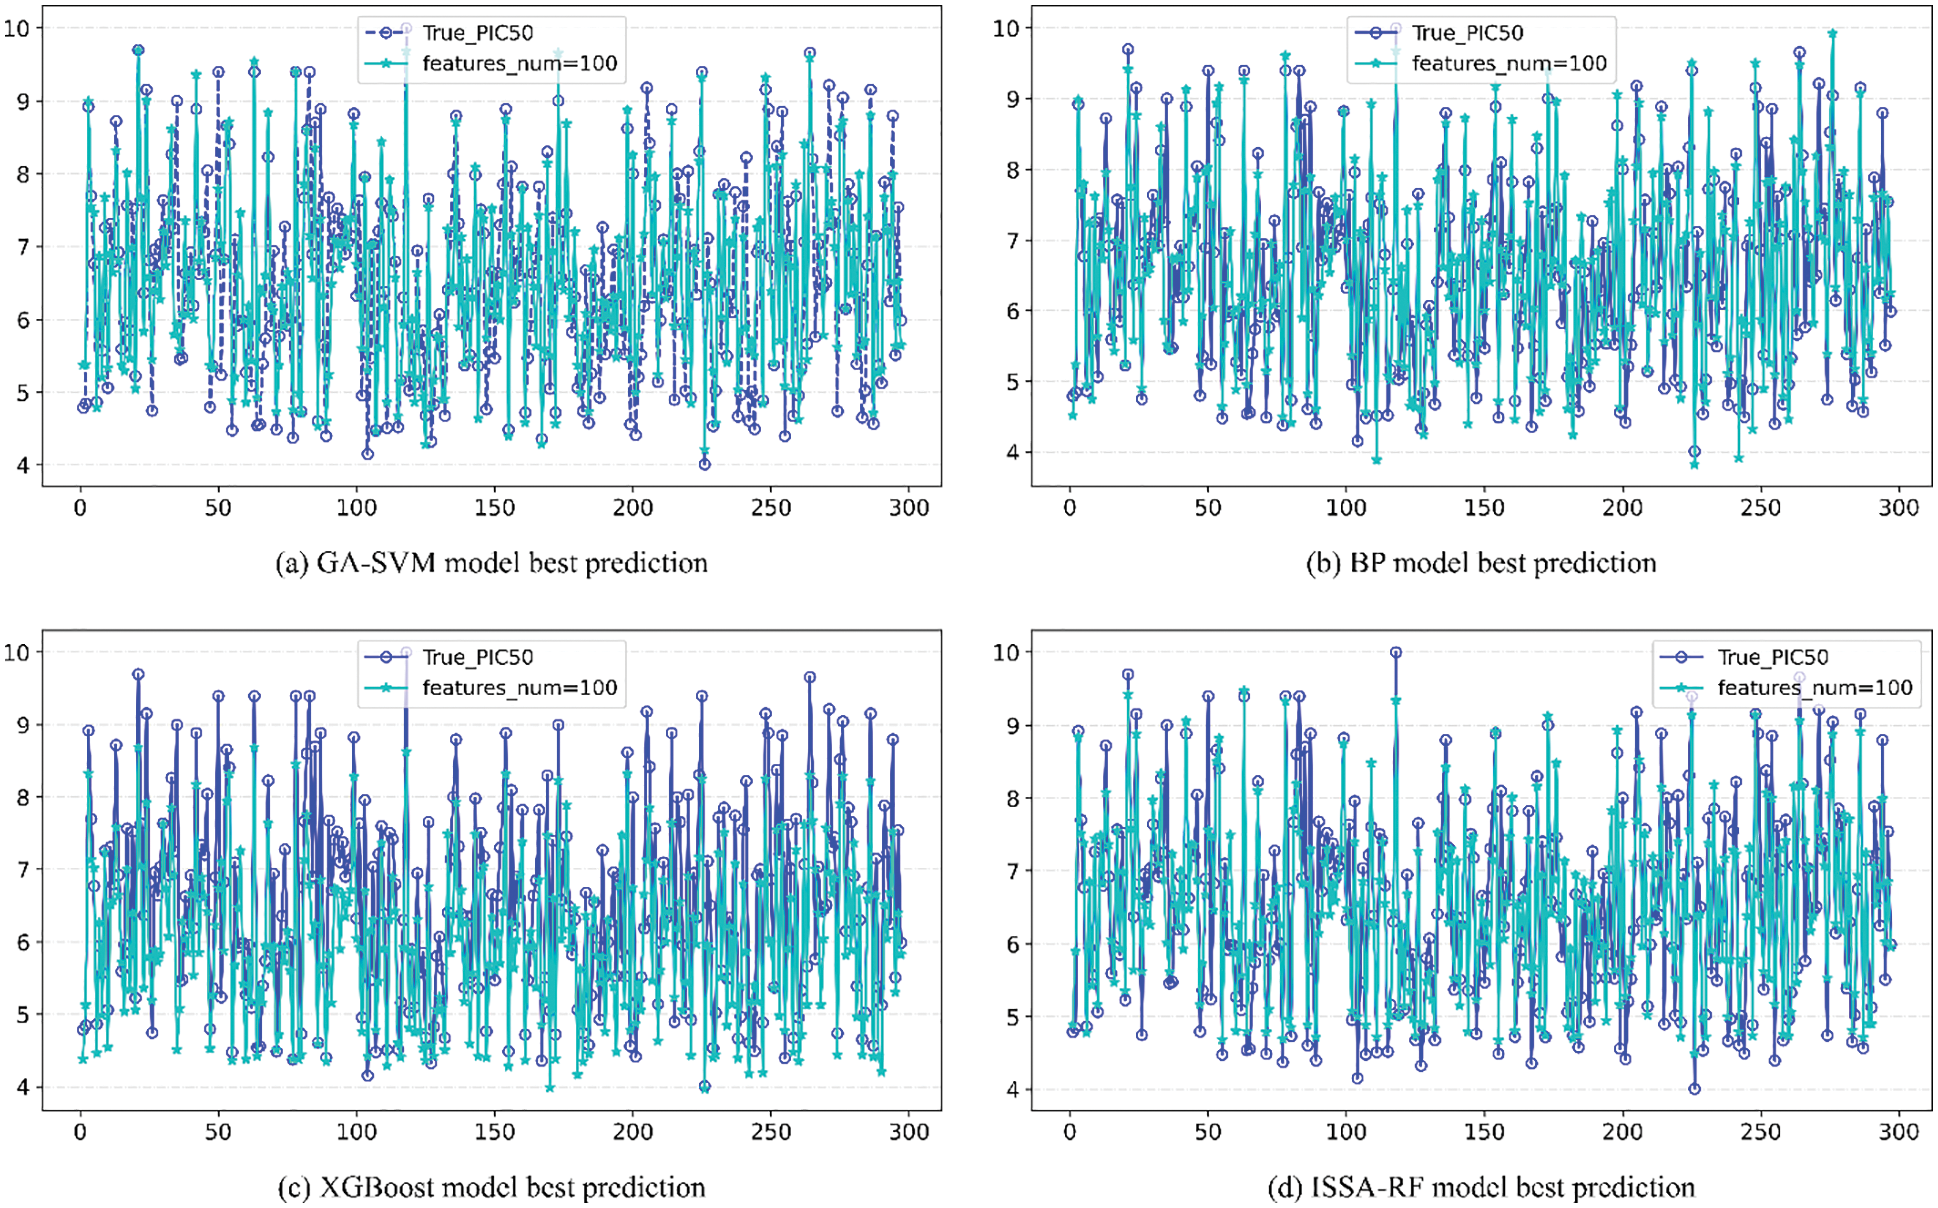
Figure 11: Comparison of the actual value and the predicted value under the optimal evaluation index
In the practice of selecting anti-breast cancer drug candidates, it is usually necessary to analyze the structure-activity relationship between compound activity data and compound molecular descriptors, and select compound molecules that satisfy biological activity as drug candidates. In this paper, a RF model optimized by the Improved Sparrow Search Algorithm (ISSA-RF) is proposed. We added an adaptive weight formula to the sparrow finder position update formula to optimize the search range and speed of sparrows in different stages, and proved that the SSA algorithm with adaptive weights has better fitness training accuracy on the Rosenbrock function than the ordinary SSA algorithm. This paper uses multi-scale molecular descriptors for model training to reduce the chance of model training accuracy caused by the number of different molecular descriptors. In addition, this paper limits the search range of ISSA-RF through RF separate training. The main purpose of this is to avoid the problem of the ISSA algorithm falling into local optimality. Secondly, this can also greatly reduce the search time of sparrows and improve the efficiency of model optimization. Finally, the prediction effect is compared with a variety of common models to verify the accuracy of the ISSA-RF model. The experimental results show that compared with other models, the ISSA-RF algorithm model proposed in this paper has a lower RMSE in the prediction of the biological activity of drug compounds on ERα, and can accurately predict the biological activity according to the molecular descriptors of the compounds, which improves the accuracy and efficiency of anti-breast cancer drug candidate screening. In addition, this model can not only be used to screen anti-breast cancer drug candidates, but also provides new ideas for constructing quantitative structure-activity relationship models of compounds.
Author Contributions: Minxi Rong, Xiaoli Guo contributed to the conception of the study; Yong Li performed the experiment and contributed significantly to manuscript preparation; Tao Zong, Zhiyuan Ma and Penglei Li helped perform the analysis with constructive discussions.
Ethics Approval and Informed Consent Statement: The datasets used in this article is a public data set from the DrugBank drug molecule database of the University of Alberta, and the data set is used as competition data in the China 2021 “Huawei Cup” Mathematical Modeling Competition, so the datasets do not involve Ethical Approval and Informed Consent Statement.
Availability of Data and Materials: The datasets used or analyzed during the current study have been posted to github website (https://github.com/Li519445444/candidate-drug-data-source/tree/master).
Acknowledgement: The authors thank the National Natural Science Foundation of China (11601491). Thanks to China’s 2021 “Huawei Cup” Mathematical Modeling Competition for offering the data.
Funding Statement: This research was supported by the National Natural Science Foundation of China (11601491).
Conflicts of Interest: The authors declare that they have no conflicts of interest to report regarding the present study.
1. Sohn, E. (2017). Environment: Hothouse of disease. Nature, 543(7647), S44–S46. DOI 10.1038/543S44a. [Google Scholar] [CrossRef]
2. Tan, L. L., Zhang, X. X., Zhou, Y. Z. (2021). Prediction of molecular biological activity based on graph convolution method of multi-characteristic fusion. Journal of University of Electronic Science and Technology of China, 50(6), 921–929. DOI 10.12178/1001-0548.2021158. [Google Scholar] [CrossRef]
3. Loibl, S., Poortmans, P., Morrow, M., Denkert, C., Curigliano, G. (2021). Breast cancer. The Lancet, 397, 1750–1769. DOI 10.1016/S0140-6736(20)32381-3. [Google Scholar] [CrossRef]
4. Cong, Y., Xue, Y. (2013). Quantitative structure-activity relationship study of the non-nucleoside inhibitors of HCV NS5B polymerase by machine learning methods. Acta Physico-Chimica Sinica, 29(8), 1639–1647. DOI 10.3866/PKU.WHXB201305171. [Google Scholar] [CrossRef]
5. Deo, R. C. (2015). Machine learning in medicine. Circulation, 132(20), 1920–1930. DOI 10.1161/CIRCULATIONAHA.115.001593. [Google Scholar] [CrossRef]
6. Jiang, D., Lei, T., Wang, Z., Shen, C., Cao, D. et al. (2020). ADMET evaluation in drug discovery. 20. Prediction of breast cancer resistance protein inhibition through machine learning. Journal of Cheminformatics, 12(1), 16. DOI 10.1186/s13321-020-00421-y. [Google Scholar] [CrossRef]
7. Che, H. X., Wang, T., Wang, W. (2021). Comparing prediction models for prostate cancer. Data Analysis and Knowledge Discovery, 5(9), 107–114. DOI 10.11925/infotech.2096-3467.2020.1185. [Google Scholar] [CrossRef]
8. Wang, H., Cui, W., Guo, Y., Du, Y., Zhou, Y. (2021). Identifying pathogens of foodborne diseases with machine learning. Data Analysis and Knowledge Discovery, 5(9), 54–62. DOI 10.11925/infotech.2096-3467.2020.1105. [Google Scholar] [CrossRef]
9. Lu, W., Xue, Y., Meng, Q. W. (2013). Classification prediction of inhibitors of H1N1 neuraminidase by machine learning methods. Acta Physico-Chimica Sinica, 29(1). DOI 10.3866/PKU.WHXB201211122. [Google Scholar] [CrossRef]
10. Sheridan, R. P., Wang, W. M., Liaw, A., Ma, J., Gifford, E. M. (2016). Extreme gradient boosting as a method for quantitative structure-activity relationships. Journal of Chemical Information and Modeling, 56(12), 2353–2360. DOI 10.1021/acs.jcim.6b00591. [Google Scholar] [CrossRef]
11. Mansouri, K., Cariello, N. F., Korotcov, A., Tkachenko, V., Grulke, C. M. et al. (2019). Open-source QSAR models for pKa prediction using multiple machine learning approaches. Journal of Cheminformatics, 11(1), 294. DOI 10.1186/s13321-019-0384-1. [Google Scholar] [CrossRef]
12. Ding, L., Zhang, X. Y., Wu, D. Y., Liu, M. L. (2021). Application of an extreme learning machine network with particle swarm optimization in syndrome classification of primary liver cancer. Journal of Integrative Medicine, 19(5), 395–407. DOI 10.1016/j.joim.2021.08.001. [Google Scholar] [CrossRef]
13. Zhou, C. M., Xue, Q., Liu, P. M., Duan, W., Wang, Y. et al. (2021). Construction of a predictive model of post-intubation hypotension in critically ill patients using multiple machine learning classifiers. Journal of Clinical Anesthesia, 72, 110279. DOI 10.1016/j.jclinane.2021.110279. [Google Scholar] [CrossRef]
14. Luo, Y., Song, Y. L., Shang, J. L., Wang, L. (2019). Prediction of PI3K inhibitors based on naive bayesian machine learning. Chinese Journal of New Drugs, 28(1), 73–80. [Google Scholar]
15. Zheng, X. Z., Li, M. H., Zhang, Y. N., Jiang, P., Wang, B. Y. (2021). Research on the prediction model of coal spontaneous combustion temperature based on randem forest algorithm. Industry and Mine Automation, 47(5), 58–64. DOI 10.13272/j.issn.1671-251x.17700. [Google Scholar] [CrossRef]
16. Xu, M. X., Zheng, Y., Li, Y. J., Wu, W. H. (2022). Prediction of properties of anti-breast cancer drugs based on PSO-BP neural network and PSO-SVM. Journal of Nanjing University of Information Science & Technology, 1–20. [Google Scholar]
17. Vilma, S. (2021). Interpretability of selected variables and performance comparison of variable selection methods in a polyethylene and polypropylene NIR classification task. Spectrochimica Acta Part A: Molecular and Biomolecular Spectroscopy, 258(8), 119850. DOI 10.1016/J.SAA.2021.119850. [Google Scholar] [CrossRef]
18. Tibshirani, R. (1996). Regression shrinkage and selection via the lasso. Journal of the Royal Statistical Society: Series B (Methodological), 58(1), 267–288. DOI 10.1111/j.2517-6161.1996.tb02080.x. [Google Scholar] [CrossRef]
19. Bonsignore, M., Trusso, S., de Pasquale, C., Ferlazzo, G., Allegra, A. et al. (2021). A multivariate analysis of Multiple Myeloma subtype plasma cells. Spectrochimica Acta Part A: Molecular and Biomolecular Spectroscopy, 258(9686), 119813. DOI 10.1016/j.saa.2021.119813. [Google Scholar] [CrossRef]
20. Xue, J. K., Shen, B. (2020). A novel swarm intelligence optimization approach: Sparrow search algorithm. Systems Science & Control Engineering, 8(1), 22–34. DOI 10.1080/21642583.2019.1708830. [Google Scholar] [CrossRef]
21. Breiman, L. (2001). Random forests. Machine Learning, 45(1), 5–32. DOI 10.1023/A:1010933404324. [Google Scholar] [CrossRef]
 | This work is licensed under a Creative Commons Attribution 4.0 International License, which permits unrestricted use, distribution, and reproduction in any medium, provided the original work is properly cited. |