DOI:10.32604/phyton.2021.012928
| Phyton-International Journal of Experimental Botany DOI:10.32604/phyton.2021.012928 | |
| Article |
Dynamic Expression Analysis and Introgressive Gene Identification of Fiber Length Using Chromosome Segment Substitution Lines from G. hirsutum × G. barbadense
1School of Biotechnology and Food Engineering, Anyang Institute of Technology, Anyang, 455000, China
2Innovation and Practice Base for Postdoctors, Anyang Institute of Technology, Anyang, 455000, China
3State Key Laboratory of Cotton Biology, Key Laboratory of Biological and Genetic Breeding of Cotton, The Ministry of Agriculture, Institute of Cotton Research, Chinese Academy of Agricultural Sciences, Anyang, 455000, China
*Corresponding Author: Pengtao Li. Email: lipengtao1056@126.com
#These authors made equal contributions
Received: 17 July 2020; Accepted: 20 September 2020
Abstract: Fiber length is a critical trait that principally determines cotton spinning quality, while Upland cotton as the most widely cultivated Gossypium species around the world subjects to the relatively ordinary fiber performance. Chromosome segment substitution lines (CSSLs) have been introduced in cotton breeding to take full advantages of superior fiber quality and high yield from Sea Island and Upland cotton, respectively, which serve as ideal materials for elucidating the genetic mechanism of complex quantitative traits. Here, three CSSLs derived from CCRI45 (G. hirsutum) × Hai1 (G. barbadense), two superior (MBI7561 and MBI7747) and one (MBI7285) with ordinary fiber-quality, were subjected to transcriptome sequencing during fiber elongation together with their recurrent parent CCRI45, and 471.425 million clean reads were obtained with 91.47% average Q30 and 45.23% mean GC content. In total, 5,673 differentially expressed genes (DEGs) were identified from multi-sample comparisons, which were mainly involved in the oxidation-reduction process, protein phosphorylation, regulation of transcription, DNA template, and carbohydrate metabolic process. Eight temporal expression patterns were monitored on the DEGs of different lines, of which the significantly enriched profile revealed higher similarities between two superior CSSLs or the ordinary CSSL and CCRI45 with respect to fiber performance. Based on the intersection between the predicted introgressive genes from RNA-seq data and the published gene information from the G. barbadense genome, 1,535 introgressive genes were identified in three CSSLs. Further analysis of the three common introgressive sections in superior CSSLs revealed eight candidate genes that were identified to be involved in fiber development, namely, O-fucosyltransferase family protein (GB_A02G0240), glutamine synthetase 2 (GB_A02G0272), Ankyrin repeat family protein (GB_A02G0264), beta-6 tubulin (GB_D03G1742), WRKY DNA-binding protein 2 (GB_D03G1655), quinolinate synthase (GB_D07G0623), nuclear factor Y, subunit B13 (GB_D07G0631), and leucine-rich repeat transmembrane protein kinase (GB_D07G0797). Our results provide novel insights into the mechanism underlying fiber formation and lay a solid foundation for further high-efficiency determination of candidate genes by combining RNA-seq data and pivotal chromosome regions.
Keywords: Gossypium hirsutum; Gossypium barbadense; chromosome segment substitution lines; RNA-seq; fiber length
 | This work is licensed under a Creative Commons Attribution 4.0 International License, which permits unrestricted use, distribution, and reproduction in any medium, provided the original work is properly cited. |
Cotton (Gossypium spp.) is an important commercial crop worldwide, providing natural fibers for the global textile industry [1]. However, the increase in the size of the human population combined with diminishing arable land has prompted cotton breeders and researchers to pursue cotton varieties with higher fiber yield and better fiber quality. G. hirsutum and G. barbadense contribute to more than 95% of fiber production annually, of which the former has the advantages of high productivity and wide adaptability with moderate fiber quality, whereas the latter possesses traits of excellent fiber performance and low production [2]. Hence, it may be useful to combine the superior traits of Upland and Sea Island cotton species to generate high-yield and fine fiber-quality varieties using chromosome segment substitution lines (CSSLs). Owing to reducing the interference of complex genetic backgrounds in populations, CSSLs are appropriate for fine mapping significant genes that regulate complex and variable phenotypes or traits, particularly quantitative traits with relatively small genetic effects [3], which have been widely applied to quantitative trait locus (QTL) mapping for yield, quality, stress tolerance, and disease resistance in commercial crops [4–8].
Cotton fibers are trichomes that are formed by ovule epidermal single cells and serve as an ideal model for elucidating the mechanism underlying fiber elongation, cell wall formation, and cellulose synthesis [9]. The fiber development process is composed of four independent but overlapping periods: initiation (−3 to 3 days post anthesis, DPA), elongation (3 to 23 DPA), secondary cell wall synthesis (16 to 40 DPA), and maturation (40 to 50 DPA), which collectively determine cotton yield and fiber quality [10]. However, any unusual events that occur during the aforementioned periods would significantly affect fiber formation, ultimately resulting in diverse changes in related traits, specifically boll weight, ginning outturn, fiber length, strength, micronaire, elongation, and uniformity [11].
The completion of genome sequencing of tetraploid cotton species has improved our understanding of Gossypium polyploidy properties and has also built a solid foundation for further investigation of fiber formation [12–15]. The concomitant development of RNA-seq (also known as transcriptome sequencing) technology has facilitated studies on the expression patterns and transcriptional regulation of functional genes derived from specific tissues or cells, thereby allowing elucidation of the molecular mechanism of various biological processes and, in turn, has been broadly adopted to study cotton fiber development [16–18]. Numerous RNA-seq studies on fiber development with different materials indicated that this complicated biological process is regulated by cellulose synthase, drought stress, artificial breeding, pigment synthesis, and oxidation-reduction processes [19–23]. However, despite multiple attempts to define the fiber formation mechanism, the finer details of this particular process remain unclear.
Based on multi-year and multi-environment trait surveys of a BC4F3:5 CSSL population from G. hirsutum CCRI45 and G. barbadense Hai1, two superior CSSLs, namely, MBI7561 and MBI7747, and ordinary fiber-quality CSSL MBI7285 were chosen in this study for transcriptome sequencing on fiber samples collected from 5 DPA to 20 DPA together with their recurrent parent CCRI45. By concentrating on the identification of differentially expressed genes (DEGs) and introgressive genes, this study not only screened significant DEGs or vital signaling pathways relevant to fiber development but also detected some candidate introgressive genes regulating fiber elongation, which will contribute to the elucidation of the molecular mechanism of fiber formation.
In 2014, three CSSLs (MBI7561, MBI7747, and MBI7285) and their parents (CCRI45 and Hai1) were planted in the experimental bases of Institute of Cotton Research of Chinese Academy of Agricultural Sciences (CRICAAS) and subjected to trait tests for cotton yield and fiber quality. RNA-seq was conducted on elongation-stage fibers sampled at 5, 7, 10, 15, and 20 DPA. On the day of anthesis, flowers were tagged for three continuous days with three different color cards. Normally, 2–5 bolls per line were harvested with gloves at 10:00 AM and were immediately placed in an ice box. Fiber samples were stripped from bolls and frozen in liquid nitrogen and then stored in a −80°C refrigerator.
2.2 RNA Extraction, Library Construction, and Sequencing
An RNAprep Pure Plant Kit (Tiangen, Beijing, China) was used in RNA extraction from the frozen fiber samples, and the total RNAs were subjected to RNA degradation and contamination assessment by 1% agarose gel electrophoresis, RNA integrity detection by the RNA Nano 6000 Assay Kit of the Bioanalyzer 2100 system (Agilent Technologies, CA, USA), and RNA concentration measurement by a Qubit 2.0 Fluorometer (Life Technologies, CA, USA). According to the instructions of the NEBNext UltraTM RNA Library Prep Kit for Illumina (NEB, USA), not less than 3 μg RNA per sample was collected for library construction. Purified mRNAs were acquired from total RNAs by polyT oligo-attached magnetic beads, which subsequently underwent fragmentation into 150–200 nt RNA inserts. Random hexamer primers and M-MuLV Reverse Transcriptase (RNase H–) were used for first-strand cDNA synthesis, and second-strand cDNA was synthesized with DNA Polymerase I and RNase H. Double-strand cDNA was generated by end-repair and adaptor ligation; suitable fragments were purified using an XP system (Beckman Coulter, Beverly, CA, USA) and were enriched by PCR amplification. The PCR products were subsequently purified and evaluated separately by an AMPure XP system and Agilent Bioanalyzer 2100 system, and high-throughput sequencing was performed on all the libraries with the Illumina HiSeqTM 2000 platform.
2.3 Data Quality Control and Alignment to the Reference Genome
The raw data were first transformed to sequence reads with base calling, and clean reads in FASTQ format were then purified after filtering low-quality reads harboring only adapters, poly-N > 10%, or Q20 < 20%. The Q30 value and GC content relevant to data quality were calculated, and only high-quality clean reads were used in subsequent analyses. Subsequently, read alignments were conducted between the clean reads and the G. hirsutum reference genome, and the related annotation files of the gene model were downloaded from the CottonGen database (http://www.cottonge n.org). Bowtie v2.2.3 was used to build the index of the G. hirsutum genome, and TopHat v.2.0.12 was employed for alignment of the paired-end clean reads and the reference genome.
2.4 Identification and Analysis of DEGs
HTSeq v.0.6.1 was utilized for quantization of the transcriptome gene expression, and the expression level of each gene was calculated using the FPKM (fragments per kb per million of the mapped reads) value [24], which was based on the length of the related gene and the number of reads that were mapped to this gene. Differentially expressed genes were identified with the generalized fold change (GFOLD) algorithm by separately comparing three CSSLs and their background material CCRI45, and genes satisfying an absolute GFOLD value of >1 were defined as DEGs [25]. Subsequently, the software Blast2go with corrected P-value ≤ 0.5 was used to perform Gene Ontology (GO) enrichment and Kyoto Encyclopedia of Genes and Genomes (KEGG) pathway analyses of all DEGs.
Short time-series expression miner (STEM) software (Carnegie Mellon University, USA) was utilized to analyze the temporal expression patterns of DEGs during the fiber-elongation period, and GO enrichment and KEGG pathway analyses were also performed on the significant profile of four lines.
2.5 Identification of Introgressive Genes
The introgressive genes in three CSSLs were identified with a novel procedure as follows: (1) Transcript assembly was first performed on the reads of CCRI45 to obtain the background reference, and all the obtained reads from three CSSLs were collected and used in sequence assembly as the introgressive transcript; (2) Sequence difference-site alignment between the background reference and introgressive transcript was then performed, and the genes with differential sequences in the three CSSLs were predicted as introgressive genes; (3) Based on the intersection between the RNA-seq introgressive genes and the G. barbadense genome, the introgressive genes were finally confirmed. Chromosome distribution was subsequently conducted on the introgressive genes to acquire the accurate locations, and candidate genes related to fiber development were screened with a combination of RNA-seq data and significant regions.
2.6 qRT-PCR Validation of RNA-Seq Results
The validation experiments were conducted on the transcriptome data to confirm the reliability of the results, and 12 random DEGs were selected for qRT-PCR with three biological repeats and three technical repeats per sample; their specific primers were designed using the NCBI Primer-BLAST online tool. The TranScript All-in-One First-Strand cDNA Synthesis SuperMix of the qPCR Kit (Transgen Biotech, Beijing, China) was used to synthesize the cDNAs, and qRT-PCR experiments were conducted on an ABI 7500 fast Real-Time PCR System (Applied Biosystems, USA) according to the manual of the TransStart Top Green qPCR SuperMix Kit (Transgen Biotech, Beijing, China). The relative expression levels of 12 DEGs were calculated using β-actin as a reference and the 2–ΔΔCt method [26].
3.1 The Phenotypic Traits and Substitution Background
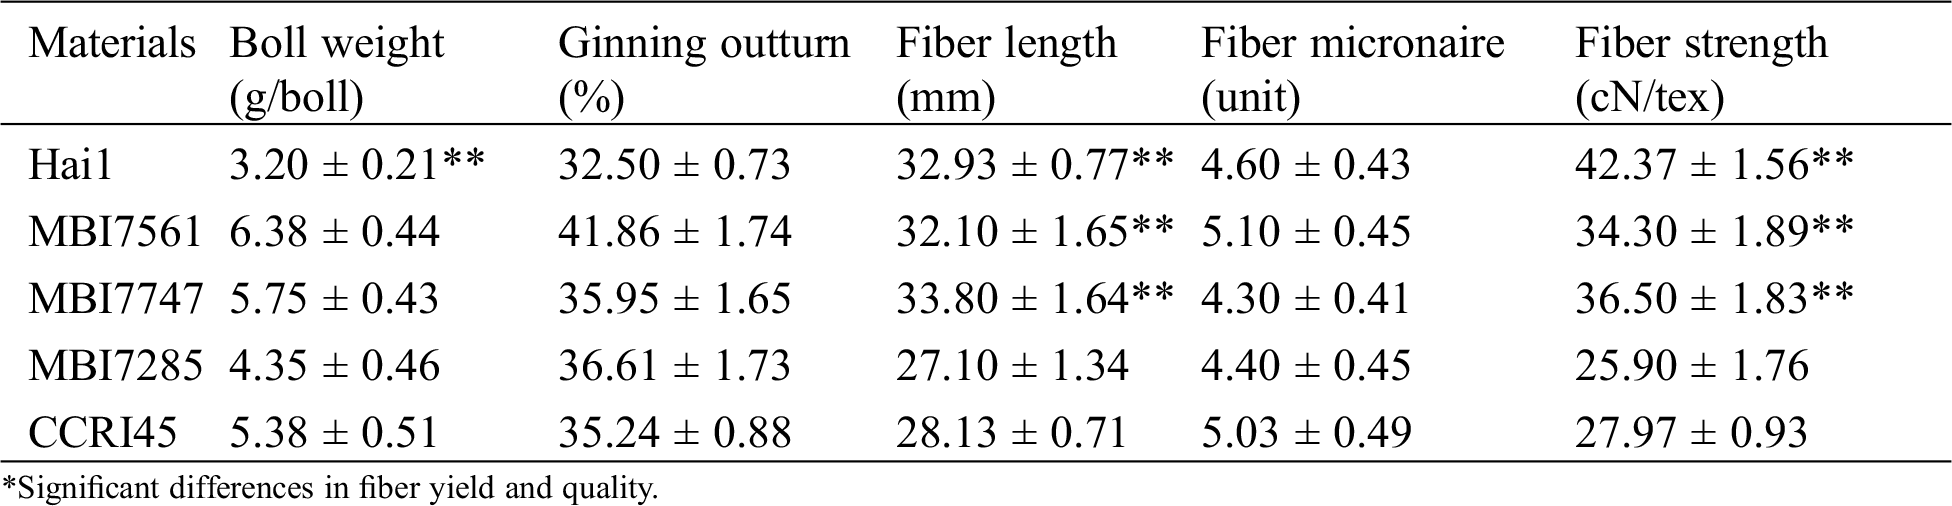
Comparative analyses of fiber yield and quality traits were conducted on the receptor and recurrent parent CCRI45, the donor parent Hai1, and three CSSLs (Tab. 1). With respect to fiber yield, the ginning outturn values of three CSSLs were greater than those of both Hai1 and CCRI45, and their boll weight values were higher than those of the two parents except for MBI7285. In terms of fiber quality, both fiber length and fiber strength of MBI7561 and MBI7747 were superior to those of CCRI45, of which the former was higher, whereas the latter showed a lower fiber micronaire value than the two parents. Either the fiber length or fiber strength of MBI7285 was worse than those of CCRI45 and Hai1, of which the fiber micronaire value was lower than those of the two parents. In consideration of fiber yield traits tested only by 30 mature opened bolls, the boll number and seed index were not counted, which indicates the three CSSLs showed a significant improvement in fiber yield compared to their parents, while MBI7561 and MBI7747 had better fiber quality whereas MBI7285 had a relatively worse fiber quality than their parents.
Table 1: The average performance of fiber yield and quality for CCRI45, Hai1, and three CSSLs
A total of 526 SSR markers filtrated from the high-density genetic linkage map were utilized to investigate the substitution backgrounds, identifying 27 (5.13%), 11 (2.10%), and 39 (7.41%) polymorphisms in MBI7561, MBI7747, and MBI7285, respectively, which confirmed >7.41% of the total chromosomes compared to CCRI45. Among the three CSSLs, MBI7747 and MBI7285 separately have the fewest and most polymorphisms, which are mainly distributed on chromosome 2, 12, 14, 16, and 17 in the former, while on the whole chromosomes except for chromosome 9, 14, 17, 19, and 24 in the latter. There are more than half of 26 chromosomes with polymorphic SRR markers identified in MBI7561, of which chromosome 2, 16, and 17 are the 3 common overlap regions in the two superior CSSLs [27].
3.2 Transcriptome Sequencing and Alignment to the Reference Genome
In total, 117,856.248 million clean bases and 471.425 million clean reads were obtained in this study, of which the average data per sample were 5,892.812 million clean bases and 23.571 million clean reads (Tab. S1). Meanwhile, 88.14%–94.77% of the Q30 values and 44.62%–46.43% of the GC content were calculated to evaluate data quality, of which the average values were 91.47% and 45.23%, respectively.
A total of 63,741 expressed genes were found in the different samples in this study and were subjected to Pearson correlation coefficient (PCC) analysis. The result showed that at the same stages of fiber growth, more than 95% of the expressed genes presented similar expression in the four lines from 5 DPA to 7 DPA, whereas more than 80% and 71% similarities were observed from 10 DPA to 15 DPA and at 20 DPA, respectively (Fig. 1). In terms of the same line at different developmental stages, the expressed genes in CCRI45 showed more than 92% similarity from 5 DPA to 20 DPA, and a similar phenomenon (more than 90% similarity) was identified in the three CSSLs from 5 DPA to 15 DPA, except for 82% and 86% similarities that were observed between MBI7747-5 and MBI7747-10/MBI7747-15, respectively, and 81% similarities between MBI7285-5 and MBI7285-10. However, relatively lower similarities of gene expressions (62%–80%) were observed in the three CSSLs, which presented an increasing tendency of 20 DPA compared with 5, 7, 10, and 15 DPA, including one exception between MBI7561-10 and MBI7561-20. Either the normal Q30 and GC values or highly similar correlation coefficients implied the reliability of these RNA-seq data.
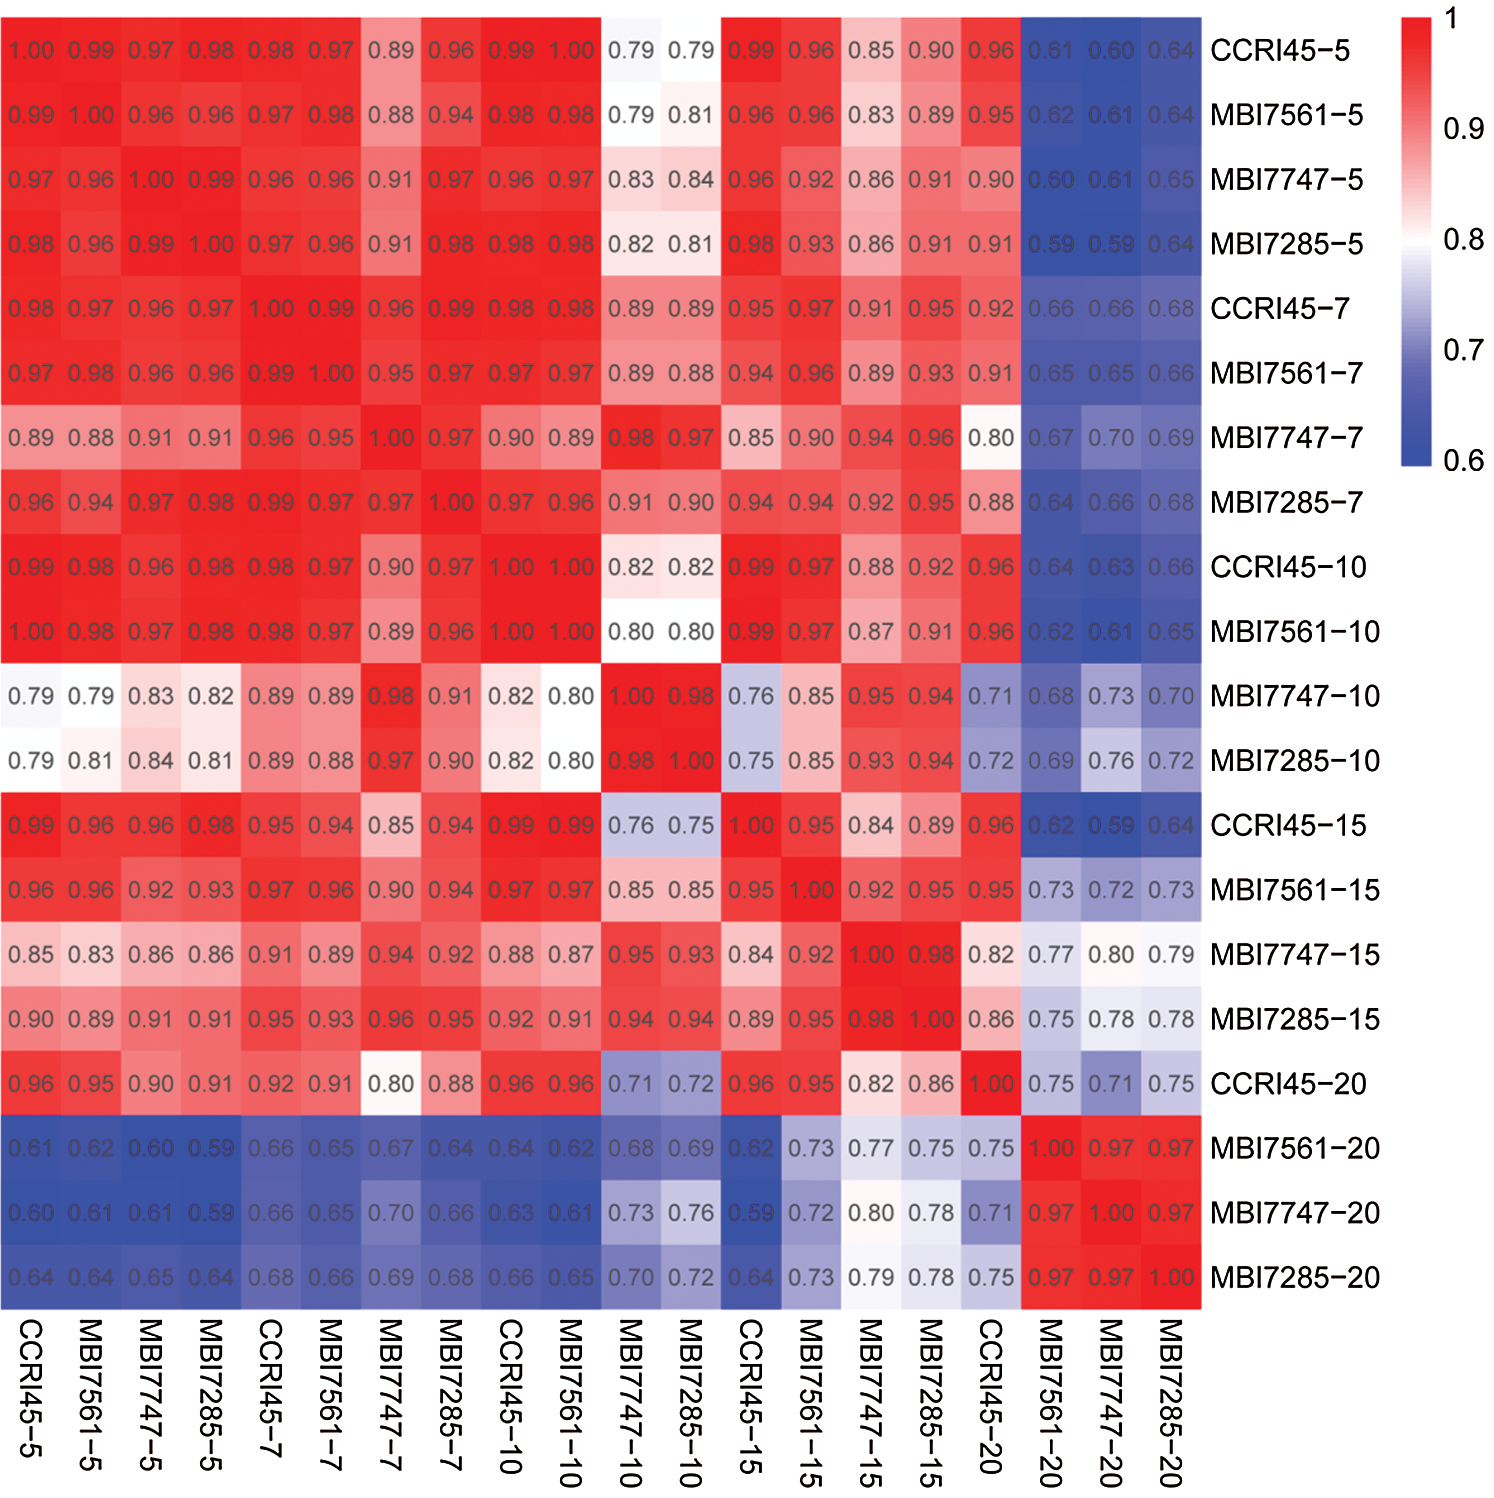
Figure 1: Pearson correlation coefficient analysis of all genes of the 20 samples. 5 = 5 DPA, 7 = 7 DPA, 10 = 10 DPA, 15 = 15 DPA, and 20 = 20 DPA
3.3 Identification and Analysis of DEGs
Pairwise comparisons between samples generated 5,673 DEGs, including 2,958 upregulated and 2,715 downregulated DEGs, which subsequently underwent GO enrichment analyses to determine their potential functions. Being classified into biological process, cellular component, and molecular function according to GO enrichment categories, the top 50 subcategories are separately presented in Figs. 2A–2C. In terms of biological process, most DEGs were enriched in the oxidation-reduction process, protein phosphorylation, regulation of transcription, DNA template, and carbohydrate metabolic process. In the cellular component, the most abundant subcategories were membrane, nucleus, integral component of membrane, and nucleosome, whereas protein binding, ATP binding, DNA binding, and protein kinase activity were the principal subcategories in terms of molecular function.
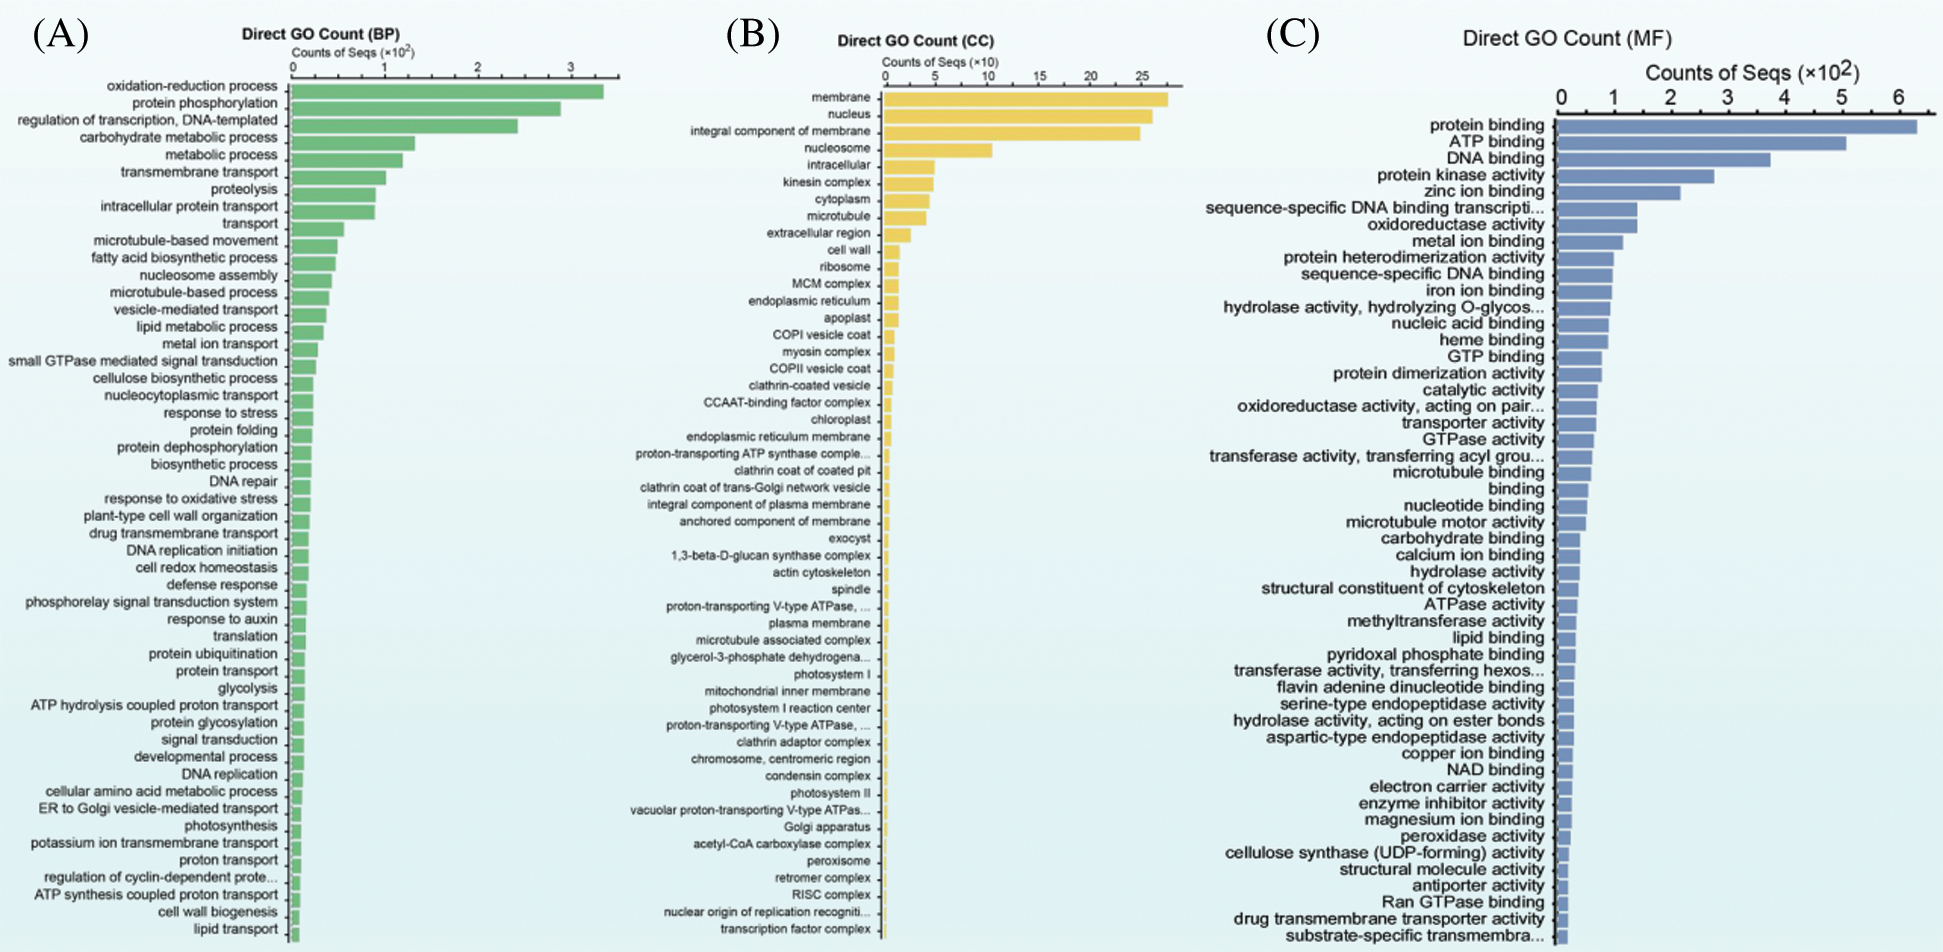
Figure 2: Go enrichment analysis of the total DEGs. (A) GO subcategories of the biological process, (B) GO subcategories of the cellar component, and (C): GO subcategories of the molecular function
3.4 Analysis of DEG Temporal Expression Patterns
Eight temporal expression patterns of 5,673 DEGs were monitored in the four lines, and each profile represents DEGs with the same or a similar expression pattern (Fig. 3). The common profiles with significant enrichment (P-value ≤ 0.05) in two superior CSSLs were profile 1 and profile 6, of which the former showed a continuously downregulated pattern, whereas the latter was initially upregulated and subsequently downregulated. The significantly enriched profiles 1 and 7 were common in MBI7285 and CCRI45 with ordinary fiber quality, and profile 7 presented a continuously upregulated pattern. Therefore, the common profile 1 with the highest number of DEGs was chosen for further GO enrichment and KEGG pathway analyses for the four lines.
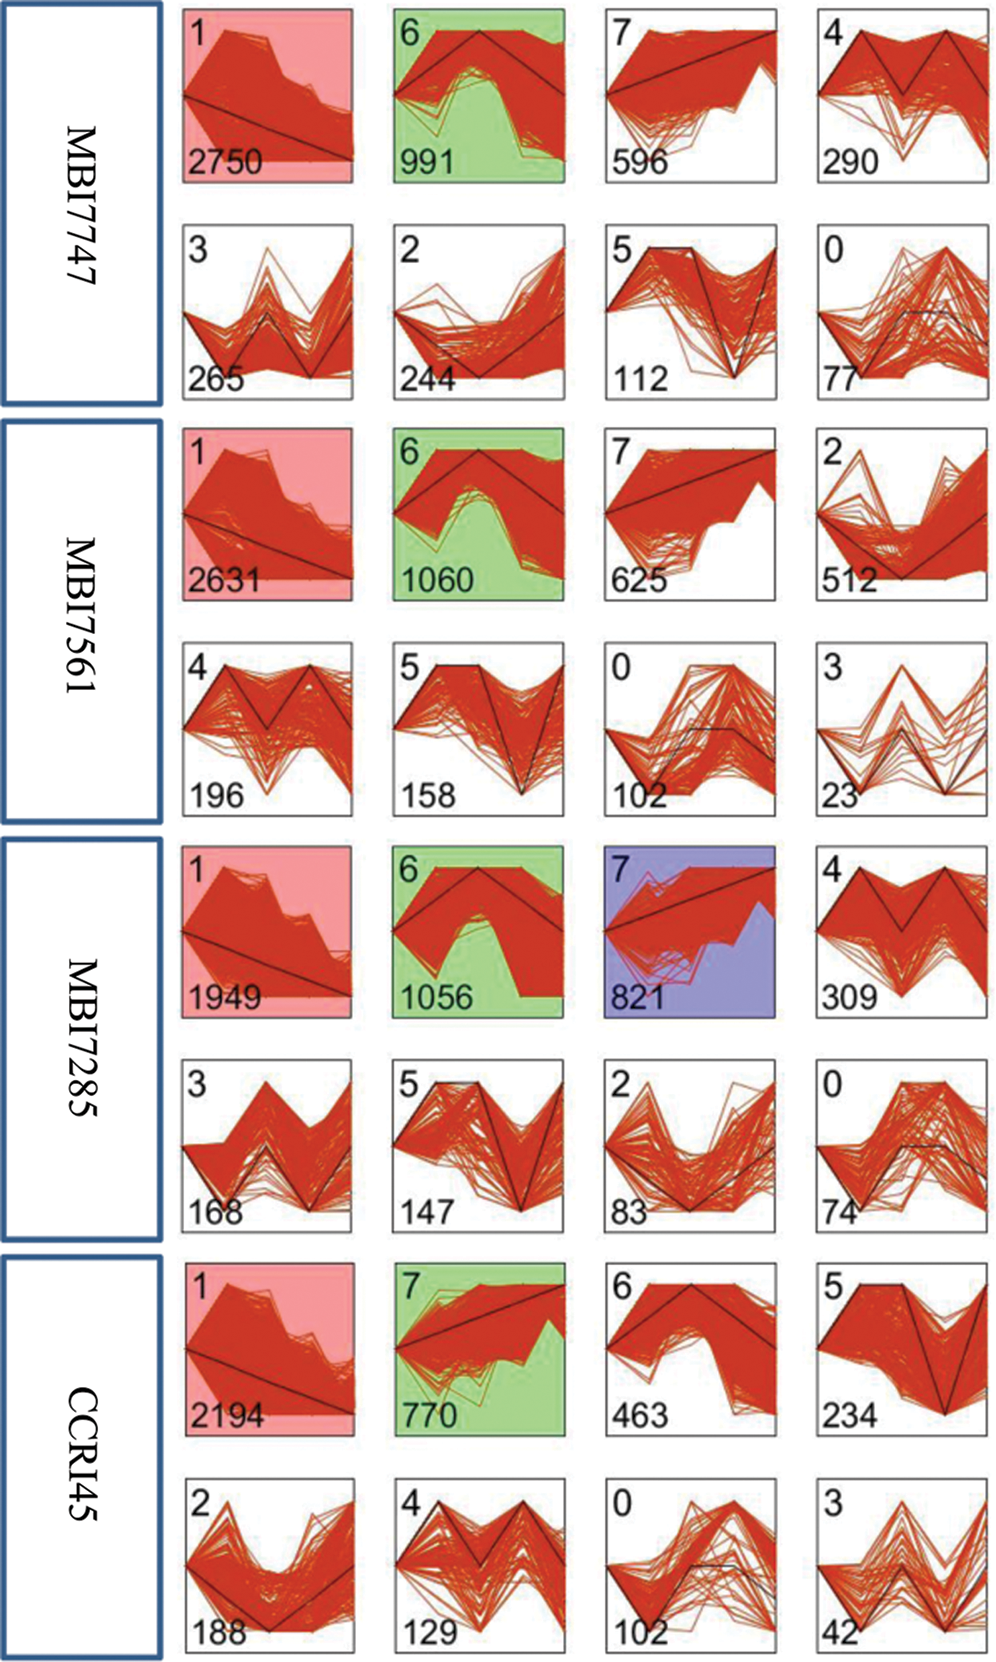
Figure 3: DEG temporal expression patterns of the four lines based on STEM software. Each square represents a gene expression trend. The number in the top left corner indicates the profile ID number, whereas that in the bottom left corner indicates the number of genes in that profile. The clusters and profiles are ordered based on the number of genes and significance (default)
Different numbers of DEGs were classified into three GO categories (Fig. 4), and similar results were observed in the most abundant subcategories of the four lines, specifically metabolic process, cellular process, and single-organism process in biological process, binding and catalytic activity in molecular function, and cell, cell part, and organelle in the cellular component. However, there were nearly double the number of enriched DEGs in biological regulation and response to stimulus of biological process and nucleic acid-binding transcription factor activity of molecular function in MBI7747 and MBI7561 compared with those in MBI7285 and CCRI45. However, there were almost twice as many enriched DEGs in the membrane and membrane part of the cellular component in MBI7285 and CCRI45 as those in MBI7747 and MBI7561.
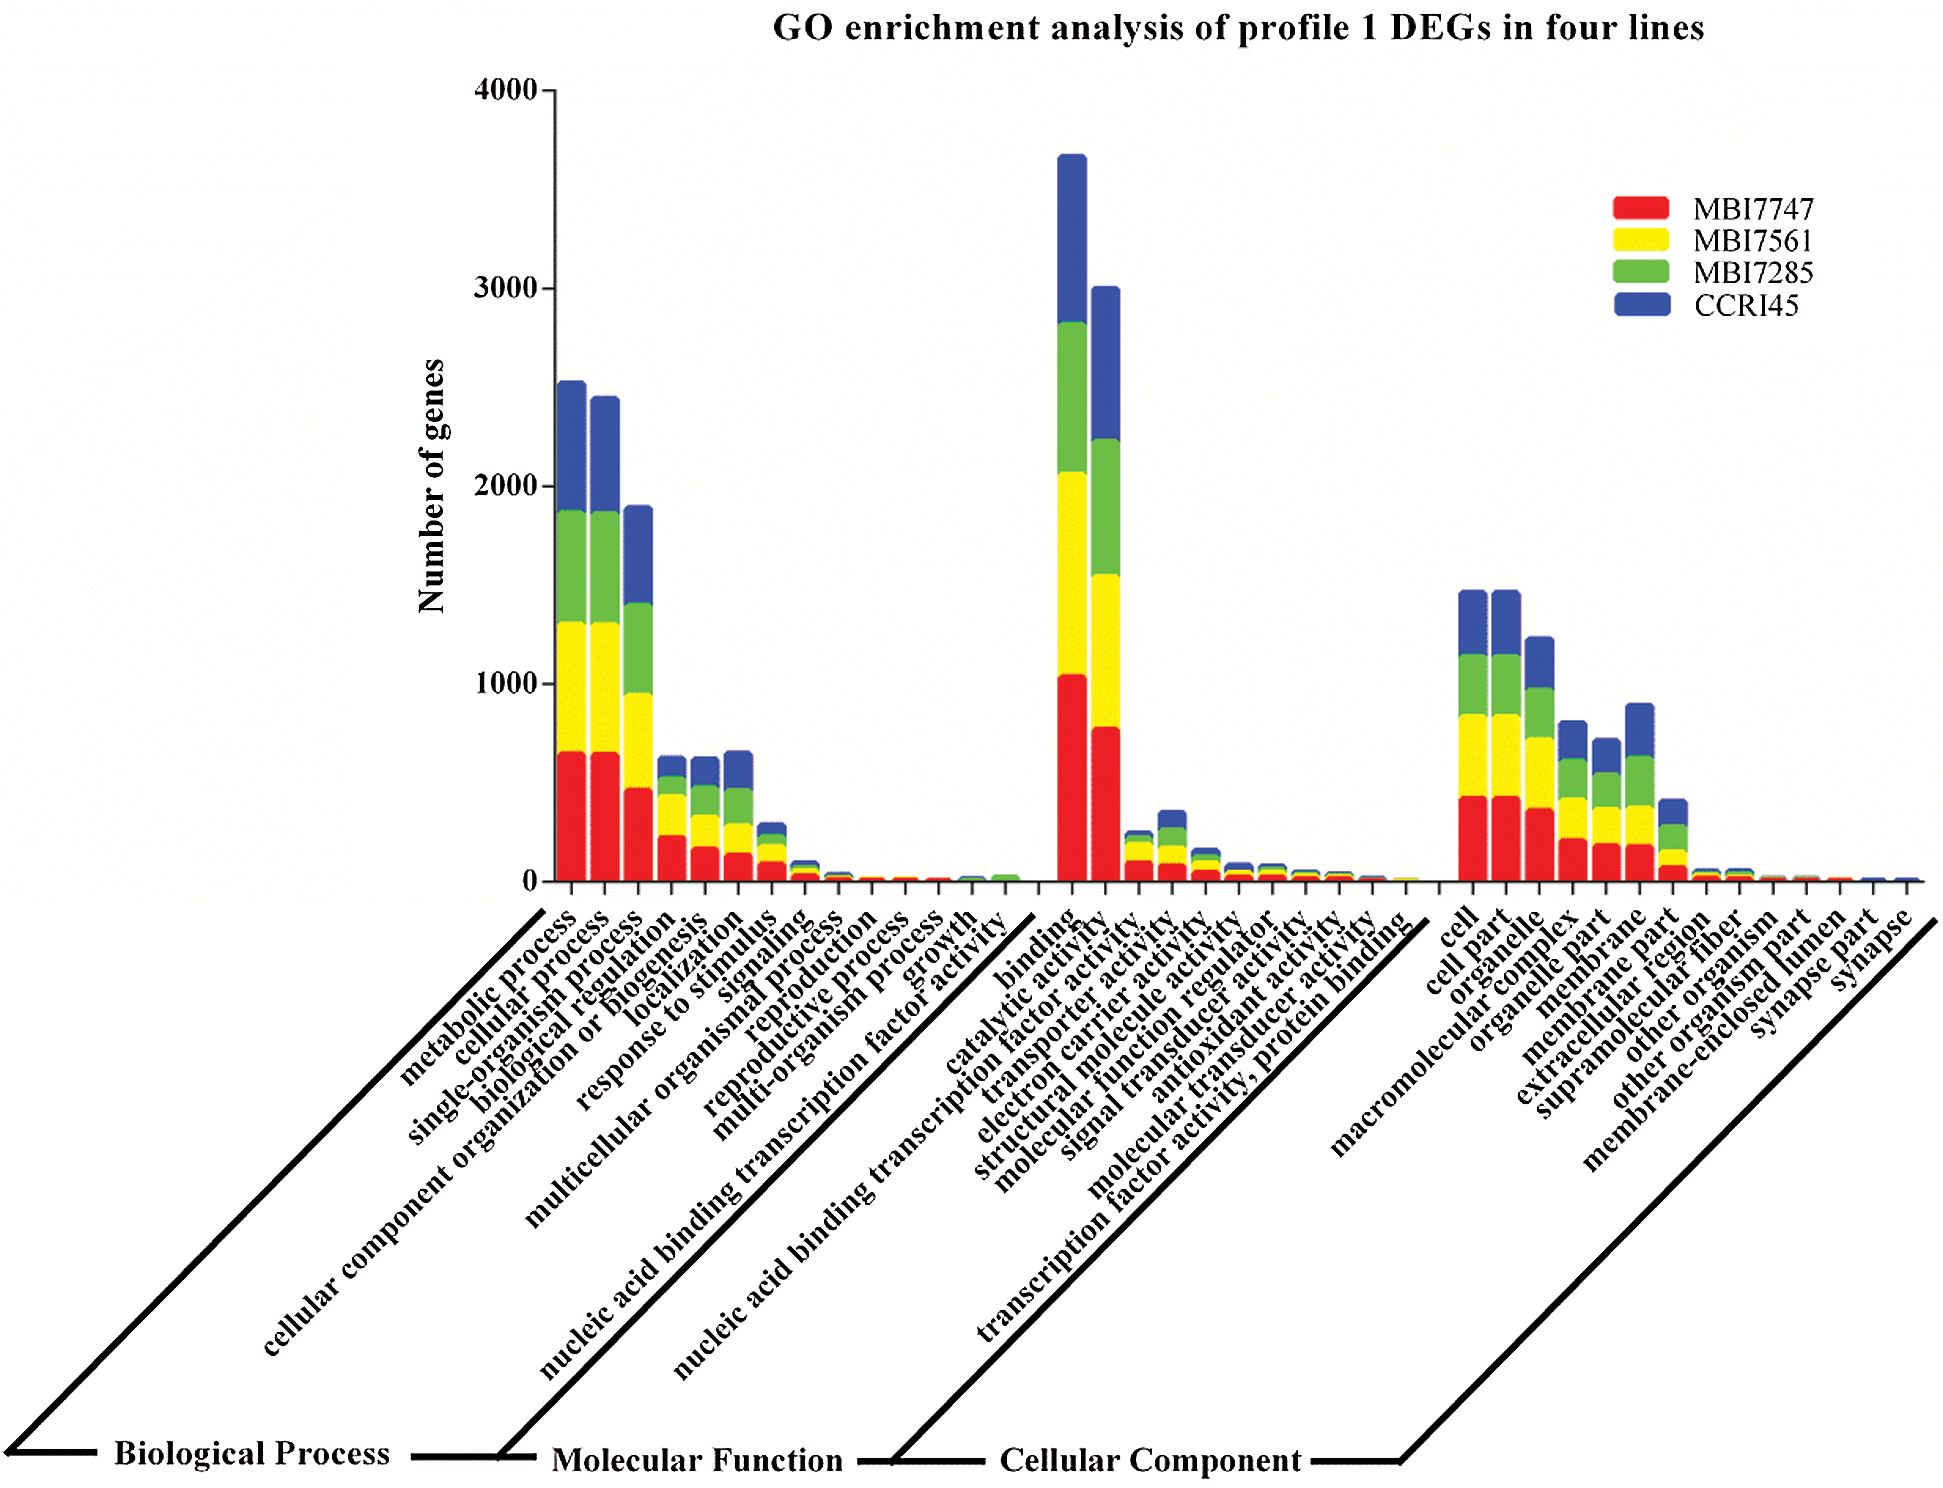
Figure 4: Go enrichment analysis of profile 1 DEGs in the four lines
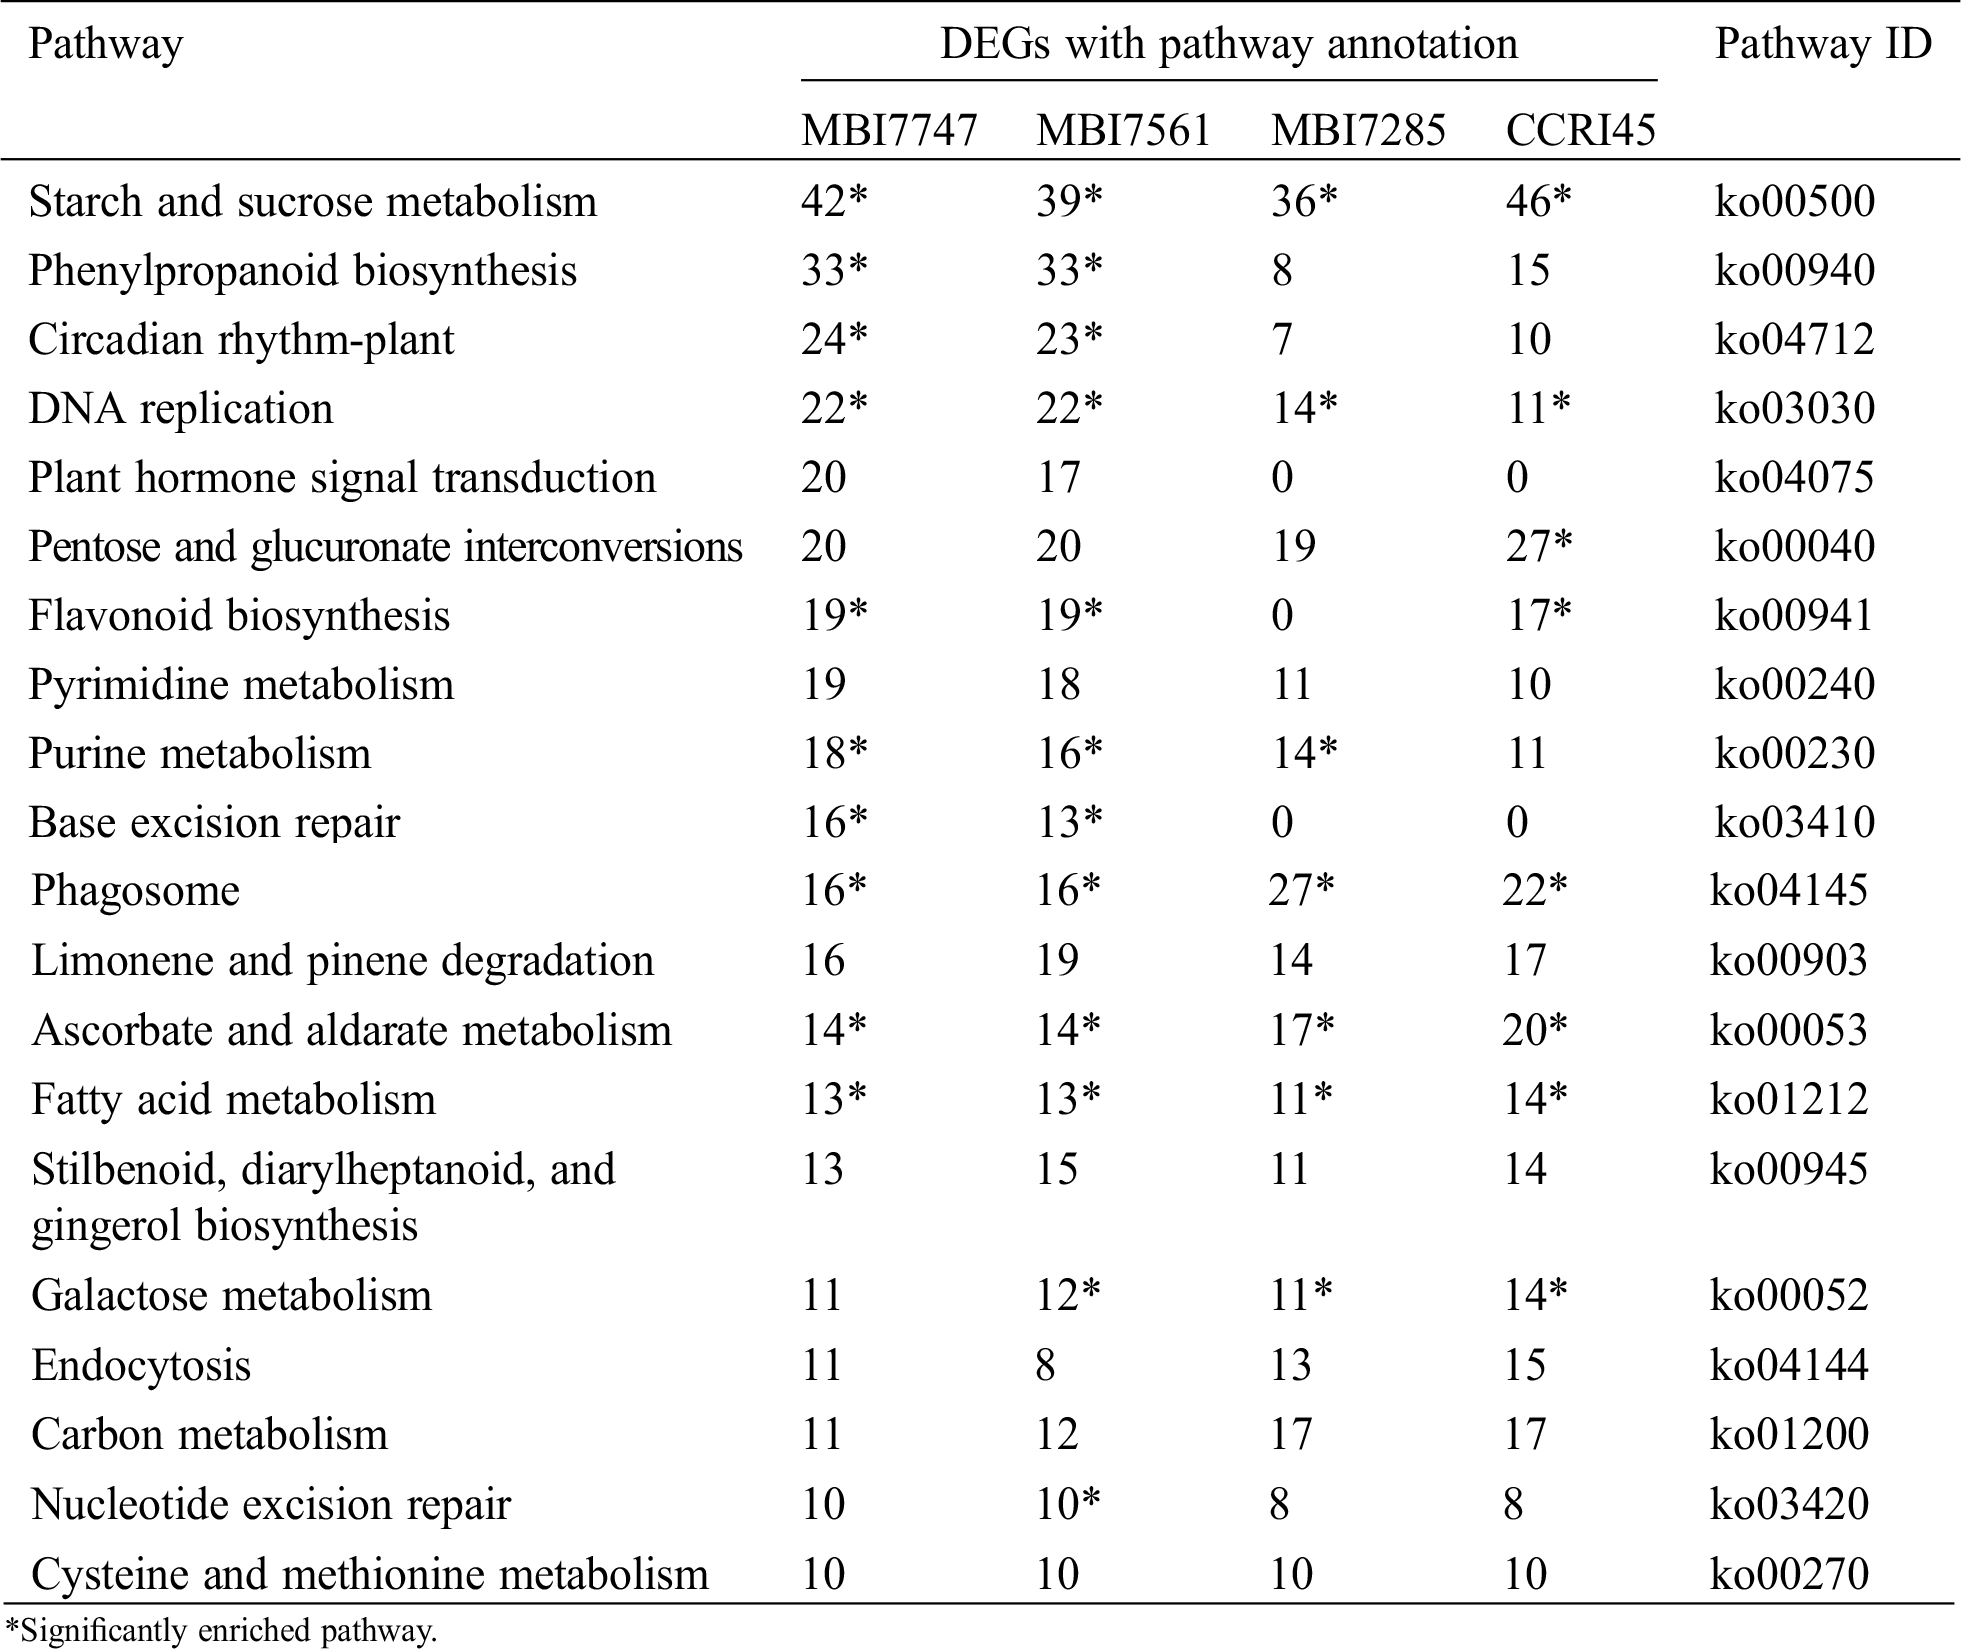
KEGG pathway analysis was conducted on the DEGs in profile 1, of which the top 20 signaling pathways with the most abundant DEGs are presented in Tab. 2. There were five common pathways with significant enrichment (P-value ≤ 0.05) in all four lines, namely, starch and sucrose metabolism (ko00500), DNA replication (ko03030), phagosome (ko04145), ascorbate and aldarate metabolism (ko00053), and fatty acid metabolism (ko01212), and most DEGs enriched the first pathway, implying its significance to fiber development. Phenylpropanoid biosynthesis (ko00940) and circadian rhythm-plant (ko04712) separately harbored the second and third most DEG-enriched categories in MBI7747 and MBI7561, presenting more than double the number of DEGs than those without significant enrichment in MBI7285 and CCRI45. By combining the results of GO enrichment and KEGG pathway analysis, the continuously downregulated profile 1 in all four lines indicated that higher similarities were separately identified in two superior CSSLs, or MBI7285 and CCRI45, with relatively ordinary fiber performance.
Table 2: Top 20 KEGG pathways with high representation of profile 1 DEGs
3.5 Identification of Introgressive Genes in Three CSSLs
Based on the intersection between the predicted introgression genes from RNA-seq data and Sea Island gene information [15], 1,535 introgressive genes were identified in this study, including 754 in the A sub-genome and 781 in the D sub-genome (Fig. 5). The highest and lowest numbers of introgressive genes in the A sub-genome were 110 in chromosome 5 and 29 in chromosome 4, respectively, whereas those in the D sub-genome were 91 in chromosome 5 and 41 in chromosome 3.
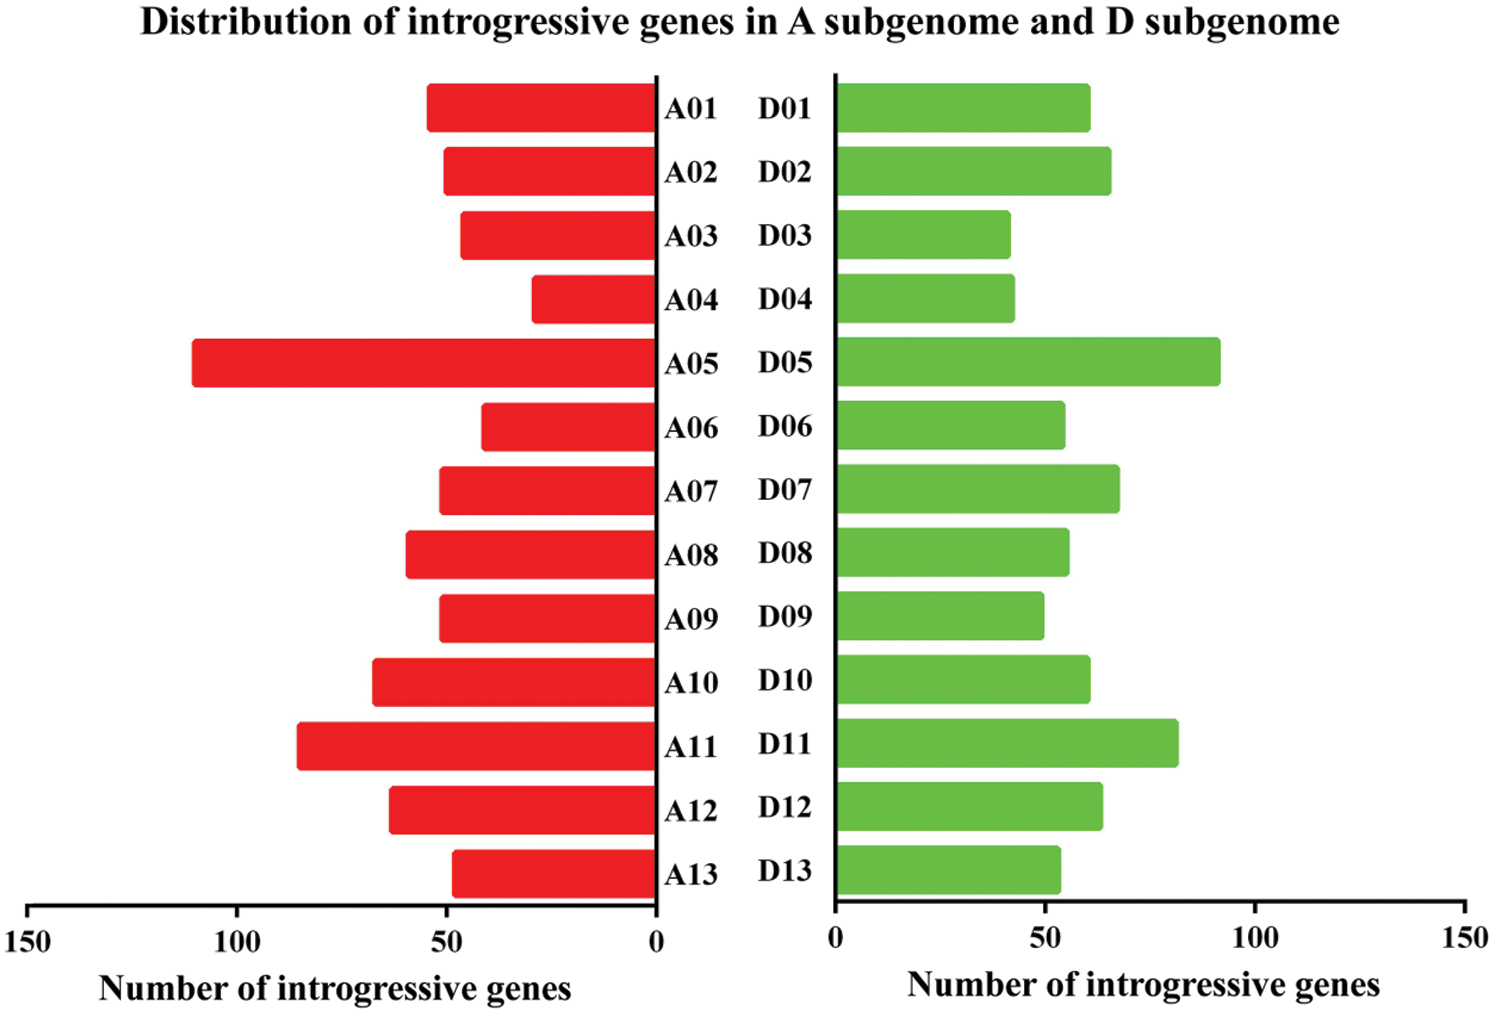
Figure 5: Distribution of introgressive genes in the A sub-genome and D sub-genome
To screen candidate introgressive genes related to fiber length, it was necessary to analyze the common introgressive sections in superior MBI7561 and MBI7747. Three common introgressive sections were identified in MBI7747 and MBI7561, which were separately located in chromosome A02 between PGML02861 and BNL1434, chromosome D07 between NAU5120 and NAU5408, and chromosome D03 between HAU0195 and TMB0874. Based on the intersection of G. barbadense genes and our predicted introgressive genes in three common sections, a total of 22 introgressive genes were identified, and only 17 were differentially expressed during fiber elongation, including 7 that were upregulated and 10 that were downregulated. There were three candidate DEGs in chromosome A02, including one downregulated, GB_A02G0240 (O-fucosyltransferase family protein), and two upregulated, GB_A02G0272 (glutamine synthetase 2) and GB_A02G0264 (ankyrin repeat family protein), which have been reported to play significant roles in plant growth [28–30]. In chromosome D03, only GB_D03G1580 (putative lysine decarboxylase family protein) showed an upregulated pattern, whereas the other five were downregulated DEGs, namely, GB_D03G1703 (RNA-binding plectin/S10 domain-containing protein), GB_D03G1742 (beta-6 tubulin), GB_D03G1760 (RHOMBOID-like protein 3), GB_D03G1608 (no annotation), and GB_D03G1655 (WRKY DNA-binding protein 2), of which the beta-6 tubulin and WRKY transcription factors might be involved in fiber elongation [31,32]. A total of eight candidate DEGs were screened in chromosome D07, including four upregulated DEGs, namely, GB_D07G0623 (quinolinate synthase), GB_D07G0912 (bifunctional inhibitor/lipid-transfer protein/seed storage 2S albumin superfamily protein), GB_D07G2042 (high mobility group A), and GB_D07G0631 (nuclear factor Y, subunit B13), and four downregulated DEGs, namely, GB_D07G0797 (leucine-rich repeat transmembrane protein kinase), GB_D07G0808 (no annotation), GB_D07G0809 (endomembrane protein 70 protein family), and GB_D07G0941 (zinc finger C-x8-C-x5-C-x3-H type family protein), of which GB_D07G0623, GB_D07G0631, and GB_D07G0797 were found to participate in reactive oxygen species (ROS) activities, drought stress, and early salt stress, respectively [13,33,34].
3.6 Quantitative Real-Time PCR Validation of RNA-Seq Results
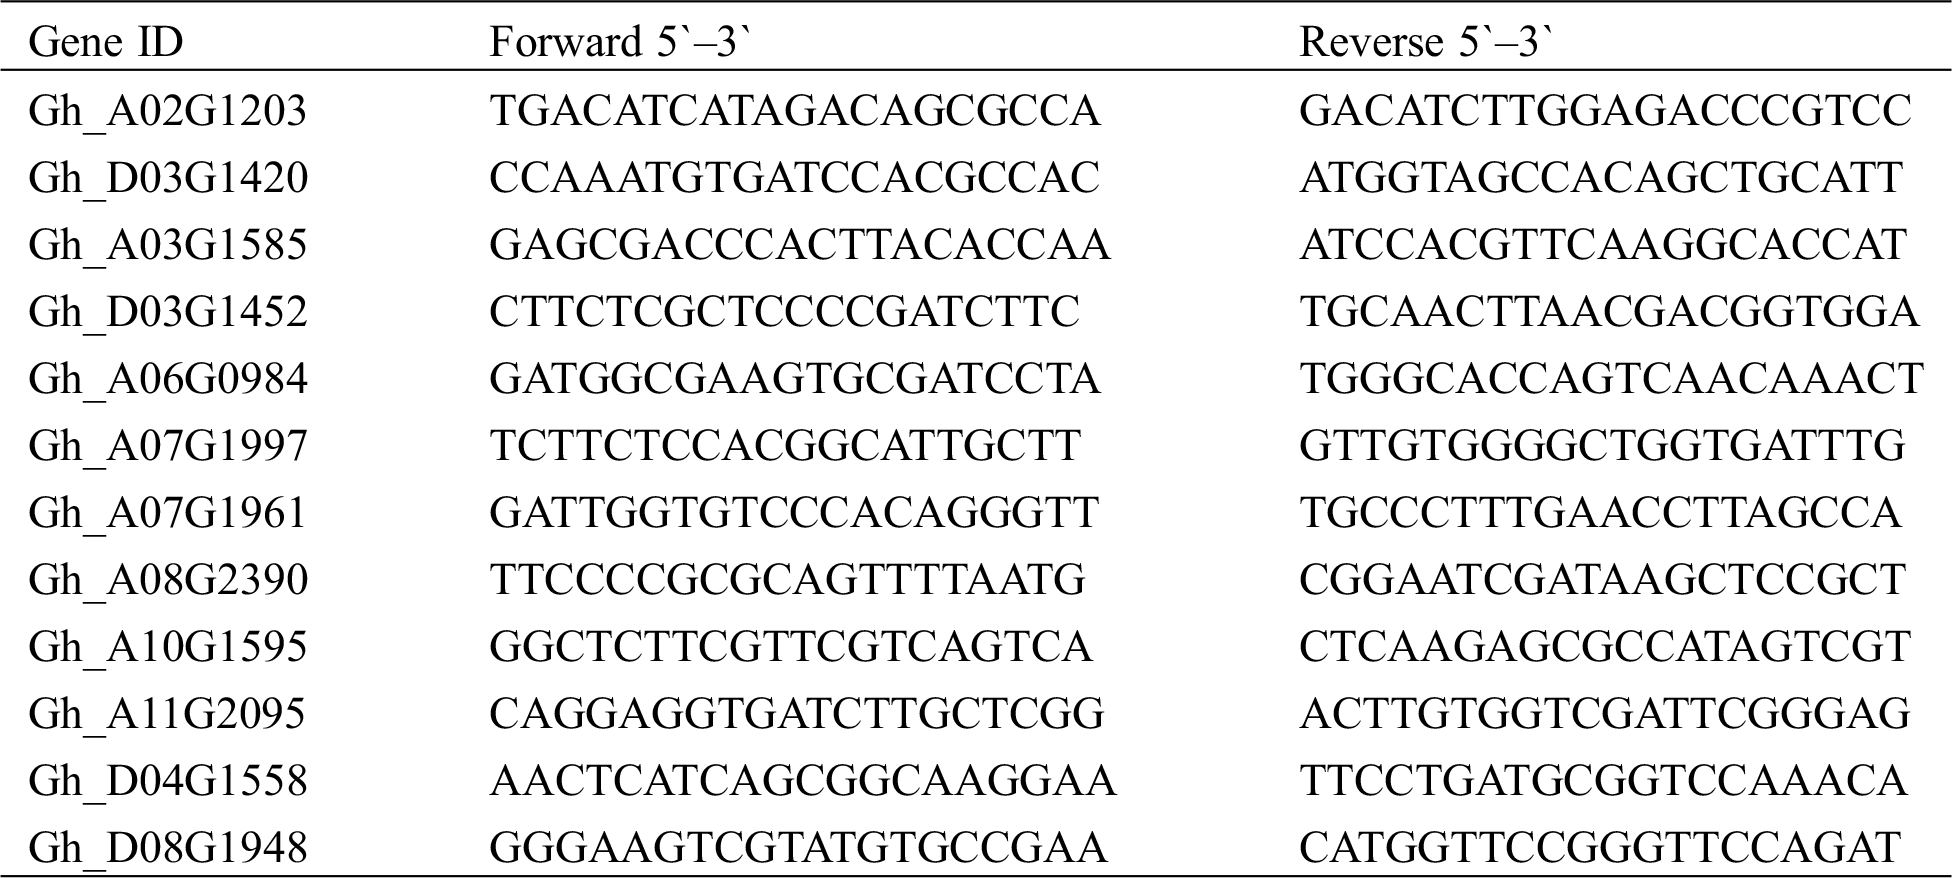
The RNA-seq reliabilities were validated by the qRT-PCR experiments on 12 random selected DEGs (Fig. 6), including 7 upregulated DEGs (Gh_D03G1420, Gh_D03G1452, Gh_A10G1595, Gh_A07G1997, Gh_A03G1585, Gh_A06G0984, and Gh_A07G1961), 5 downregulated DEGs (Gh_A08G2390, Gh_D08G1948, Gh_A02G1203, Gh_A11G2095, and Gh_D04G1558), of which the primer sequences are presented in Tab. S2. The housekeeping β-actin gene was selected as a reference gene, and the dynamic changes of 12 DEGs in the qRT-PCR experiments were highly concordant with the RNA-seq results, which proved the robustness of our transcriptome sequencing data.
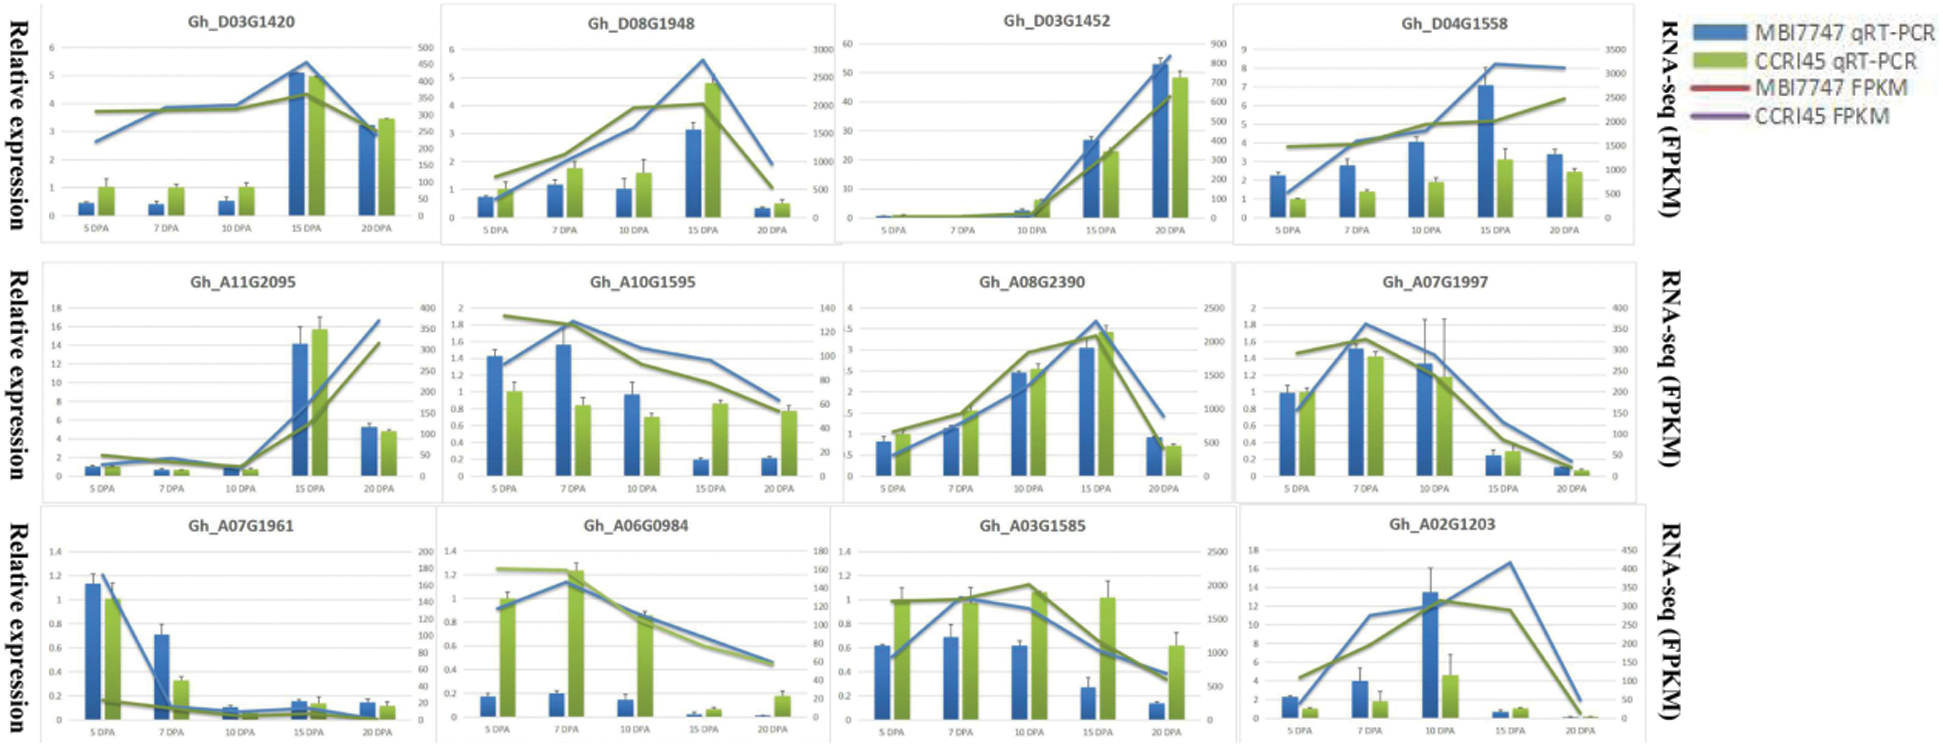
Figure 6: qRT-PCR results of 12 selected DEGs
Cotton (Gossypium) is the most widely cultivated commercial crop producing natural fiber, and has made tremendous contributions to human economic and social development [1]. Upland cotton can contribute to more than 90% cotton production every year, while subjects to relatively ordinary fiber quality and a narrow genetic background. Therefore, it would be economical to develop CSSLs in cotton breeding to introduce superior trait genes derived from Sea Island cotton into upland cotton to cultivate cotton varieties with high yield and good fiber quality. In this study, three CSSLs harboring the diverse fiber performances were chosen from BC4F3:5 population, which underwent high-generation backcrossing and selfing to provide stable fiber traits and clear hereditary background, vastly contributing to QTL mapping of significant quantitative traits and candidate gene identification [27].
Cotton fiber length is principally determined by the stage of fiber elongation, when upland cotton fiber stopped growing at 23 DPA, while Sea Island cotton fiber stopped growing at 33 DPA [35]. Recently, multiple attempts have been conducted on fiber length with transcriptome and QTL mapping technologies, identifying significant candidate genes such as Gh_A07G1077 [31], GhbHLH18 [36], Gh_D03G1338 [37], GhACX [38], Gh_D11G1928 [39], and Gh_D10G1008 [40], providing valuable information for understanding fiber formation. By conducting RNA-seq on four lines form 5 to 20 DPA, this study examined the dynamic changes of DEGs between materials with different fiber qualities and screened candidate introgressive genes that were related to fiber length in the CSSLs.
In total, we obtained 471.425 million clean reads from the 20 fiber samples, and the average Q30 values and GC contents were 91.47% and 45.23, respectively; these reads were subjected to sequence alignment to the G. hirsutum reference genome. All expressed genes in this study were separately evaluated to conduct PCA and PCC analysis, and high similarities were observed either among different materials during the same developmental period or in the same materials during different developmental periods, indirectly indicating the reliability of our transcriptome data. Based on the GFOLD algorithm, multiple comparisons between different samples resulted in the identification of 2,958 upregulated and 2,715 downregulated DEGs, of which GO enrichment and KEGG pathway analyses indicated that most DEGs enriched the functional categories of oxidation-reduction, protein phosphorylation, regulation of transcription, DNA-templated, and carbohydrate metabolism. In addition, eight profiles with diverse expression patterns were obtained in the four lines based on STEM software, and GO enrichment and KEGG analyses were conducted on the significantly enriched profile 1 with the continuously downregulated pattern, revealing that both the enriched GO subcategories and the KEGG sub-pathways presented high similarities between the superior MBI7747 and MBI7561 or between the ordinary CCRI45 and MBI7285.
The introgressive genes derived from Sea Island cotton are deemed to be key factors that influence the fiber quality of CSSLs; therefore, based on the intersection of the predicted introgressive genes from the RNA-seq data and G. barbadense reference genome, we identified 1,535 introgressive genes in the three CSSLs, including 754 in the A sub-genome and 781 in the D sub-genome. Based on three common introgressive sections between superior MBI7747 and MBI7561, 22 introgressive genes were screened, and 7 upregulated and 10 downregulated DEGs were found during fiber elongation. Analysis of the annotations and previously reported articles confirmed eight candidate introgressive genes that were correlated with fiber length. To be specific, there were two upregulated and one downregulated candidate introgressive genes in chromosome A02, namely, GB_A02G0272 (glutamine synthetase 2), GB_A02G0264 (ankyrin repeat family protein), and GB_A02G0240(O-fucosyltransferase family protein), which were found to participate in the control of plant growth [28–30]. There were two downregulated candidate genes in chromosome D03, namely, GB_D03G1742 (beta-6 tubulin) and GB_D03G1655 (WRKY DNA-binding protein 2), which have been reported to be relevant to fiber elongation [31,32]. There were two upregulated and one downregulated candidate introgressive genes in chromosome D07, namely, GB_D07G0623 (quinolinate synthase), GB_D07G0631 (nuclear factor Y, subunit B13), and GB_D07G0797 (leucine-rich repeat transmembrane protein kinase), which were found to participate in biological processes related to fiber development, including ROS activities, drought stress, and early salt stress [13,33,34]. The results of this study provide valuable information and also lay a solid foundation for further research on fiber development, which may facilitate the elucidation of the molecular mechanism of fiber length formation.
In this study, transcriptome analyses of fiber elongation from 5 DPA to 20 DPA were conducted in three CSSLs (MBI7561, MBI7747, and MBI7285) and their recurrent parent CCRI45, which generated a total of 471.425 million clean reads, with a 91.47% average Q30 value and 45.23% mean GC content. Multiple comparisons between samples resulted in the identification of 5,673 DEGs that were mainly involved in the oxidation-reduction process, protein phosphorylation, regulation of transcription, DNA templates, and carbohydrate metabolism. These DEGs were subjected to temporal expression pattern analysis, which identified some significantly enriched profiles to indicate similarities between two CSSLs with superior fiber quality or between MBI7285 and CCRI45. In total, 1,535 introgressive genes derived from Sea Island cotton were identified in the three CSSLs, and 8 candidate genes screened from three common introgressive sections in superior CSSLs were shown to be involved in fiber development. These results provide valuable information for the elucidation of the molecular mechanism of fiber length.
Author Contributions: Conceived and designed the experiments: Pengtao Li and Quanwei Lu. Performed the experiments: Pengtao Li, Quanwei Lu, Xianghui Xiao, Rui Yang, and Xixi Duan. Analyzed the data: Pengtao Li and Xianghui Xiao. Drafted the manuscript: Pengtao Li and Quanwei Lu.
Funding Statement: This study was supported by the Key Scientific Research Projects (16A180001) from Henan Education Department, Henan, China and Scientific researcher Dr. Quanwei Lu “http://jyt.henan.gov.cn/”, National Natural Science Foundation of China (31801404), China and Scientific researcher Dr. Pengtao Li “http://www.nsfc.gov.cn/”, Joint Funds of the National Natural Science Foundation (U1804103), China and Scientific researcher Dr. Quanwei Lu “http://www.nsfc.gov.cn/”, Science and Technology Development Project of Henan Province (192102110127), Henan, China and Scientific researcher Dr. Pengtao Li “http://kjt.henan.gov.cn/” and Doctoral and Postdoctoral Research Fund of Anyang Institute of Technology (BSJ2019014 and BHJ2020002), Anyang, Henan, China and Scientific researcher Dr. Pengtao Li “http://www.ayit.edu.cn/”.
Conflicts of Interest: The authors declare that they have no conflicts of interest to report regarding the present study.
References
1. Sunilkumar, G., Campbell, L. M., Puckhaber, L., Stipanovic, R. D., Rathore, K. S. (2006). Engineering cottonseed for use in human nutrition by tissue-specific reduction of toxic gossypol. Proceedings of the National Academy of Sciences of the United States of America, 103(48), 18054–18059. DOI 10.1073/pnas.0605389103.
2. Shi, Y. Z., Li, W. T., Li, A. G., Ge, R. H., Zhang, B. C. et al. (2015). Constructing a high-density linkage map for Gossypium hirsutum × Gossypium barbadense and identifying QTLs for lint percentage. Journal of Integrative Plant Biology, 57(5), 450–467. DOI 10.1111/jipb.12288. [Google Scholar] [CrossRef]
3. Keurentjes, J. J., Bentsink, L., Alonso-Blanco, C., Alonso-Blanco, C., Hanhart, C. J. et al. (2007). Development of a near-isogenic line population of Arabidopsis thaliana and comparison of mapping power with a recombinant inbred line population. Genetics, 175(2), 891–905. DOI 10.1534/genetics.106.066423. [Google Scholar] [CrossRef]
4. Eshed, Y., Zamir, D. (1994). A genomic library of Lycopersicon pennellii in L. esculentum: A tool for fine mapping of genes. Euphytica, 79(3), 175–179. DOI 10.1007/BF00022516. [Google Scholar] [CrossRef]
5. Furuta, T., Uehara, K., Angeles-Shim, R. B., Angeles-Shim, R. B., Shim, J. et al. (2016). Development of chromosome segment substitution lines harboring Oryza nivara genomic segments in Koshihikari and evaluation of yield-related traits. Breeding Science, 66(5), 845–850. DOI 10.1270/jsbbs.16131.
6. Zhang, D. L., Zhou, Y., Zhao, X. P., Lv, L. L., Zhang, C. C. et al. (2018). Development and utilization of introgression lines suing synthetic Octaploid wheat (Aegilops tauschii × Hexaploid wheat) as donor. Frontiers in Plant Science, 9, 1113. DOI 10.3389/fpls.2018.01113.
7. Lopez-Zuniga, L. O., Wolters, P., Davis, S., Weldekindan, T., Kolkman, J. M. et al. (2019). Using maize chromosome segment substitution line population for the identification of loci associated with multiple disease resistance. G3(Bethesda), 9(1), 189–201.
8. Li, P. T., Rashid, M. H., Chen, T. T., Lu, Q. W., Ge, Q. et al. (2019). Transcriptomic and biochemical analysis of upland cotton (Gossypium hirsutum) and a chromosome segment substitution line from G. hirsutum × G. barbadense in response to Verticillium dahliae infection. BMC Plant Biology, 19(1), 19. DOI 10.1186/s12870-018-1619-4. [Google Scholar] [CrossRef]
9. Kim, H. J., Triplett, B. A. (2001). Cotton fiber growth in planta and in vitro. Models for plant cell elongation and cell wall biogenesis. Plant Physiology, 127(4), 1361–1366. DOI 10.1104/pp.010724. [Google Scholar] [CrossRef]
10. Lee, J. J., Woodward, A. W., Chen, Z. J. (2007). Gene expression changes and early events in cotton fiber development. Annals of Botany, 100(7), 1391–1401. DOI 10.1093/aob/mcm232. [Google Scholar] [CrossRef]
11. Niu, E. L., Shang, X. G., Cheng, C. Z., Bao, J. H., Zeng, Y. D. et al. (2015). Comprehensive analysis of the COBRA-Like (COBL) gene family in Gossypium identifies two COBLs potentially associated with fiber quality. PLoS One, 10(12), e0145725. DOI 10.1371/journal.pone.0145725. [Google Scholar] [CrossRef]
12. Zhang, T. Z., Hu, Y., Jiang, W. K., Fang, L., Guan, X. Y. et al. (2015). Sequencing of allotetraploid cotton (Gossypium hirsutum L. acc. TM-1) provides a resource for fiber improvement. Nature Biotechnology, 33(5), 531–537. DOI 10.1038/nbt.3207. [Google Scholar] [CrossRef]
13. Li, F. G., Fan, G. Y., Lu, C. R., Xiao, G. H., Zou, C. S. et al. (2015). Genome sequence of cultivated Upland cottton (Gossypium hirsutum TM-1) provides insights into genome evolution. Nature Biotechnology, 33(5), 524–530. DOI 10.1038/nbt.3208. [Google Scholar] [CrossRef]
14. Wang, M. J., Tu, L. L., Yuan, D. J., Zhu, D., Shen, C. et al. (2019). Reference genome sequences of two cultivated allotetraploid cottons, Gossypium hirsutum and Gossypium barbadense. Nature Genetics, 51(2), 224–229. DOI 10.1038/s41588-018-0282-x.
15. Hu, Y., Chen, J. D., Fang, L., Zhang, Z. Y., Ma, W. et al. (2019). Gossypium barbadense and Gosspium hirsutum genome provide insights into the origin and evolution of allotetraploid cotton. Nature Genetics, 51(4), 739–748. DOI 10.1038/s41588-019-0371-5. [Google Scholar] [CrossRef]
16. Li, P. T., Wang, M., Lu, Q. W., Ge, Q., Rashid, M. H. et al. (2017). Comparative transcriptome analysis of cotton fiber development of Upland cotton (Gossypium hirsutum) and chromosome segment substitution lines from G. hirsutum × G. barbadense. BMC Genomics, 18(1), 705. DOI 10.1186/s12864-017-4077-8. [Google Scholar] [CrossRef]
17. Kunar, V., Singh, B., Singh, S. K., Rai, K. M., Singh, S. P. et al. (2018). Role of GhHDA5 in H3K9 deacetylation and fiber initiation in Gossypium hirsutum. Plant Journal, 95(6), 1069–1083. DOI 10.1111/tpj.14011.
18. Wang, K., Wang, D. H., Zheng, X. M., Qin, A., Zhou, J. et al. (2019). Multi-strategic RNA-seq analysis reveals a high-resolution transcriptional landscape in cotton. Nature Communications, 10(1), 4714. DOI 10.1038/s41467-019-12575-x. [Google Scholar] [CrossRef]
19. Wang, Q. Q., Liu, F., Chen, X. S., Ma, X. J., Zeng, H. Q. et al. (2010). Transcriptome profiling of early developing cotton fiber by deep-sequencing reveals significantly differential expression of genes in a fuzzless/lintless mutant. Genomics, 96(6), 369–376. DOI 10.1016/j.ygeno.2010.08.009. [Google Scholar] [CrossRef]
20. Padmalatha, K. V., Dhandapani, G., Kanakachari, M., Kumar, S., Dass, A. et al. (2012). Genome-wide transcriptomic analysis of cotton under drought stress reveal significant down-regulation of genes and pathways involved in fibre elongation and up-regulation of defense responsive genes. Plant Molecular Biology, 78(3), 223–246. DOI 10.1007/s11103-011-9857-y.
21. Yoo, M. J., Wende, J. F. (2014). Comparative evolutionary and developmental dynamics of the cotton (Gossypium hirsutum) fiber transcriptome. PLoS Genetics, 10(1), e1004073. DOI 10.1371/journal.pgen.1004073.
22. Gong, W. F., He, S. P., Tian, J. H., Sun, J. L., Pan, Z. E. et al. (2014). Comparison of the transcriptome between two cotton lines of different fiber color and quality. PLoS One, 9(11), e112966. DOI 10.1371/journal.pone.0112966.
23. Qin, Y., Wei, H. L., Sun, H. R., Sun, H. R., Hao, P. B. et al. (2017). Proteomic analysis of differences in fiber development between wild and cultivated Gossypium hirsutum L. Journal of Proteome Research, 16(8), 2811–2824. DOI 10.1021/acs.jproteome.7b00122. [Google Scholar] [CrossRef]
24. Mortazavi, A., Williams, B. A., McCue, K., Schaeffer, L., Wold, B. (2008). Mapping and quantifying mammalian transcriptomes by RNA-seq. Nature Methods, 5(7), 621–628. DOI 10.1038/nmeth.1226. [Google Scholar] [CrossRef]
25. Feng, J., Meyer, C. A., Wang, Q., Liu, J. S., Liu, X. S. et al. (2012). GFOLD: A generalized fold change for ranking differentially expressed genes from RNA-seq data. Bioinformatics, 28(21), 2782–2788. DOI 10.1093/bioinformatics/bts515. [Google Scholar] [CrossRef]
26. Livaka, K. J., Schmittgen, T. D. (2001). Analysis of relative gene expression data using real-time quantitative PCR and the 2–ΔΔCT method. Methods, 25(4), 402–408. DOI 10.1006/meth.2001.1262. [Google Scholar] [CrossRef]
27. Lu, Q. W., Shi, Y. Z., Xiao, X. H., Li, P. T., Gong, J. W. et al. (2017). Transcriptome analysis suggests that chromosome introgression fragments from sea island cotton (Gossypium barbadense) increase fiber strength in upland cotton (Gossypium hirsutum). G3(Bethesda), 7(10), 3469–3479. [Google Scholar]
28. Zentella, R., Sui, N., Barnhill, B., Hsieh, W. P., Hu, J. H. et al. (2017). The Arabidopsis O-fucosyltransferase SPINDLY activates nuclear growth repressor DELLA. Nature Chemical Biology, 13(5), 479–485. DOI 10.1038/nchembio.2320. [Google Scholar] [CrossRef]
29. Bao, A. L., Zhao, Z. Q., Ding, G. D., Shi, L., Xu, F. S. et al. (2015). The stable level of Glutamine synthetase 2 plays an important role in rice growth and in carbon-nitrogen metabolic balance. International Journal of Molecular Sciences, 16(6), 12713–12736. DOI 10.3390/ijms160612713.
30. Zhang, D. Y., Wan, Q., He, X. L., Ning, L. H., Huang, Y. H. et al. (2016). Genome-wide characterization of the ankyrin repeats gene family under salt stress in soybean. Science of the Total Environment, 568, 899–909. DOI 10.1016/j.scitotenv.2016.06.078. [Google Scholar] [CrossRef]
31. Qin, Y., Sun, H. R., Hao, P. B., Wang, H. T., Wang, C. C. et al. (2019). Transcriptome analysis reveals differences in the mechanisms of fiber initiation and elongation between long- and short-fiber cotton (Gossypium hirsutum L.) lines. BMC Genomics, 20(1), 633. DOI 10.1186/s12864-019-5986-5. [Google Scholar] [CrossRef]
32. Ding, M. Q., Jiang, Y. R., Cao, Y. F., Lin, L. F., He, S. E. et al. (2014). Gene expression profile analysis of Ligon lintless-1 (Li1) mutant reveals important genes and pathways in cotton leaf and fiber development. Gene, 535(2), 273–285. DOI 10.1016/j.gene.2013.11.017. [Google Scholar] [CrossRef]
33. Schippers, J. H., Nunes-Nesi, A., Apetrei, R., Hille, J., Fernie, A. R. et al. (2008). The Arabidopsis onset of leaf death5 mutation of quinolinate synthase affects nicotinamide dinucleotide biosynthesis and causes early ageing. Plant Cell, 20(10), 2909–2925. DOI 10.1105/tpc.107.056341. [Google Scholar] [CrossRef]
34. Li, M., Li, G. X., Liu, W., Dong, X. M., Zhang, A. N. (2019). Genome-wide analysis of the NF-Y gene family in peach (Prunus persica L.). BMC Genomics, 20(1), 612. DOI 10.1186/s12864-019-5968-7. [Google Scholar] [CrossRef]
35. Chen, X. D., Guo, W. Z., Liu, B. L., Zhang, Y. M., Song, X. L. et al. (2012). Molecular mechanisms of fiber differential development between G. barbadense and G. hirsutum revealed by genetical genomics. PLoS One, 7(1), e30056. DOI 10.1371/journal.pone.0030056. [Google Scholar] [CrossRef]
36. Gao, Z. Y., Sun, W. J., Wang, J., Zhao, C. Y., Zuo, K. J. (2019). GhbHLH18 negatively regulated fiber strength and length by enhancing lignin biosyntheis in cotton fibers. Plant Science, 286, 7–16. DOI 10.1016/j.plantsci.2019.05.020. [Google Scholar] [CrossRef]
37. Zhang, C., Li, L. B., Liu, Q. B., Gu, L. J. Huang, J. Q. et al. (2019). Identification of loci and candidate genes responsible for fiber length in Upland cotton (Gossypium hirsutum L.) via association mapping and linkage analyses. Frontiers in Plant Science, 10, 53. DOI 10.3389/fpls.2019.00053. [Google Scholar] [CrossRef]
38. Wu, M., Li, L. Y., Liu, G. Y., Li, X. H., Pei, W. F. et al. (2019). Differentially expressed genes between two groups of backcross inbred lines differing in fiber length development from Upland × Pima cotton. Molecular Biology Reports, 46(1), 1199–1212. DOI 10.1007/s11033-019-04589-x. [Google Scholar] [CrossRef]
39. Naoumkina, M., Thyssen, G. N., Fang, D. D., Jenkins, J. N., McCarty, J. C. et al. (2019). Genetic and transcriptomic dissection of the fiber length trait from a cotton (Gossypium hirsutum L.) MAGIC population. BMC Genomics, 20(1), 112. DOI 10.1186/s12864-019-5427-5. [Google Scholar] [CrossRef]
40. Ma, J. J., Geng, Y. H., Pei, W. F., Wu, M., Li, X. L. et al. (2018). Genetic variation of dynamic fiber elongation and developmental quantitative trait locus mapping of fiber length in upland cotton (Gossypium hirsutum L.). BMC Genomics, 19(1), 882. DOI 10.1186/s12864-018-5309-2. [Google Scholar] [CrossRef]
Table S1: Summary of the transcriptome sequencing results
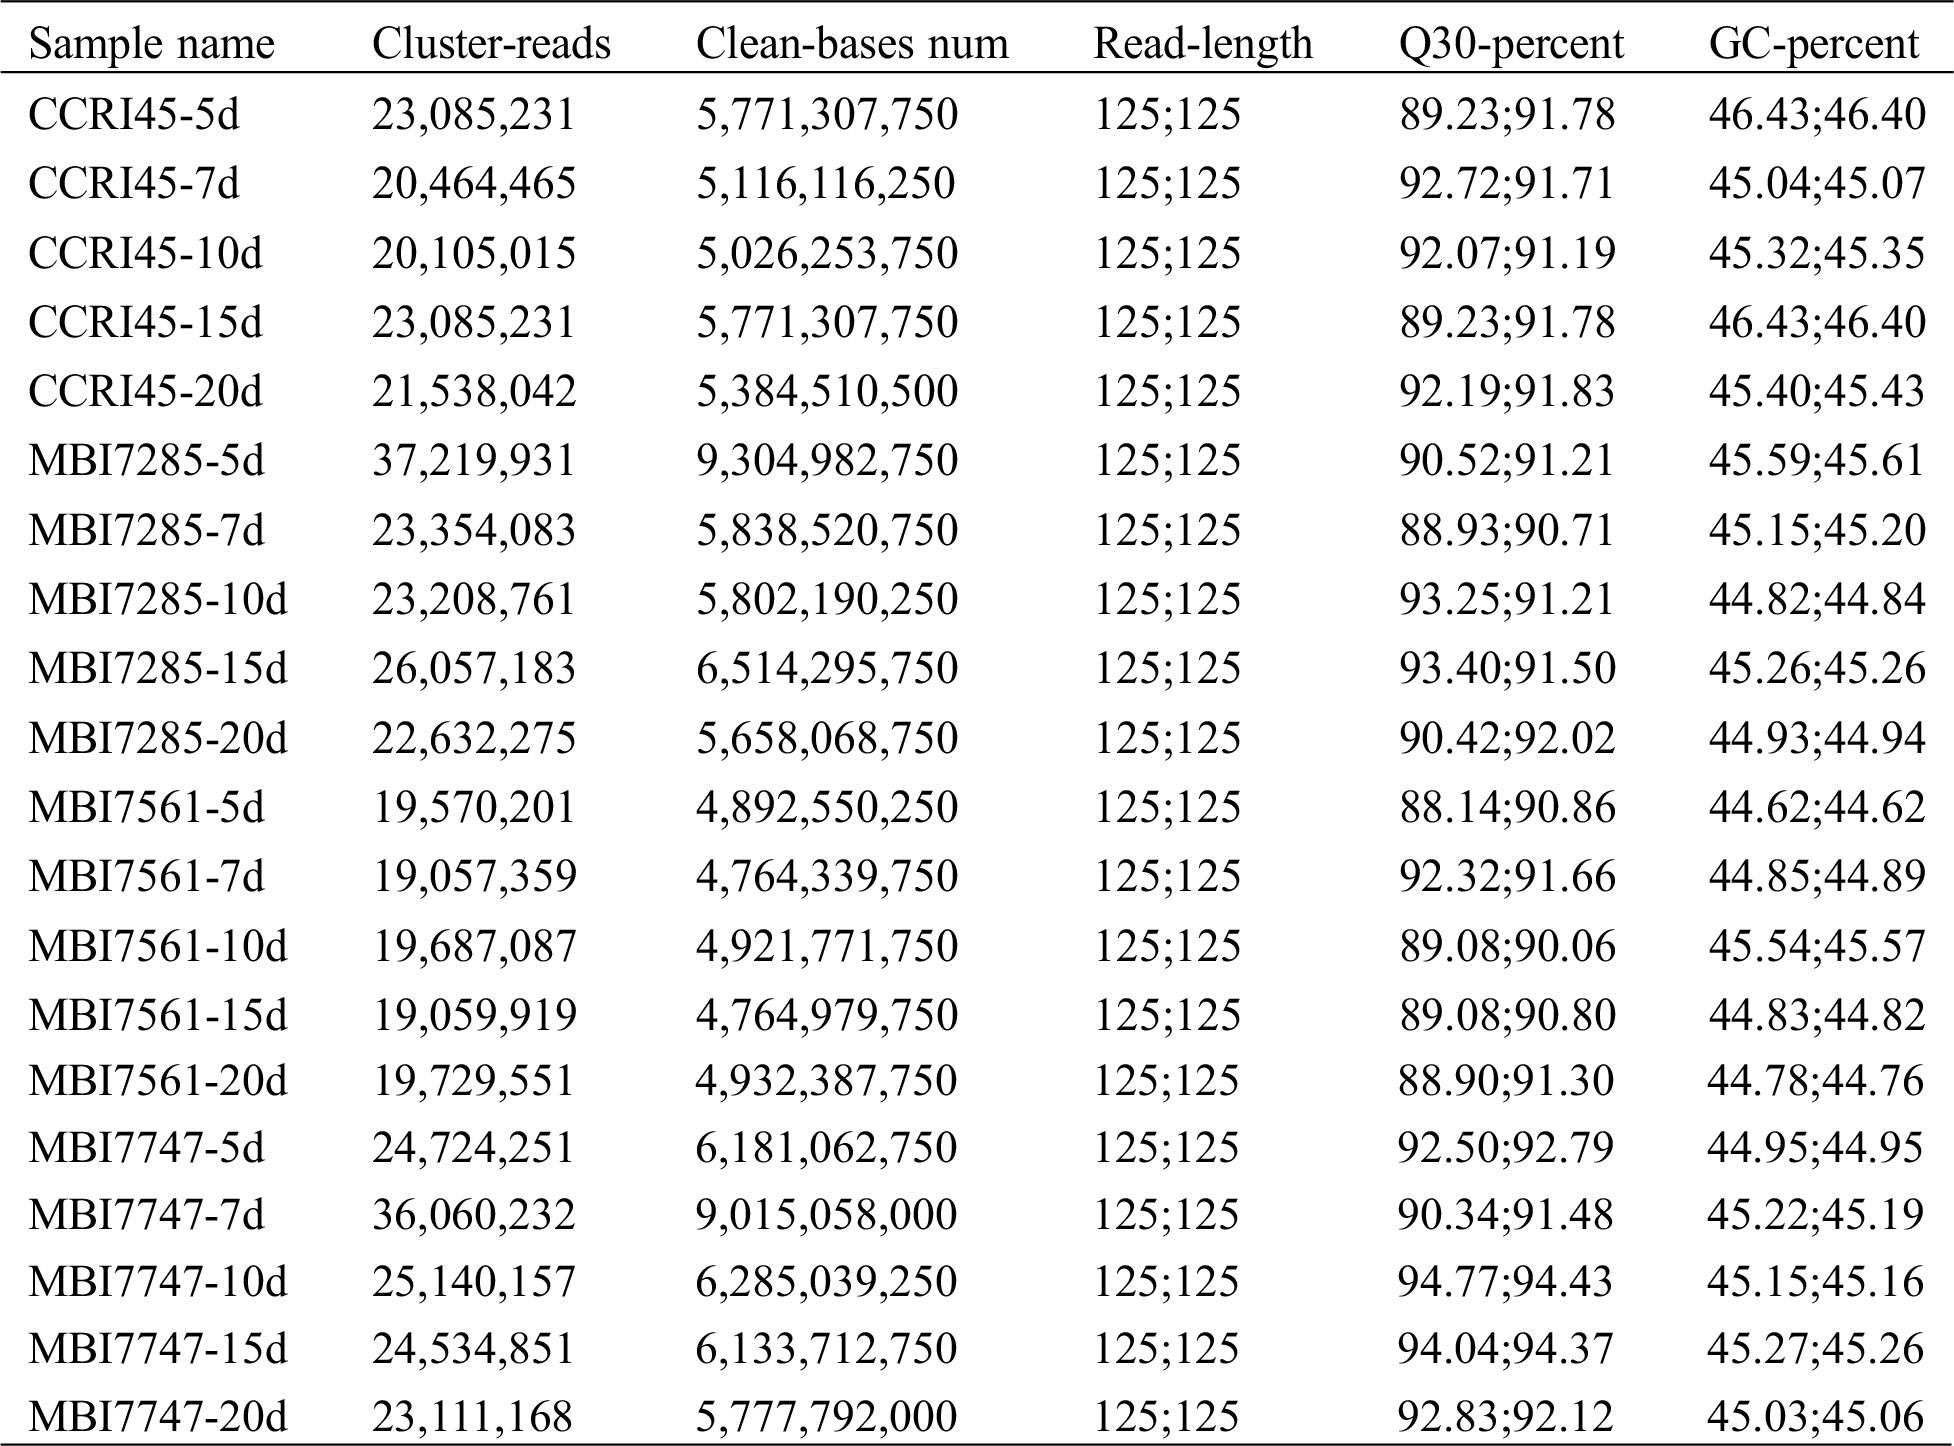
Table S2: Primers used for qRT-PCR validation