International Journal of
Experimental Botany
| Phyton- International Journal of Experimental Botany |
DOI: 10.32604/phyton.2021.014437
ARTICLE
Rapid Identification of a Candidate Gene Related to Fiber Strength Using a Superior Chromosome Segment Substitution Line from Gossypium hirsutum × Gossypium barbadense via Bulked Segregant RNA-Sequencing
1State Key Laboratory of Cotton Biology, Key Laboratory of Biological and Genetic Breeding of Cotton, The Ministry of Agriculture, Institute of Cotton Research, Chinese Academy of Agricultural Sciences, Anyang, 455000, China
2School of Biotechnology and Food Engineering, Anyang Institute of Technology, Anyang, 455000, China
3Zhengzhou Research Base, State Key Laboratory of Cotton Biology, Zhengzhou University, Zhengzhou, 450001, China
*Corresponding Authors: Yuzhen Shi. Email: shiyuzhen@caas.cn; Youlu Yuan. Email: yuanyoulu@caas.cn
Received: 26 September 2020; Accepted: 09 December 2020
#These authors made equal contributions
Abstract: Cotton is the most widely cultivated commercial crop producing natural fiber around the world. As a critical trait for fiber quality, fiber strength principally determined during the secondary wall thickening period. Based on the developed BC5F3:5 CSSLs (chromosome segment substitution lines) from Gossypium hirsutum CCRI36 × G. barbadense Hai 1, the superior MBI9915 was chosen to construct the secondary segregated population BC7F2 with its recurrent parent CCRI36, which was subsequently subjected to Bulk segregant RNA-sequencing (BSR-seq) for rapid identification of candidate genes related to fiber strength. A total of 4 fiber-transcriptome libraries were separately constructed and sequenced, including two parents (CCRI36 and MBI9915) and two extreme pools at 20 DPA (days post anathesis). Through multiple comparisons, 536 DEGs (differentially expressed genes) were overlapped at 20 DPA. Allelic-polymorphism comparison in mRNA sequences revealed 831 highly probable SNPs between two extreme pools related to fiber strength. Linkage analysis was performed between two extreme pools with SNP-index method. Eighteen correlated regions with 1981 annotation genes were obtained between two pools at 20 DPA, of which 12 common DEGs were similarly identified both between two parents and two pools. One gene (Gh_A07G0837) in the candidate region related to fiber strength was differentially expressed in both parents and extreme pools and involved in fiber strength development through reactive oxygen species (ROS) activity. Co-expression analysis of Gh_A07G0837 showed that Gh_A07G0837 may cooperate with other genes to regulate fiber strength. The reliability of BSR-seq results was validated by the quantitative real-time PCR (qRT-PCR) experiments on 5 common DGEs 20 DPA. Co-expressed analysis results indicated that there were some genes expressed especially low in MBI9915, resulting in good fiber strength. Focusing on bulked segregant analysis on the extreme pools derived from superior CSSL population, this study indicates that BSR-seq can be efficiently applied on rapid identification of candidate genes related to fiber strength, which make contributions to our understanding of fiber quality formation in cotton.
Keywords: Cotton; Fiber strength; CSSLs; BSR-seq; gene clone; co-expressed analysis
Cotton is one of the most important commercial crops all over the world, providing the major natural fibers for the textile industry. With the development of modern industry and people’s living standard, higher requirements have been put forward for modern textile mills to achieve better spinning performance [1]. Therefore, obtaining the high-quality fiber has been the vital goal in cotton breeding currently, yet due to genetic-basis complexities of fiber formation, it remains a challenging task for cotton researchers.
There are four cultivated species of Gossypium, namely diploid G. herbaceum and G. arboretum (2n = 2× = 26) and tetraploid G. hirsutum (Upland cotton) and G. barbadense (Sea Island cotton) (2n = 4× = 52) [2,3]. Among them, G. hirsutum and G. barbadense are the most widely cultivated cotton species and can contribute more than 95% fiber production per year, of which the former harbors the characteristics of high yield and moderate fiber performance, and the latter has the advantages of the premium fiber quality yet subjected to the disadvantage of low yield [4,5]. As a new thought in adequate utilization and integration of excellent traits derived from Upland and Sea Island cotton, Chromosome Segment Substitution Lines (CSSLs) lays the theoretical foundation of developing new cotton varieties with high yield, fine quality. The CSSLs are subjected to multi-generation backcrosses with the recurrent parent and subsequently multi-generation self-crosses, combining marker-assisted selection (MAS) to ultimately obtain the Near-isogenic lines (NILs). The CSSLs are the ideal materials for dividing the complex and variable quantitative traits or phenotypes into a single inheritance factor. Therefore, CSSLs have been widely applied to mapping quantitative traits loci (QTL) in tomato (Lycopersicon esculentum) [6], rice (Oryza sativa) [7], wheat (Triticum aestivum) [8], maize (Zea mays) [9], soybean (Glycine max) [10], and cotton [11–13].
Cotton fiber derived from ovule epidermal cells is a single-celled seed trichome. Although all the ovule epidermal cells in cotton have the potential to differentiate into fibers, only 15–25% of them can eventually develop into mature fibers [14].The development of cotton fiber can be divided into five overlapping stages: initiation (−3 to +3 DPA), elongation (3 to 23 DPA), transition, secondary wall synthesis (16 to 40 DPA), and maturation (40 to 50 DPA) [15], which collectively affect the quality traits of fiber quality, including fiber length, strength, micronaire, elongation, and uniformity [16]. With the rapid development of high-through sequencing technology and complete release of Gossypium genomes [17–23], more efficient strategies have been applied to identifying the genes responsible for fiber length and strength in cotton. The study combined re-sequencing technology and genome-wide association study (GWAS) strategy to identify Gh_A10G1256 associated with fiber length, and Gh_A07G1767, Gh_A07G1768, and Gh_A07G1769 related to fiber-strength [24]. Through fine mapping of stable QTL and quantitative real-time PCR (qRT-PCR) verification, a LRR-RLK (leucine-rich repeat protein kinase) family protein (Gh_A07G1749) was identified as a candidate gene for fiber-strength qFS07.1 [25]. Transcriptome analysis was performed on three CSSLs derived from CCRI36 (G. hirsutum) and Hai 1 (G. barbadense) during the secondary wall thickening period, and three differentially expressed genes (DEGs), namely XLOC_036333 (MNS1), XLOC_029945 (FLA8), and XLOC_075372 (snakin-1), were screened to play the significant roles in regulating fiber strength [26]. Therefore, new ways of identifying major QTL for fiber strength in cotton are still needed.
Due to bulked segregant analysis (BAS) method and RNA-seq technology, BSR (bulked segregant RNA-seq) can not only identify the DEGs by comparing the two constructed extreme pools, but also screen the SNPs (single nucleotide polymorphisms) co-isolated with mutant genes by linkage analysis [27]. Due to saving plenty of manpower, material resources, and shortening the breeding cycle, BSR-seq has attracted more attention in recent years, which has been an efficient strategy for rapid QTL mapping and efficient identification of candidate genes in connection with key traits in plants [27–30]. A candidate gene (GRMZM2G055704) responding to waterlogging was identified by BSR-Seq method on waterlogging sensitive and resistant pools in maize [31]. In order to screen the genes responsive to early and late flowering in tree peony, BSR-seq association analysis obtained 291 unigenes, of which 7 DEGs (c42942.graph_c0, c58332.graph_c0, c58361.graph_c0, c57417.graph_c0, c46352.graph_c0, c53143.graph_c0, and c58526.graph_c0) were confirmed to relate with early and late flowering [32]. But it is rare to use CSSL population with BSR method to map fiber strength related genes in cotton.
In the present study, the high-yield and superior-fiber CSSL, MBI9915, was chosen to develop the secondary segregation population BC7F2 with CCRI36. MBI995 was derived from BC5F3:5 CSSL populations constructed by G. barbadense Hai 1 as the donor parent and G. hisutum CCRI36 as the recipient and recurrent parent in the previous study [33]. In light of significant traits of fiber strength on fiber quality, we performed BSR-seq analysis on the fiber samples collected from two parents (MBI9915 and CCRI36) and two extreme pools at 20 DPA, respectively. Plenty of DEGs were identified with comparisons between different samples, DEGs subsequently underwent GO functional enrichment and KEGG pathway analysis. Through SNP-index association analysis method and qRT-PCR technology, candidate genes were finally screened to control fiber strength. These results provide a rapid and efficient method to screen the candidate genes by BSR-seq, which will facilitate the revelation of molecular mechanism of fiber formation in cotton.
Two parents, the superior CSSL MBI9915 and its recurrent parent CCRI36, as well as their segregation population BC7F2 were planted at the Anyang experimental farm of Institute of Cotton Research of Chinese Academy of Agricultural Sciences (Anyang, Henan Province) in 2016, where BC7F2:3 populations were planted through plant-to-row method in 2017. The high-yield and wide-adaptability Upland cotton CCRI36 as the recipient parent, and good-quality and disease-resistance Sea Island cotton Hai1 as the donor parent were chosen to conduct the hybridization in 2003, of which the offspring F1 was subsequently subjected to five generations of backcrosses with the recurrent parent CCRI36 and three generations of self-crossings, eventually obtaining the developed BC5F3:5 CSSLs with plant-to-row and plant-to-family method, respectively [33,34]. Based on the multi-year and multi-environment trait surveys, MBI9915 harboring the high-yield and superior-quality fiber was chosen for secondary population construction, and then underwent two-generation backcrossing with CCRI36 and one-generation self-crossing to develop BC7F2 and BC7F2:3 populations, which were planted with row length of 8 m, row spacing of 0.8 m, and plant spacing of 0.25 m.
Naturally opened bolls from the BC7F2 population were harvested per plant in 2016, while 30 naturally opened bolls from BC7F2:3 population per row were harvested in 2017, of which the fiber quality traits (including fiber length, strength, micronaire, elongation, and uniformity) were tested with HFT9000 using HVICC international calibration cotton samples in the Cotton Quality Supervision and Testing Center of the Ministry of Agriculture of China.
Regarding the day tagging flowers as 0 DPA, 1 developing bolls of fiber samples were taken from MBI9915 and CCRI36 at 20 DPA were immediately immersed in ice. Comprehensive consideration on the fiber performances of both BC7F2 and BC7F2:3, 16 ones with high fiber strength and 16 ones with low fiber strength were separately selected from BC7F2:3 lines at 20 DPA to construct high and low extreme pools. After being dissected from the developing bolls, fiber sampled were quickly frozen into the liquid nitrogen, and subsequently stored at −80°C. RNA extractions were conducted on each plant, and the obtained RNA samples were equally mixed to construct the extreme pools. RNA prep Pure Plant Kit (Tiangen, Beijing, China) was used to extract high-quality RNA samples. The quality and quantity of the RNA were verified using 1% agarose gel and spectrophotometer (Nanodrop 2000, Thermo Scientific, USA).
2.4 Library Construction and Transcriptome Sequencing
First, high-quality mRNA was enriched from total RNA using Oligo (dT) magnetic beads, and was randomly cleaved into short fragments by fragmentation buffer, then double-chain cDNA was synthesized with mRNA as a template. After purification, the cDNA segments were utilized to construct the cDNA libraries through end-repair, adding the tail of the ploy A, and selecting the size of the fragments. At last, the cDNA libraries were obtained by PCR amplification, and a total of 4 RNA libraries were sequenced using Illumina HiSeqTM 4000 sequence platform (Biomarker Technologies Corporation, Beijing, China).
By high-throughput sequencing, a large amount of raw data was obtained, and stored in FASTQ format file. The raw data was filtered to obtain clean reads. Clean reads were aligned to the reference genome of TM-1 [21], and the position information of reference genome or gene and the sequence characteristic information of the sequencing samples were obtained through STAR software [35].
2.5 Analysis of Differentially Expressed Genes (DEGs)
EBSeq software was used to analyze differentially expressed genes, FPKM (fragments per kb per million of the mapped reads) [36] parameter as an index for reviewing transcripts or gene expression levels. In the detection of differentially expressed genes, Fold Change (FC) ≥ 2 and False Discovery Rate (FDR) ≤ 0.01 are identified as the DEGs screening standard, of which the former represents the ratio of expression between two parents and pools at 20 DPA, and the latter is obtained by correcting the p-value of difference significance. The accepted Benjamini-Hochberg method was used to correct the p-value obtained from the original hypothesis test. In this experiment, p-value ≤ 0.05 was selected as the criterion for screening differentially expressed genes. To understand the functional classification of all the obtained DEGs, BLAST [37] software was used to annotate the coding genes in Gene ontology (GO) and Kyoto Encyclopedia of Genes and Genomes (KEGG) databases [38].
Single nucleotide polymorphism (SNP) callings were processed with GATK [39] software toolkit (http://www.broadinstitute.org/gatk/guide/best-practices.php) with strict filtering of SNPs: SNP cluster filtering, near Indel SNP filtering and neighboring InDel filtering [40]. Before doing correlation analysis, SNPs were filtered again. The criteria were as follows: Firstly, SNP loci with multiple genotypes were filtered out, and then SNP loci with read support less than 4 were filtered out, re-filter SNP loci with identical genotypes between mixing pools and SNP loci with recessive mixing pool genes not from recessive parents. Finally, high-quality SNP loci were obtained for SNP-index analysis. SNP-index method was for marker association analysis based on genotype frequency differences between high fiber strength pool and low fiber strength pool [41,42], which was mainly used to find significant differences in genotype frequencies between high fiber strength pool and low fiber strength pool using Δ(SNP-index). Δ(SNP-index) was calculated by subtracting the SNP-index of high fiber strength pool from low fiber strength pool.
2.7 Quantitative Real-Time PCR (qRT-PCR)
Five genes on chromosome 7 were chosen to conduct quantitative real-time PCR for verifying BSR-seq results. Two parents (CCRI36 and MBI9915) at 20 DPA with three technical replicates were used for qRT-PCR. The cDNAs synthesized by using a HiScript® II Q RT SuperMixfor qPCR (+gDNA wiper) kit (Vazyme Biotech, Nanjing, China). ChamQTM Universal SYBR® qPCR Master Mix (Vazyme Biotech, Nanjing, China) kit for real-time PCR was used for qRT-PCR amplification, which were performed on the ABI 7500 fast Real-Time PCR System (Applied Biosystems, USA), following the protocol of the kit. β-Actin gene (Primer sequence; F:5′-ATCCTCCGTCTTGACCTTG-3′, and R: 5′-TGTCCGTCAGGCAACTCAT-3′) was used as an internal control to normalize the genes expression. The primer sequences of five target genes are enlisted in Tab. S1. The qRT-PCR master mix was prepared as 20 μL, the process was employed according to the following steps: One cycle of 95°C for 30 s; 40 cycle of 95°C for 10 s, 60°C for 30 s; one cycle of 95°C 15s, 60°C for 60 s, 95°C for 15s. 2−ΔΔCt method was followed for obtaining the relative gene expression [43].
2.8 Gene Clone, Phylogenetic Analysis, Gene Structure Prediction and Co-Expression Analysis of Gh_A07G0837
RNAs of CSSL MBI9915 and G. barbadense Hai1 were extracted according to the RNA Isolation method. NCBI Primer-blast Web page was used to design the candidate gene’s primers (F: ATGTTCATTTCTTCTTGTGC, R: TCATAAAACTAAAGGCTCCA). TransScript All-in-one First-Strand cDNA Synthesis SuperMix for PCR kit (Transgen Biotech, Beijing, China) was used to synthesis cDNA and TransStartFastPfu Fly DNA Polymerase kit (Transgen Biotech, Beijing, China) was used for amplifying the coding sequence (CDS) of the candidate gene. PCR conditions were one cycle of 95°C for 2 min; 40 cycles of 95°C for 20 s, 60°C for 20 s, 72°C for 40 s; one cycle of 72°C for 5 min. The product was cloned into pEASY-Blunt Zero vector (Transgen Biotech, Beijing, China) for sequencing.
Alignment of Gh_A07G0837 protein sequences in CCRI36 and Hai1, and in four cultivated species were performed by DNAMAN program and NCBI protein-blast, respectively. The phylogenetic tree of proteins in four cultivated species of Gossypium, CCRI36 and Hai1 was constructed with the MEGA program (version 7.0) by the neighbor joining (NJ) method with 1000 bootstraps [44].
Using the protparam tool in the website of ExPASY, the components of protein encoded by Gh_A07G0837 in two materials were analyzed. The location of proteins are predicted by protcomp 9.0. PredictProtein and Pheyre2 were used to predict the secondary and tertiary structure of proteins, respectively. R (3.3.0) software package (https://CRAN.R-project.org/package=pheatmap) was used to conduct co-expression analysis.
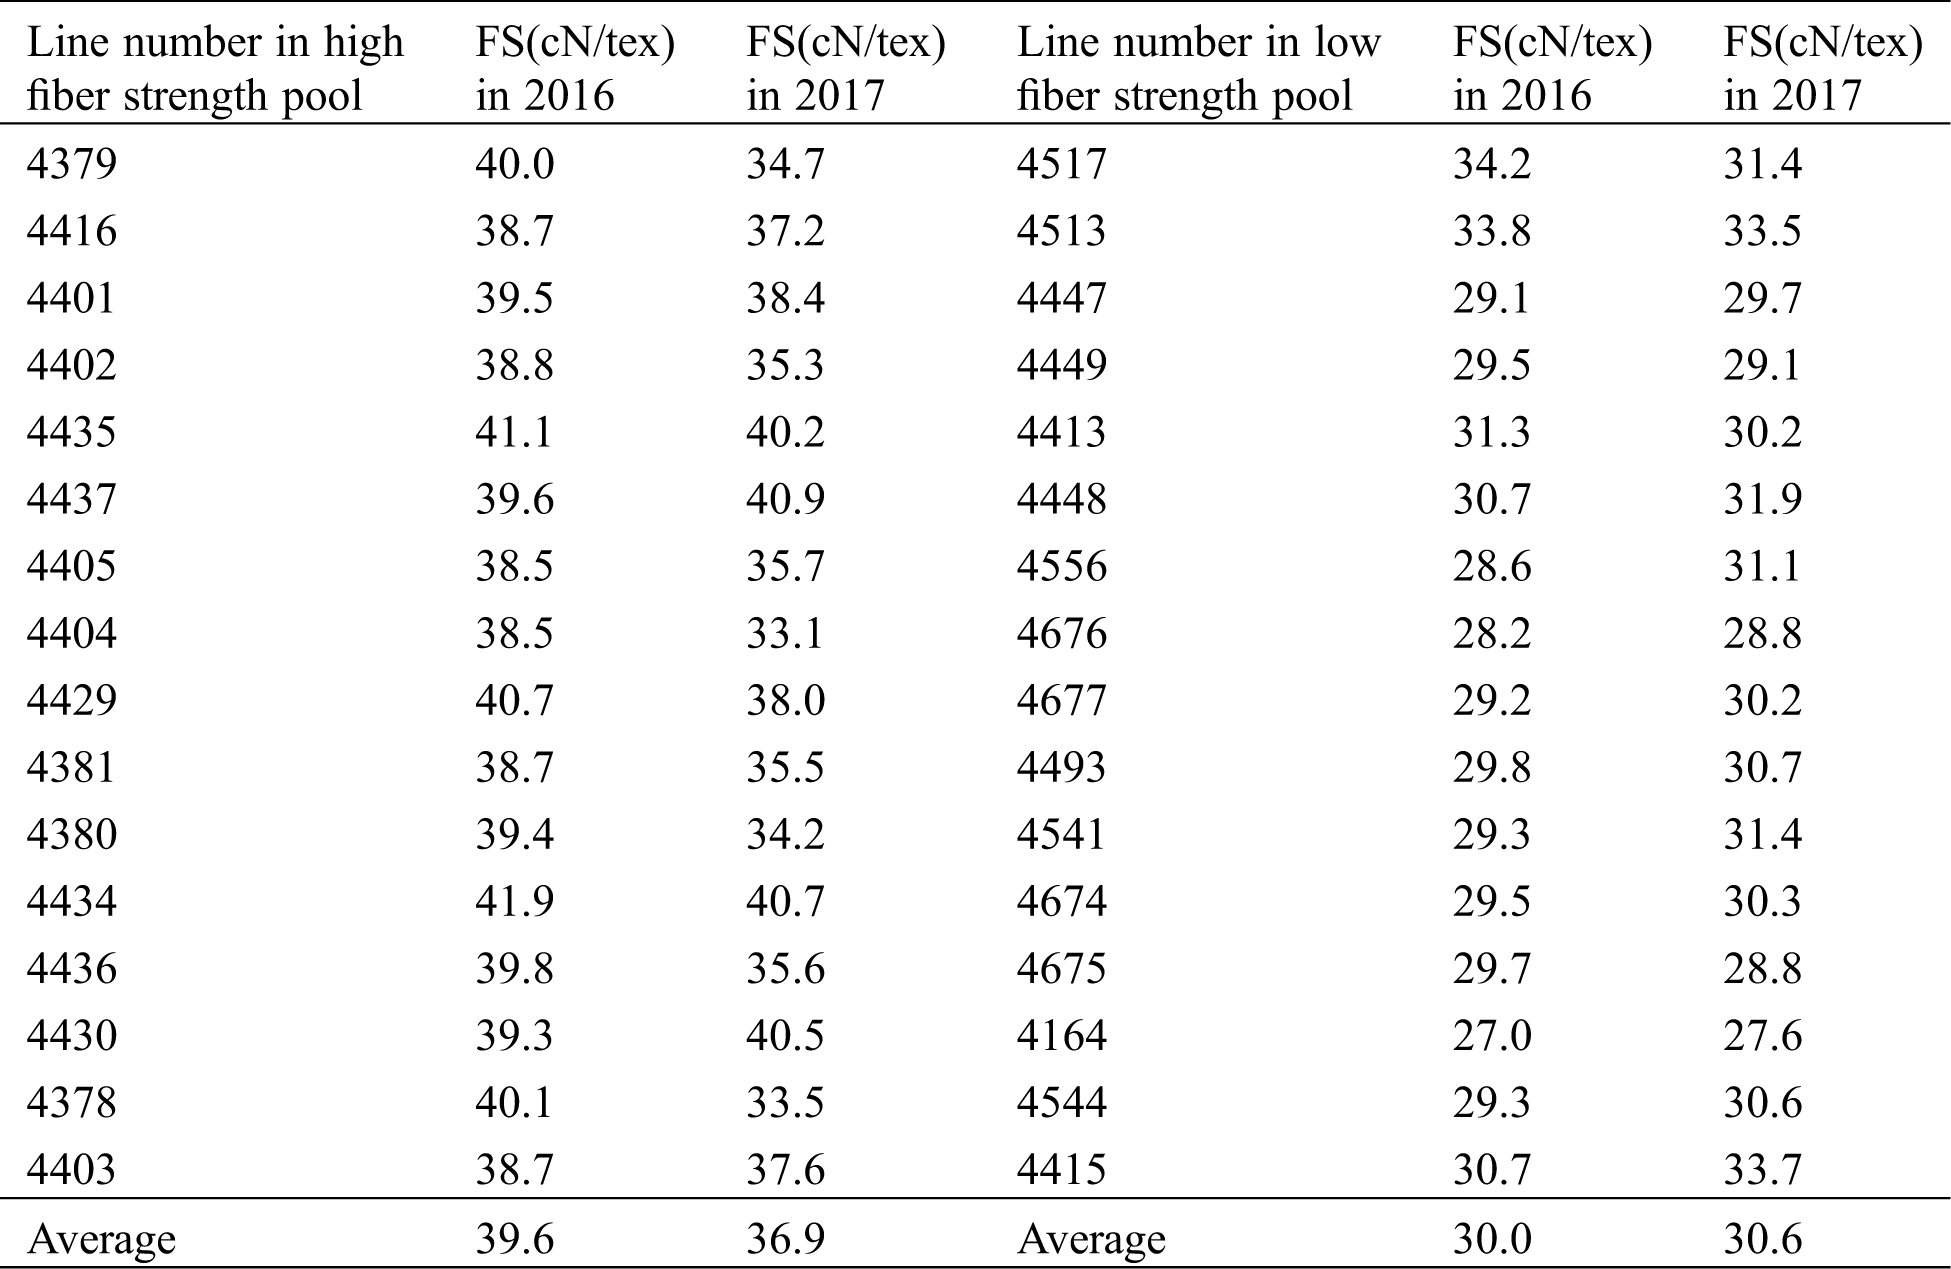
On behalf of taking extreme-pool samples with more accurate phenotypic traits, the chosen individuals from BC7F2 population in 2016 were re-planted with plant-to-row to obtain BC7F2:3 populations in 2017, of which 30 naturally opened bolls were subjected to fiber-quality testing (Tab. 1). The average fiber-strength value of 16 individuals from high extreme pools was 39.6 in 2016, while the corresponding value of 16 individuals from low extreme pools in 2016 was 30.0; the mean fiber-strength values of 16 lines from high and low extreme pools in 2017 were 36.9 and 30.6, respectively. Referring to the fiber-strength comparisons between 2016 and 2017 materials, both higher consistency and significant difference were identified, which directly verified the reliability of sampling the individuals in 2016 for BSR-seq analysis.
Table 1: Phenotypic value of fiber strength for two extreme pools in two years
3.2 Sequence Assembling and Analysis
For rapid identification of candidate genes related to fiber strength, BSR-seq was separately conducted on CCRI36, MBI99915, high and low extreme pools, and the obtained raw reads were then subjected to filtering low-quality reads, totally generating 186.622 million (approximately 27.9G data) clean reads from two parents and 369.247 million (approximately 55.2G data) clean reads from two extreme pools (Tab. 2). Subsequently, all the clean data mapped to the reference genome [21], of which the alignment percentage of mapped reads was over 83.97%, while no less than 68.69% were uniquely mapped reads. Meanwhile, the average percentages of Q30 and GC content were 93.83% and 44.56%, respectively, which laterally proved the reliability of our BSR-seq results.
Table 2: Summary of the BSR-Seq outcomes of 4 separately samples

3.3 Analysis of Differentially Expressed Genes (DEGs)
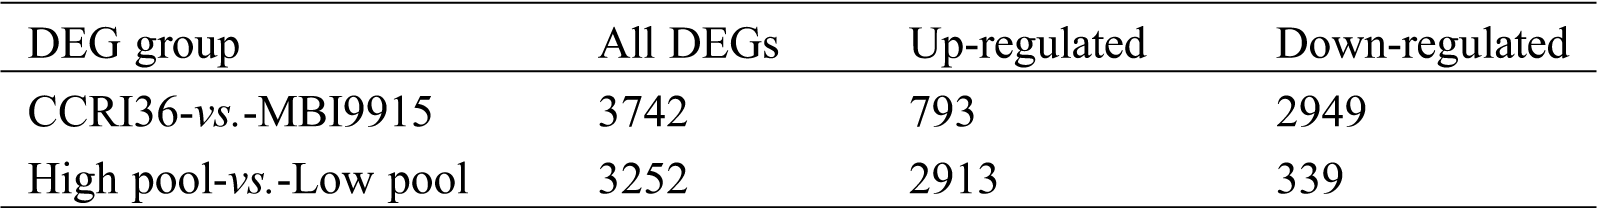
Based on the reference genome TM-1, a large number of differentially expressed genes (Fold change ≥ 2 and FDR < 0.01) were significantly identified by EBSeq [45], to be special 3742 DEGs (793 up-regulated and 2949 down-regulated ones) between the two parents and 3252 DEGs (2913 up-regulated and 339 down-regulated ones) between the extreme pools at 20 DPA (Tab. 3), with 536 genes in common (Fig. 1A). Obviously, there were more DEGs in CCRI45-vs.-MBI9915 group (Fig. 1B) than those in High pool-vs-Low pool group (Fig. 1C), of which the former group identified over 8 times as many down-regulated DEGs, while the latter group identified more than 4 times as many up-regulated DEGs, implying the wide variations between the two groups. Having performing the hierarchical clustering analysis on DEGs from two pairwise-comparison groups, most genes showed diverse expression levels either in two parent groups (Fig. 2A) or in two extreme pools (Fig. 2B), while similar phenomenon occurred on the slight DEGs with high-ratio expression qualities between two groups, which might be closely related to the mechanism and regulation of fiber strength.
GO enrichment analysis was subsequently conducted on the whole DEGs from two parent groups (Fig. 3), two extreme pools (Fig. 3), and common DEGs (Fig. 3), respectively, aiming at identifying the putative functional genes or significant signal pathways during fiber development. Top 20 GO terms were separately enriched into three main categories, and as for the DEGs from both two parents and two extreme pool groups or the common DEGs, cell part and cell were the predominant subcategories in cellular component, catalytic activity and binding were the top subcategories in molecular functional category, and metabolic process, cellular process, and single-organism process were the most enriched subcategories in biological process. In the process of fiber strength enhancement, a lot of secondary wall were come into being, resulting in good fiber strength. DEGs were annotated into these cellular component, molecular functional category and biological process, proved that.
Similarly, the whole DEGs were subjected to KEGG pathway analysis and were mapped onto five top-level subcategories of cellular processing, environmental information processing, genetic information processing, metabolism and organismal systems. At 20 DPA, DEGs in two parent groups (Fig. 4A) were mostly annotated into plant hormone signal transduction (ko04075), carbon metabolism (ko01200), while plant hormone signal transduction (ko04075) and starch and sucrose metabolism (ko00500) were the top two pathway subcategories for DEGs in two pool groups (Fig. 4B). The common DEGs both in two groups were mostly enriched to plant hormone signal transduction (ko04075) pathway subcategories (Fig. 4C). Auxin [36,37], gibberellins [38], brassinosteroid [39], ethylene [40,41], abscisic acid [42,43] and cytokinin [21,44] play important roles in the development of fiber. The results indicated that these DEGs may play important roles in secondary wall thickening and result in fiber enhancement.
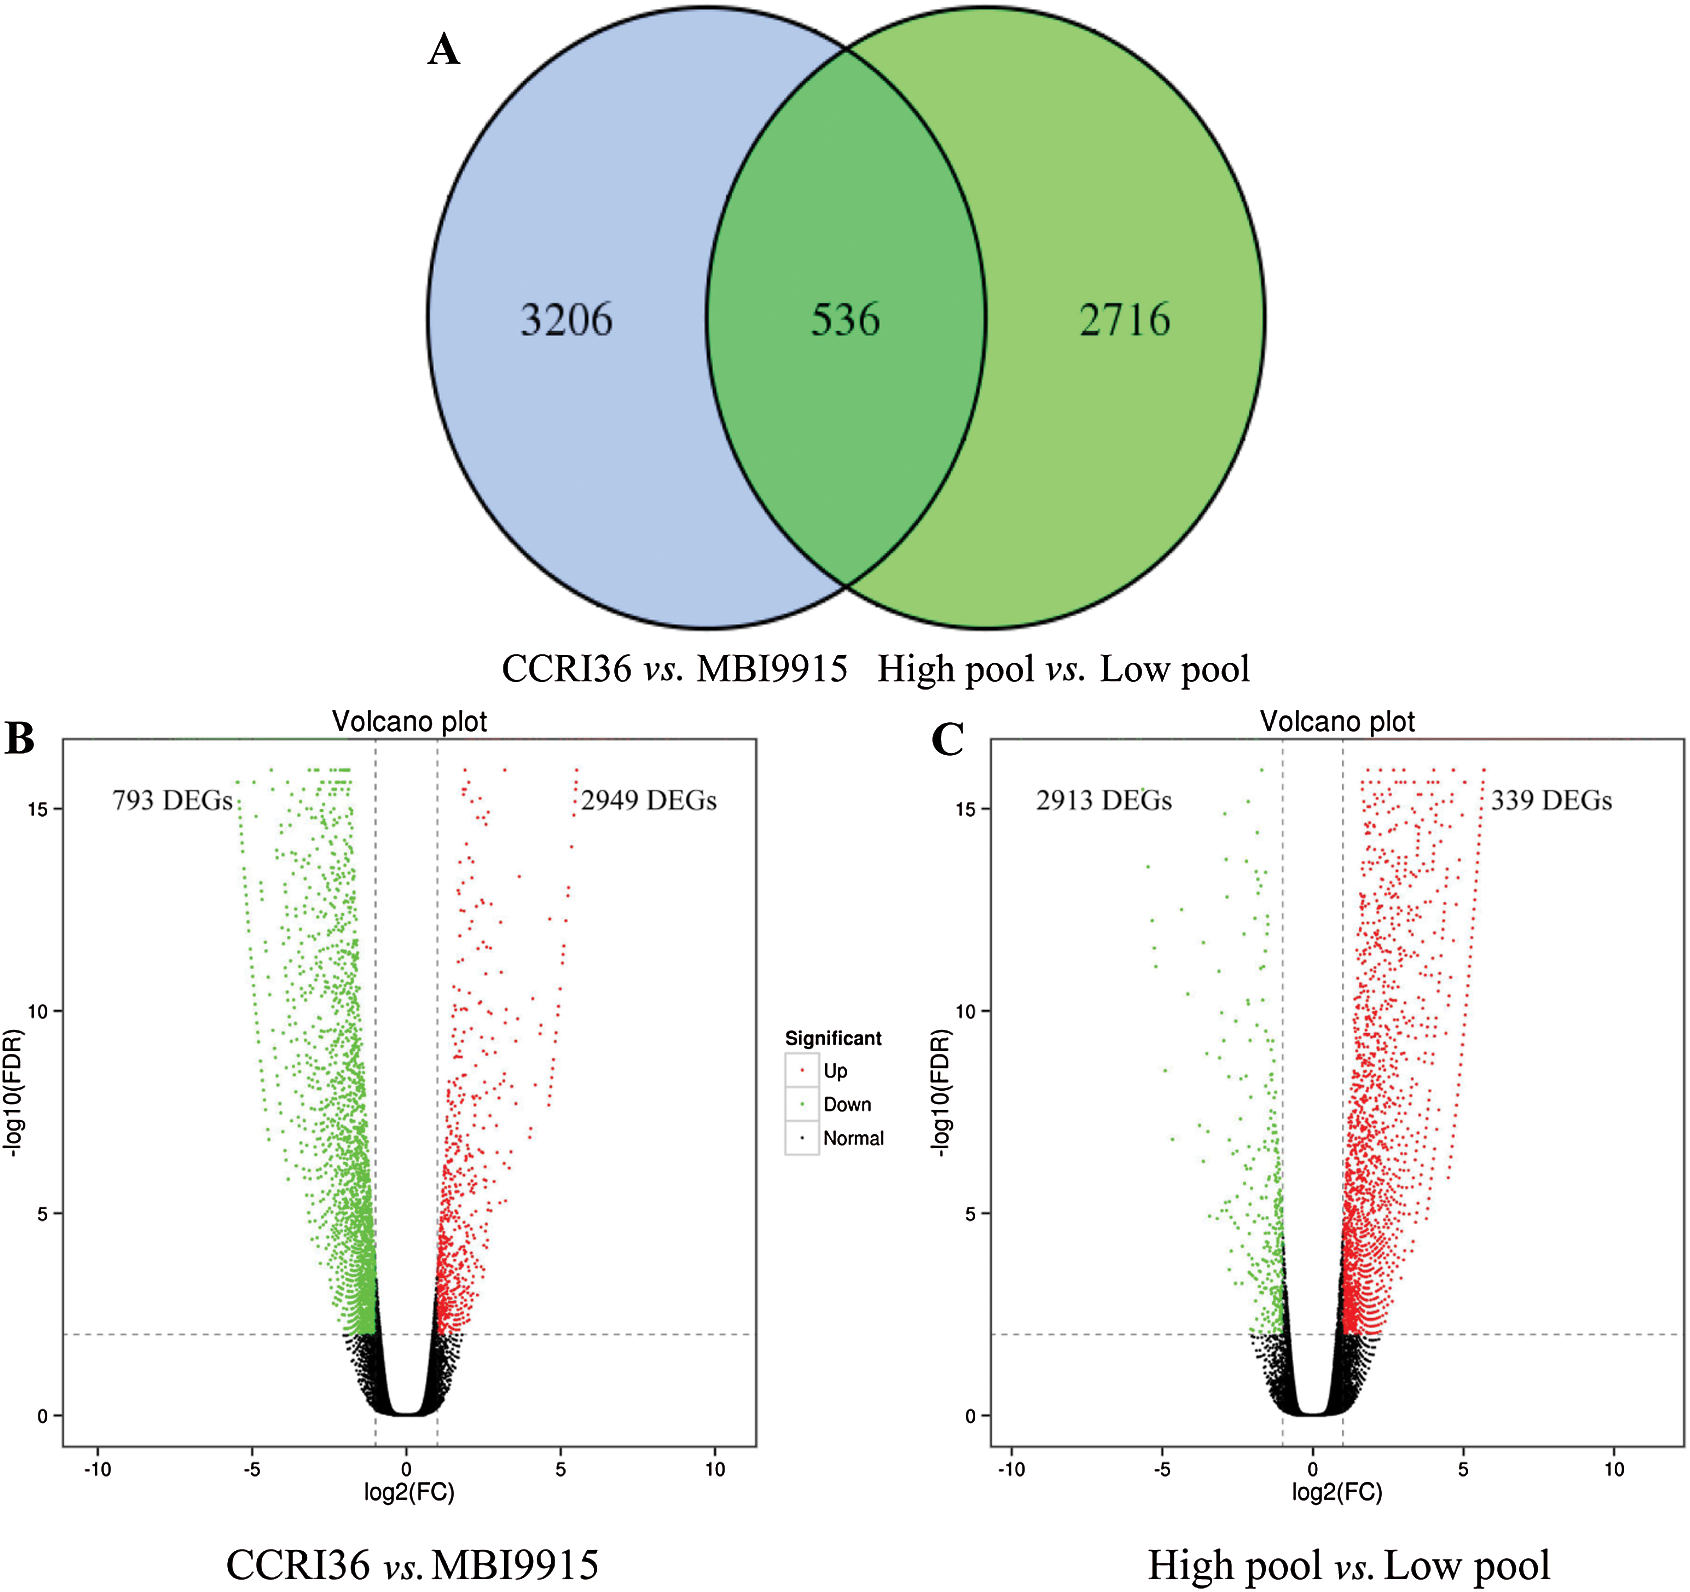
Figure 1: Overlapped DEGs in CCRI36-vs.-MBI9915 and High pool-vs.-Low pool. Volcano plot analysis of differentially expressed genes (DEGs) for the pairwise comparisons CCRI36-vs.-MBI9915 (a) and (b) High pool-vs.-Low pool
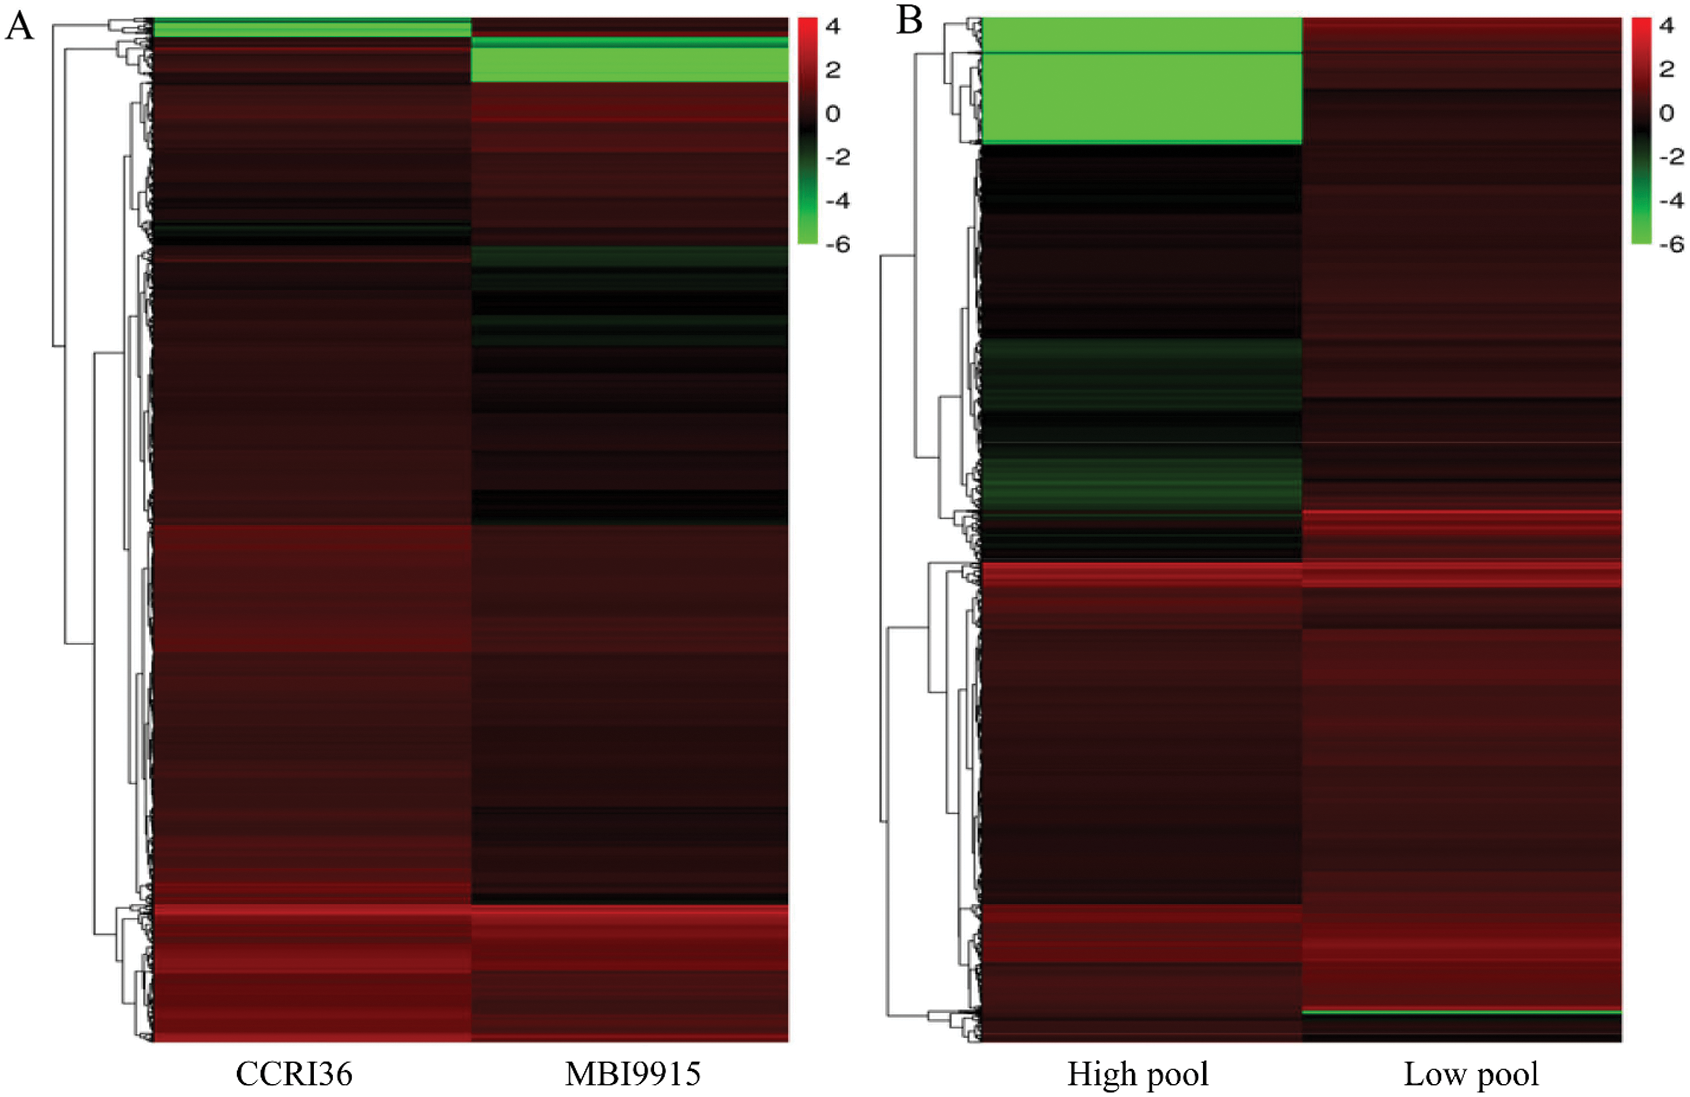
Figure 2: Hierarchical cluster analysis of differentially expressed genes (DEGs) for the pairwise comparisons CCRI36-vs.-MBI9915 (A) and High pool-vs.-Low pool (B). Note: The abscissa represents the name of the sample and the clustering results of the sample, while the ordinate represents the clustering results of the genes. Different columns in the figure represent different samples, and different rows represent different genes. The color represents the level of gene expression (log2FPKM + 1) in the samples
Table 3: The number of differentially expressed genes in 4 samples at 20 DPA
3.4 qRT-PCR Verification of BSR-Seq Results
To confirm the reliability of BSR-seq results, qRT-PCR was performed on the five DEGs from two parents (CCRI36 and MBI9915) at 20 DPA, namely as Gh_A07G0831, Gh_A07G0837, Gh_A07G0838, Gh_A07G0858 and Gh_A07G0973. According to the BSR-seq data, all the five DGEs showed significantly lower expression levels in MBI9915 than those in CCRI36, which presented the similar difference-pattern between two parents in qRT-PCR results Fig. 5. The relative expression of Gh_A07G0831, Gh_A07G0837, Gh_A07G0838, Gh_A07G0858 and Gh_A07G0973 in CCRI36 were significantly higher than that in MBI9915. The qRT-PCR data were consistent with the BSR-seq results, fully demonstrating the reliability of this study.
3.5 Chromosome Region Confirmation and Candidate Gene Identification
To map candidate genes related to fiber strength, BSR-seq analyses were conducted on two extreme pools at 20 DPA, and 16 samples with high fiber strength and 16 samples with low fiber strength were collected and equally mixed for RNA sequencing, respectively. After being trimmed, the clean reads were aligned to the TM-1 reference genome for SNP identifications between high and low fiber-strength pools, resulting in a total of 831 high-probability SNPs via bulked segregant analysis. All the identified SNPs were quantified with SNP-index, of which the information were synthetically compared between high and low fiber-strength pools to calculate and plot the Δ(SNP-index) against the TM-1 reference genome positions (Supplementary Fig. 1). In this study, associated chromosomal regions were identified with |Δ(SNP-index)| > 0.6365 as the threshold value.
Totally, 18 associated chromosomal regions located in 15 chromosomes (8 ones in A sub-genome and 7 ones in D sub-genome) were identified, and there were two different chromosomal regions in chromosome A05, A07, and A09, respectively (Tab. S2). Referred to the TM-1 genome information, a total of 1981 genes were annotated in 18 associated regions, including 141 ones with non-synonymous mutation, which were generally regarded the potential candidate genes involved in fiber strength formation. Meanwhile, GO enrichment and KEGG pathway analyses were conducted on the whole annotated genes, and the most genes were enriched to cell part and cell, catalytic activity and binding, and cellular process and single-organism process in cellular component, molecular function, and biological process based on GO categories (Fig. 6A), while ribosome (ko03010), carbon metabolism (ko01200), biosynthesis of amino acids (ko01230) and protein processing in endoplasmic reticulum (ko04141) were top 4 pathways with the greatest number of genes (Fig. 6B).
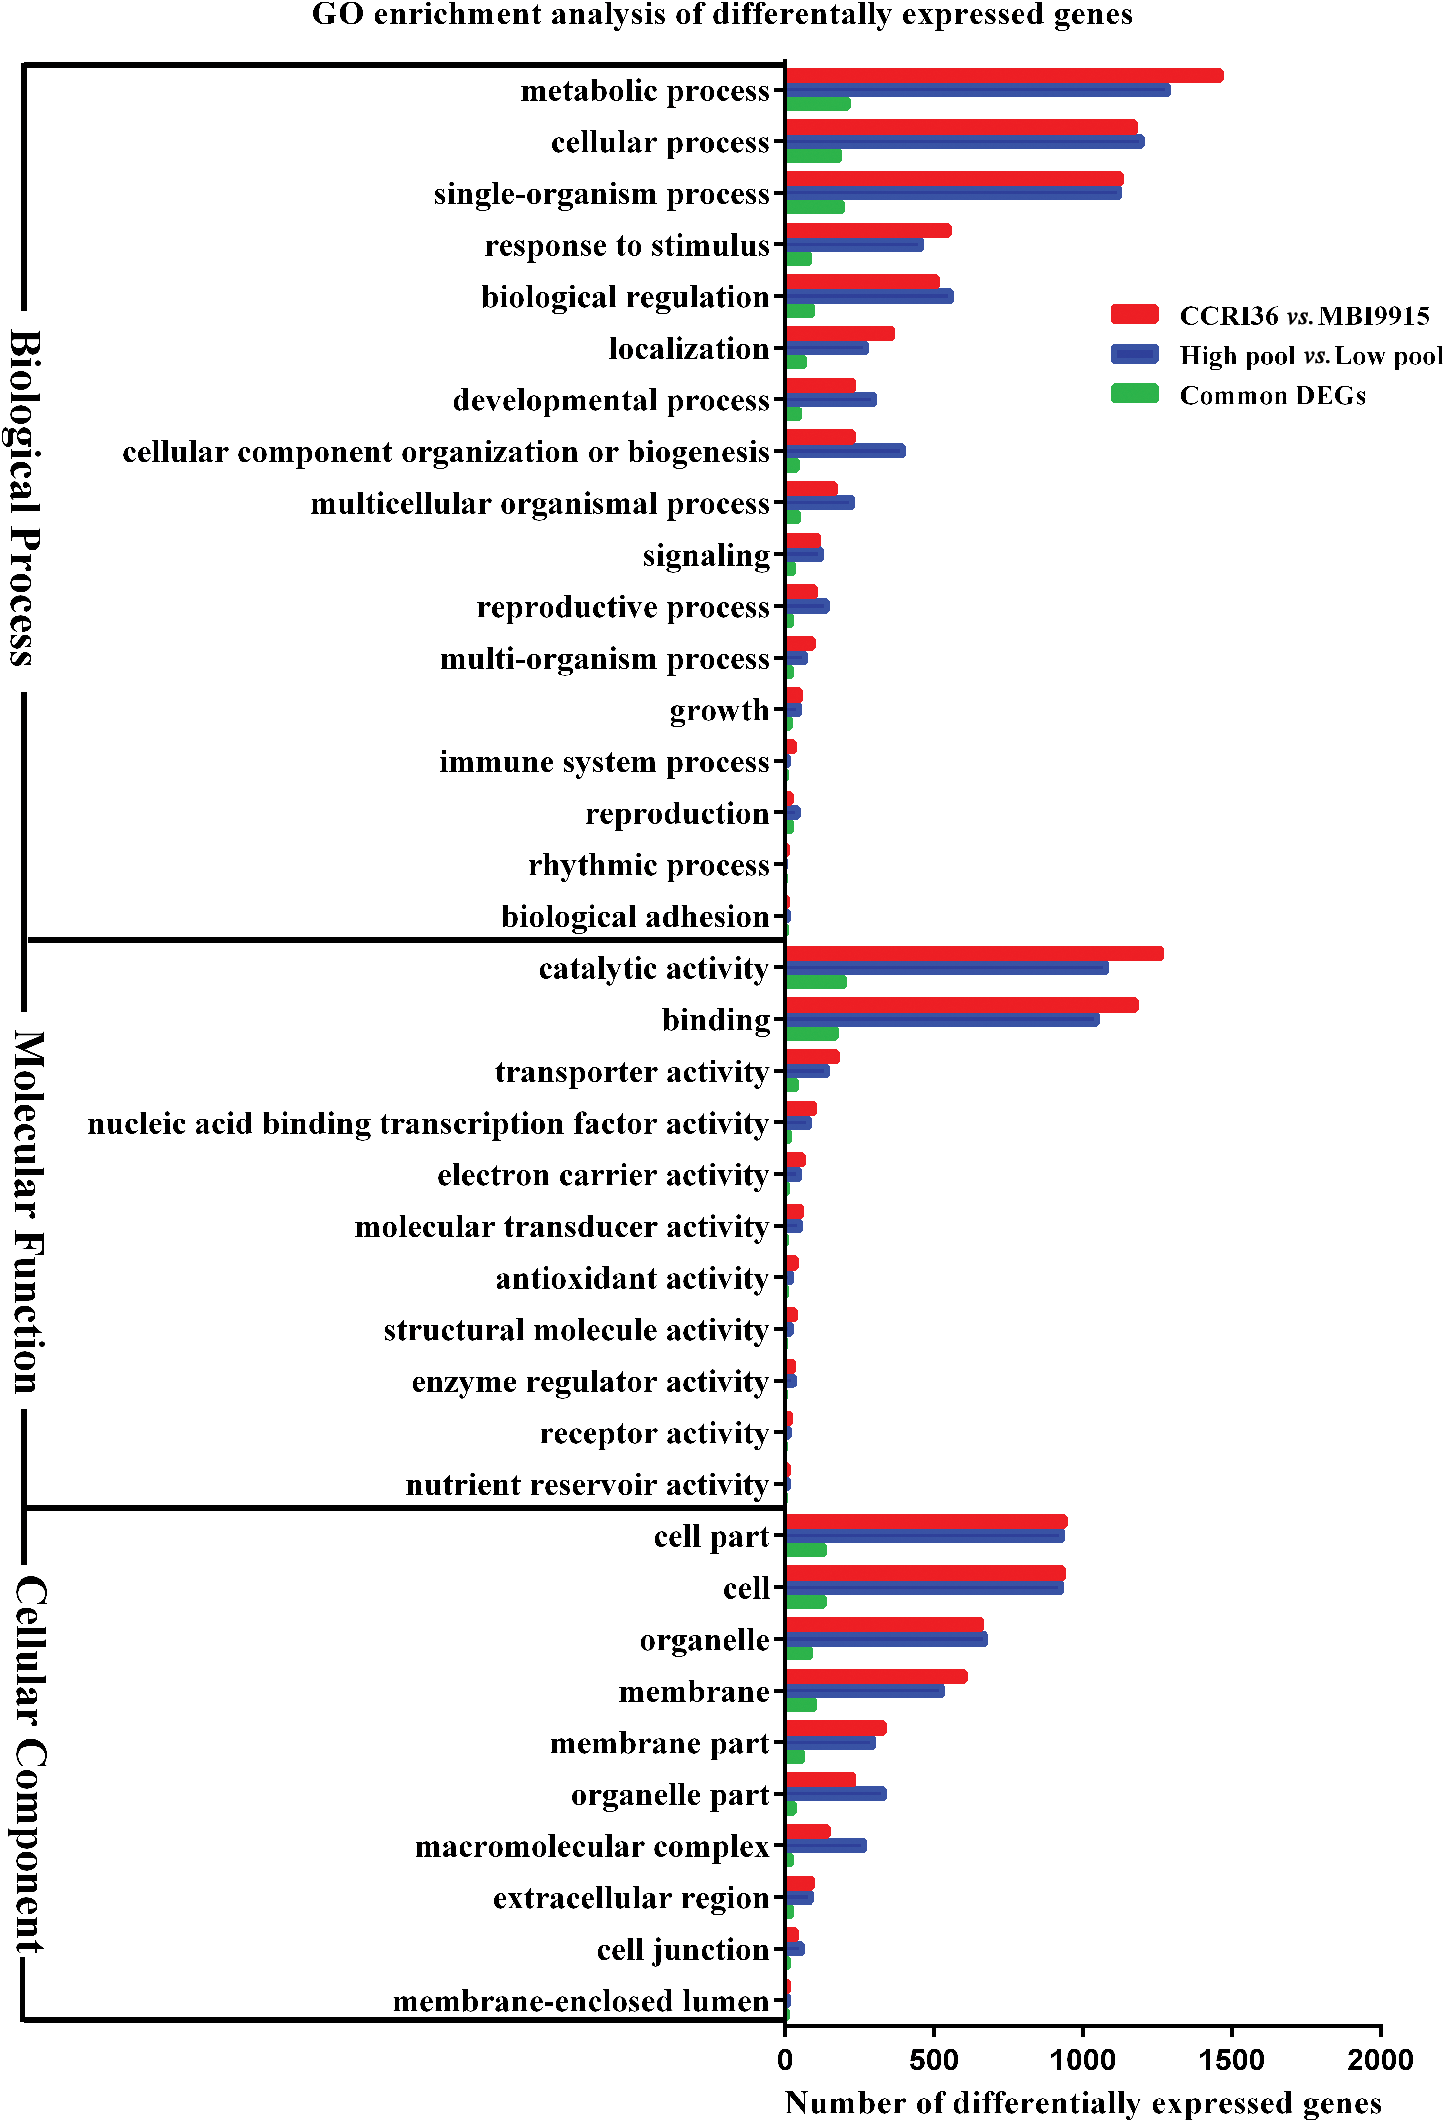
Figure 3: Go database annotation of differentially expressed genes (DEGs) between two parents, pools and overlapped at 20 DPA
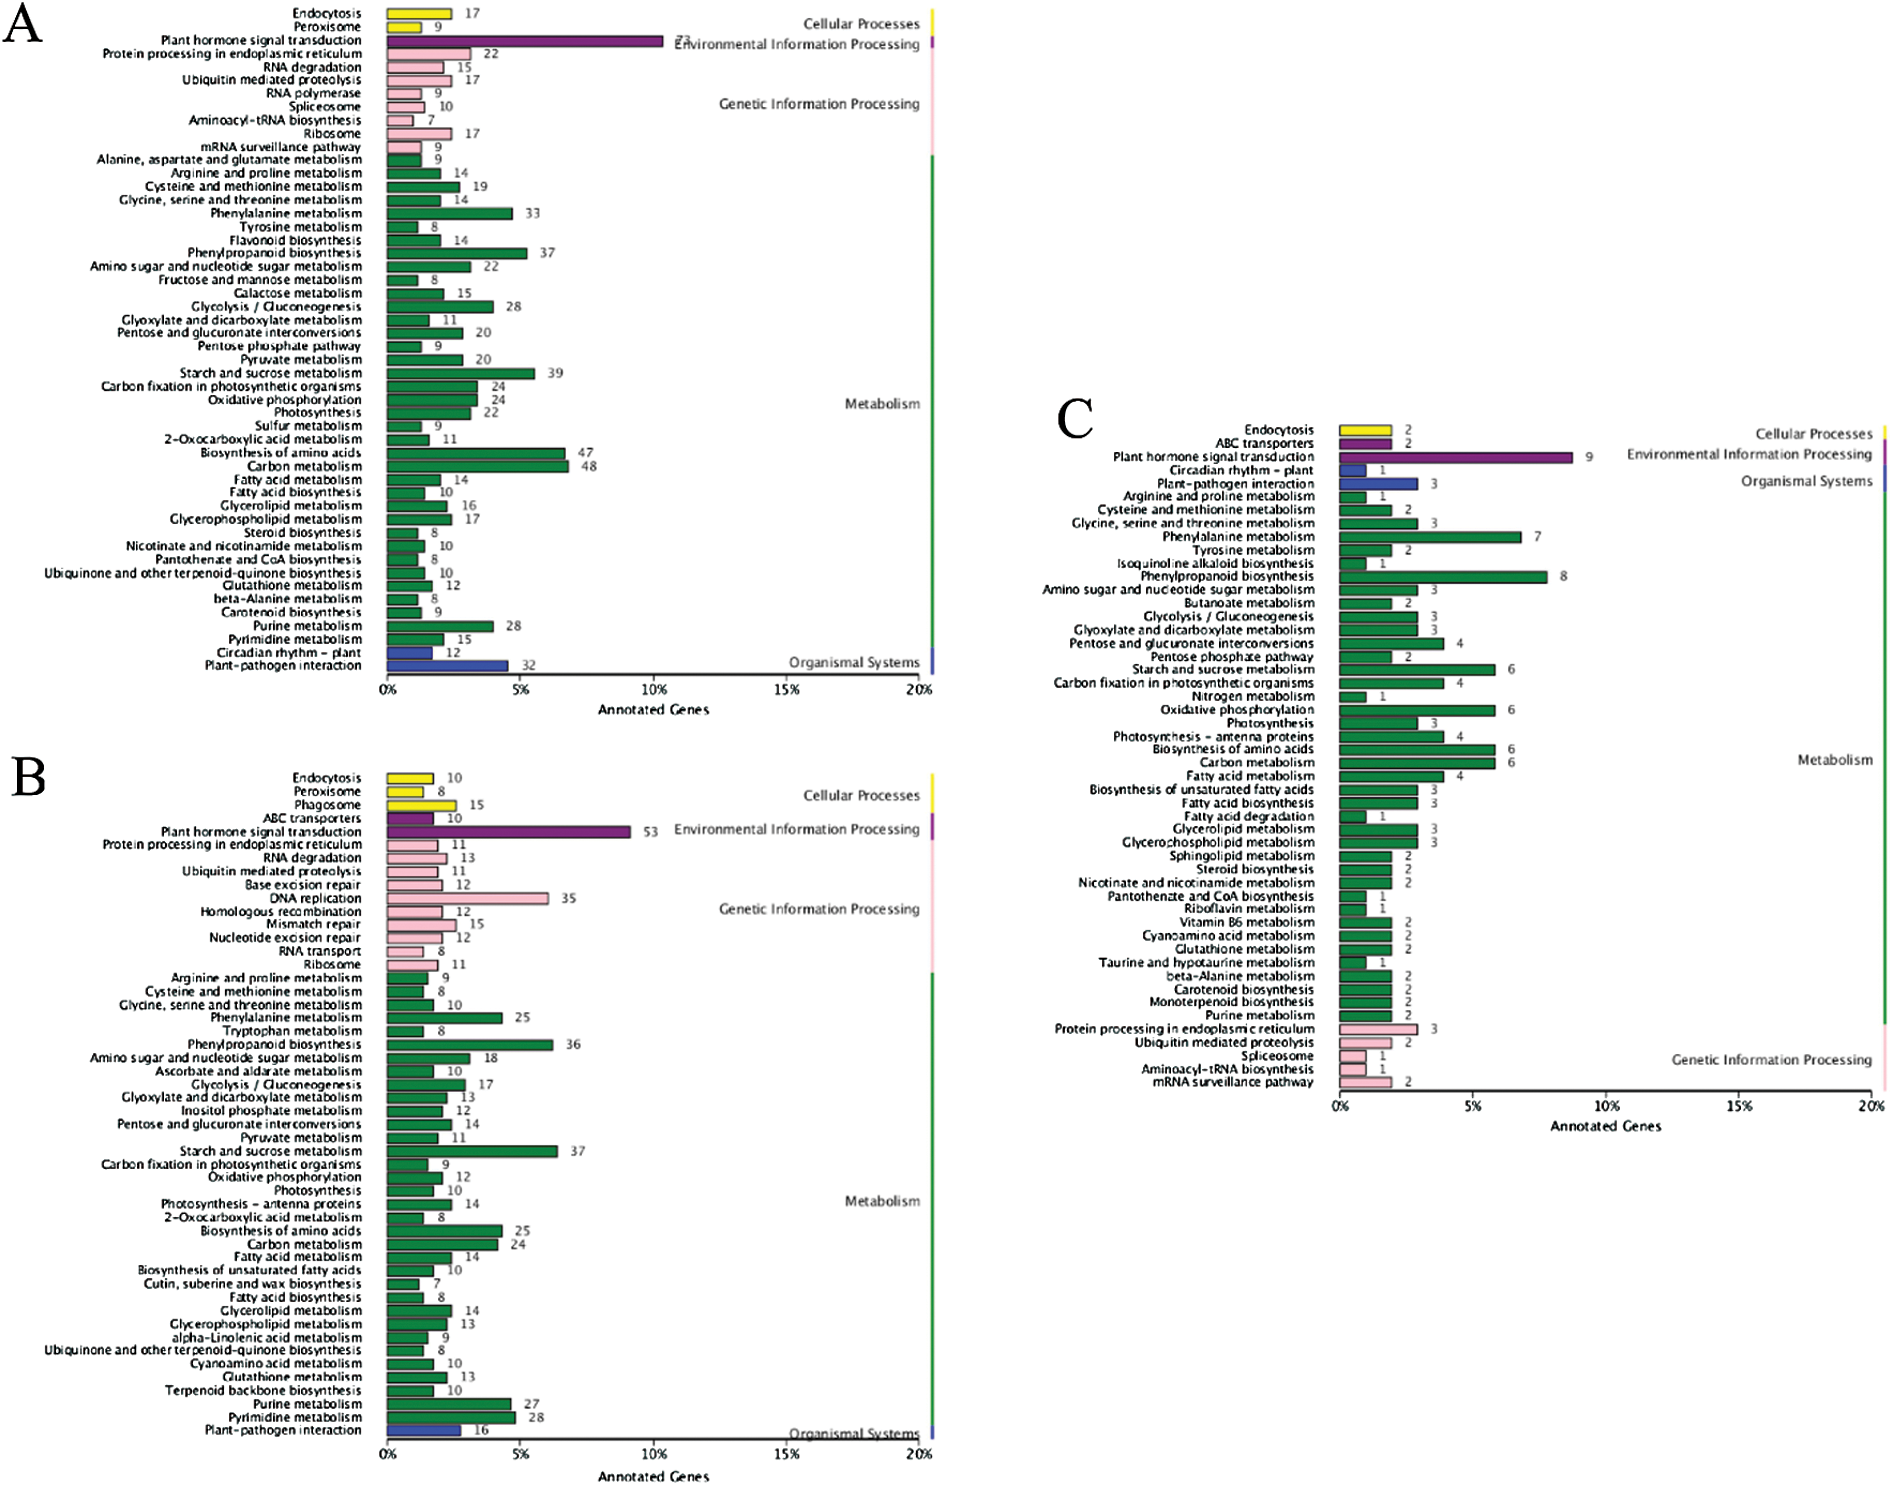
Figure 4: KEGG pathway classification of differentially expressed genes (DEGs) between two parents and pools in 20 DPA. Note: The χ-axis indicates the number of genes annotated to this pathway and the number of genes accounted for the total number of annotated genes. The γ-axis is the name of KEGG metabolic pathway

Figure 5: The relative expression of five selected genes in two parents. The χ-axis represents two parents in 20 DPA, T05 (CCRI36) and T06 (MBI9915). The γ-axis indicates relative expression and the value are expressed as the means of three replicates ± SD. All genes were select based on RNA-Seq results, and genes’ relative expression was validated by qRT-PCR
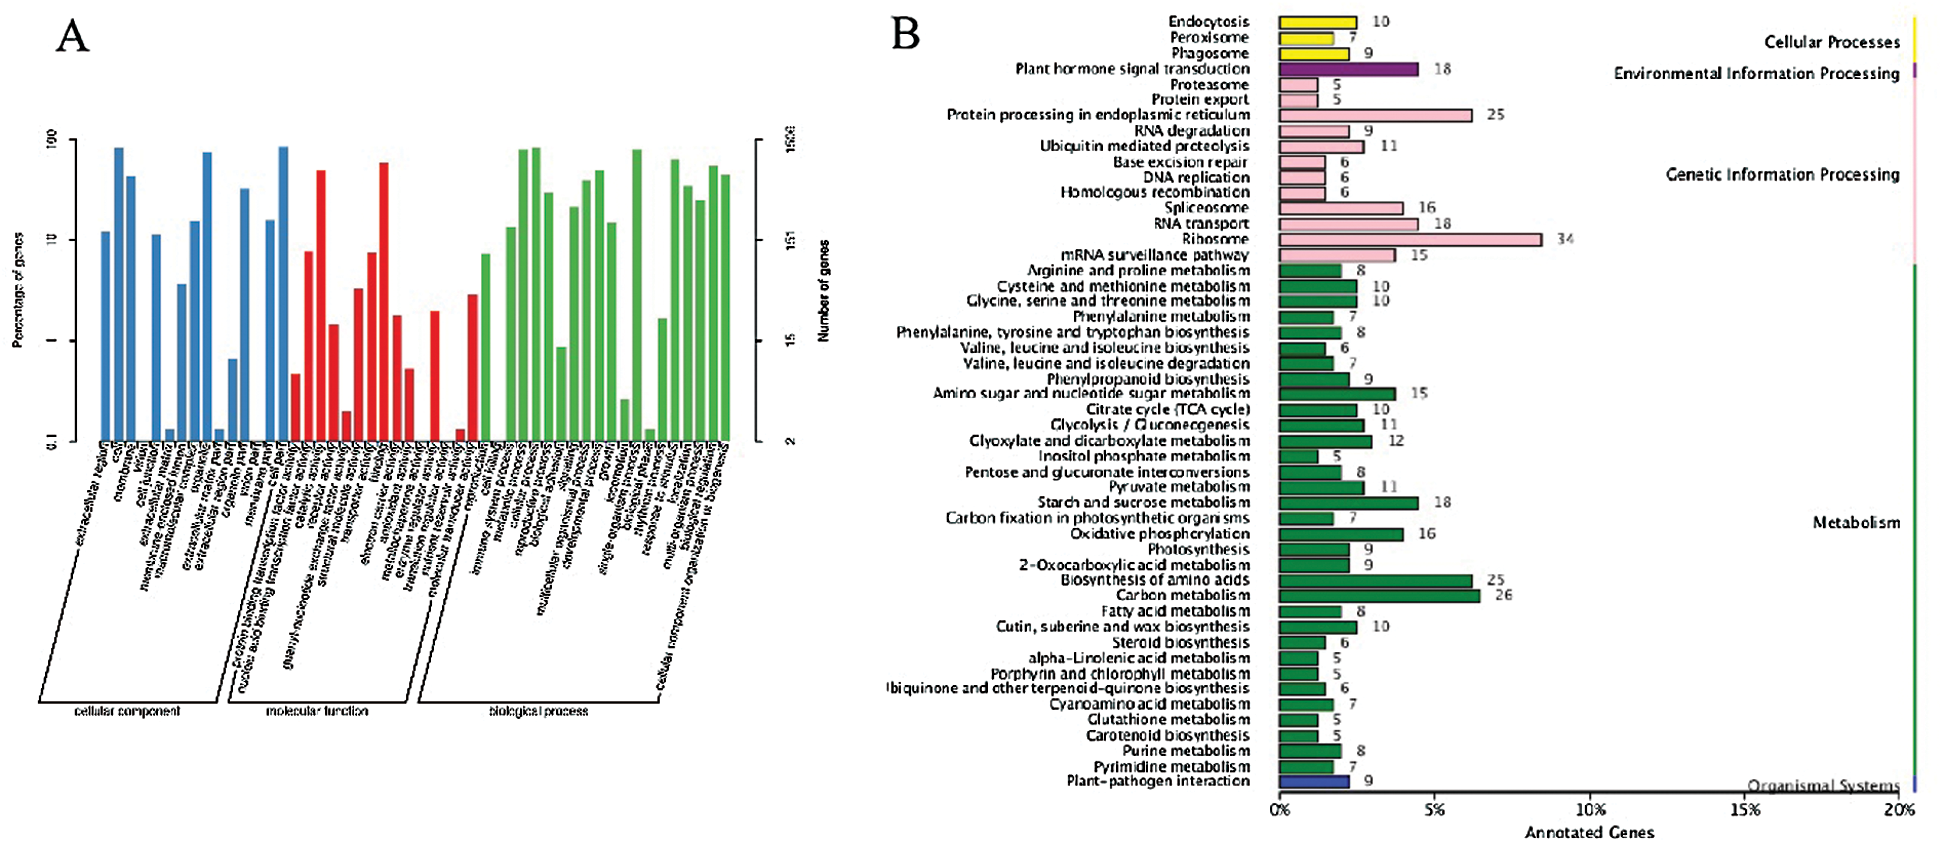
Figure 6: Go database annotation (A) and KEGG pathway classification (B) of genes in the interval through association analysis between two pools at 20 DPA. Note: The χ-axis indicates the number of genes annotated to this pathway and the number of genes accounted for the total number of annotated genes. The γ-axis is the name of KEGG metabolic pathway
Among all the 1981 genes, 69 genes and 93 genes were differentially expressed between two parents and between two extreme pools, respectively, while only 12 common DEGs were identified between two groups. According to annotation information of function genes shown in Tab. 4, 2 genes might play the significant roles during fiber development, namely as Gh_A05G1089 and Gh_A07G0837, which were separately annotated as abscisic acid transport in biological process and Golgi apparatus in cell component. Abscisic acid has been reported as a signal of secondary wall thickening to make great contribution to fiber development, and Golgi apparatus were similarly of importance for plant growth [46–48]. Interestingly, the region of chromosome 7 associated with the correlation analysis was also consistent with the previous QTL localization region, of which segregation populations were constructed by MBI9915 and CCRI36. A associated region with 6.74 Mb on chromosome A07 (chr7: 13.7–20.4 Mb) was overlapped (chrA07:14-16 Mb) [12], therefore the only overlapped DEG Gh_A07G0837 was deemed as a candidate gene related to fiber strength.
Table 4: Functional annotation of 12 important genes

3.6 Clone, Phylogenetic Analysis and Structural Prediction on Gh_A07G0837
For further confirming the contribution of the candidate gene during fiber development, gene clone was conducted on the Gh_A07G0837 in CCRI36 and Hai1, respectively. The coding sequence (CDS) length was 807 bp both in CCRI36 and Hai1, while 2 SNPs were identified to separately locate in the 30th base and the 486th base (Fig. 7A), of which the former resulted in non-synonymous mutation, specifically encoding the aspartic acid in CCRI36 but the glutamic acid in Hai1, while the latter caused synonymous mutation. The CDS length of the candidate gene was only 627 bp in TM-1 reference genome, and the short 181 bp might be the second intron sequence based on annotation information, indicating the probable occurrence of alternative splicing (AS) event in CCRI36 and Hai1. Subsequently, the phylogenetic relationships of Gh_A07G0837 protein sequences were analyzed among the CCRI36, Hai1 and other cotton species, and BLAST results showed the deduced amino acid sequence of Gh_A07G0837 in CCRI36 were highly similar to G. barbadense (99% identity and 95% similarity), while 81% identity and 97%, 95% and 95% similarity to G. hirsutum, G. raimondii and G. arboretum. However, for the deduced amino acid sequence of Gh_A07G0837 in Hai1, G. barbadense (98% identity and 95% similarity) also had high similarity, G. hirsutum, G. raimondii and G. arboretum was 80% identity and 97%, 95%, and 95% similarities (Fig. 7B).
A non-synonymous mutation of the gene in CCRI36 and MBI9915 resulted in the transformation of aspartate at the 10th position of amino acid sequence into glusate. Instability index of protein in CCRI36 was lower than that in MBI9915. The others were listed in Tab. S3. Two proteins were all most likely in intracellular part and were likely in peroxisomal and endoplasmic reticulum. The secondary prediction of protein in CCRI36 contained Alpha helix (30.36%), Beta folding (25.00%) and irregular curl (44.64%), while protein in MBI9915 contained Alpha helix (30.36%), Beta folding (23.66%) and irregular curl (45.98%). The tertiary structure of proteins in CCRI36 and MBI9915 were predicted as oxidoreductase, whose imagines were shown in Supplementary Fig. 2.

Figure 7: Analysis of the Gh_A07G0837 sequence in CCRI36 and Hai1. A. Alignment of the Coding sequences of Gh_A07G0837 in CCRI36 and Hai 1 by DNAMAN software. B: The phylogenetic relationship between the protein sequence in CCRI36, Hai1 and other proteins in some cotton species. Sequences were aligned by ClustalX and analyzed using the MEGA 6.0. Phylogenetic tree was constructed by the Neighbor-joining method with 1000 bootstrap replicates
3.7 Co-Expression of Gh_A07G0837
R software was adopted to conduct a co-expression analysis on Gh_A07G0837. Totally, there were 685 co-expression genes of Gh_A07G0837, of which 144 genes were also differentially expressed between two parents. Most genes were annotated into “plant hormone signal transduction (ko04075)”, and “Biosynthesis of secondary metabolites (ko01110)” pathway in KEGG database (Fig. 8). Gh_A10G0249 and Gh_A11G3069 were annotated to “protein processing in endoplasmic reticulum” pathway (ko04141). Gh_A08G1031 was annotated into “starch and sucrose metabolism” pathway (ko00500). Gh_D02G0430 and Gh_D07G2383 were annotated into “plant hormone signal transduction” pathway(ko04075). Gh_D05G0154 was annotated into “phenylpropanoid biosynthesis” pathway (ko00940).

Figure 8: KEGG functional annotation of 144 co-expression genes of Gh_A07G0837
4.1 CSSLs Were an Ideal Material to BSA and RNA-Seq
Cotton (G. hirsutum L.), one of the most important cash crops, produces the vast majority of natural fiber, which is widely cultivated all over the world. With the development of modern textile industry and the improvement of human living standard, high yield has not been the only goal in the cotton breeding, while superior fiber quality has increasingly attracted attentions. However, either Upland cotton or Sea Island cotton, as the two most widely cultivated varieties, could not simultaneously meet the above-mentioned demands, of which the former subjects to the ordinary fiber performance and narrow genotypic milieu, and the latter has the disadvantages of poor yield and low adaptability [49,50]. An effective and economical method has been put forward to develop chromosome segment substitution lines (CSSLs) in cotton production, utilizing the conventional breeding (hybridization, backcross and self-crossing) and maker-assisted selection (MAS) technologies to cultivate novel cotton varieties harboring high yield and superior fiber quality. As to fiber strength, one of the critical traits determining cotton quality, its formation principally depends on the secondary wall thickening period, and in-depth studies on candidate gene identification will greatly contribute to the molecular-mechanism revelation of fiber development.
Based on the multiple-year and multiple-environment trait surveys of developed CSSLs BC5F3:5 constructed by G. hirsutum CCRI36 and G. barbadense Hai1, superior MBI9915 was chosen to develop the segregation population F2 and F2:3 together with its receptor and recurrent parent CCRI36, and 41 polymorphic SSR markers screened from the high-density linkage map of CCRI36 × Hai1 [5] were utilized to conduct QTL mapping, resulting in 24 QTLs related with cotton yield and fiber quality [12]. Meanwhile, transcriptome sequencing was performed on superior MBI9915 and ordinary CCRI36 during fiber development (at 10, 15, 20, 25, and 28 DPA), and 1801 identified DEGs were enriched into cell wall organization and response to oxidative stress and auxin pathways [33]. The above-mentioned studies have laid the solid foundations for candidate gene identification related to fiber strength.
4.2 Candidate Genes Related to Fiber Strength
Combining bulked segregant analysis (BAS) method and RNA-seq technologies, BSR-seq could analyze the DEGs located in associated chromosomal regions by comparing two extreme pools, finally rapid identification of the candidate genes relevant to key quantitative traits. In this study, the CSSL MBI9915 and its recurrent parent CCRI36 were used to develop BC7F2 and BC7F2:3 populations, which were subjected to fiber quality tests. From BC7F2 population, 16 samples with high fiber strength and 16 samples with low fiber strength were collected at 20 DPA to construct two extreme pool libraries, and then were separately sequenced together with transcriptome libraries of their parents (MBI9915 and CCRI36).
Based on BSA analysis, 18 regions related to fiber strength were identified. One of regions were same to previous studies. Importantly, another 17 regions were first time to be identified related to fiber strength. Among 18 regions, 12 genes were differently expressed in both two parents and pools. The results indicated that 12 DEGs were likely to be related to fiber strength. Two candidate genes were finally screened based on functional annotation of reference genome, namely as namely as Gh_A05G1089 (abscisic acid transport) and Gh_A07G0837 (Golgi apparatus), of which the former has been reported to make great contribution to fiber development as a signal of secondary wall thickening [47,48], while the latter was involved in fiber development [46]. What is interesting, the region of chromosome 7 associated with the correlation analysis was also consistent with the previous QTL localization region, and the associated region with 6.74 Mb on chromosome A07 (chr7: 13.7–20.4Mb) was overlapped (chrA07:14-16Mb) [12], indicating the only overlapped DEGs Gh_A07G0837 was deemed as a candidate gene related to fiber strength. Subsequently, gene clone and sequence analyses were conducted on the candidate gene, and CCRI36 and Hai1 had two SNPs difference and one amino acid difference that induced the phenotypic difference between two parents. Using NCBI protein-blast, protein sequence in CCRI36 and Hai1 was highly similar with a hypothetical protein GOBAR AA28214 in G. barbadense (98% identity and 95% similarity). For nonsynonymous mutation, whether primary structure or secondary structure, it is different from CCRI36 and MBI9915. It may result in Changes of protein phenotype. In Arabidopsis thaliana (AT4G13010.1), it was one of zinc-binding dehydrogenase family protein, named Chloroplast Envelope Quinone Oxidoreductase Homolog (CEQORH) [51]. CeQORH was associated with the inner membrane of the chloroplast envelope and imported into the organelle by an alternative import pathway [52,53]. Under oxidative stress conditions, CeQORH exhibited the activity of a NADPH-dependent to eliminate highly reactive a, b-unsaturated carbonyls [51]. During the development of fiber strength, cells need to breathe to provide energy, and a series of redox reactions occurred in cell respiration. Therefore, this candidate gene may play quite an important role in the development of cotton fiber strength.
4.3 Co-Expression Analysis of Gh_A07G0837
Having performing the co-expression analysis on candidate genes, many genes were annotated into “plant hormone signal transduction”, “Biosynthesis of secondary metabolites”, which is vital to the development of fiber strength [33]. Gh_A07G0837 cooperates with those genes to regulate the development of fiber strength. Gh_A10G0249 (E3 ubiquitin-protein ligase RMA1H1) is one of Gh_A07G0837 co-expression genes, which was reported that RMA1 cooperates with Gp78 to participate in ER-associated degradation of the cystic fibrosis transmembrane conductance regulator [54]. Surprisingly, Gh_A10G0249 was identified as a down-regulated gene between two parents, just as the same expression pattern as Gh_A07G0837. We guess that it is because this gene is expressed low in MBI9915 to form good fiber strength. Another co-expressed DEG, Gh_A08G1031, also showed was differentially expressed between two parents with down-regulated tend, which was annotated as sucrose synthase 2. Sucrose synthase and invertase are the major enzymes that catalyze sucrose conversion [55], which are highly expressed during the formation of fiber length. The DEG Gh_D02G0430, namely as ethylene-responsive transcription factor 1B, is a down-regulated co-expressed gene between two parents. Ethylene is an important factor participating in plant hormone signal transduction for fiber length, and their low expression in MBI9915 might indicate that inhibiting the expression of these genes is of great significance for the formation of materials with good fiber strength. The down-regulated DEG Gh_D07G2383 with the annotation information of a Protein phosphatase 2C 77, is inhibited by ABA. Gh_D05G0154, a Peroxidase, is expressed highly in fast-elongating cotton fiber cells [56]. Our RNA-Seq showed that the expression level of Gh_D05G0154 is relatively low, especially in MBI9915, and our co-expression analysis on Gh_A07G0837 indicated that those interactional genes might collaborate in the control of regulatory fiber strength function.
In this study, we used Chromosome Segment Substitution Lines through BSR-seq technique to map gene related to fiber strength. Association analysis was conducted in this study to obtain some regions related to fiber strength, and 12 DEGs were identified with combination of RNA-seq data. Referred to the relevant QTL results, one candidate gene was screened and analyzed to participated in fiber strength, whose function will be further verified with gene editing and genetic transformation experiments. In this region, Gh_A07G0837 is differentially expressed not only in two parents but also in two pools, which is considered as a candidate gene. The sequence and structure of Gh_A07G0837 in CCRI36 is different from in MBI9915. In previous study, CeQORH(Gh_A07G0837) participated in redox reaction. We deduce that CeQORH is likely through redox reaction to cause the difference of fiber strength in CCRI36 and MBI9915.
Author Contribution: YLY, YZS and QZ conceived and designed the study. QZ and PTL drafted the manuscript. AYL, QWL, SQL, QG, JWL, and WKG participated in segregation population construction and fiber sample collections. XYD, HHS participated in BSR-seq and data analysis. All the authors read and approved the final manuscript.
Funding Statement: This study was supported by the National Natural Science Foundation of China (31801404 and 31621005) and Joint Funds of the National Natural Science Foundation (U1804103), Science and Technology development Project of Henan Province (192102110127 and 182102410041), and the Project of Director (1610162020040904).
Conflicts of Interest: The authors declare that they have no conflicts of interest to report regarding the present study.
1. Bradow, J. M., Davidonis, G. H. (2000). Quantitation of fiber quality and the cotton production-processing interface: A physiologist’s perspective. Journal of Cotton Science, 4(1), 34–64. [Google Scholar]
2. Wendel, J. F., Albert, V. A. (1992). Phylogenetics of the cotton genus (GossypiumCharacter-state weighted parsimony analysis of chloroplast-DNA restriction site data and its systematic and biogeographic implications. Systematic Botany, 17(1), 115–143. DOI 10.2307/2419069. [Google Scholar] [CrossRef]
3. Grover, C. E., Yu, Y., Wing, R. A., Paterson, A. H., Wendel, J. F. (2008). A phylogenetic analysis of indel dynamics in the cotton genus. Molecular Biology & Evolution, 7(7), 1415–1428. DOI 10.1093/molbev/msn085. [Google Scholar] [CrossRef]
4. Zhang, J. F., Percy, R. G., McCarty, J. C. (2014). Introgression genetics and breeding between Upland and Pima cotton: A review. Euphytica, 198(1), 1–12. DOI 10.1007/s10681-014-1094-4. [Google Scholar] [CrossRef]
5. Shi, Y. Z., Li, W. T., Li, A. G., Ge, R. H., Zhang, B. C. et al. (2015). Constructing a high-density linkage map for Gossypium hirsutum x Gossypium barbadense and identifying QTLs for lint percentage. Journal of Integrative Plant Biology, 57(5), 450–467. DOI 10.1111/jipb.12288. [Google Scholar] [CrossRef]
6. Eshed, Y., Zamir, D. (1994). A genomic library of Lycopersicon pennellii in L. esculentum: A tool for fine mapping of genes. Euphytica, 79(3), 175–179. DOI 10.1007/BF00022516. [Google Scholar] [CrossRef]
7. Yuan, R., Zhao, N., Usman, B., Luo, L., Liao, S. et al. (2020). Development of chromosome segment substitution lines (CSSLs) derived from Guangxi Wild Rice (Oryza rufipogon Griff.) under rice (Oryza sativa L.) background and the identification of QTLs for plant architecture, agronomic traits and cold tolerance. Genes (Basel), 11(9), 980. DOI 10.3390/genes11090980. [Google Scholar] [CrossRef]
8. Liu, S., Zhou, R., Dong, Y., Li, P., Jia, J. (2006). Development, utilization of introgression lines using a synthetic wheat as donor. Theoretical and Applied Genetics, 112(7), 1360–1373. DOI 10.1007/s00122-006-0238-x. [Google Scholar] [CrossRef]
9. Lu, L., Xu, Z., Sun, S., Du, Q., Zhu, Z. et al. (2020). Discovery and fine mapping of qSCR6. 01, a novel major QTL conferring Southern rust resistance in maize. Plant Disease, 104(7), 1918–1924. DOI 10.1094/PDIS-01-20-0053-RE. [Google Scholar] [CrossRef]
10. Wang, J., Wang, J., Ma, C., Zhou, Z., Yang, D. et al. (2020). QTL mapping and data mining to identify genes associated with the Sinorhizobium fredii HH103 T3SS effector NopD in soybean. Frontiers in Plant Science, 11, 453. DOI 10.3389/fpls.2020.00453. [Google Scholar] [CrossRef]
11. Li, S. Q., Liu, A. Y., Kong, L. L., Gong, J. W., Li, J. W. et al. (2019). QTL mapping and genetic effect of chromosome segment substitution lines with excellent fiber quality from Gossypium hirsutum × Gossypium barbadense. Molecular Genetics and Genomics, 294(5), 1123–1136. DOI 10.1007/s00438-019-01566-8. [Google Scholar] [CrossRef]
12. Song, W., Wang, M., Su, W., Lu, Q., Xiao, X. et al. (2017). Genetic and phenotypic effects of chromosome segments introgressed from Gossypium barbadense into Gossypium hirsutum. PLoS One, 12(9), e0184882. DOI 10.1371/journal.pone.0184882. [Google Scholar] [CrossRef]
13. Zhu, D., Li, X., Wang, Z., You, C., Nie, X. et al. (2020). Genetic dissection of an allotetraploid interspecific CSSLs guides interspecific genetics and breeding in cotton. BMC Genomics, 21(1), 431. DOI 10.1186/s12864-020-06800-x. [Google Scholar] [CrossRef]
14. Lee, J. J., Woodward, A. W., Chen, Z. J. (2007). Gene expression changes and early events in cotton fibre development. Annals of Botany, 100(7), 1391–1401. DOI 10.1093/aob/mcm232. [Google Scholar] [CrossRef]
15. Haigler, C. H., Betancur, L., Stiff, M. R., Tuttle, J. R. (2012). Cotton fiber: A powerful single-cell model for cell wall and cellulose research. Frontiers in Plant Science, 3, 104. DOI 10.3389/fpls.2012.00104. [Google Scholar] [CrossRef]
16. Schubert, A., Benedict, C., Berlin, J., Kohel, R. (1973). Cotton fiber development-kinetics of cell elongation and secondary wall thickening. Crop Science, 13(6), 704–709. DOI 10.2135/cropsci1973.0011183X001300060035x. [Google Scholar] [CrossRef]
17. Paterson, A. H., Wendel, J. F., Gundlach, H., Guo, H., Jenkins, J. et al. (2012). Repeated polyploidization of Gossypium genomes and the evolution of spinnable cotton fibres. Nature, 492(7429), 423–427. DOI 10.1038/nature11798. [Google Scholar] [CrossRef]
18. Li, F., Fan, G., Wang, K., Sun, F., Yuan, Y. et al. (2014). Genome sequence of the cultivated cotton Gossypium arboreum. Nature Genetics, 46(6), 567–572. DOI 10.1038/ng.2987. [Google Scholar] [CrossRef]
19. Li, F., Fan, G., Lu, C., Xiao, G., Zou, C. et al. (2015). Genome sequence of cultivated Upland cotton (Gossypium hirsutum TM-1) provides insights into genome evolution. Nature Biotechnology, 33(5), 524–530. DOI 10.1038/nbt.3208. [Google Scholar] [CrossRef]
20. Wang, S., Chen, J., Zhang, W., Hu, Y., Chang, L. et al. (2015). Sequence-based ultra-dense genetic and physical maps reveal structural variations of allopolyploid cotton genomes. Genome Biology, 16(1), 108. DOI 10.1186/s13059-015-0678-1. [Google Scholar] [CrossRef]
21. Zhang, T., Hu, Y., Jiang, W., Fang, L., Guan, X. et al. (2015). Sequencing of allotetraploid cotton (Gossypium hirsutum L. acc. TM-1) provides a resource for fiber improvement. Nature Biotechnology, 33(5), 531–537. DOI 10.1038/nbt.3207. [Google Scholar] [CrossRef]
22. Du, X., Huang, G., He, S., Yang, Z., Sun, G. (2018). Resequencing of 243 diploid cotton accessions based on an updated A genome identifies the genetic basis of key agronomic traits. Nature Genetics, 50(6), 796–802. DOI 10.1038/s41588-018-0116-x. [Google Scholar] [CrossRef]
23. Wang, M., Tu, L., Yuan, D., Zhu, D., Shen, C. et al. (2019). Reference genome sequences of two cultivated allotetraploid cottons, Gossypium hirsutum and Gossypium barbadense. Nature Genetics, 51(2), 224–229. DOI 10.1038/s41588-018-0282-x. [Google Scholar] [CrossRef]
24. Ma, Z., He, S., Wang, X., Sun, J., Zhang, Y. et al. (2018). Resequencing a core collection of upland cotton identifies genomic variation and loci influencing fiber quality and yield. Nature Genetics, 50(6), 803–813. DOI 10.1038/s41588-018-0119-7. [Google Scholar] [CrossRef]
25. Fang, X., Liu, X., Wang, X., Wang, W., Liu, D. et al. (2017). Fine-mapping qFS07.1 controlling fiber strength in upland cotton (Gossypium hirsutum L.). Theoretical and Applied Genetics, 130(4), 795–806. DOI 10.1007/s00122-017-2852-1. [Google Scholar] [CrossRef]
26. Lu, Q., Shi, Y., Xiao, X., Li, P., Gong, J. et al. (2017). Transcriptome analysis suggests that chromosome introgression fragments from sea island cotton (Gossypium barbadense) increase fiber strength in upland cotton (Gossypium hirsutum). G3: Genes, Genomes, Genetics, 7(10), 3469–3479. DOI 10.1534/g3.117.300108. [Google Scholar] [CrossRef]
27. Liu, S., Yeh, C. T., Tang, H. M., Nettleton, D., Schnable, P. S. (2012). Gene mapping via bulked segregant RNA-Seq (BSR-Seq). PLoS One, 7(5), e36406. DOI 10.1371/journal.pone.0036406. [Google Scholar] [CrossRef]
28. Trick, M., Adamski, N. M., Mugford, S. G., Jiang, C. C., Febrer, M. et al. (2012). Combining SNP discovery from next-generation sequencing data with bulked segregant analysis (BSA) to fine-map genes in polyploid wheat. BMC Plant Biology, 12(1), 14. DOI 10.1186/1471-2229-12-14. [Google Scholar] [CrossRef]
29. Wang, R., Sun, L., Bao, L., Zhang, J., Jiang, Y. et al. (2013). Bulk segregant RNA-seq reveals expression and positional candidate genes and allele-specific expression for disease resistance against enteric septicemia of catfish. BMC Genomics, 14(1), 929. DOI 10.1186/1471-2164-14-929. [Google Scholar] [CrossRef]
30. Yates, S. A., Swain, M. T., Hegarty, M. J., Chernukin, I., Lowe, M. et al. (2014). De novo assembly of red clover transcriptome based on RNA-Seq data provides insight into drought response, gene discovery and marker identification. BMC Genomics, 15(1), 453. DOI 10.1186/1471-2164-15-453. [Google Scholar] [CrossRef]
31. Du, H., Zhu, J., Su, H., Huang, M., Wang, H. et al. (2017). Bulked segregant RNA-Seq reveals differential expression and SNPs of candidate genes associated with Waterlogging tolerance in maize. Frontiers in Plant Science, 8, 1022. DOI 10.3389/fpls.2017.01022. [Google Scholar] [CrossRef]
32. Hou, X., Guo, Q., Wei, W., Guo, L., Guo, D. et al. (2018). Screening of genes related to early and late flowering in tree peony based on bulked segregant RNA sequencing and verification by quantitative real-time PCR. Molecules, 23(3), 689. DOI 10.3390/molecules23030689. [Google Scholar] [CrossRef]
33. Li, P. T., Wang, M., Lu, Q. W., Ge, Q., Liu, A. Y. et al. (2017). Comparative transcriptome analysis of cotton fiber development of Upland cotton (Gossypium hirsutum) and chromosome segment substitution lines from G. hirsutum × G. barbadense. BMC Genomics, 18(1), 705. DOI 10.1186/s12864-017-4077-8. [Google Scholar] [CrossRef]
34. Zhang, J. F., Shi, Y. Z., Liang, Y., Jia, Y. J., Zhang, B. C. et al. (2012). Evaluation of yield and fiber quality traits of chromosome segment substitution lines population (BC5F3 and BC5F34) in cotton. Journal of Plant Genetic Resources, 13(5), 773–781. DOI 10.13430/j.cnki.jpgr.2012.05.014. [Google Scholar] [CrossRef]
35. Dobin, A., Davis, C. A., Schlesinger, F., Drenkow, J., Zaleski, C. et al. (2013). STAR: Ultrafast universal RNA-seq aligner. Bioinformatics, 29(1), 15–21. DOI 10.1093/bioinformatics/bts635. [Google Scholar] [CrossRef]
36. Mortazavi, A., Williams, B. A., McCue, K., Schaeffer, L., Wold, B. (2008). Mapping and quantifying mammalian transcriptomes by RNA-seq. Nature Methods, 5(7), 621–628. DOI 10.1038/nmeth.1226. [Google Scholar] [CrossRef]
37. Apweiler, R., Bairoch, A., Wu, C. H., Barker, W. C., Boeckmann, B. et al. (2004). UniProt: The universal protein knowledgebase. Nucleic Acids Research, 32, D115–D119. DOI 10.1093/nar/gkh131. [Google Scholar] [CrossRef]
38. Kanehisa, M., Araki, M., Goto, S., Hattori, M., Hirakawa, M. et al. (2007). A study on the hand work education at the Kyoto City Kindergarten in the Meiji Era: The case study of Ryuchi Kindergarten. Bulletin of the Faculty of Letters Aichi Prefectural University, 56(1), 53–72. DOI 10.1093/nar/gkm882. [Google Scholar] [CrossRef]
39. McKenna, A., Hanna, M., Banks, E., Sivachenko, A., Cibulskis, K. et al. (2010). The genome analysis toolkit: A mapreduce framework for analyzing next-generation DNA sequencing data. Genome Research, 20(9), 1297–1303. DOI 10.1101/gr.107524.110. [Google Scholar] [CrossRef]
40. Joke, R., Peter, D. R., Hui, Z., Anthony, L., Dominiek, S. et al. (2012). Optimized filtering reduces the error rate in detecting genomic variants by short-read sequencing. Nature Biotechnology, 30(1), 61–68. DOI 10.1038/nbt.2053. [Google Scholar] [CrossRef]
41. Altschul, S. F., Madden, T. L., Schäffer, A. A., Zhang, J., Zhang, Z. et al. (1997). Gapped BLAST and PSI-BLAST: A new generation of protein database search programs. Nucleic Acids Research, 25(17), 3389–3402. DOI 10.1093/nar/25.17.3389. [Google Scholar] [CrossRef]
42. Trapnell, C., Williams, B. A., Pertea, G., Mortazavi, A., Kwan, G. et al. (2010). Transcript assembly and quantification by RNA-Seq reveals unannotated transcripts and isoform switching during cell differentiation. Nature Biotechnology, 28(5), 511–515. DOI 10.1038/nbt.1621. [Google Scholar] [CrossRef]
43. Livak, K. J., Schmittgen, T. D. (2001). Analysis of relative gene expression data using real-time quantitative PCR and the 2−ΔΔCT method. Methods, 25(4), 402–408. DOI 10.1006/meth.2001.1262. [Google Scholar] [CrossRef]
44. Kumar, S., Stecher, G., Tamura, K. (2016). MEGA7: Molecular evolutionary genetics analysis version 7.0 for bigger datasets. Molecular Biology and Evolution, 33(7), 1870–1874. DOI 10.1093/molbev/msw054. [Google Scholar] [CrossRef]
45. Leng, N., Dawson, J. A., Thomson, J. A., Ruotti, V., Rissman, A. I. et al. (2013). EBSeq: An empirical Bayes hierarchical model for inference in RNA-seq experiments. Bioinformatics, 29(8), 1035–1043. DOI 10.1093/bioinformatics/btt087. [Google Scholar] [CrossRef]
46. Ramsey, J., Berlin, J. (1976). Ultrastructure of early stages of cotton fiber differentiation. Botanical Gazette, 137(1), 11–19. DOI 10.1086/336836. [Google Scholar] [CrossRef]
47. Gokani, S., Kumar, R., Thaker, V. (1998). Potential role of abscisic acid in cotton fiber and ovule development. Journal of Plant Growth Regulation, 17(1), 1–5. DOI 10.1007/PL00007005. [Google Scholar] [CrossRef]
48. Kurek, I., Kawagoe, Y., Jacob, W. D., Doblin, M., Delmer, D. (2002). Dimerization of cotton fiber cellulose synthase catalytic subunits occurs via oxidation of the zinc-binding domains. Proceedings of the National Academy of Sciences of the United States of America, 2002(17), 11109–11114. DOI 10.1073/pnas.162077099. [Google Scholar] [CrossRef]
49. Ulloa, M., Saha, S., Jenkins, J., Meredith, J. W., McCarty, J. J. et al. (2004). Chromosomal assignment of RFLP linkage groups harboring important QTLs on an intraspecific cotton (Gossypium hirsutum L.) joinmap. Journal of Heredity, 96(2), 132–144. DOI 10.1093/jhered/esi020. [Google Scholar] [CrossRef]
50. Zhang, Z. S., Hu, M. C., Zhang, J., Liu, D. J., Zheng, J. et al. (2009). Construction of a comprehensive PCR-based marker linkage map and QTL mapping for fiber quality traits in upland cotton (Gossypium hirsutum L.). Molecular Breeding, 24(1), 49–61. DOI 10.1007/s11032-009-9271-1. [Google Scholar] [CrossRef]
51. Curien, G., Giustini, C., Montillet, J. L., Mas, Y. M. S., Cobessi, D. et al. (2016). The chloroplast membrane associated ceQORH putative quinone oxidoreductase reduces long-chain, stress-related oxidized lipids. Phytochemistry, 122, 45–55. DOI 10.1016/j.phytochem.2015.11.015. [Google Scholar] [CrossRef]
52. Miras, S., Salvi, D., Ferro, M., Grunwald, D., Garin, J. et al. (2002). Non-canonical transit peptide for import into the chloroplast. Journal of Biological Chemistry, 277(49), 47770–47778. DOI 10.1074/jbc.M207477200. [Google Scholar] [CrossRef]
53. Claudia, R., Christiane, R., John, G., Oscar, V., Diter, V. W. et al. (2013). Three proteins mediate import of transit sequence-less precursors into the inner envelope of chloroplasts in Arabidopsis thaliana. Proceedings of the National Academy of Sciences, 2013(49), 19962–19967. DOI 10.1073/pnas.1319648110. [Google Scholar] [CrossRef]
54. Morito, D., Hirao, K., Oda, Y., Hosokawa, N., Tokunaga, F. et al. (2008). Gp78 cooperates with RMA1 in endoplasmic reticulum-associated degradation of CFTRDeltaF508. Molecular Biology of the Cell, 19(4), 1328–1336. DOI 10.1091/mbc.e07-06-0601. [Google Scholar] [CrossRef]
55. Gou, J. Y., Wang, L. J., Chen, S. P., Hu, W. L., Chen, X. Y. (2007). Gene expression and metabolite profiles of cotton fiber during cell elongation and secondary cell wall synthesis. Cell Research, 17(5), 422–434. DOI 10.1038/sj.cr.7310150. [Google Scholar] [CrossRef]
56. Mei, W., Qin, Y., Song, W., Li, J., Zhu, Y. (2009). Cotton GhPOX1 encoding plant class III peroxidase may be responsible for the high level of reactive oxygen species production that is related to cotton fiber elongation. Journal of Genetics and Genomics, 36(3), 141–150. DOI 10.1016/S1673-8527(08)60101-0. [Google Scholar] [CrossRef]

Figure S1: Putative SNPs associated with fiber strength. The polymorphic SNPs were identified by comparing RNA sequence of two pools in 20 DPA. χ-axis represents the physical position of each SNP marker and γ-axis is the linkage probability. Red dotted line indicates the threshold of linkage probability

Figure S2: Prediction of the tertiary structure of Gh_A07G0837 encoding protein
Table S1: Primers are used for qRT-PCR verification

Table S2: Information on 18 linkage domains

Table S3: Analysis of physical and chemical properties of Gh_A07G0837 in CCRI36 and MBI9915

 | This work is licensed under a Creative Commons Attribution 4.0 International License, which permits unrestricted use, distribution, and reproduction in any medium, provided the original work is properly cited. |