International Journal of
Experimental Botany
| Phyton- International Journal of Experimental Botany |
DOI: 10.32604/phyton.2021.013227
ARTICLE
CO2 Assimilation Rate in Production Systems for Papaya Crops
1Iguala Experimental Station, National Institute of Forest, Agricultural and Livestock Research (INIFAP), Iguala, CP. 40000, México
2Superior Agricultural College of the State of Guerrero, Iguala, Guerrero.CP. 40000, México
3Rosario Izapa Experimental Station-INIFAP, Tuxtla Chico, Chiapas.CP. 30870, México
4Valles Centrales Experimental Station-INIFAP, Oaxaca, Oaxaca.CP. 68200, México
5Centro de Chiapas Experimental Station–INIFAP, Ocozocoautla, Chiapas.CP. 29140, México
*Corresponding Author: C. H. Avendaño-Arrazate. Email: fitogeneticarlos@hotmail.com
Received: 28 July 2020; Accepted: 16 November 2020
Abstract: The aim of this study was to evaluate some physiological aspects of papaya crops in semi conventional and organic production systems. The following factors assessed in this experiment were: 1. Production systems (organic and semi conventional); 2. Genotypes (Maradol and Maradona F1), and 3. Cover crop plants (Canavalia, vegetative cover and no cover). Twelve treatments were obtained -product of factors’ combination- and distributed under a three-repetition experimental design of subdivided parcels. The factors examined in this study, that changed the CO2 assimilation rate, were production system and genotype. It was determined that the greatest gas exchange in papaya crops happened at 13:40 h but achieving the highest CO2 assimilation was also affected by the production system and genotype. Similarly, they showed some effects in CO2 assimilation, transpiration, stomatal conductance, intercellular CO2, leaf temperature, chlorophyll, and temperature. In general, the combination of factors that accentuated in this experiment were the semi conventional-Maradona-Canavalia with a crop yield of 53.5 t ha-1, followed by treatments organic-Maradona-no cover and semi conventional-Maradona-vegetative cover.
Keywords: Respiration; production system; Carica papaya L.
Because of its profitability, Carica papaya L. is of economic importance in Mexico and is the most demanding tropical fruit worldwide. In 2018, domestic production was of 963,461.46 T which was obtained from the states of Oaxaca, Colima, Chiapas, Veracruz, Michoacán, and Guerrero [1]. Nowadays, production is basically obtained using agrochemicals products, which are pollutant substances and impose high cost on production. Besides, their impact is clearly unfavorable to the environment and to human health [2]. Right temperatures for papaya crops (Carica papaya L.) range between 21°C to 33°C, with an optimal one for photosynthesis (25°C to 30°C); but in high temperatures, the net photosynthesis decreases rapidly and therefore, stomatal conductance and CO2 assimilation lessen [3]. Plants require 66% of relative humidity to maintain an ideal stomatal conductance and crop growth [4]. Carica papaya L is a day-neutral plant with a photoperiod that does not influence flowering induction; for instance, it prefers sunny days with a photosynthetically active reaction ranging from 1000 µmol m-2 s-1 [4] to 1650 µmol m-2 s-1 [5]. Additionally, it is a C3 plant with a photosynthetic metabolism that possess an anatomical characteristic on the leaves for they are not photosynthetic adapted to reduce photorespiration and present some absence in the formation of cells at the margin of its vascular bundles [6]. As soon as the compensation point is closed to 50 ppm of CO2 at 25°C and to 21% of O2; the loss of CO2 results from photorespiration, which is virtually in balanced with fixed CO2 through PPP. RuBisCo enzyme possess greater affinity with CO2, even though the concentration of O2 in the air is greater than CO2. In this sense, under physiological conditions, oxygenase activity is 20%–30% of the carboxylase activity because when temperature rises, the air balance existing among O2 and CO2 is modified, consequently; the carboxylation reaction becomes less dominant [7]. Water use efficiency in C3 species is affected by photorespiration and environmental conditions, thus; their ability for photosynthesis diminishes. When the loss of CO2 is compensated, there tends to be an opening of the stomata leading to a lower water use efficiency [8]. While plants fix carbon on to their biomass during the gas exchange process, there is a loss of water by evapotranspiration from the plant to the atmosphere. This causes their water use efficiency to rely upon two types of factors: Species self-characteristics and varieties related to their ability of optimizing the assimilation of C processes and water evapotranspiration, as well as the environmental characteristics in which the plant is being grown [9]. Therefore, sustainable production systems are been established; e.g., the use of productive genotypes tolerant to phytosanitary problems, organic production, and the use of cover crop plants. For instance, organic production has been promoted due to results and product profitability; however, more scientific techniques and evidences are needed to substantiate its effectiveness in production [2]. For that reason, said study consisted in understanding not only the physiological aspects of the plant and its response to the application of different sustainable production techniques but also its eco-physiological factors.
The current experiment was conducted at the Experimental Station of the Colegio Superior Agropecuario of Guerrero, located in Iguala, Gro., Mexico. The prevailing climate in the region is warm and dry [Awo(w)(i)g], with rainfall in summer (800 mm) and an average annual temperature of 26.4°C [10]. The soil in the region belongs to the Vertisol group, has a high content in clay, its porosity goes from 50% to 51%, pH of 8.1, its poor in organic matter, and possesses moderate permeability.
Twelve treatments were organized as a result of the product combination of the factors: Production systems organic (it consisted in some nourishment made of vermicomposting in a quantity of 12 t ha-1), semi conventional (chemical fertilizer with ammonium sulfate (Nitrogen), Triple 16 (Phosphorus), and potassium chloride (potassium) using formula 350-220-270), genotypes (Maradol and Maradona), and cover crop plants Canavalia, vegetative cover and no cover (Canavalia ensiformis was set alongside the furrows, dried leaves were incorporated as vegetative cover leaving a thickness of 0.20 cm, soil with no cover, and bare soil). It is worth mentioning that Canavalia was established on a density of 18 plants per treatment in a plantation frame of 1.7 m × 3 m. They were sown directly into the sides of the furrow after 20 days of transplanting, with a total of 72 plants in a land surface of 192.6 m2 (3,738.32 plants ha-1), and distributed in four treatments: T1, T2, T3, T4 (Tab. 1). They were distributed under a three-repetition experimental design of subdivided parcels for an output of 36 experimental units.
The papaya plants, used for this experiment, were sown on May 27th, 2017 in pots of 10 cm × 15 cm with a capacity of 0.5 kg. Two seeds were placed per pot. Transplanting occurred on September 16th, 2017 (111 d.a.t), and then moved onto a plantation frame of 1.7 m × 3 m. A total of 108 plants were distributed among the 12 treatments (9 plants per treatment).
Table 1: Grouping the experiment treatments in two genotypes of papaya, two production systems and three cover crop plants

The following physiological variables were established: temperature, CO2 assimilation, transpiration, water use efficiency, stomatal conductance, intercellular CO2; and leaf temperature. These were determined via CIRAS-3 Portable Photosynthesis System. Three leaves from the middle part of a plant were taken to quantify these variables in the months and production times on November-17 (66 days after transplanting), December-17 (96 d.a.t.), January-18 (127 d.a.t.), February-18 (158 d.a.t.), and May-18 (226 d.a.t.). To establish factors’ effect in crop productivity, the variable rate was considered at t ha-1 through crops at 236, 243, 250, 257, 265, 271, 298, 315, 322, and 330 d.a.t.
Data from each of these variables was used to conduct ANOVA through Statistical Analysis System [11]. The variables that had a significant effect were tested with Tukey’s multiple comparison (α = 5%), and Pearson correlation coefficient was carried out to define variables’ relation, as well.
The diurnal cycle served to determine the exact time in which the papaya crop has the highest assimilation of CO2 to take the corresponding variables. With the help of the CIRAS-3 Portable Photosynthesis System, it was determined that at 13:40 h the plants showed greater assimilation of CO2. For this reason, it was determined to take the measurements of the physiological variables on day 66 (November-17), 96 (December-17), 96 (December-17), 127 (January-18), 158 (February-18), and day 226 after transplanting (May-18) (Fig. 1).

Figure 1: Daytime diurnal curve of CO2 assimilation for papaya plants Maradol
According to statistical analyses, the production system factor registered substantial differences in November sampling. Similarly, the genotype factor proved to have significant changes in November, January and May samplings. Cover crop plants did not register significant differences for any of the samples tested, therefore; there was no interaction by the factors in the samplings carried out. Whereas treatments (product of factors´combination under study) (Tab. 2) had important variances in both November sampling (semi conventional-Maradona-Canavalia) and January sampling (semi conventional-Maradona-vegetative cover).
Table 2: Mean squares from the analysis of variance for CO2 assimilation, transpiration, water use efficiencies, stomatal conductance, intercellular CO2 and yield variables

The behavior of CO2 assimilation in each factors’ samplings can be seen in Figs. 2A–2C. In contrast to the highest assimilation of CO2 obtained in February, Tendency indicates that lower assimilation of CO2 occurred in November. Furthermore, it can be seen that lower values belong to those months wherein day length is shorter and days are longer; in addition, months’ temperatures correspond to the highest and lowest temperatures. Such situation may be the cause of said behavior.

Figure 2: Effect of production systems (A), genotypes (B) and cover crops’ (C) in CO2 assimilation for papaya crops
In other studies conducted under different conditions, in which a conventional production system with diverse genotypes had been used, Campostrini et al. [12] and Wang et al. [13] report higher values than those registered in this study, but de Lima et al. [14] report inferior assimilation rates to the current investigation; proving genotypes have dissimilar behavior when they are under a specific production system, as demonstrated by de Castro et al. [15]. They suggest genotypes have a significant variability for photosynthesis because of their adaptation to the environment.
Because of the close connection with CO2 assimilation and transpiration in most samples, correlations in CO2 assimilation with the variables presented positive correlation with stomatal conductance (Tab. 3). In that regard, Díaz et al. [16] state that stomatal conductance estimates the gas exchange rate and transpiration. In February, there was no relation with the stomatal conductance but there was with intercellular CO2. There was also some higher assimilation of CO2 regardless of the factors and treatments. This coincides to what Zhou et al. [17] suggested at low concentrations of intercellular CO2, the assimilation of CO2 rises. In conclusion, this analysis for positive correlations indicates that values for transpiration, water use efficiency, stomatal conductance, and intercellular CO2 (dependent variables) tend to increment as the assimilation of CO2 (independent variable) rises.
Table 3: Correlations in CO2 assimilation with transpiration, water use efficiency, stomatal conductance, and intercellular CO2 variables

ANOVA under an experimental design of subdivided parcels presented significant differences in February 2018 production systems. Genotypes, for its part, revealed major variances that were highly significant in November and May. The cover crop factor also showed a highly significant variance in February and May. The interaction of factor production system*, coverage showed some significance in November sampling, but highly significant evidence was exposed in May sampling. However, the *genotype* coverage interaction displayed some significance in February sampling, but highly significant evidence was presented in the latter sampling for the production system *genotype* coverage interaction, (Tab. 2). In factors’ combinations, November sampling presented significant differences with semi conventional-Maradona-Canavalia (8.11 mmol m-2 s-1); whereas in February with semi conventional-Maradol-vegetative cover (8.25 mmol m-2 s-1) and in May with semi conventional-Maradona-no cover (9.12 mmol m-2 s-1) were highly significant.
Figs. 3A–3C revealed the dynamics in transpiration during months’ sampling. Within the three factors, the tendency indicates there was low transpiration in January due to decreasing temperatures, in which case February showed the highest temperature.

Figure 3: Production system (A), genotypes (B) and cover crops’ (C) effect in transpiration for papaya crops
In studies handling different genotypes and systems, Wang et al. [13] and de Lima et al. [14] reported a transpiration of 7.80 mmol m-2 s-1 and 5.5 mmol m-2 s-1. These values are similar to those gathered in the current study using the production system and genotype factors. Synthetic cushioning influences transpiration directly, as values of 25.13 mmol m-2 s-1 for red cushioning and 24.87 mmol m-2 s-1 for black cushioning were shown in melon crops Zhou et al. [17]. This clearly indicates that the use of synthetic covers induces greater transpiration, while vegetative covers diminish the transpiration rate.
Correlation in transpiration with other variables can be observed in Tab. 4. It shows some positive correlation with stomatal conductance indicating their close connection, as it was previously mentioned in the CO2 assimilation section. Hence, these positive correlations point out that values for stomatal conductance and intercellular CO2 (dependent variables) tend to rise as transpiration (independent variable) increases. But as transpiration grows, the value for water use efficiency diminishes.
Table 4: Correlation in transpiration with stomatal conductance, intercellular CO2, and water use efficiency variables

3.4 Water Use Efficiency (WUE)
ANOVA presents some highly significant evidence (0.005** P ≤ 0.05, Tukey) in the cover crop factor during January and February samplings, but for production system and genotypes factors, no significant variances were registered during these months’ samplings. Regarding the interaction of factors’ production system*, genotype exhibited a significant effect in February samplings; however, for the production system * coverage interaction, very significant evidence was shown in January sampling. In addition to genotype*, the interaction coverage showed some significance in February. Likewise the interaction production system, * genotype * coverage showed some significance in January sampling, but for December, highly significant evidence was presented (Tab. 2). In treatments, however, there was a significant difference in December sampling with organic-Maradona-no cover (4.90 g fixed CO2 * kg-1 transpiration of H2O), but major differences both in January (semi conventional-Maradona-vegetative cover 3.02 g fixed CO2 * kg transpiration of H2O) and in February (organic-Maradol-Canavalia 3.77 g fixed CO2 * kg transpiration of H2O).
The dynamics in water use efficiency can be observed in Figs. 4A–4C. The best water use efficiency occurred in November and December, whereas it was less efficient in February and May because temperatures rose considerably. Zhou et al. [17] state that due to a less demand in evaporation, there is greater water efficiency in low temperatures. But in high temperatures, there is less water efficiency. This does not suggest that environmental factors and the plant itself influence water efficiency; on the contrary, atmospheric humidity is the most predominant factor that influences it [17].

Figure 4: Effect of production systems (A), genotypes (B), and cover crops’ (C) in water use efficiency for papaya crops
Tab. 5 displays the correlations in water use efficiency. Some negative correlations with most variables except with chlorophyll can be observed, indicating that environmental and physiological factors would make water use to be less efficient in the plant. Alcántara et al. [18] suggest that transpiration efficiency with concentrations of CO2 have a negative relation in leaves, as it can be observed in November sampling. Negative correlations, however, indicate that values for stomatal conductance and intercellular CO2 (dependent variables) decrease as water use efficiency (independent variable) increases.
Table 5: Correlation analyses in water use efficiency with stomatal conductance and intercellular CO2

Production systems presented significant differences (Significant evidence 0.015* P ≤ 0.05, Tukey) in November sampling, which were highly significant in January. Among genotypes, important variances in both December and January were registered, which were also highly significant in May. Cover crops shown some significant changes in May. In November sampling, genotype displayed some significance in the interaction of production system, in addition the interaction of production system* genotype coverage exposed greatly significant evidence (Tab. 2). Within treatments, there were important differences in November with semi conventional-Maradona-Canavalia (344.33 mmoles m-2 s-1), and in May with organic-Maradona-vegetative cover and semi conventional-Maradona-no cover (389.33-390.00 mmoles m-2 s-1), respectively. Highly significant differences were also registered.
Figs. 5A–5C shown stomatal conductance within months’ samplings. Factors behaved in the same manner to which low stomatal conductance can be observed in January, while in February high conductance was registered. As previously mentioned, this effect occurred due to low temperatures noted down in January. In an experiment carried out by Wang et al. [13] reported 180 mmoles m-2 s-1 for Tainung No. 2 variety; whereas de Lima et al. [14] registered 210 mmoles m-2 s-1 for Grand Golden variety. Consequently, the values listed in this study were low. Campostrini et al. [12] found higher values than the ones in the current study: 400 mmoles m-2 s-1 by using Sunrise Solo 72/12 genotype.

Figure 5: Effect of production systems (A), genotypes (B), and cover crops (C) on stomatal conductance in papaya crops
Tab. 6 shows the correlations in stomatal conductance with intercellular CO2 variable as well as the relations with months’ samplings. This coincides with the results reported by Collavino et al. [2], concentrations of intercellular CO2 control the opening of the stomata in relation to the photosynthetic demand of CO2 in the plant. As a result, low concentrations of intercellular CO2 stimulate the opening of the stomata and vice versa. This variable showed some positive correlation with the intercellular CO2 variable, which indicates that intercellular CO2 variable has the same tendency as the value of stomatal conductance increments.
Table 6: Correlations in stomatal conductance with intercellular CO2 variable

Significant differences among genotypes were observed in December and May. In cover crop, significant and major differences were registered in January and February samplings, respectively. The interaction among production system* coverage showed significant evidence in January, while amongst genotype factors* coverage revealed significant evidence in February and some highly significant evidence in January (Tab. 2). Among treatments, important variances were noted with semi conventional-Maradona-vegetative cover (313.00 µmol CO2 mol−1), however; February proved greater values with organic-Maradona-no cover (286.67 µmol CO2 mol−1).
Figs. 6A, 6B, and 6C show the behavior of intercellular CO2, in which concentrations were lower in November and May, whereas February presented higher concentrations of CO2. According to Alcántara et al. [18] small concentrations of CO2 in leaves enlarge the opening of the stomata but rising concentrations of CO2 reduces it. If intercellular CO2 serves as marker for photosynthesis activity, then the photosynthetic demand for CO2 is definitely related with the opening of the stomata.
In that regard, Wang et al. [13] found a value of 315 µmol CO2 mol-1 for the ‘Tainung No. 2’ variety. This value was superior to the one obtained in this study because diverse genotype and handling had been used.
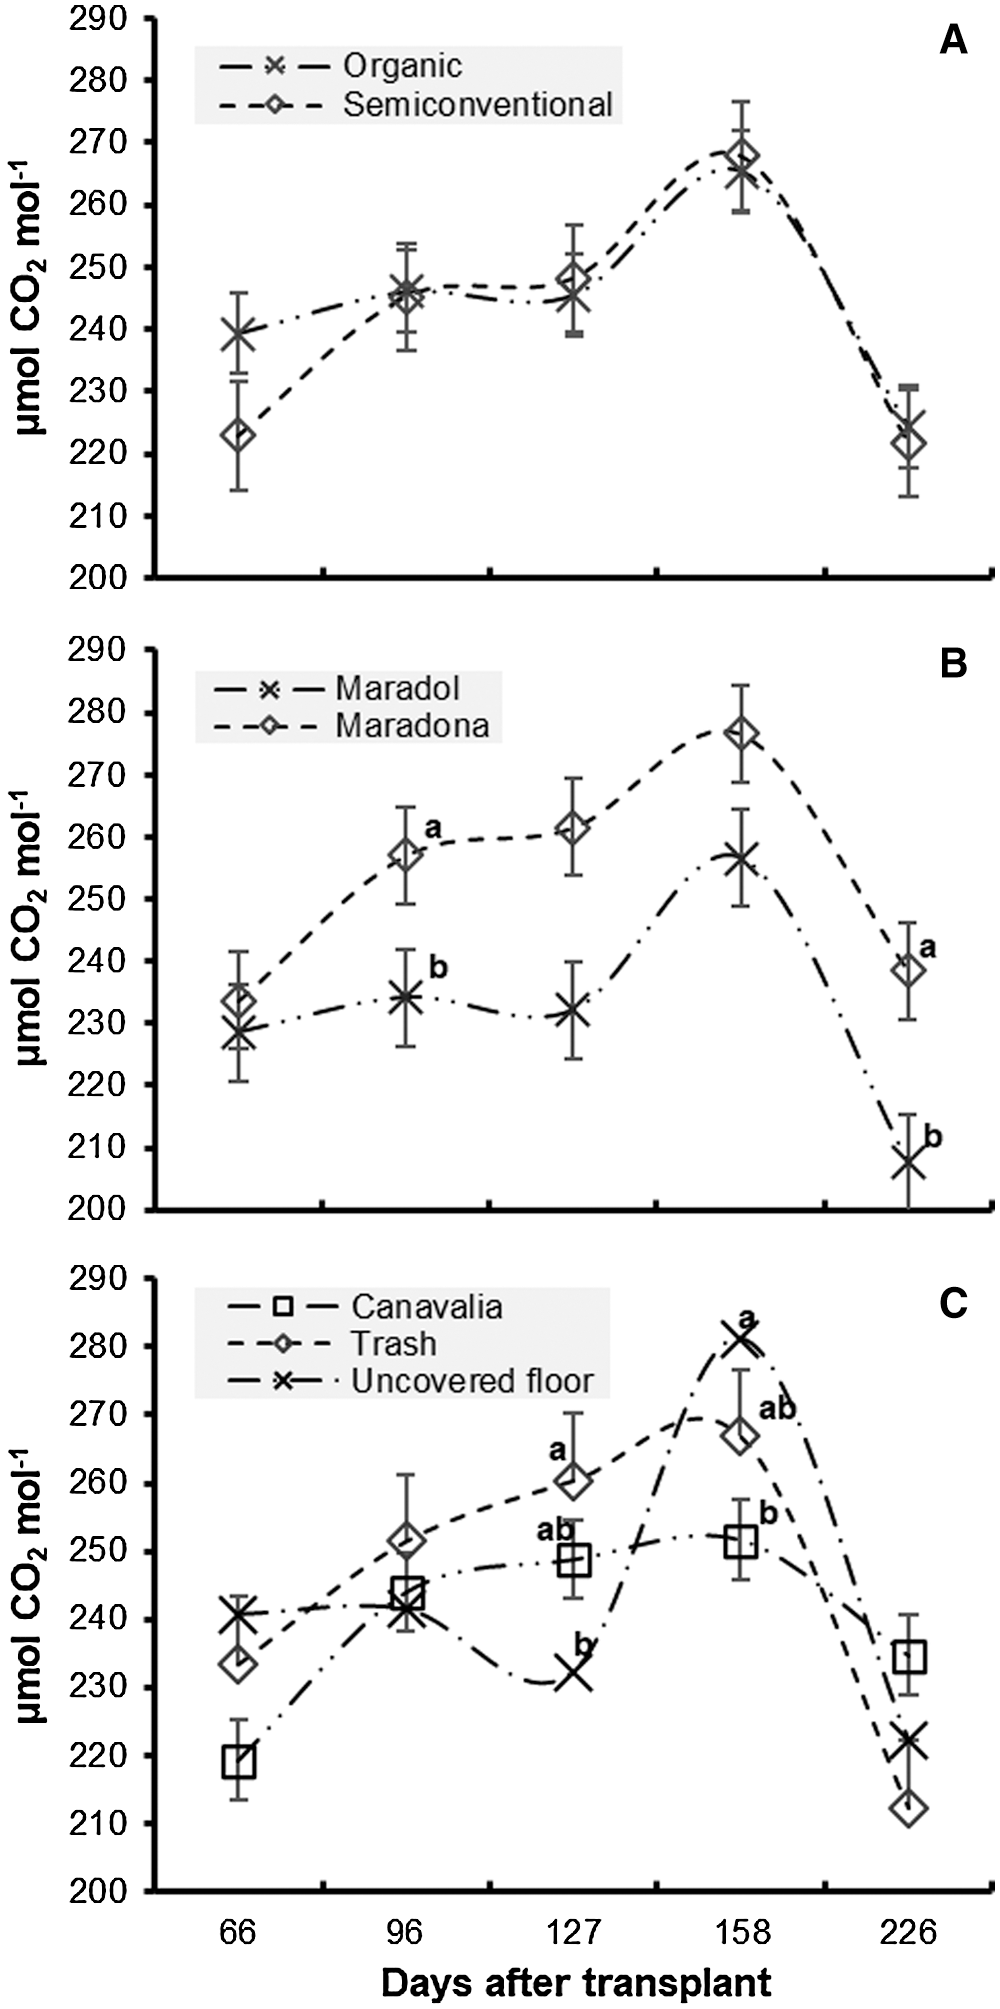
Figure 6: Production systems (A), genotypes (B), and cover crops’ in intercellular CO2 in papaya crops
As a result of the production system, yield exhibited extremely significant differences (Highly significant evidence 0.001* P ≤ 0.05, Tukey), but both genotype and cover crops factors did not display any significant effect in it. No significance was presented by the interaction among factors (Tab. 2), however; treatments did expose greatly significant differences.
Tukey’s multiple comparison determined that the semi conventional system was bigger in yield (43.843 t ha-1), followed by the organic system (23.66 t ha-1) with a slightly difference of 53.96%. It was also verified that the semi conventional-Maradona-Canavalia treatment, with a value of 53.45 t ha-1, had better yield than the other treatments (Tab. 7). Fig. 7 shows yield as consequence of production systems, to which the semi conventional production system excelled in comparison with the organic production system.
In other studies, a yield of 28.60 t ha-1 by using mineral fertilizers was noted, whereas with organic fertilizer, the yield was of 27.23 t ha-1 [2]. In response to chemical fertilization, the values gathered for papaya Maradol were of 91.14 t ha-1 [18]. The statistics of the Agricultural and Fisheries Information Service [1] indicated that the yield in the state of Guerrero was of 38.45 t ha-1. As previously mentioned, yields registered within the distinct studies and statistics were inferior to the ones gathered in this study.

Figure 7: Factors’ effect in papaya fruit yield (t ha-1)
Table 7: Treatments’ effect in yield (t ha-1) in response to CO2 assimilation rate in production systems for papaya

Assessed production systems (semi conventional and organic) did not exhibit any effects in water use efficiency nor in intercellular CO2, however, they did display some in CO2 assimilation rate, transpiration, stomatal conductance, and yield. Conversely, genotypes did not reveal any effects in water use efficiency nor in yield, yet there were some effects in CO2 assimilation, transpiration, stomatal conductance and intercellular CO2. Cover crops did not expose any effects in CO2 assimilation nor in yield, but they did in transpiration, water use efficiency, stomatal conductance and intercellular CO2.
In general, the best treatments (product of the factors’ combination) were semi conventional Maradona-Canavalia that displayed the best yield with an output of 53.5 t ha-1, followed by the treatments organic-Maradona-no cover, organic-Maradona-Canavalia; and semi conventional-Maradona-vegetative cover. These results are essential for domestic production since Mexico is one of the main producers worldwide, and it is the center of papaya origin. Thus, these suggested systems are expected to have some positive impact on production, as shown in this study. Previous results had clearly evidenced the response given by this crop. Furthermore, said results are based on some physiological principals for plant’s growth, yield, improvement, and microclimate. Considering these systems are focused towards a more sustainable handling, they can be beneficial for the grower.
Funding Statement: The authors received no specific funding for this study.
Conflicts of Interest: The authors declare that they have no conflicts of interest to report regarding the present study.
1. SIAP (2020). Producción Nacional. Por Estado. Ciclo: Perennes 2018. Mayo 2020, de SIAP Sitio web: http://nube.siap.gob.mx/cierre_agricola/ [Google Scholar]
2. Escamilla, G. J., Saucedo, V. C., Martínez, D. M. T., Martínez, G. A., Sánchez, G. P. et al. (2003). Fertilización orgánica, mineral y foliar sobre el desarrollo y la producción de papaya cv. Maradol. Terra, 21, 157–166. [Google Scholar]
3. Collavino, A. A., Florentin, J. L., Gaiad, J. E., Alayón, L. P. (2016). Desarrollo vegetativo y fenología del mamón (Carica papaya L.) bajo dos condiciones de cultivo. Agrotecnia, 23, 15–20. DOI 10.30972/agr.023591. [Google Scholar] [CrossRef]
4. Alonso, M., Tornet, R. R. Y., Farrés, E., Castro, J., Rodriguez, M. C. (2008). Evaluación de tres cultivares de papaya del grupo solo basada en caracteres de crecimiento y productividad. Cultivos Tropicales, 29(2), 59–64. [Google Scholar]
5. Jeyakumar, P., Kavino, M., Kumar, N. (2007). Physiological performance of papaya cultivars under abiotic stress conditions. Acta Horticulturae, 740, 209–215. DOI 10.17660/ActaHortic.2007.740.25. [Google Scholar] [CrossRef]
6. Buisson, D., Lee, D. W. (1993). Las respuestas de desarrollo de la papaya en la sombra simulada del dosel. American Journal of Botany, 80(8), 947–952. DOI 10.1002/j.1537-2197.1993.tb15316.x. [Google Scholar] [CrossRef]
7. Ogren, W. L. (1984). Photorespiration: Pathways, regulation, and modification. Annual Review of Plant Physiology, 35(1), 415–442. DOI 10.1146/annurev.pp.35.060184.002215. [Google Scholar] [CrossRef]
8. Díaz, H. Y., Torres, D. W., Rodríguez, C., Rodríguez, H. P. (2014). Respuesta de plantas de papaya silvestre (Carica cubensis solms) al estrés hídrico y su recuperación: Aspectos fisiológicos y del crecimiento. Cultivos Tropicales, 35(3), 55–61. [Google Scholar]
9. Medrano, H., Bota, S. J., Cifre, L. J., Flexas, S. J., Ribas, C. M. et al. (2007). Eficiencia en el uso del agua por las plantas. Investigaciones Geográficas, 43, 63–84. DOI 10.14198/INGEO2007.43.04. [Google Scholar] [CrossRef]
10. García, E. (2005). Modificaciones al sistema de Clasificación climática de Köppen. Cuarta edición. Instituto de Geografía. México: Instituto de Geografía, Universidad Nacional Autónoma de México. [Google Scholar]
11. SAS Institute Inc. (2012). SASuser’s guide: Statistics. Relase 6.03. USA: SAS Institute Incorporation, Cary, N.C. [Google Scholar]
12. Campostrini, E., Glenn, M. D. (2001). Ecofisiologia de la papaya. Brazilian Journal Plant Physiology, 4, 1–10. [Google Scholar]
13. Wang, H., Chang, J. C., Li, K. T., Li, T. S., Chang, L. S. (2014). Leaf age and light intensity affect gas exchange parameters and photosynthesis within the developing canopy of field net-house-grown papaya trees. Scientia Horticulturae, 165, 365–373. DOI 10.1016/j.scienta.2013.11.035. [Google Scholar] [CrossRef]
14. De Lima, N., Moura, F., De, A. F., Oliveira, A., Da Silva, B. et al. (2015). Partial rootzone dryng and regulated deficit irrigation effects on stomatal conductance, growth, photosynthetic capacity, and water-use efficiency of papaya. Scientia Horticulturae, 183, 13–22. DOI 10.1016/j.scienta.2014.12.005. [Google Scholar] [CrossRef]
15. De Castro, F. A., Campostrini, E., Netto, A. T., De Menezes, G. M., Ferraz, T. M. et al. (2014). Portable chlorophyll meter (PCM-502) values are related to total chlorophyll concentration and photosynthetic capacity in papaya (Carica papaya L.). Theoretical and Experimental Plant Physiology, 26(3–4), 201–210. DOI 10.1007/s40626-014-0018-y. [Google Scholar] [CrossRef]
16. Díaz, H. Y., Torres, D. W., Rodríguez, C., Rodríguez, H. P. (2014). Respuesta de plantas de papaya silvestre (Carica cubensis solms) al estrés hídrico y su recuperación: Aspectos fisiológicos y del crecimiento. Cultivos Tropicales, 35(3), 55–61. [Google Scholar]
17. Zhou, L., Eloisa, Q. R., Paull, R. E. (2020). Papaya (Carica papaya L.) leaf area estimation and single-leaf net photosynthetic CO2 assimilation rate following leaf defoliation and fruit thinning. HortScience, 55(11), 1861–1864. DOI 10.21273/HORTSCI15345-20. [Google Scholar] [CrossRef]
18. Alcántara, J. J. A., Aguilar, C. C., Leyva, B. S., Alcántara, N. A. O. (2019). Rendimiento y rentabilidad de genotipos de papaya en función de la fertilización química, orgánica y biológica. Revista Mexicana de Ciencias Agrícolas, 10(3), 575–584. DOI 10.29312/remexca.v10i3.1498. [Google Scholar] [CrossRef]
 | This work is licensed under a Creative Commons Attribution 4.0 International License, which permits unrestricted use, distribution, and reproduction in any medium, provided the original work is properly cited. |