International Journal of
Experimental Botany
| Phyton- International Journal of Experimental Botany |
DOI: 10.32604/phyton.2021.015093
ARTICLE
Mechanism of Photothermal Energy on the Growth and Yield of Rice under Water Level Regulation
1Zhejiang Institute of Hydraulics and Estuary, Hangzhou, 310020, China
2North China University of Water Resource and Electric Power, Zhengzhou, 450045, China
*Corresponding Author: Yuanyuan Li. Email: liya66720@126.com
Received: 20 November 2020; Accepted: 26 January 2021
Abstract: The flooding caused by heavy rainfall in rice irrigation area and the drought caused by the drop of groundwater level are the research focus in the field of irrigation and drainage. Based on the comparative experiment and farmland water level control technology, this paper studied the average soil temperature under different soil layers (TM), the daily temperature change (TDC), the photosynthetic accumulation of single leaf and canopy in rice, and response of photothermal energy to rice root characteristics and growth factors in the paddy field under drought conditions. The results showed that the peak soil temperature under drought treatment was basically synchronous with the conventional irrigation, and the it was delayed by 2–6 h under flooding treatment compared to the drought treatment. Under different water gradients, the temperature decreased according to TL > TCK > TH (L, H and CK represented water flooding, drought and control treatments), and the TDC was opposite. In addition to milky stage, the daily photosynthetic (Pn) accumulation of single leaf and canopy in the flooding and drought treated paddy fields were lower than conventional irrigation, and had a negative impact on leaf area index (LAI) and yield (YR), but did not form fatal damage. The root characteristic factors, RL (root length), RW (root weight), R-CR (root-canopy ratio) were promoted with drought, and YR under light drought was slightly higher than that under heavy drought. There was a strong positive correlation between TM and R-CR in all rice growth stages, while TDC-5 was negatively correlated with effective panicle number, TDC and R-CR in 20 cm soil layer were positively correlated. The correlation between daily Pn accumulation and YR was low, and the correlation between Pn and YR factors was negative or weak positive or negative. The total Pn was positively correlated with yield factors, and the correlation coefficient was higher than that of daily Pn.
Keywords: Water level regulation; soil temperature; daily accumulation of photosynthetic quantity; growth factor; response relationship
Rice grows in the seasons with rain and heat, and water in the field surface with deep flooding cannot be eliminated in time due to the heavy rainfall process, or there is no leakage because of the surrounding water level, resulting in a waterlogging disaster. On the other hand, when the groundwater level descends to a certain depth, the soil moisture of the root layer cannot meet the requirements of the root water absorption. At this time, the rice growth suffers from drought due to water stress. The problem of waterlogging and drought in rice was actually the problem of the farmland water level change [1–3]. The farmland water level refers to the maintained water depth of the paddy field when there has the water layer after rainfall or irrigation, and the groundwater level when there has no water layer in the field. The strategy of maintaining proper water depth or groundwater level through the irrigation and drainage measures in the field is called farmland water level regulation. At present, the response mechanism of farmland water level regulation to crop water saving and emission reduction has become a hot issue in the agricultural water and soil field [4,5].
The temperature of field soil is the most important meteorological element in rice ecological environment. Photosynthesis, respiration, net assimilation rate, tillering rate and nutrient uptake of rice were all related to paddy field temperature [6]. At the same time, soil temperature affected crop root growth, vegetative growth and reproductive growth [7]. Abel found that [8], the absorption of phosphorus decreased under low temperature condition for rice. The conversion of soil organic matter, the release of nutrients and the movement of water and gas in the soil were also affected by soil temperature. However, there were few studies on soil temperature changes under the control of farmland water level, especially the response of soil temperature to crop growth under the control of farmland water level. As one of the most important physiological processes of crops, photosynthesis was the process in which leaves produce organic matter, which can provide energy and material accumulation for crop growth and development [9,10]. For the physiological response of crops under rain disasters and water stress, a lot of research work has been done by domestic and foreign scholars, and also a relatively systematic system has been formed for the response mechanism. Li et al. [11] compared several physiological indicators, growth and yield indicators in the late growth stage (jointing-booting stage and milky stage) of rice after treatment with flooding stress. The results showed that the net photosynthetic rate of fully extended leaves decreased after the flooding, the root injury flow decreased, the root activity decreased, the effective panicle decreased, the seed setting rate decreased significantly, the 1000-grain weight decreased, and the grain yield decreased. Both Candogan et al. [12] and Carroll et al. [13] found that drought had a great influence on the leaf water condition and cell expansion, which in turn affected the extension of leaf area and caused the leaf area decreasing. Ahmadi et al. [14] believed that the responding of roots was prior to aerial parts under water stress conditions, and moderate drought conditions could promote root growth and root ligature, and increase root branching, but it resulted in root growth inhibition, branch reduction, dry matter and root length reduction under severe drought condition. Oikeh et al. [15] carried out experiments on water stress in different growth stages of rice, and the results showed that drought in the heading-milky stage would lead to severe yield reduction, but moderate drought in the vegetative growth stage (before the effective tillering end period) would result in production increasing.
At present, most scholars at home and abroad has studied the physiology, growth and physicochemical laws of crops from a single perspective of water-saving irrigation or controlled drainage technology, and response mechanism on growth effects of the light and heat caused by the joint regulation of water-saving irrigation and control drainage (farmland water level regulation) was lacking in research [16,17]. In this paper, the regulation indexes of irrigation and drainage were unified to the farmland water level, to study the changes of soil temperature and cumulative photosynthetic quantity in roots under rain disaster and water stress, exploring the response mechanism on crop growth factors. Compared with soil moisture content, farmland water level had no spatial variability, which was easier to observe and master in practice. The results have a profound understanding of the response mechanism of irrigation and drainage synergy to crop growth in southern rice irrigation districts, and the development of high-efficiency irrigation and drainage agriculture, promoting agricultural sustainable development, enriching crop irrigation and drainage theory, and have important scientific and practical significance.
The experiment was carried out in Key Laboratory of Efficient Irrigation-Drainage and Agricultural Soil-Water Environment in Southern China, Ministry of Education from June to October in 2011~2012. The experimental area belongs to the subtropical humid climate. The average annual rainfall is 1021.3 mm, with about 120 rainfall days. Among them, the rainfall during the flood season (May to September) accounts for more than 60% of the average annual rainfall. The average annual evaporation in this area is 900 mm. The average annual temperature is 15.7°C, and the highest monthly average temperature is 28.1°C. The maximum average humidity is 81%, the annual sunshine hours are 2212.8 h, and the annual frost-free period is 237 d.
There were 32 fixed steaming pits in the test area. The measuring pit (including 28 with bottom and 4 without bottoms) was arranged in two rows from east to west in sequence. The measuring pit size is 2.5 m × 2.0 m × 2.0 m (length × width × depth), The ground part of each pit was equipped with automatic watering solenoid valve equipment, and the corresponding large water column was connected underground. The internal probe can be used to automatically control the groundwater level of the pit. The soil in the measuring pit was clay loam, which was formed by layering back and compacting the local soil. The physical and chemical parameters of 0~30 mm soil in the pit were as follows: the bulk density was 1.46 g/cm3, the pH value was 6.97, the total nitrogen content was 0.9048 g/kg, the available nitrogen content was 27.65 mg/kg, and the total phosphorus content was 0.32 g/kg, the available phosphorus content was 12.5 mg/kg, the soil organic matter content was 2.40%, and the field water holding rate was 25.28%.
The rice (Oryza saliva 4038) was transplanted after seedling. Transplanting density was 10 rice plants per m2. Rice was grown using the random block method with three replications. The whole growth period of rice is divided into five stages: re-greening stage, tillering stage, jointing-booting stage, heading-flowering stage and milky stage stage. The re-greening period is the recovery period after rice planting, and the physiological growth of rice in the yellow ripening period has no obvious response to the stress. Therefore, four main growth stages from rice tiller to milky were selected for study. The water level regulation test is designed by combining the water level and water control duration (Tab. 1). There were two fertilizations during whole rice growth stage. Basal fertilizer was compound fertilizer, with ration of N,P,K was 15:15:15, and fertilizer amount was 2000 kg/hm2. The tillering fertilizer was urea, with 46.4% of nitrogen and fertilizet amount of 647 kg/hm2.
Table 1: Water level regulation scheme and water control stages division in 2011 and 2012
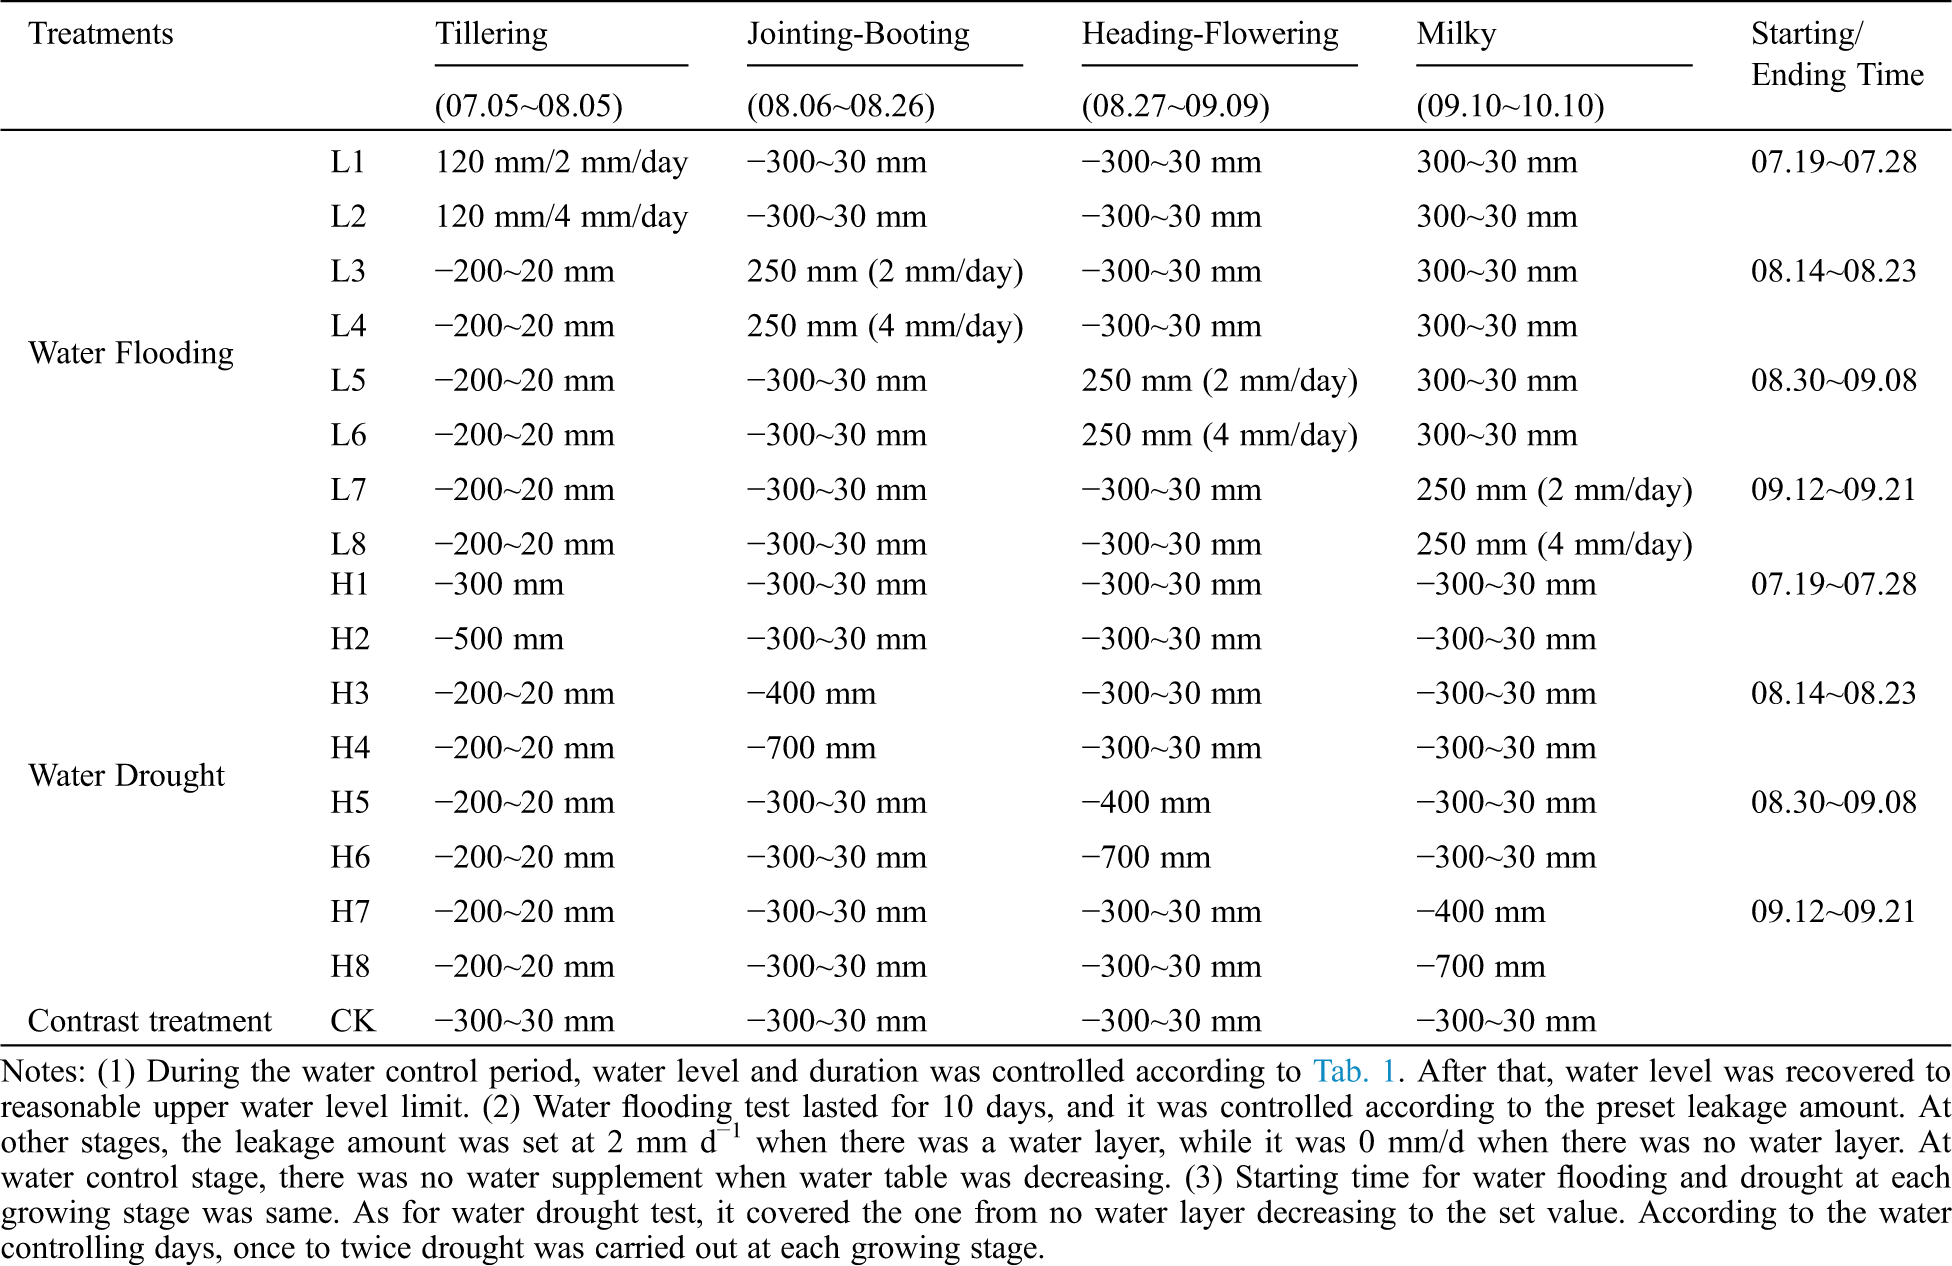
The deep flooding of rice and maintaining a certain leakage strength can be considered to be flooding. Two leakage strengths are designed for the flooding test, with 2 mm/d and 4 mm/d respectively. The rice plants in the tillering stage were shorter, the flooding water level was designed to be 120 mm, and the flooding water level during the jointing to milky stage was 250 mm, with flooding days kept for 10d. The dynamic process of paddy field water level was simulated after a short-term heavy rainfall without replenishing water even water level drops. In the drought test, the groundwater depth is considered as the regulation water level, and two water levels are designed for each growth stage. The water level in the tillering period was −300 mm and −500 mm, while it was −400 mm and −700 mm from jointing to milky stage. The drought test was naturally reduced from the anhydrous layer to the set value, which simulates the dynamics of the groundwater level.
(1) Cumulative photosynthetic: Cumulative photosynthetic is mainly calculated by statistical models based on meteorological factors, and estimated based on single-leaf instantaneous photosynthetic rate measurements, and calculations based on meteorological factors for single-leaf photosynthetic models. The daily cumulative photosynthetic quantity of single-leaf at the end of water control in each growth period of rice under the water level regulation can be easily obtained according to the measured daily variation of net photosynthetic rate. The calculation formula is:
which, Pn(i), Pn(i+1) were the instantaneous photosynthetic rate values (μ mol · m−2 · s−1) of the single leaf measured for the i-th and i+1th times, respectively, Hi is the time interval (s) of the i-th and i+1th measurements, n is the number of measurements. When calculating the cumulative photosynthetic amount during the growth period, the cumulative values of each day were calculated by the regression equations after the water-controlling during the flood control and the drought-controlled period, while the cumulative values at the other time periods were calculated by the comparison relationship equation, and the canopy photosynthetic rate was estimated by Pn × LAI, which simplifying the simulation of the canopy structure, and the canopy is seen as a horizontally extended blade structure, which promotes the photosynthesis from leaf-scale to canopy scale.
(2) Soil temperature: Since soil temperature mainly changes in the top soil, we collect soil temperature data the measurement every 6 min in 5 cm and 20 cm soil layer by the current source type temperature sensor AD590 embedded in the lysimeter.
(3) Root and yield indicators: After the treatment of the water level control, a single point of rice plant was taken at random. After cleaning, the root length, root weight, root-shoot ratio and white-yellow black root amount were investigated. After tillering start, leaf area index (LAI) was measured every 5 days by LAI-2000 canopy analyzer. Before harvesting, plant sample was randomly selected in each pit, to count the number of panicles and the number of solid glutinous grains in the specified area, and then calculate the seed setting rate. After harvesting, 1000-grain weight and theoretical yield was calculated by randomly selecting 1000 grains of solid particles.
Simple data calculation and diagramming was completed by Excel 2010. Correlation analysis and regression analysis was carried out by IBM SPSS Statistics 19.
3.1 Daily Change of Soil Temperature in Different Soil Layers
The daily change of soil temperature in different soil layers during the growth period of rice under the control of farmland water level in paddy field was shown in Fig. 1. It can be seen that the average soil temperature (TM) of 5 cm soil layer for drought treatment H at the tillering stage was the lowest at 6:00, and was synchronous with CK, which was 2 h ahead of flooding treatment L. The lowest soil temperature was in accordance with TL > TCK > TH order, reaching its peak at 14:00 for drought treatment H, synchronized with CK, while L was delayed until around 18:00, and the highest soil temperature followed the order of TH > TCK > TL. The average daily soil temperature under different water gradients was TL > TCK > TH, and the daily change of soil temperature increased in turn of TL < TCK < TH.
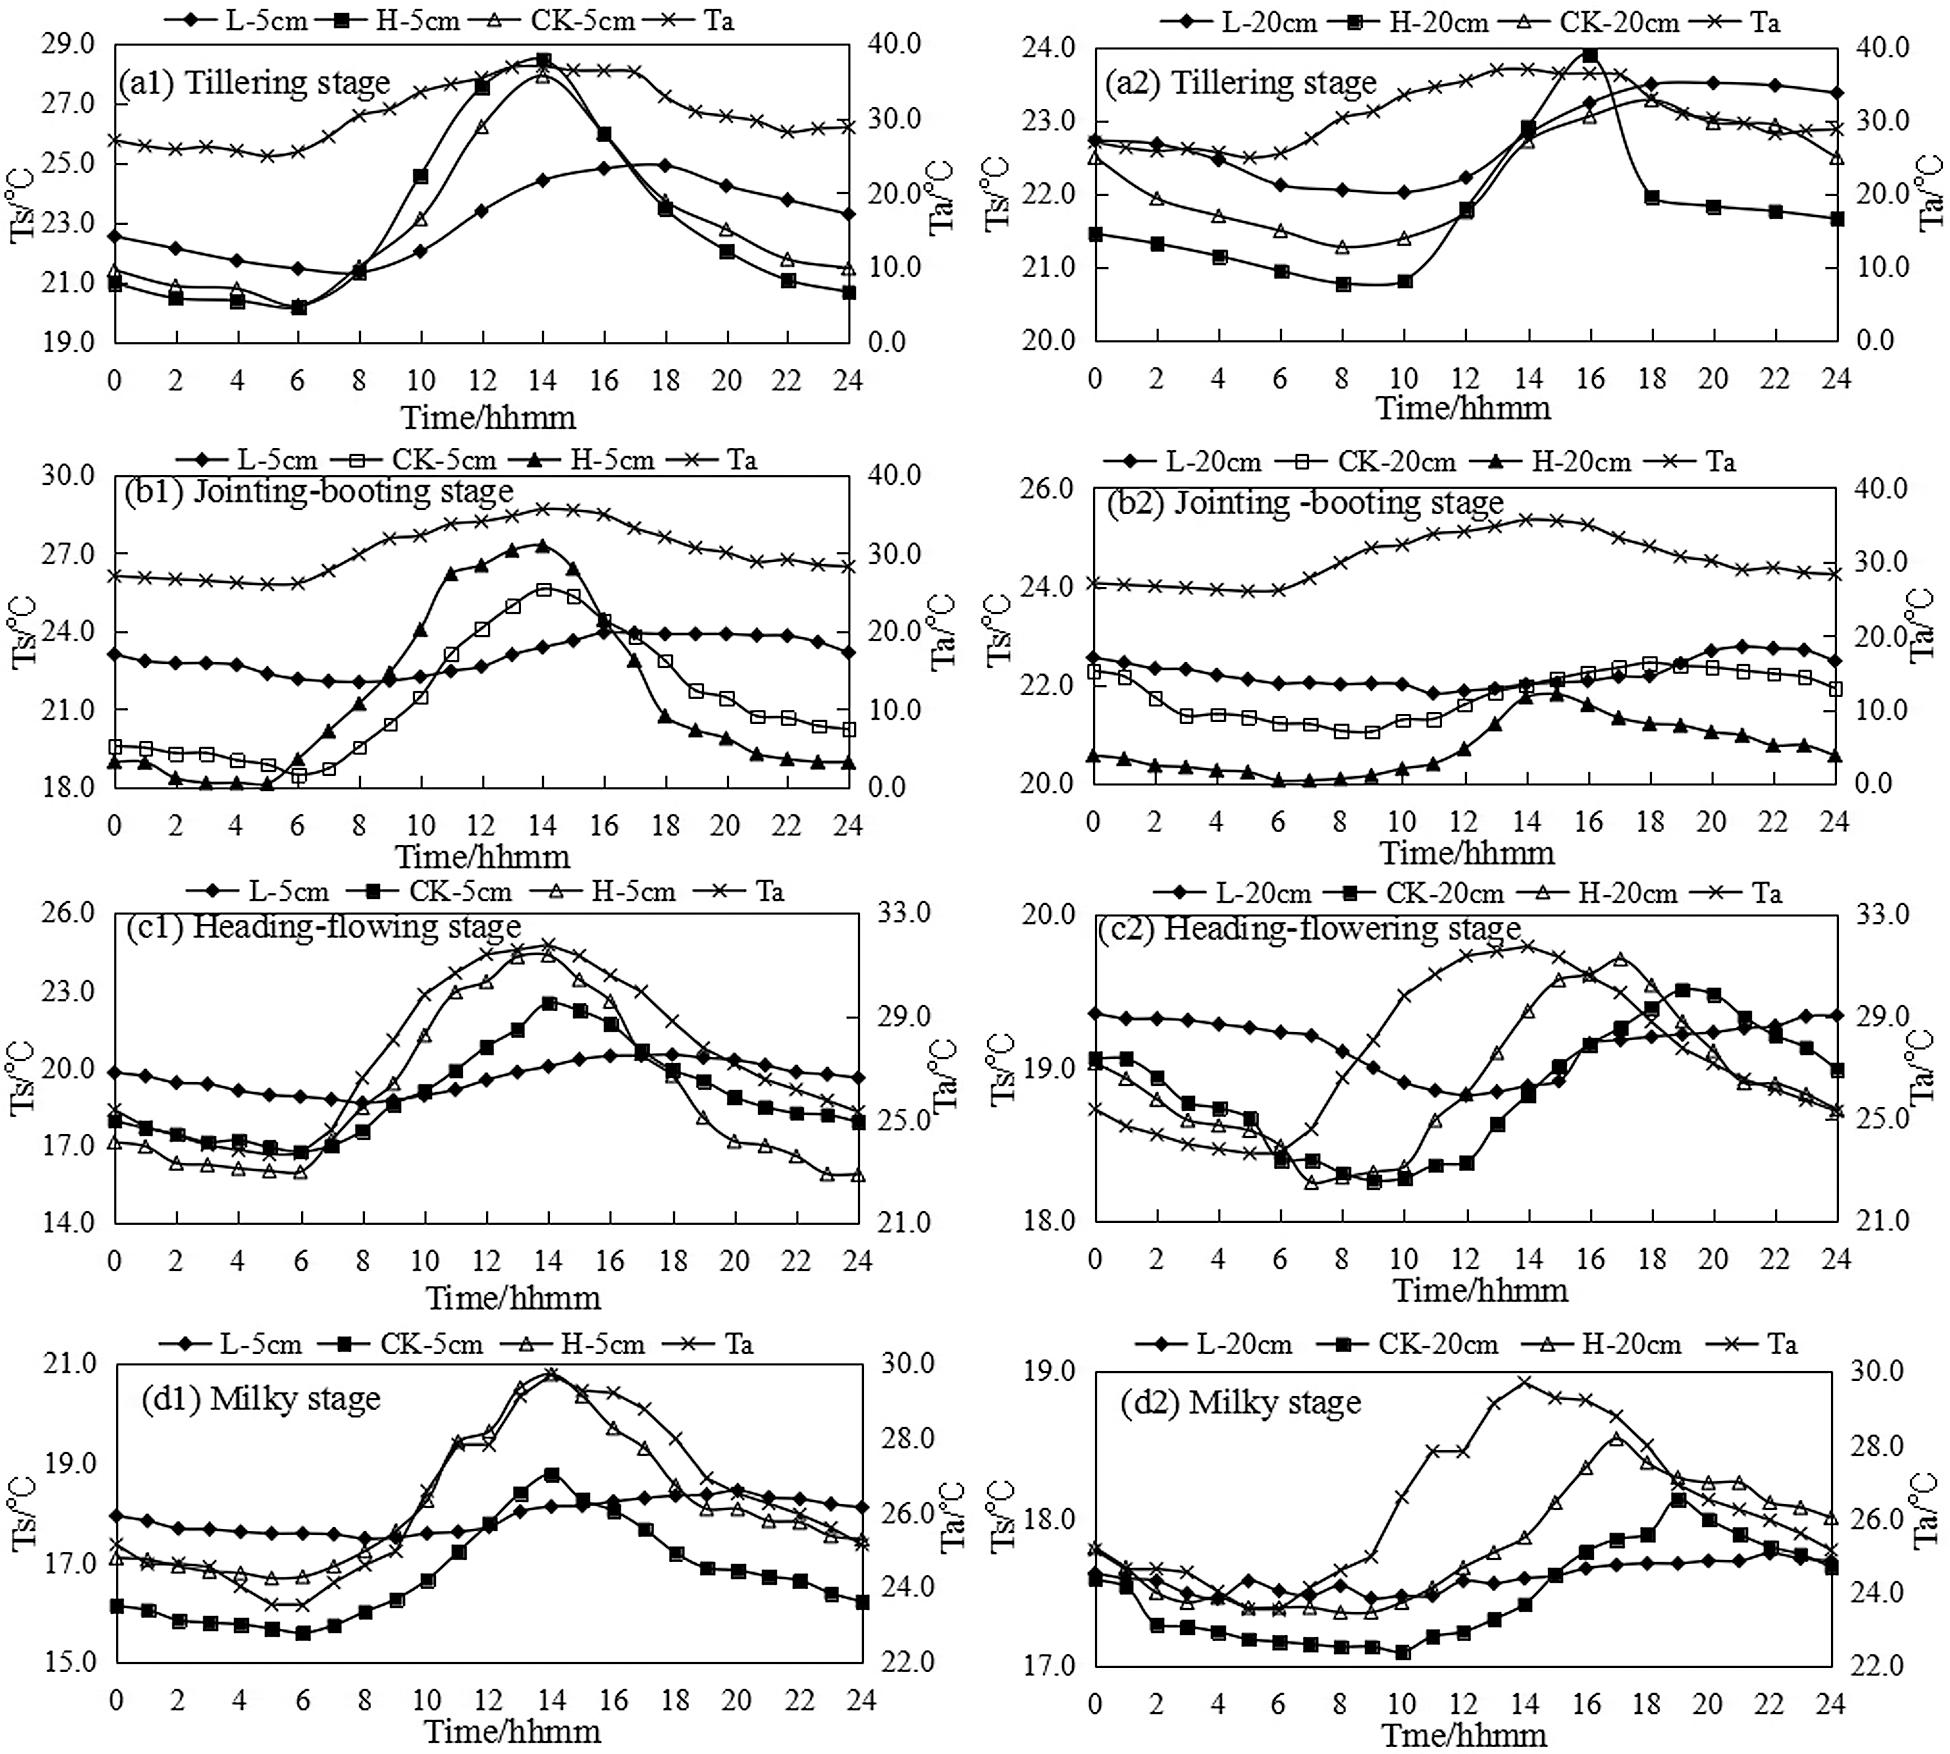
Figure 1: The daily variation of soil temperature in different soil layers under different water condition. Note: hhmm was the abbreviation of Hour Hour Minute Minute
The soil temperature change at the jointing-booting stage and the heading-flowering stage were consistent with the tillering stage. The soil temperature of the drought treatment H reached the highest value at 14:00, while it was delayed about 2–6 h for the flooding treatment. This was mainly because the water content was low and heat capacity was small for the drought treatment, thus the soil warmed and cooled rapidly, while the water layer for the flooding treatment can play the role of cooling at daytime and heat preservation at nighttime, thus the soil moisture was high and the heat capacity was large, and the temperature raised and cooled slowly.
The soil temperature change at milky stage was basically consistent with the previous three growth stages. The drought treatment H was arranged at the outermost edge of the test area, and the boundary effect was obvious. Therefore, the average soil temperature was higher, and the average temperature was slightly lower than the flooding treatment by 0.19°C. The soil temperature change range of the drought treatment was 4.1°C, which was 3.13°C higher than that of the flooding treatment.
The daily variation of soil temperature in 20 cm soil layer was consistent with that in 5 cm soil layer under different water condition. The soil temperature under drought treatment H was the lowest at 7:00~8:00, which delayed 0~2 h than the control treatment CK, and delayed 2~4 h compared to flooding treatment L, reaching peak at 15:00~16:00, and 2~3 h and 4~6 h ahead of CK and L treatments.
3.2 Daily Accumulation of Photosynthesis of Single Leaf at Growth Stages under Water Regulation
The curve of daily accumulation of photosynthesis (DAP) of rice at the end of each growth stage was shown in Fig. 2. Since the end time water control for drought and flooding treatments was not synchronized, the measurement dates of the first three growth periods were different. It can be seen that the daily cumulative curve of photosynthetic quantity was the S-type growth curve, and the cumulative photosynthetic amount at the end of water control for drought and flooding treatments was lower than the control treatment at tillering stage, the jointing-booting stage, the heading-flowering stage, while at the milky stage it was slightly higher for drought treatment and lower for flooding treatment compared to the control treatment.
For the estimation of the daily cumulative photosynthetic quantity during the rice growth stage without the measured daily variation, considering the dynamic variation of the effect of water level regulation on the photosynthetic rate of rice in a short period of time, this paper used instantaneous photosynthetic rate of the single-leaf at 10:00 am to estimate its corresponding daily accumulation. For regression analysis in Fig. 3, the regression equation and coefficient were as follows:
for control treatment,
for flooding treatment,
for drought treatment,
It showed that there was a good linear relationship between the net photosynthetic rate and the daily cumulative photosynthetic amount, and the net photosynthetic rate at 10 am can be used to estimate the daily cumulative photosynthetic amount. Johnson et al. [18] established a model for calculating cumulative photosynthetic quantity using meteorological factors, which can estimate the cumulative photosynthetic quantity of a certain day, a certain growth stage and the whole growth period. This paper applies linear relationship between net photosynthetic rate and daily cumulative photosynthetic quantity at 10 am, and the calculation process was simpler, and also the calculation result was more reliable.
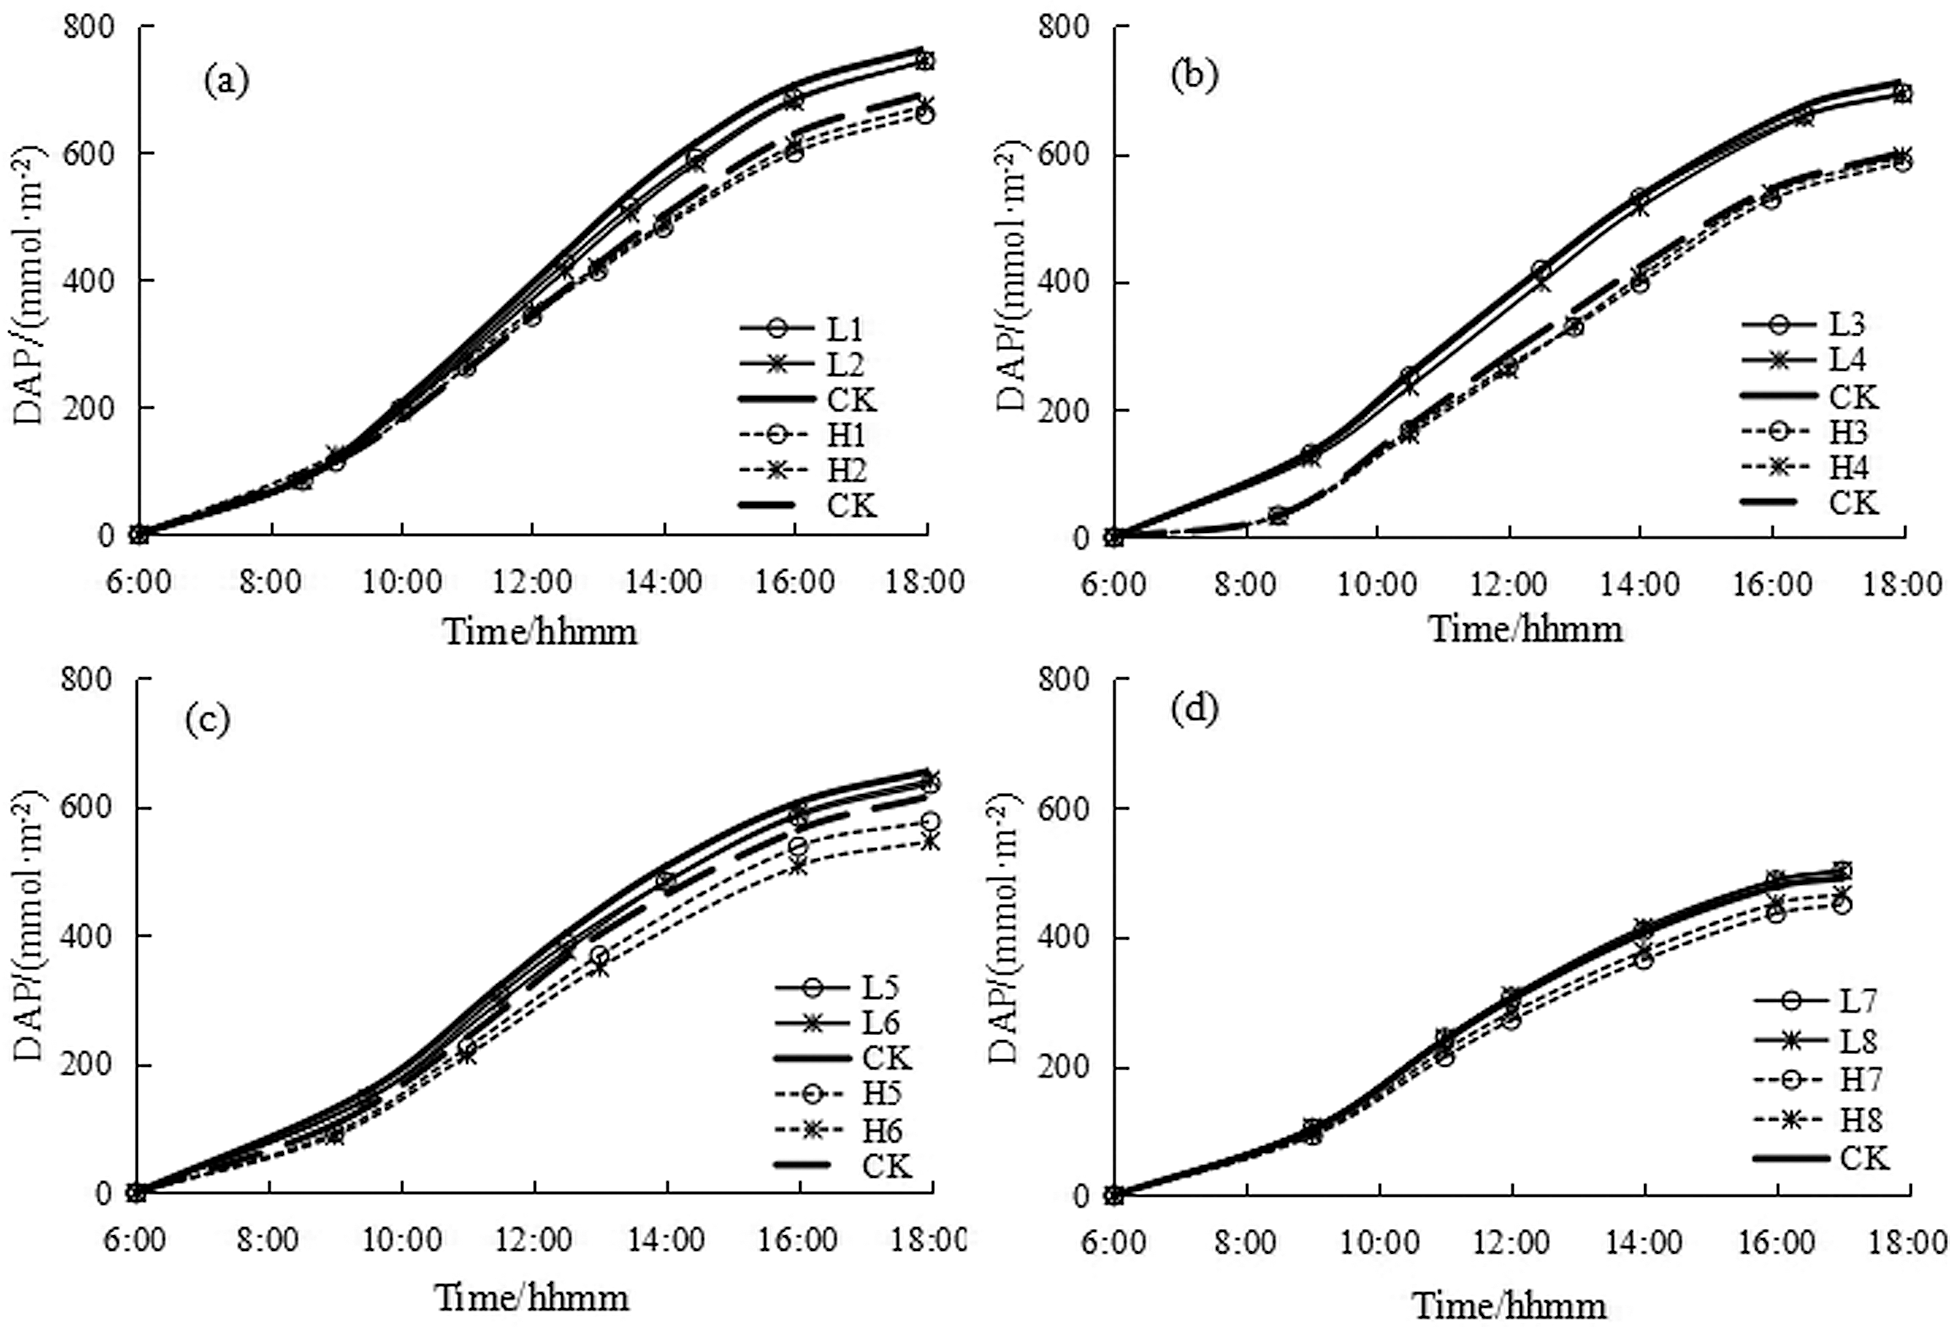
Figure 2: The daily photosynthesis accumulation of single rice leaf at the end of each growth stage. (a) Tillering stage, (b) Jointing-booting stage, (c) Heading-flowering stage, (d) Milky stage
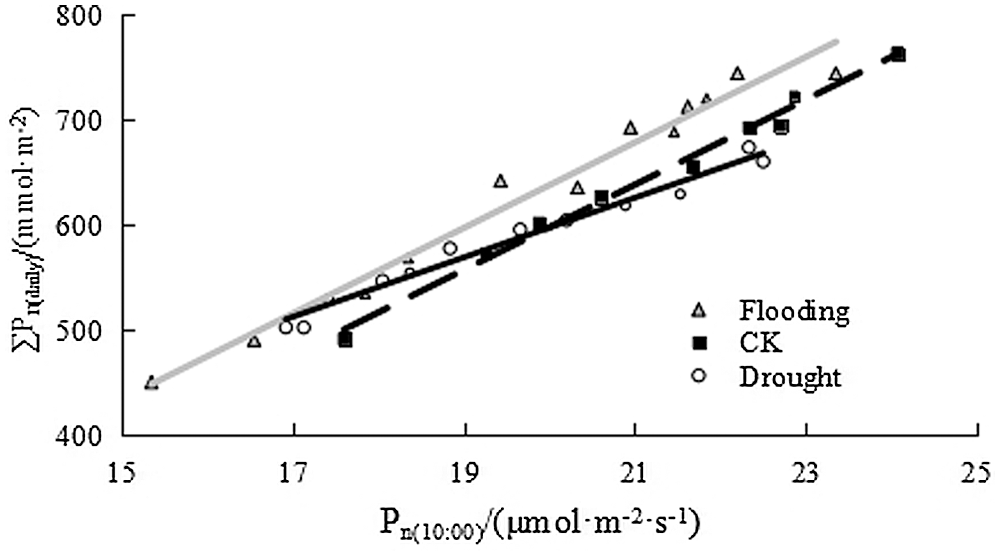
Figure 3: Relationship between net photosynthesis rate and daily cumulative photosynthetic rate of single rice leaf at 10 am under water level regulation
3.3 Photosynthetic Accumulation of Single Leaf and Canopy under Paddy Water Regulation
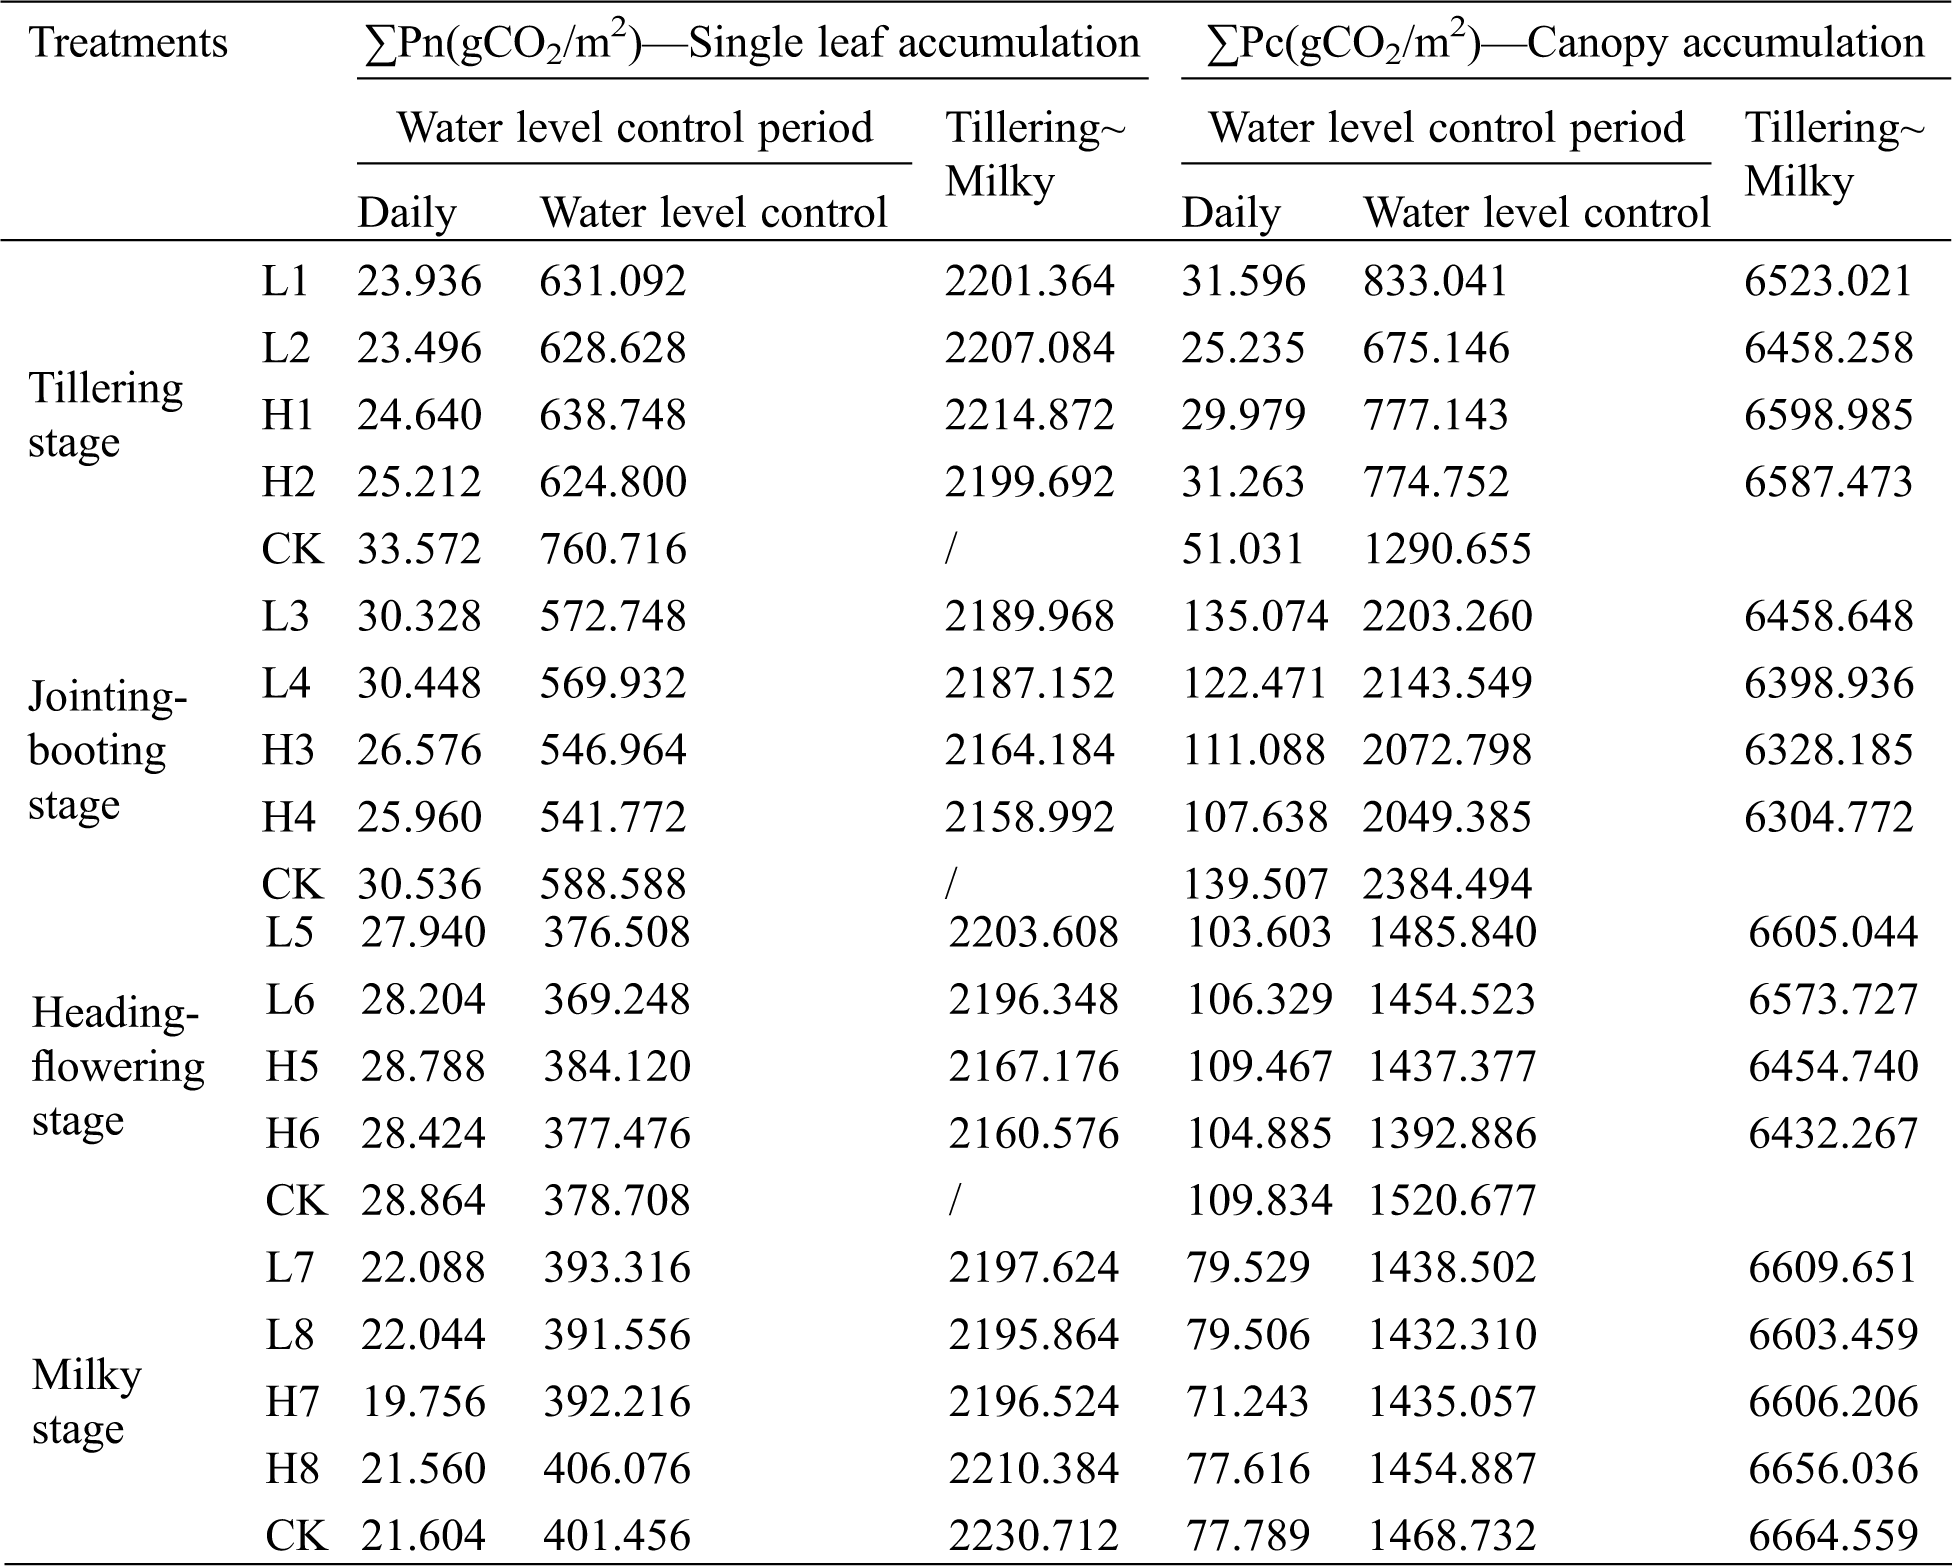
The daily cumulative photosynthetic amount of the single-leaf and canopy at each growth stage of the rice, the photosynthetic accumulation in the water-control growth period and from tillering to the milky stages were shown in Tab. 2. It can be seen that the daily cumulative photosynthetic amount of the single-leaf and canopy under control treatment at the tillering to the flowering-heading stages was higher than that under drought and flooding treatments, and it was higher at the milky stage under flooding treatment. The cumulative photosynthetic of the canopy from tillering to milky stage under water-controlled treatments of flooding and drought was lower than that of the control. Since the calculation of the cumulative photosynthetic amount of the canopy took consideration of the dynamic change of the leaf area index, it was able to show the photosynthetic accumulation of rice at different water levels and the difference between them. In this paper, the net photosynthetic rate measured at 10 am was used for regression estimation, considering the photosynthetic decline during water level treatment and the compensation effect after rehydration, the regression relationship was obtained under sunny conditions. The calculation of cumulative photosynthetic amount during growth period did not consider cloudy days, therefore, the situation caused a certain estimation error. The controlling factors of photosynthetic rate in canopy were photosynthetic rate of single leaf, leaf area index and canopy structure. Affected by various environmental factors in the canopy, especially the difference in photosynthetically active radiation at different depths within the canopy has a greater impact on the leaves, causing the leaves to exhibit different photosynthetic characteristics [19].
Table 2: Photosynthetic accumulation of single leaf and canopy under water regulation
3.4 Effect of Water Level Regulation on Root Characteristic and Yield
Rice root color is an important indicator of root activity. Root weight and root-canopy ratio reflect the condition of root growth and dry matter accumulation. Rice roots are closely related to growth of aboveground part and yield formation. The distribution of white, yellow and black roots amount in rice at different growth stages under water level regulation was shown in Fig. 4a. From the whole growth period, the roots of rice were mainly yellow roots, and the black roots were the least. A certain number of white roots were more before and then less after. White roots were much more at the tillering stage, reaching 5% to 25%. After the jointing-booting stage, the number of white roots decreased rapidly, and there was almost none at milky period. A certain number of black roots appeared during the whole growth period, and there were different rules under different water level regulation treatments. During the growth period, the number of black roots under flooding treatments was higher, which was mainly due to the lack of oxygen around the roots caused by flooding, and the increase of reducing substances produced toxic effects, which caused some yellow roots to decay into black roots, while the soil aeration was increased under drought treatment, improving the water, fertilizer, gas and heat conditions in the paddy field, which was beneficial to the metabolic growth of the root system. The changes in root length, root weight and root-canopy ratio of rice at each growth stage was shown in Fig. 4b. It can be seen that during the whole growth period, the root length and root weight was low at the beginning and end of water level regulation, while it was high in the other periods. The root-canopy ratio was on a downward trend. Compared with the control of different water levels, the root length, root weight and root-canopy of rice treated with drought were larger, while they were opposite under the flooding treatment. It illustrated that under the condition of drought, the roots of rice exerted the characteristics of water-promoting, promoting root system growing downward, increasing root length and dry matter accumulation, and increased root-canopy ratio. The rice yield under water level regulation was shown in Fig. 4c. It can be seen that flooding or drought at different growth periods will result in different degrees of yield reduction. Among them, the yield reduction of rice was the most obvious at heading-flowering stage affecting by flooding or drought, and the milkying stage and the jointing-booting stages were the second, while the tillering period had the least impact. The yield under higher leakage (4 mm/d) was slightly higher than that under small leakage (2 mm/d), and it under light drought was slightly higher than that under heavy drought. Xu et al. [20] also found the yield under light drought was higher than that under heavy drought. Water stress occurs at different growth stages, and the mechanism of impact on yield is different.
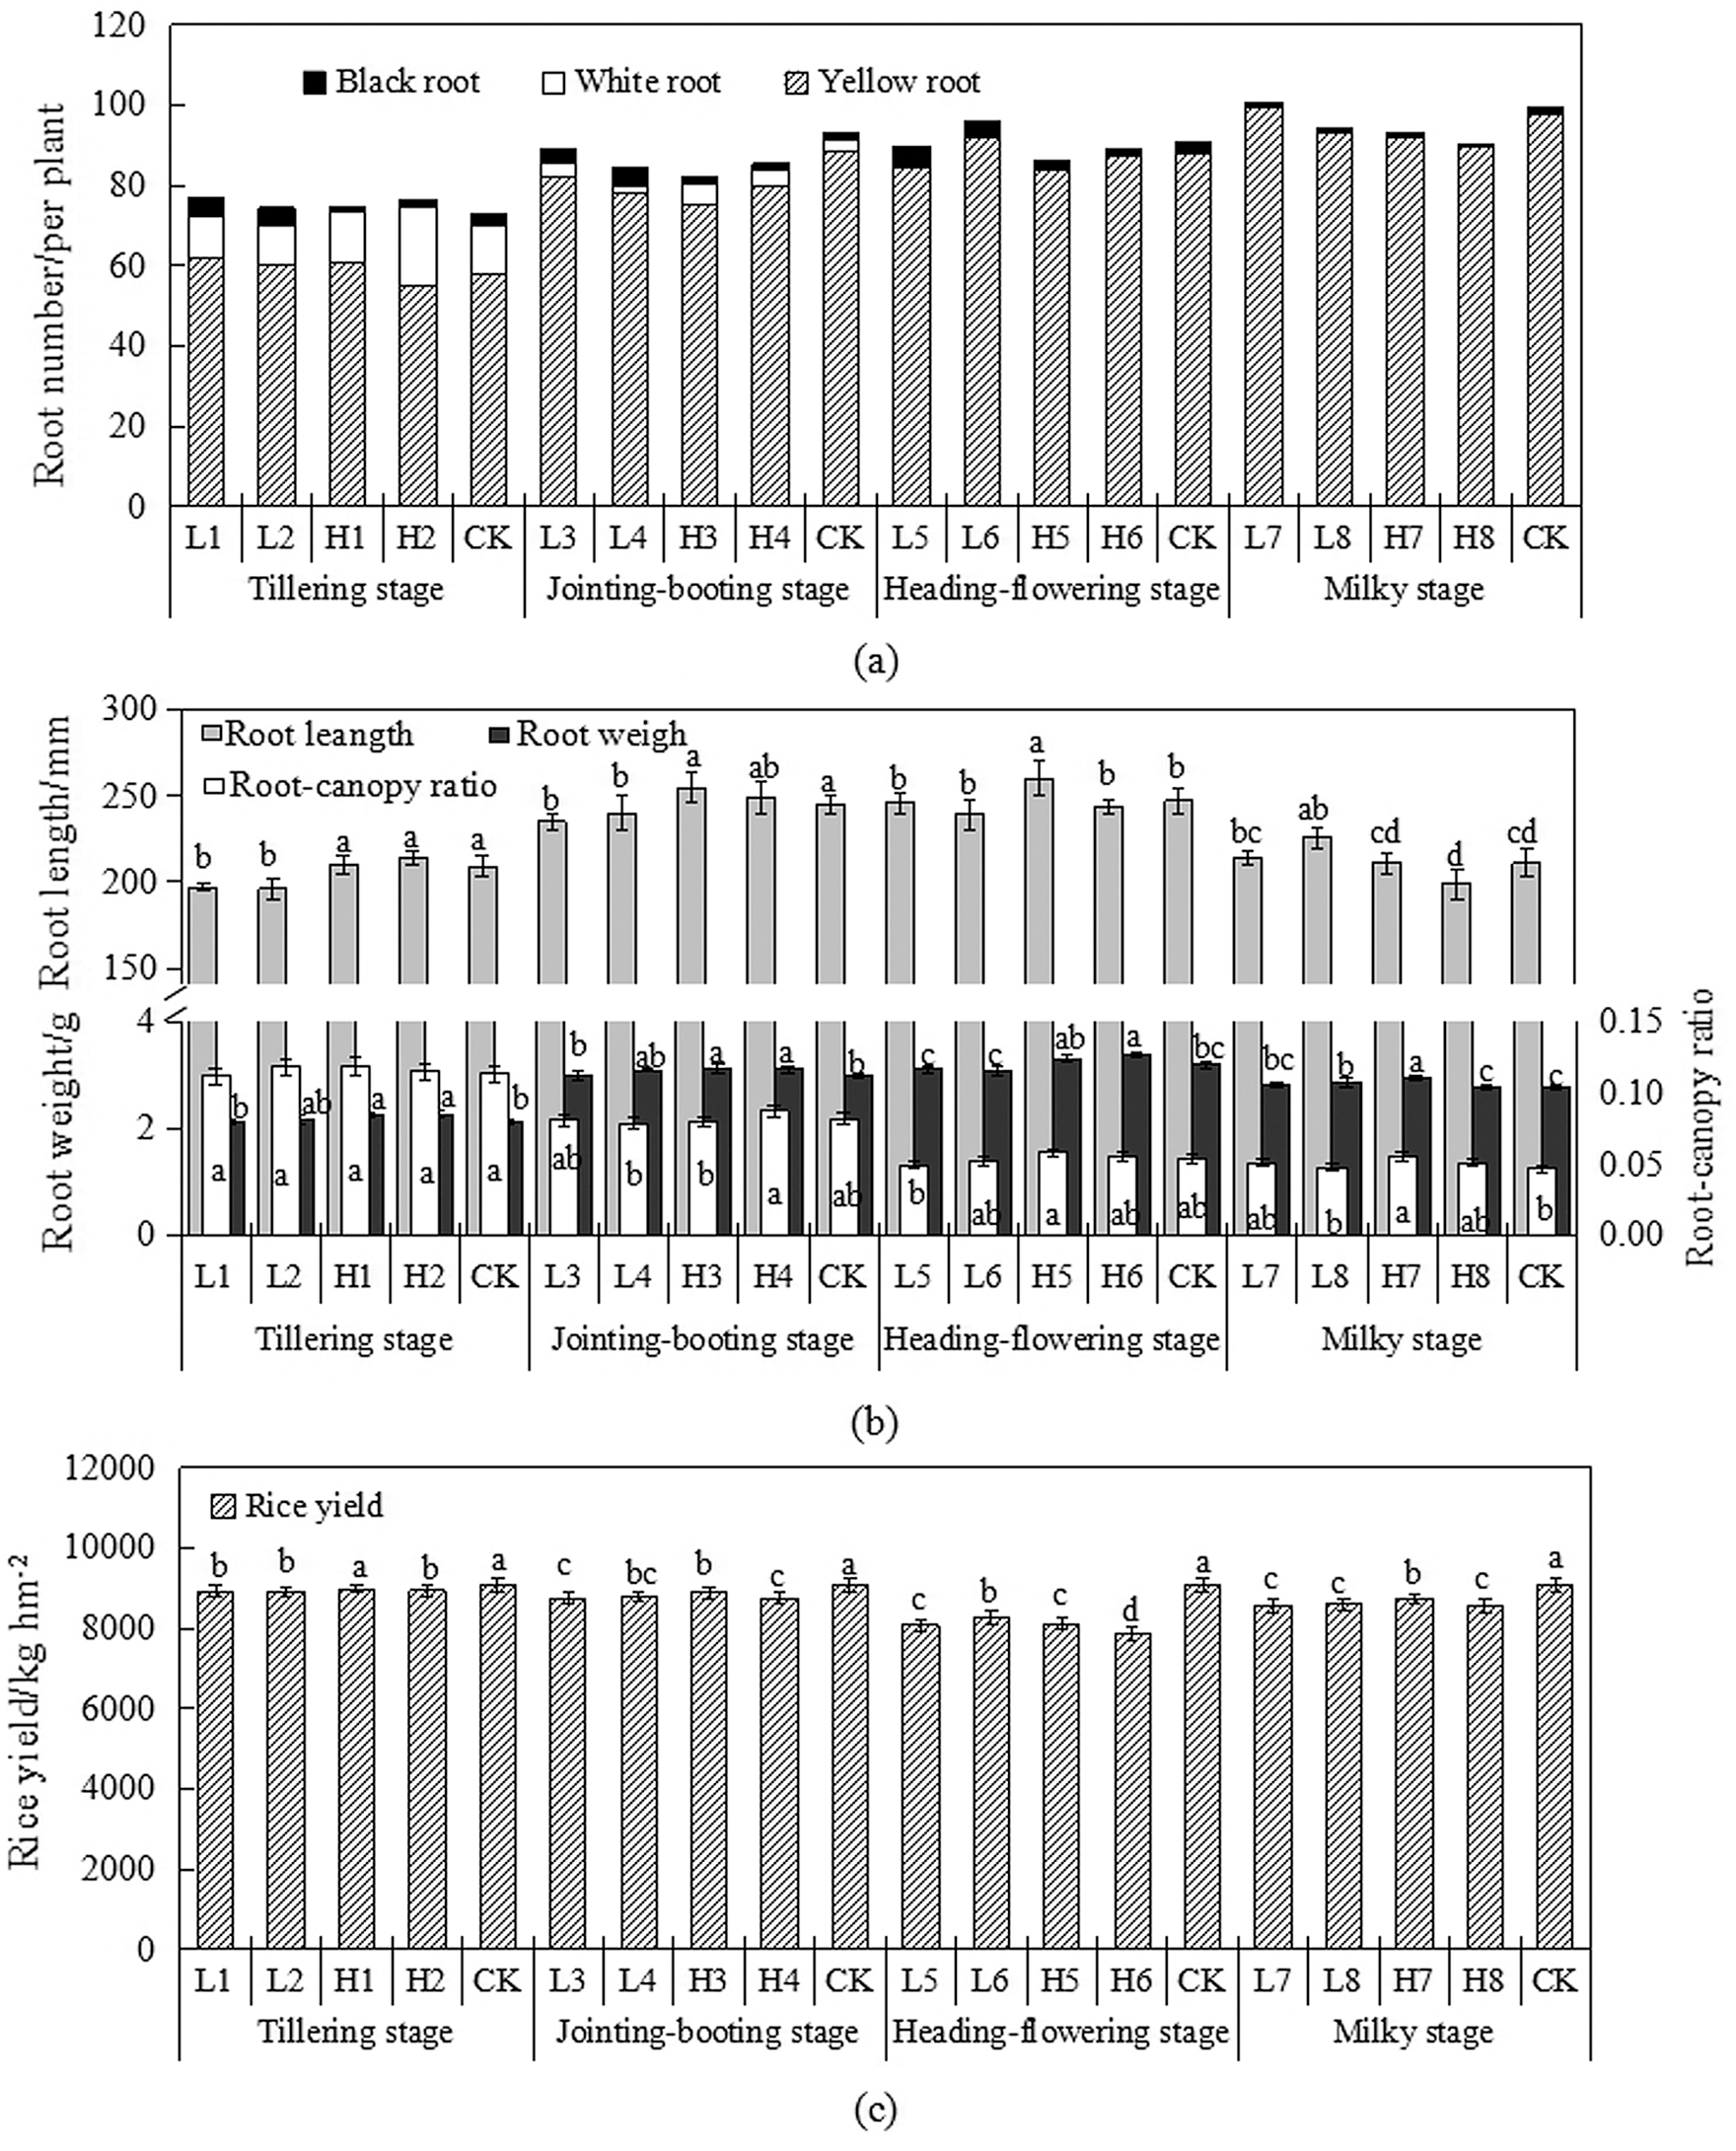
Figure 4: Change of rice root color, length, weight and root-canopy ratio (a) Root color composition (b) Root length, weight and root-canopy ratio (c) Rice yield
3.5 Response on Soil Temperature, Root Characteristic and Yield Factors
The relationship between soil temperature and root characteristics and yield factors in different growth stages was shown in Tab. 3. It can be seen that the average soil temperature of at different soil layers at tillering stage was negatively related to root weight (RW) and root-canopy ratio (R-CR), while it was positively correlated with effective panicle number (EPN) and yield (YR). The daily soil temperature of each soil layer was positively correlated with root length (RL), RW and fruit set rate (SSR), while it was strongly negatively correlated with EPN, number of kernels per spike (GNPP) and YR. The average soil temperature of 5 cm and 20 cm soil layer at jointing-booting stage was negatively correlated with TGW (1000-grain weight) and RW (root weight), while it was positively correlated with RL, SSR and TGW (thousand grain weight), and negatively correlated with EPN and YR. The average temperature of each soil layer during heading-flowering stage was negatively correlated with RL, RW and R-CR, and it was strongly negatively correlated with R-CR. The daily temperature of each soil layer was positively correlated with RW and R-CR. The daily temperature change of 5 cm soil layer was negatively correlated with TGW, and the average temperature of 5 cm soil layer at milky stage was positively correlated with RW and R-CR, while it was negatively correlated with EPN, TGW, YR. The average temperature of 20 cm soil layer was positively correlated with RL, SSR, TGW, YR, and negatively correlated with GNPP. Contrary to the average temperature change, the daily temperature was positively correlated with GNPP and negatively correlated with RL and SSR. The average temperature of each soil layer was positively correlated with R-CR during the whole growth period, and the daily variation of 5 cm soil temperature was negatively correlated with EPN, while the daily variation of 20 cm soil temperature was positively correlated with R-CR.
Table 3: Relationship between soil temperature and root characteristic and yield factors under water level regulation
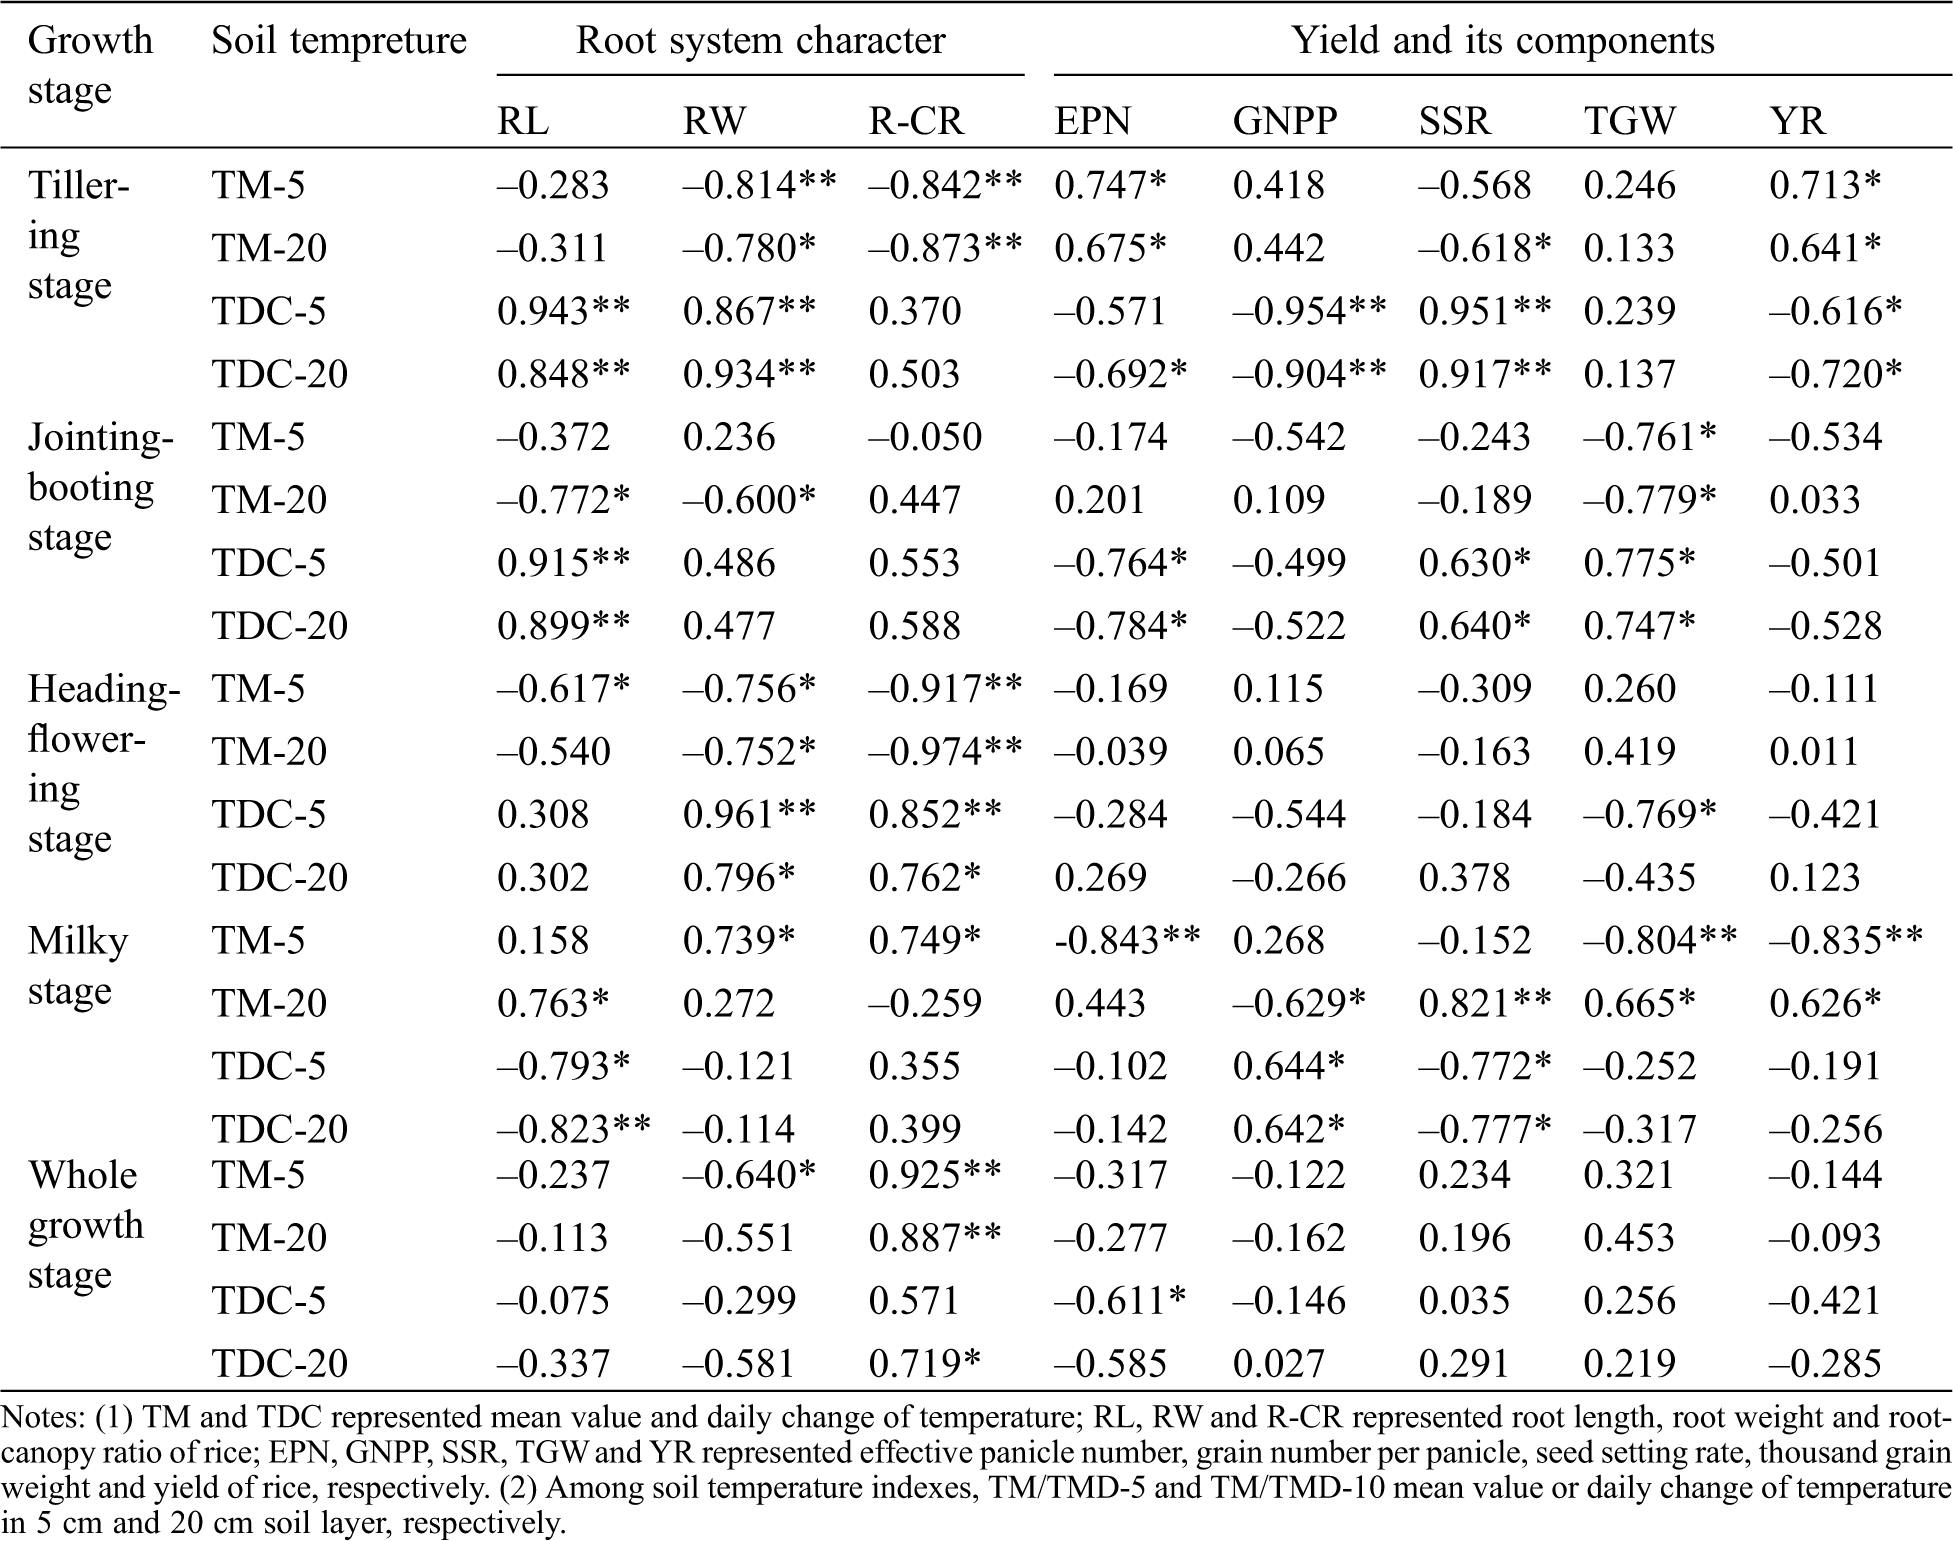
Combined with the results in Section 3.1, it can be seen that the lowering of the groundwater level will cause the roots of the rice to be tied down, and the strong water-absorbing area of the roots will be moved downwards, which can improve the root-canopy ratio to a certain extent, improving rice growth and saving irrigation water. However too lower groundwater level may make the rice difficult to absorb water and suffer from drought stress. At the same time, the temperature difference between day and night had a certain effect on the growth of rice. The higher temperature difference between day and night was conducive to the accumulation of dry matter in rice. Although the flooding treatment could maintain certain temperature for paddy soil, the temperature difference between day and night was reduced, having a certain adverse effect on the accumulation of dry matter in rice.
3.6 Correlation between Photosynthetic Accumulation and Population Quality and Yield Factors
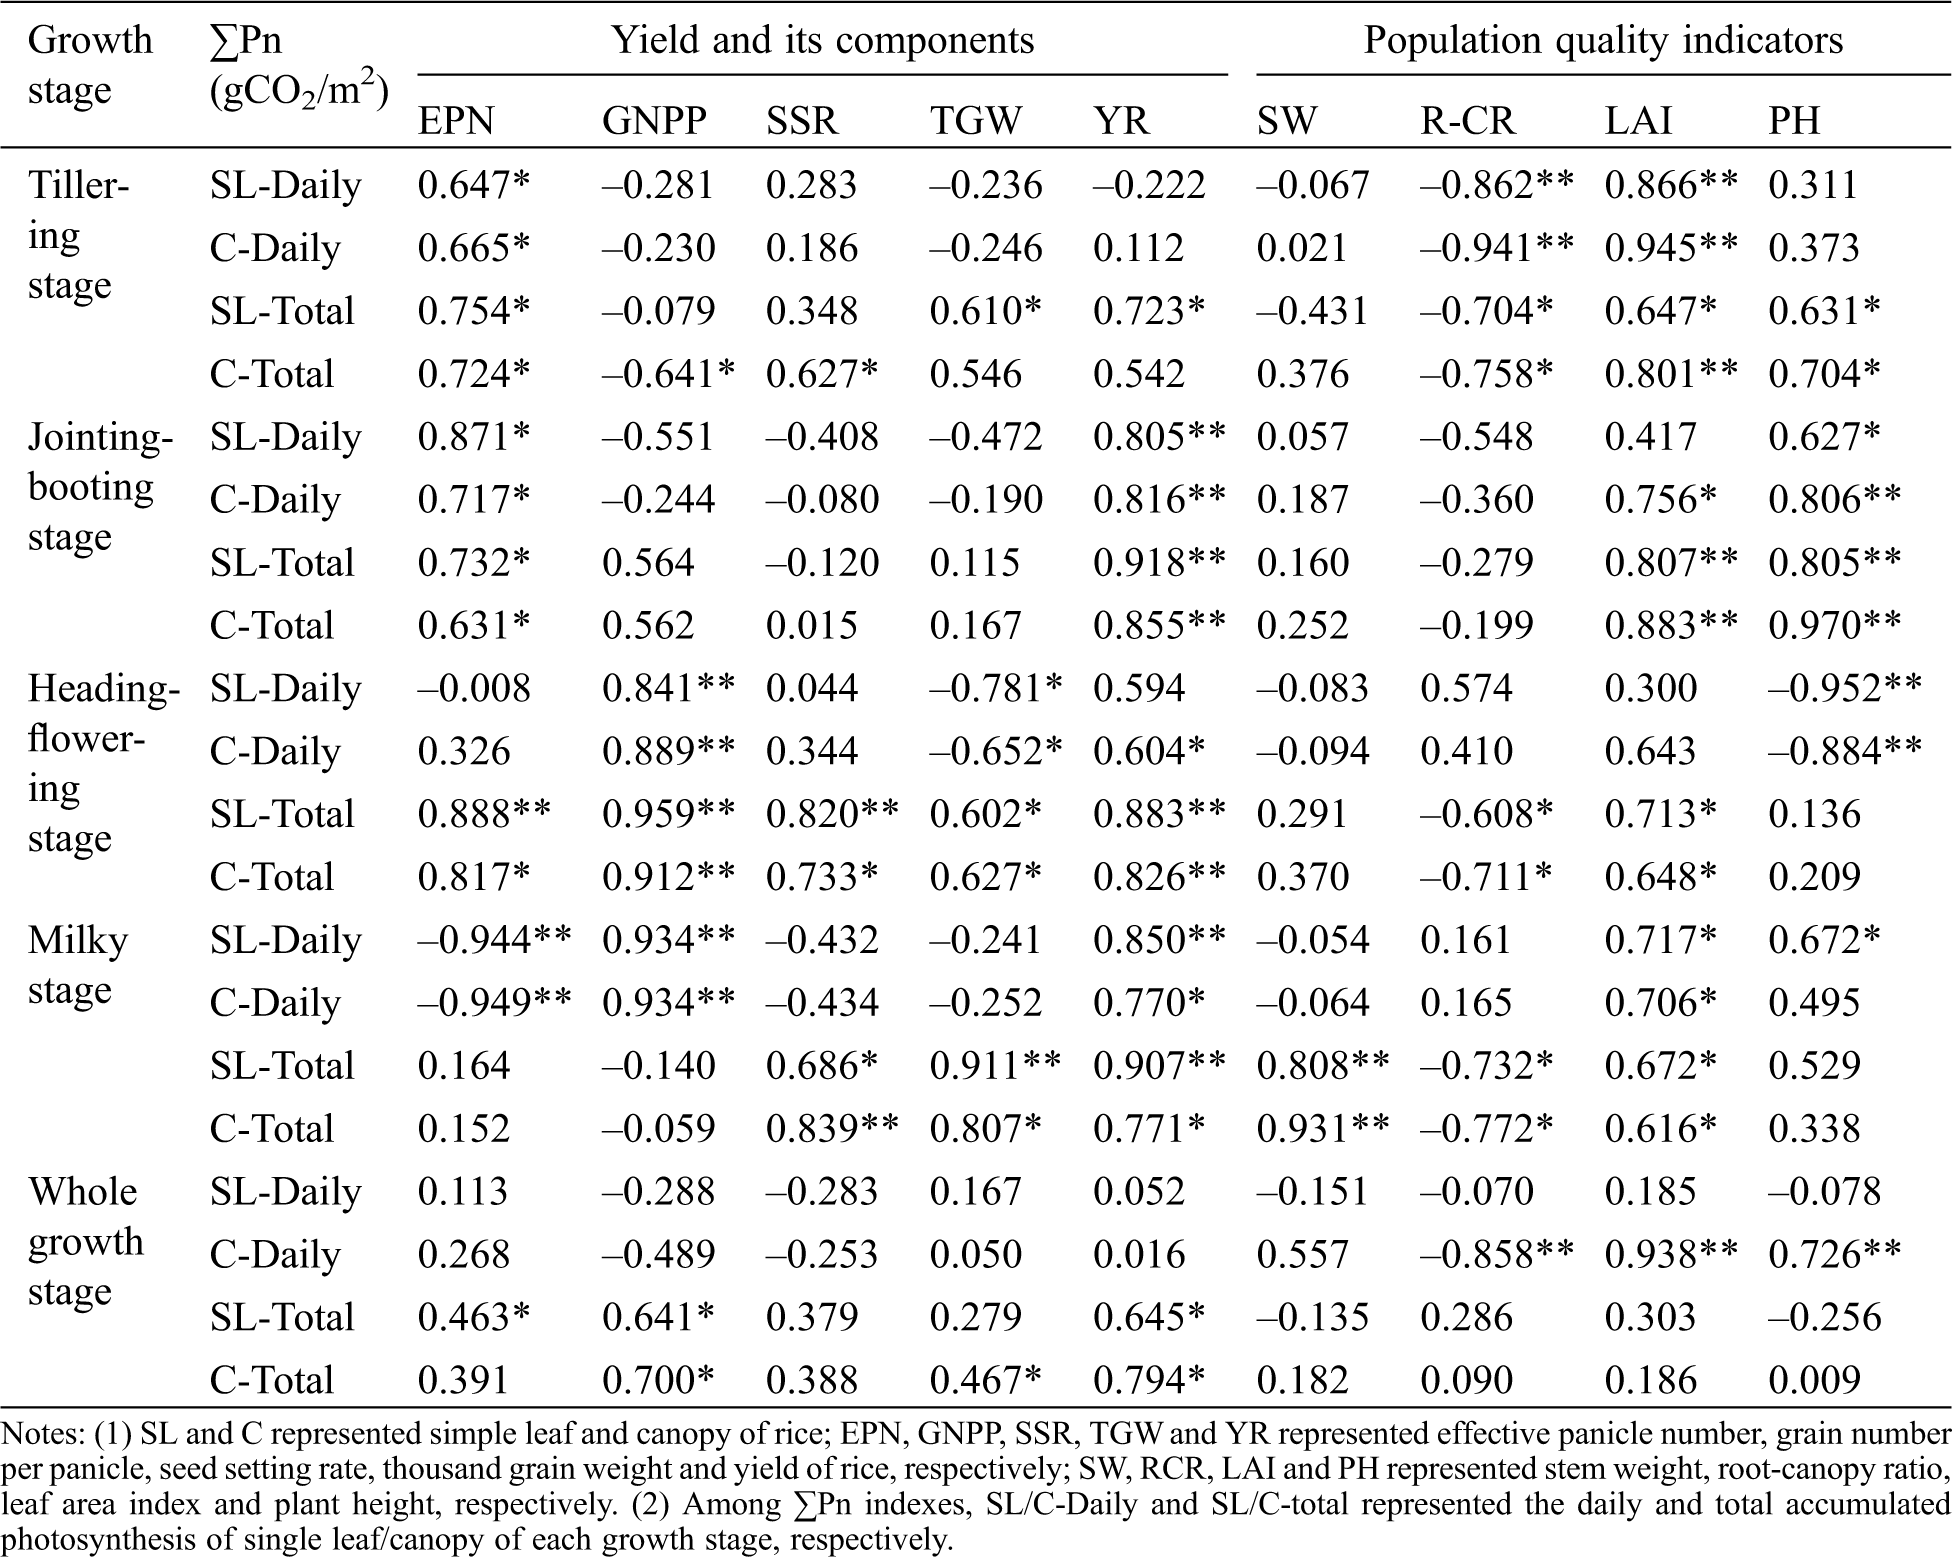
The correlation between the cumulative photosynthetic amount of rice at different growth stages and the yield factors and population quality was shown in Tab. 4. It can be seen that there was a strong positive correlation between the photosynthetic indicators and EPN at the tillering stage and the jointing-booting stage. There was a strong positive correlation between the photosynthesis index and GNPP at the heading-flowering stage, and there was a strong positive correlation between the total photosynthetic amount and the SSR and TGW at the milky stage. The daily cumulative photosynthetic amount was negatively correlated with the SSR and TGW. There was a strong positive correlation between the photosynthetic index and YR at the milky period. According to whole growth stage, there was a significant positive correlation between the total cumulative photosynthetic amount and YR, and the correlation between daily cumulative photosynthetic and YR was very low. There was a weak positive or negative correlation between daily cumulative photosynthetic quantity and yield component (weak positive correlation with EPN and TGW, negative correlation with GNPP and SSR). Correlation between total photosynthetic quantity and yield component were positive, and the correlation coefficient was higher than the daily cumulative photosynthetic amount. There was a negative correlation between photosynthetic index and R-CR. There was a positive correlation between photosynthetic index and LAI at each growth stage. There was a strong positive correlation between photosynthesis index and plant height (PH) at jointing-booting stage.
Table 4: The correlation between the cumulative photosynthetic amount and the yield factors and population quality of rice
The soil temperature change for H was the closest to the temperature change trend, which was because the change of the soil moisture was the main factor affecting the soil temperature when the ambient temperature conditions were similar. Usually, when the soil moisture content was high, the soil respiration rate was low, therefore the soil temperature was correspondingly low, and the soil moisture content and soil temperature were significantly negatively correlated [21,22]. Due to the certain hysteresis of soil heat transfer to the deep layer, the average daily soil temperature and daily variation of the soil decreased with the depth of the soil layer increasing, and the time when the soil temperature reached the highest value was also delayed. Chen et al. [23] analyzed the effects of different soil moisture on soil temperature of spring wheat, and studied the effects of soil water deficit on soil heat and temperature under film irrigation. The study mainly focused on the effects of irrigation methods and agronomic practices on soil temperature, without considering the impact of farmland water level regulation on soil temperature.
Water stress occurs at different growth stages, and the mechanism of impact on yield is different. The mechanism of water stress on yield under different growth stages was different, and the early stage will have an aftereffect on the later growth and development. The water stress at the tillering stage will greatly reduce the number of panicles, while the 1000-grain weight and the number of panicles will increase. The number of panicles and the number of grains per ear at the jointing-booting stage will be slightly reduced. The number of grains per panicle and the weight of 1000-grain weight will decrease during the heading-flowering stage, while 1000-grain weight reduced at milkying stage. Hamamoto et al. [24] found that during the reproductive growth stage, the plants under lightly flooding accumulated more dry matter, and the dry matter of the vegetative organs during flowering period was higher, thus the empty shell rate at maturity stage decreased, and the grain yield increased, which was consistent with the results of this paper.
Numerous studies have shown that about 95% of dry matter comes from photosynthesis assimilation of CO2, and the formation of yield is directly or indirectly derived from photosynthetic products, indicating a positive correlation between crop yield and photosynthetic rate [25,26]. From the perspective of photosynthetic performance, the economic yield of crops depends on the leaf area, photosynthetic time, photosynthetic rate, respiration rate and economic coefficient. Photosynthetic rate is only one of several factors in the formation of yield, and the true correlation is easy to be covered by the effects of complex changes in other factors [27].
The temperature difference between day and night was greatly improved by drought treatment, which was conducive to the secretion of root auxin and the accumulation of dry matter, promoting plant growth. Molbak et al. [28] determined the relationship between soil temperature change and root growth and metabolic activity of hybrid rice in different planting seasons and growth stages. The results showed that the average temperature of 20 cm soil layer was significantly positively correlated with root-canopy ratio, which was consistent with the analysis results in this paper.
In this paper, the farmland water level regulation technology was used to study the changes law of soil temperature and cumulative photosynthetic quantity in roots under drought and flooding treatments, and its responding mechanism on crop growth factors. The results were as follows:
(1) The lowest or highest soil temperature in the 5 cm soil layer under drought was basically synchronous with the control treatment. The soil daily average soil temperature and daily variation were both reduced.
(2) The cumulative photosynthetic quantity of single leaf and canopy under control treatment from the tillering to the flowering stages was higher than that under the flooding and drought treatments. The cumulative photosynthetic quantity of the canopy during the water control period and the whole growth period under flooding and drought was lower than that under the control treatment.
(3) The growth rate of leaf area index was negatively affected by drought and flooding in paddy field, but no fatal injury was formed. In addition, keeping large amount of leakage in flooding was conducive to yield promotion, and the yield for light drought was slightly higher than heavy drought.
(4) There was a strong negative correlation between TM and RW at tillering, jointing-booting and heading-flowering stages. TDC was positively correlated with root characteristics RL/RW, while it was opposite at milky stage. TM-20 and YR was positively correlated at tillering and milkying stage, and TDC was negatively correlated or significantly positively correlated with EPN, GNPP and SSR. There was a strong positive correlation between TM and R-CR in different soil layers during the whole growth period. TDC-5 was negatively correlated with EPN, and TDC was positively correlated with R-CR in 20 cm soil layer.
(5) Photosynthetic index (daily ∑Pn, total ∑Pn) was positively correlated with EPN at the tillering and jointing-booting stages, and it was positively correlated with GNPP at the heading-flowering stage, and positively correlated with YR at the milky stage. In the whole growth period, there was a significant positive correlation between total ∑Pn and YR, and the correlation between daily ∑Pn and YR was very low. There was a weak positive or negative correlation between daily ∑Pn and yield components, and total ∑Pn was positively correlated with yield components, and the correlation coefficient was higher than that of daily ∑Pn.
Acknowledgement: We fully appreciate the editors and all anonymous reviewers for their constructive comments on the manuscript.
Funding Statement: National Key Research and Development Program (2019YFC0408803), Basic Public Welfare Research Project of Zhejiang Province (LGN20E090001), Major scientific and technological projects of Zhejiang Provincial Department of water resources (RA1913), Water conservancy science and technology in Zhejiang Province (RC1918, RC2029), National Natural Science Foundation of China (52009044), and High-level Talent Research Project of North China University of Water Resources and Electric Power (201705017).
Conflicts of Interest: The authors declare that they have no conflicts of interest to report regarding the present study.
1. Wang, S. L., Wang, X. G., Brown, L. C., Qu, X. (2010). Current status and prospects of agricultural drainage in China. Irrigation and Drainage, 56, 47–58. [Google Scholar]
2. Yu, S. E., Miao, Z. M., Xing, W. G., Shao, G. C., Jiang, Y. X. (2010). Research advance on irrigation and drainage for rice by using water level as regulation index. Journal of Irrigation and Drainage, 29, 134–136. [Google Scholar]
3. Mohammadi, M. H., Khataar, M., Shekari, F. (2017). Effect of soil salinity on the wheat and bean root respiration rate at low matric suctions. Paddy and Water Environment, 15(3), 639–648. DOI 10.1007/s10333-017-0582-2. [Google Scholar] [CrossRef]
4. Xiao, M. H., Miao, Z. M., Li, Y. Y. (2017). Changes of root-zone soil environment in flooded paddy field under controlled drainage conditions. Polish Journal of Environmental Studies, 26(2), 881–892. DOI 10.15244/pjoes/66717. [Google Scholar] [CrossRef]
5. Nishida, K., Yoshida, S., Shiozawa, S. (2018). Theoretical analysis of the effects of irrigation rate and paddy water depth on water and leaf temperatures in a paddy field continuously irrigated with running water. Agricultural Water Management, 198, 10–18. DOI 10.1016/j.agwat.2017.11.021. [Google Scholar] [CrossRef]
6. Liu, P., Klose, M., Conrad, R. (2018). Temperature effects on structure and function of the methanogenic microbial communities in two paddy soils and one desert soil. Soil Biology and Biochemistry, 124, 236–244. DOI 10.1016/j.soilbio.2018.06.024. [Google Scholar] [CrossRef]
7. Liu, Y., Yang, S., Lu, H., Wang, Y. (2018). Effects of biochar on spatial and temporal changes in soil temperature in cold waterlogged rice paddies. Soil and Tillage Research, 181, 102–109. DOI 10.1016/j.still.2018.04.008. [Google Scholar] [CrossRef]
8. Abel, C. D. T., Sharma, S. K., Malolo, Y. N., Meng, S. K., Kennedy, M. D. et al. (2012). Attenuation of bulk organic matter, nutrients (n and pand pathogen indicators during soil passage: effect of temperature and redox conditions in simulated soil aquifer treatment (sat). Water, Air, & Soil Pollution, 223(8), 5205–5220. DOI 10.1007/s11270-012-1272-8. [Google Scholar] [CrossRef]
9. Kiani, P. A. (2015). Changes in activities of antioxidant enzymes and photosynthetic attributes in triticale (Triticosecale, Wittmack) genotypes in response to long-term salt stress at two distinct growth stages. Acta Physiologiae Plantarum, 37(7), 1–11. DOI 10.1007/s11738-015-1881-0. [Google Scholar] [CrossRef]
10. Miao, Z. M., Yu, S. E., Lu, B., Ding, J. H., Yu, Z. H. (2013). Relationships of water requirement photosynthesis production for paddy rice using structural equation modeling. Transactions of the Chinese Society of Agricultural Engineering, 29, 91–98. [Google Scholar]
11. Li, Y. S., Li, S. S. (2000). Effect of submergence on physiological indexes and yield component at reproductive stage in rice. Journal of Wuhan Botanical Research, 18, 117–122. [Google Scholar]
12. Candogan, B. N., Sincik, M., Buyukcangaz, H., Demirtas, C., Goksoy, A. T. et al. (2013). Yield, quality and crop water stress index relationships for deficit-irrigated soybean [Glycine max (L.) Merr.] in sub-humid climatic conditions. Agricultural Water Management, 118, 113–121. DOI 10.1016/j.agwat.2012.11.021. [Google Scholar] [CrossRef]
13. Carroll, D. A., Hansen, N. C., Hopkins, B. G., Dejonge, K. C. (2017). Leaf temperature of maize and crop water stress index with variable irrigation and nitrogen supply. Irrigation Science, 35(6), 549–560. DOI 10.1007/s00271-017-0558-4. [Google Scholar] [CrossRef]
14. Ahmadi, S. H., Agharezaee, M., Kamgar-Haghighi, A. A., Sepaskhah, A. R. (2014). Effects of dynamic and static deficit and partial root zone drying irrigation strategies on yield, tuber sizes distribution, and water productivity of two field grown potato cultivars. Agricultural Water Management, 134, 126–136. DOI 10.1016/j.agwat.2013.11.015. [Google Scholar] [CrossRef]
15. Oikeh, S., Toire, A., Sidibe, B., Niang, A., Semon, M. et al. (2009). Responses of upland NERICA rice varieties to nitrogen and plant density. Archives of Agronomy and Soil Science, 55(3), 301–314. DOI 10.1080/03650340802360484. [Google Scholar] [CrossRef]
16. Grayson, B. T., Webb, J. D. (1991). Factors affecting the performance and crop phytotoxicity of a new rice herbicide, cinmethylin. i. Effects of water depth and soil type on the distribution and uptake of cinmethylin by transplanted and direct-seeded rice. Pesticide Science, 32(2), 207–218. DOI 10.1002/ps.2780320208. [Google Scholar] [CrossRef]
17. Li, X., Jing, S., Wang, H., Xu, L., Jian, W. et al. (2017). Changes in the soil microbial phospholipid fatty acid profile with depth in three soil types of paddy fields in China. Geoderma, 290, 69–74. DOI 10.1016/j.geoderma.2016.11.006. [Google Scholar] [CrossRef]
18. Johnson, Z., Barber, R. T. (2003). The low-light reduction in the quantum yield of photosynthesis: Potential errors and biases when calculating the maximum quantum yield. Photosynthesis Research, 75(1), 85–95. DOI 10.1023/A:1022440305765. [Google Scholar] [CrossRef]
19. Ren, B., Zhang, J., Dong, S., Peng, L., Zhao, B. (2017). Regulations of 6-benzyladenine (6-ba) on leaf ultrastructure and photosynthetic characteristics of waterlogged summer maize. Journal of Plant Growth Regulation, 36(3), 743–754. DOI 10.1007/s00344-017-9677-7. [Google Scholar] [CrossRef]
20. Xu, G. W., Lyu, Q., Lu, D. K., Wang, H. Z., Chen, M. C. (2016). Effect of wetting and drying alternative irrigation coupling with nitrogen application on root characteristic and grain-sink activity. Aata Agronomica Sinica, 42(10), 1495–1505. DOI 10.3724/SP.J.1006.2016.01495. [Google Scholar] [CrossRef]
21. Ta, N., Wu, S. L., Ma, W. J. (2014). Peak-fitting based prediction of soil temperature according to soil moisture content in solar greenhouse. Transactions of the Chinese Society of Agricultural Engineering (Transactions of the CSAE), 30, 204–210. [Google Scholar]
22. Zhao, Y. L., Xue, Z. W., Guo, H. B. (2014). Effects of tillage and crop residue management on soil respiration and its mechanism. Transactions of the Chinese Society of Agricultural Engineering (Transactions of the CSAE), 30, 155–165. [Google Scholar]
23. Chen, L., Zhang, X., Wang, X., Cheng, Z., Shan, Y. (2008). Effect of different soil moisture treatments on soil temperature of plastic film mulched spring wheat. Transactions of the Chinese Society of Agricultural Engineering, 24, 9–13. [Google Scholar]
24. Hamamoto, H., Shishido, Y., Uchiumi, T., Kumakura, H. (2000). Effects of low light intensity on growth, photosynthesis and distribution of photoassimilates in tomato plants. Environment Control in Biology, 38(2), 63–69. DOI 10.2525/ecb1963.38.63. [Google Scholar] [CrossRef]
25. Mu, H., Jiang, D., Wollen Weber, B., Dai, T., Jing, Q. et al. (2010). Long-term low radiation decreases leaf photosynthesis, photochemical efficiency and grain yield in winter wheat. Journal of Agronomy and Crop Science, 196(1), 38–47. DOI 10.1111/j.1439-037X.2009.00394.x. [Google Scholar] [CrossRef]
26. Gu, J., Zhou, Z., Li, Z., Ying, C., Wang, Z. et al. (2017). Rice (oryza sativa l.) with reduced chlorophyll content exhibit higher photosynthetic rate and efficiency, improved canopy light distribution, and greater yields than normally pigmented plants. Field Crops Research, 200, 58–70. DOI 10.1016/j.fcr.2016.10.008. [Google Scholar] [CrossRef]
27. Zhao, L., Li, M., Zheng, D., Gu, C., Na, Y. et al. (2015). Effects of irrigation methods and rice planting densities on yield and photosynthetic characteristics of matter production in cold area. Transactions of the Chinese Society of Agricultural Engineering, 31, 159–169. [Google Scholar]
28. Molbak, L., Molin, S., Kroer, N. (2007). Root growth and exudate production define the frequency of horizontal plasmid transfer in the Rhizosphere. FEMS Microbiology Ecology, 59(1), 167–176. DOI 10.1111/j.1574-6941.2006.00229.x. [Google Scholar] [CrossRef]
 | This work is licensed under a Creative Commons Attribution 4.0 International License, which permits unrestricted use, distribution, and reproduction in any medium, provided the original work is properly cited. |