International Journal of
Experimental Botany
| Phyton- International Journal of Experimental Botany |
DOI: 10.32604/phyton.2021.015601
ARTICLE
Cloning and Bioinformatics Analysis of the GlROP6 gene in Glehnia littoralis
1Jiangsu Key Laboratory of Biofunctional Molecules, School of Life Sciences, Chemistry & Chemical Engineering, Jiangsu Second Normal University, Nanjing, 211200, China
2Institute of Botany, Jiangsu Province and Chinese Academy of Sciences (Nanjing Botanical Garden Mem. Sun Yat-Sen), Nanjing, 210014, China.
*Corresponding Author: Li Li. Email: xinwenbanlili@163.com
Received: 30 December 2020; Accepted: 24 February 2021
Abstract: Rho-related GTPase from plants (ROP) proteins play an essential role in plant stress resistance. In this study, the full-length GlROP6 gene was cloned based on G. littoralis transcriptome sequencing data acquired in response to salt stress. The protein sequence, conserved domains, secondary structure, three-dimensional structure, phylogenetic relationships, and expression pattern of the GlROP6 gene were systematically analysed. Our results showed that the full-length GlROP6 gene had an open reading frame of 606 bp, which encoded 201 amino acid residues with a relative molecular weight of 22.23463 kDa and a theoretical isoelectric point of 9.06. Amino acid sequence analyses indicated that the structure of the GlROP6 protein was conserved, and included five G-box motifs (G1–G5), an effector binding region, a Rho insert region and a C-terminal hypervariable region. According to our phylogenetic analysis, the GlROP6 protein was closely related to the ROP protein of Daucus carota subsp. Sativus. Our quantitative real-time PCR results revealed that GlROP6 was highly expressed in flower, and GlROP6 expression was significantly upregulated in G. littoralis roots treated with NaCl. This study will facilitate investigations into the function of GlROP genes in response to salt stress in G. littoralis.
Keywords: GlROP6 gene; Glehnia littoralis; salt stress; expression analysis
Glehnia littoralis Fr. Schmidt ex Miq. is an important medicinal halophyte that belongs to the Umbelliferae family. Glehnia littoralis grows on the seashores of countries such as China, Japan, the Korean Peninsula, Russia, and the United States [1]. Radix Glehniae is the dried root of G. littoralis, which has been used in traditional Chinese medicine for clearing away lung-heat, tonifying the stomach, nourishing yin and anti-inflammation [2]. G. littoralis exhibits strong salt-resistance. Its roots can penetrate deep into the sand layer of coastal beaches and mix with those of other plants to form coastal vegetation communities, which play important roles in coastal sand fixation and in improving saline-alkaline soils. Previous studies of G. littoralis have focused on its chemical components [2,3], pharmacological activities [4], and cultivation; however, few studies exploring the salt tolerance mechanisms and functional gene information of G. littoralis have been performed.
Small GTPases, having masses of 21 to 30 kD, are monomeric guanine nucleotide binding proteins related to the α subunit of heterotrimeric G proteins [5]. ROP proteins participate in an array of physiological processes including pollen tube growth [6,7], root hair development [8], vesicle trafficking [9], hormone signaling [10], and pathogen responses [11]. ROP-interactive CRIB motif-containing protein (RIC1) is microtubule-associated protein that is an effector of ROP. Recently, Li et al. [12] demonstrated that constitutively active ROP2 promoted both the reassembly of microtubules and the survival of Arabidopsis seedlings under salt stress via the ROP2-RIC1 pathway. In addition, Zhang et al. reported that MaROP5g overexpression enhanced salt tolerance in Arabidopsis by increasing root length, reducing membrane injury, and improving ion distribution [13].
Since the first ROP gene was isolated from pea plants, multiple ROPs have been described in numerous plant species: 11 in Arabidopsis thaliana [14], 9 in Zea mays [15], 7 in Vitis vinifera [16], 7 in Oryza sativa [17], 7 in Medicago truncatula [18], 9 in Solanum lycopersicum [19], and 17 in Musa acuminata [13]. To date, there have been no reports published describing ROP genes in G. littoralis. In this study, we identified and cloned the GlROP6 gene based on previous G. littoralis transcriptome sequencing data acquired in response to salt stress [20]. We systematically analysed the protein sequence, conserved domains, secondary structure, three-dimensional structure, and phylogenetic relationships of GlROP6 using bioinformatics methods. Additionally, we performed quantitative real time polymerase chain reaction (qRT-PCR) analysis to examine GlROP6 expression in various tissues and under salt stress. This comprehensive study of GlROP6 will aid future research into the salt tolerance mechanisms of G. littoralis.
G. littoralis seeds were originally collected from Tannanwan Beach, Pingtan, Fujian Province, China (25°26′1.86″N, 119°45′14.4″E) and cultivated at the Institute of Botany, Jiangsu Province and Chinese Academy of Sciences, Nanjing, China. G. littoralis seedlings were grown in nutrient-enriched sandy soil under a 14-h light (26°C)/10 h dark (22°C) photoperiod. After 3 months of pot growth, the seedlings were treated with 200 mM NaCl for 0, 6, and 24 h. G. littoralis roots were sampled separately at various time points, as described previously [21]. Root, stem, leaf and flower tissues of G. littoralis were separately harvested throughout the same year to examine tissue-specific expression patterns of GlROP6. Duplicate samples were immediately frozen in liquid nitrogen and stored at –80°C for subsequent RNA extraction.
2.2 Total RNA Extraction and cDNA Synthesis
Total RNA of each G. littoralis sample was extracted using Trizol reagent (TaKaRa, Dalian, China) following the manufacturer’s instructions. Complementary DNA was synthesised using a Prime Script™ RT Reagent kit with gDNA Eraser (TaKaRa, Dalian, China). cDNA products were stored at –20°C prior to qRT-PCR analysis.
2.3 Cloning and Sequencing of the GlROP6 Gene
Based on previous G. littoralis transcriptome sequencing data acquired in response to salt stress, we cloned the GlROP6 gene. Specific primers were designed using the Primer Premier 5.0 software (Tab. 1). PCR amplifications were performed using KOD Plus neo enzyme (TOYOBO, Osaka, Japan). The PCR conditions used were as follows: 94°C for 5 min, followed by 30 cycles of 94°C for 30 s, 56°C for 30 s, and 68°C for 1 min, with a final extension at 72°C for 8 min. The amplification products were tested by cloning into a pEASY-Blunt cloning vector (TransGen Biotech, Beijing, China) and sequenced.
2.4 Bioinformatics Analysis of the GlROP6 Protein
The molecular weight, theoretical isoelectric point, and amino acid sequence of GlROP6 were predicted using ProtParam (http://web.expasy.org/protparam/). The GlROP6 and AtROP6 protein sequences were aligned using DNAMAN software. Protein hydrophobicity was predicted using ProtScale (http://web.expasy.org/protscale/). The secondary structure of GlROP6 protein was analysed using SOPMA (http://npsa-prabi.ibcp.fr/), and its tertiary structure was predicted using SWISS-MODEL (http://www.swissmodel.expasy.org/), which was then analysed with PyMOL software. The full-length GlROP6 amino acid sequence was aligned with the ROP protein sequences of 15 representative plant species using the ClustalW program. Amino acid sequences were acquired from the NCBI database. A Neighbour-Joining (NJ) phylogenetic tree was constructed using the MEGA5.0 program. Bootstrapping was performed with 1000 replications and other parameters remained default.
qRT-PCR amplification was performed using an Applied Biosystems StepOne™ Real-Time PCR System (Thermo Scientific, Waltham, MA, USA) with TB Green Premix Ex Taq (TaKaRa, Dalian, China). Primers used for the qRT-PCR experiment were designed using Primer3 Tools software (http://primer3.ut.ee/) (Tab. 1). The specificity of the primer pairs was assessed based on their melting curve analysis. The qRT-PCR conditions were as follows: 95°C for 30 s, followed by 40 cycles of 95°C for 5 s, and 60°C for 30 s. A melting curve analysis was performed following amplification. GAPDH were used as the internal control. Relative gene expression was examined using the 2-ΔΔCt method [22]. Three biological replicates were performed for each sample.
Table 1: Primers used for PCR amplification

3.1 Cloning and Homology Analysis of the GlROP6 Gene
Based on the data acquired from a previous transcriptomics experiment, we identified and amplified the full-length GlROP6 gene from G. littoralis via PCR. The GlROP6 was named according to its strong sequence similarity to the A. thaliana gene AtROP6. The full-length GlROP6 gene had an open reading frame (ORF) of 615 bp (Fig. 1). The GlROP6 protein sequence was aligned with homologous protein sequences of various plant species on NCBI. The results showed that GlROP6 shared 96.52%, 88.27%, 88.27%, 85.07%, 85.43% amino acid identity with homologous proteins of Daucus carota subsp. Sativus (XP_017244791.1), Rhodamnia argentea (XP_030516247.1), Rhodamnia argentea (XP_030553156.1), Punica granatum (PKI67829.1), and Sesamum indicum (XP_011093501.1), respectively.
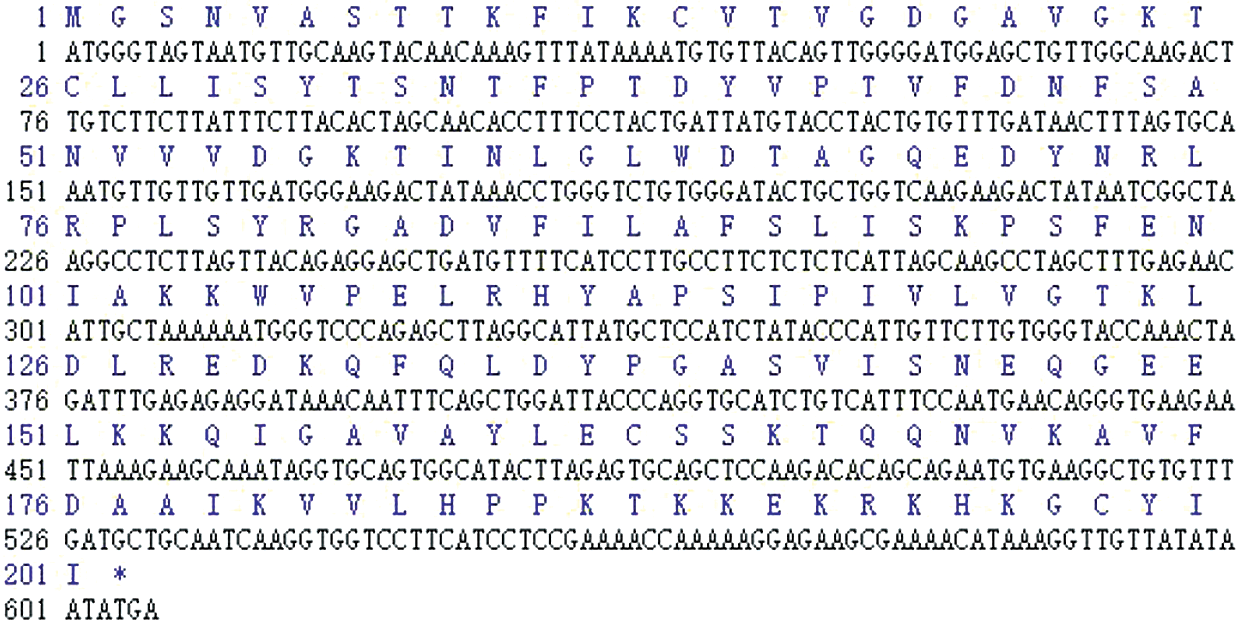
Figure 1: Full-length CDS of GlROP6 gene
3.2 Molecular Characteristics of the GlROP6 Protein
The molecular weight, theoretical isoelectric point, and amino acid number of GlROP6 were analyzed using ProtParam. We found that GlROP6 encoded 201 amino acid residues, which had a relative molecular weight of 22.23463 kDa and a theoretical isoelectric point of 9.06. GlROP6 was a hydrophilic protein. The hydropathy plot revealed that GlROP6 exhibited the highest hydrophobicity at amino acid position 89 (score: 3.044) and the lowest hydrophobicity at amino acid position 191 (score: –3.489) (Fig. 2).
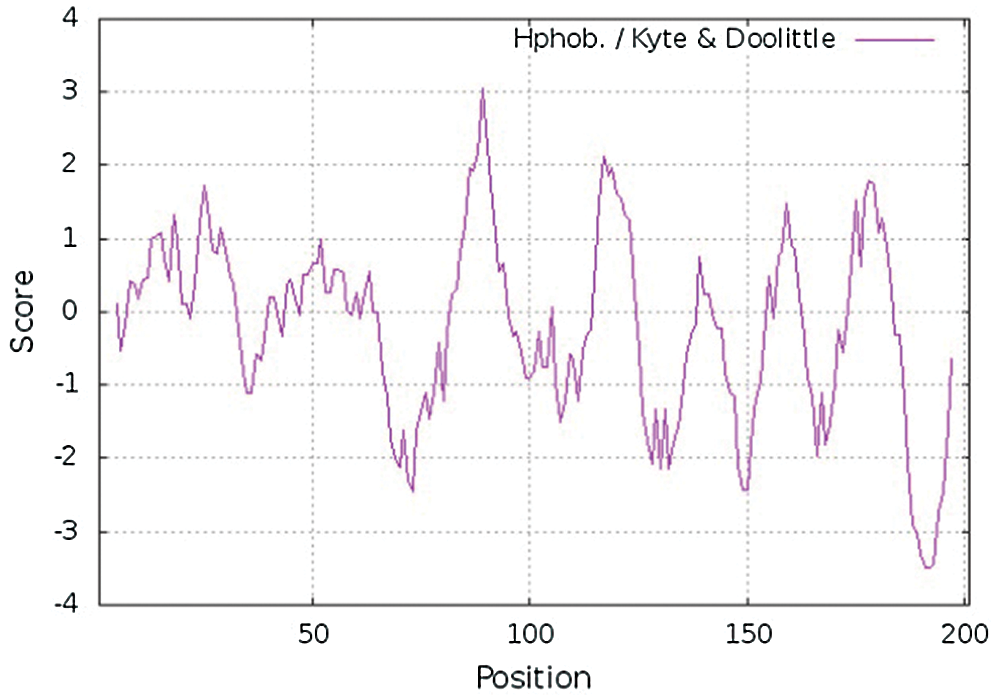
Figure 2: Hydropathy plot of GlROP6 protein
3.3 Conserved Domain Analysis of GlROP6
Both GlROP6 and AtROP6 contained five G-box motifs (G1–G5), an effector binding region, a Rho insert region, and a hypervariable region (HVR) (Fig. 3). G-box motifs are essential for binding of the nucleotide and the associated Mg2+ ion, as well as for GTP hydrolysis. Taking GlROP6 as an example, mutating the invariant glycine in G1 (G18 in GlROP6) or the glutamine in G3 (Q69 in GlROP6) could interfere with GTP hydrolysis, thus keeping the ROP in an active state (Constitutively active GlROP6, CA-GlROP6). Furthermore, substituting the threonine in G1 (T25 in GlROP6) or the aspartate in G4 (D126 in GlROP6) was thought to result in reduced nucleotide and increased GEF affinities (Dominant negative GlROP6, DN-GlROP6).
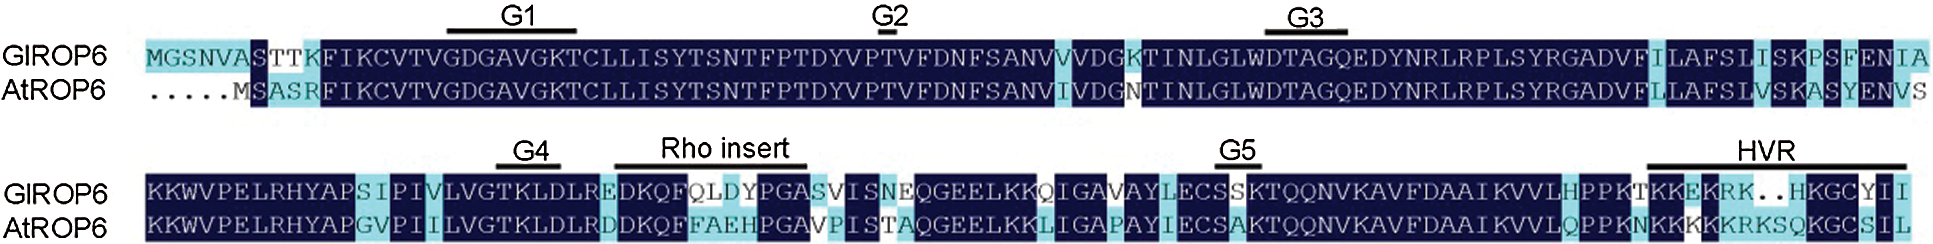
Figure 3: Alignment of GlROP6 and AtROP6 protein sequences
3.4 Phylogenetic Analysis of GlROP6
A comparison of GlROP6 with the ROP protein sequences of 15 representative plant species from NCBI database was performed by constructing a phylogenetic tree, which revealed that GlROP6 was closely related to the ROP protein of Daucus carota subsp. Sativus (XP_017244791.1). GlROP6 was distantly related to the ROP proteins of Rosa chinensis (XP_024174902.1) and Cannabis sativa (XP_030494758.1) (Fig. 4).

Figure 4: Phylogenetic analysis of ROP proteins. Protein sequences were aligned using ClustalW. The phylogenetic tree was constructed with MEGA 5.0 using the neighbor-joining (NJ) method with 1000 bootstraps replicates
3.5 GlROP6 Protein Structure Prediction
SOPMA online analysis showed that the secondary structure of GlROP6 comprised 32.84% alpha helices, 20.9% extended strands, 5.97% beta turns, and 40.3% random coils (Fig. 5).The tertiary structure prediction of GlROP6 exhibited 78.02% similarity to the 2j0v.2.A protein motif (Fig. 6).

Figure 5: The secondary structure of GlROP6 was analysed using SOPMA. Blue lines indicate alpha helices, purple lines indicate random coils, red lines denote extended strands, and green lines represent beta turns

Figure 6: The tertiary structure of GlROP6 protein was constructed in PyMol. The alpha helices and beta turns are depicted in red and yellow, respectively
3.6 Analysis of GlROP6 Expression
Tissue-specific GlROP6 expression patterns were investigated by qRT-PCR using GlROP6-specific primers. We found that GlROP6 was expressed in root, stem, leaf and flower tissues, with some fluctuations. As shown in Fig. 7A, GlROP6 was highly expressed in flowers, while its expression levels were lower in the other tissues examined.
To determine the function of GlROP6, we examined its expression under NaCl treatment by qRT-PCR. As shown in Fig. 7B, GlROP6 was significantly upregulated in G. littoralis roots in response to NaCl treatment, suggesting that GlROP6 could be involved in the regulation of salt tolerance in G. littoralis.

Figure 7: Analysis of GlROP6 expression. The internal reference gene was GAPDH. (A) The relative expression of GlROP6 in root, stem, leaf, and flower tissues. (B) Differential GlROP6 expression in roots subjected to NaCl treatment for 0, 6 and 24 h. Error bars indicate means ± SD. Different letters indicate statistically significant difference in each treatment (P < 0.05, Duncan’s multiple range test)
In this study, the G. littoralis GlROP6 gene was cloned and compared with homologous sequences from other plant species. GlROP6 showed high amino acid sequence similarities to plant ROP proteins, ranging from 85.43% to 96.52%. We discovered that the GlROP6 protein has conserved domains characteristic of ROP family proteins, including five G-box motifs (G1–G5), an effector binding region, a Rho insert region, and a hypervariable region (HVR) (Fig. 3). GlROP6 was evolutionarily similar to the ROP of Daucus carota subsp. Sativus (Fig. 4). Our results indicate that GlROP6 belongs to the ROP gene family.
At present, most salt tolerance studies in G. littoralis have focused on anatomical and morphological adaptations to high-salinity environments [23]. For example, a recent study revealed that the growth of G. littoralis seedlings treated with 100 mmol/L NaCl was similar to those of a control, and that the seedlings were able to tolerate 200 mmol/L NaCl stress. G. littoralis can adapt to NaCl stress due to complex regulatory mechanisms. When G. littoralis seedlings was treated with NaCl, the soluble sugar content, peroxidase (POD) and catalase (CAT) activities were significantly increased at first and then decreased with the increase of the solution concentration [24]. However, there are few studies on the salt tolerance mechanisms and gene functional analyses in G. littoralis.
Our study has revealed the expression pattern of GlROP6 during salt stress. This sheds light onto the function of GlROP6 and its potential involvement in the regulation of salt stress signalling pathways. Thus, it would be worthwhile to investigate the function of GlROP genes in response to salt stress further.
Funding Statement: This work was supported by grants from the National Science Foundation of the Jiangsu Higher Education institutions of China (No. 18KJB180002) and the National Natural Science Foundation of China (No. 31800272)
Conflicts of Interest: The authors declare that they have no conflicts of interest to report regarding the present study.
1. Peng, Y., Liu, X. J., Tang, X. L., Xu, D. H., Wu, Q. et al. (2014). Growth and physiological characteristics of Glehnia littoralis in response to salt stress. Jiangsu Agricultural Sciences, 30, 1273–1278. [Google Scholar]
2. Yuan, Z., Tezuka, Y., Fan, W., Kadota, S., Li, X. (2002). Constituents of the underground parts of Glehnia littoralis. Chemical & Pharmaceutical Bulletin, 50(1), 73–77. DOI 10.1248/cpb.50.73. [Google Scholar] [CrossRef]
3. Song, J. J., Luo, H. M., Xu, Z. C., Zhang, Y. X., Xin, H. et al. (2020). Mining genes associated with furanocoumarin biosynthesis in an endangered medicinal plant, Glehnia littoralis. Journal of Genetics, 99(1), 56. DOI 10.1007/s12041-019-1170-6. [Google Scholar] [CrossRef]
4. Tomshich, S. V., Komandrova, N. A., Kalmykova, E. N., Prokof’Eva, N. G., Momontova, V. A. et al. (1997). Biologically active polysaccharides from medicinal plants of the Far East. Chemistry of Natural Compounds, 33(2), 146–149. DOI 10.1007/BF02291530. [Google Scholar] [CrossRef]
5. Yang, Z. B. (2002). Small GTPases: Versatile signaling switches in plants. Plant Cell, 14(suppl 1), S375–S388. DOI 10.1105/tpc.001065. [Google Scholar] [CrossRef]
6. Zheng, Z. L., Yang, Z. B. (2000). The Rop GTPase: An emerging signaling switch in plants. Plant Molecular Biology, 44(1), 1–9. DOI 10.1023/A:1006402628948. [Google Scholar] [CrossRef]
7. Li, H., Lin, Y., Heath, R. M., Zhu, M. X., Yang, Z. et al. (1999). Control of pollen tube tip growth by a Rop GTPase-dependent pathway that leads to tip-localized calcium influx. Plant Cell, 11(9), 1731–1742. DOI 10.1105/tpc.11.9.1731. [Google Scholar] [CrossRef]
8. Jones, M. A., Shen, J. J., Fu, Y., Li, H., Yang, Z. B. et al. (2002). The Arabidopsis Rop2 GTPase is a positive regulator of both root hair initiation and tip growth. Plant Cell, 14(4), 763–776. DOI 10.1105/tpc.010359. [Google Scholar] [CrossRef]
9. Bloch, D., Lavy, M., Efrat, Y., Efroni, I., Bracha-Drori, K. et al. (2005). Ectopic expression of an activated RAC in Arabidopsis disrupts membrane cycling. Molecular Biology of the Cell, 16(4), 1913–1927. DOI 10.1091/mbc.e04-07-0562. [Google Scholar] [CrossRef]
10. Zheng, Z. L., Nafisi, M., Tam, A., Li, H., Crowell, D. N. et al. (2002). Plasma membrane-associated ROP10 small GTPase is a specific negative regulator of abscisic acid responses in Arabidopsis. Plant Cell, 14(11), 2787–2797. DOI 10.1105/tpc.005611. [Google Scholar] [CrossRef]
11. Ono, E., Wong, H. L., Kawasaki, T., Hasegawa, M., Kodama, O. et al. (2001). Essential role of the small GTPase Rac in disease resistance of rice. Proceedings of the National Academy of Sciences of the United States of America, 98(2), 759–764. DOI 10.1073/pnas.98.2.759. [Google Scholar] [CrossRef]
12. Li, C. J., Lu, H. M., Li, W., Yuan, M., Fu, Y. (2017). A ROP2-RIC1 pathway fine-tunes microtubule reorganization for salt tolerance in Arabidopsis. Plant, Cell & Environment, 40(7), 1127–1142. DOI 10.1111/pce.12905. [Google Scholar] [CrossRef]
13. Miao, H. X., Sun, P. G., Liu, J. H., Wang, J. Y., Xu, B. Y. et al. (2018). Overexpression of a novel ROP Gene from the Banana (MaROP5g) confers increased salt stress tolerance. International Journal of Molecular Sciences, 19(10), 3108. DOI 10.3390/ijms19103108. [Google Scholar] [CrossRef]
14. Li, H., Shen, J. J., Zheng, Z. L., Lin, Y. K., Yang, Z. B. (2001). The Rop GTPase switch controls multiple developmental processes in Arabidopsis. Plant Physiology, 126(2), 670–684. DOI 10.1104/pp.126.2.670. [Google Scholar] [CrossRef]
15. Christensen, T. M., Vejlupkova, Z., Sharma, Y. K., Arthur, K. M., Spatafora, J. W. et al. (2003). Conserved subgroups and developmental regulation in the monocot rop gene family. Plant Physiology, 133(4), 1791–1808. DOI 10.1104/pp.103.029900. [Google Scholar] [CrossRef]
16. Abbal, P., Pradal, M., Sauvage, F. X., Chatelet, P., Paillard, S. et al. (2007). Molecular characterization and expression analysis of the Rop GTPase family in Vitis vinifera. Journal of Experimental Botany, 58(10), 2641–2652. DOI 10.1093/jxb/erm113. [Google Scholar] [CrossRef]
17. Chen, L., Shiotani, K., Togashi, T., Miki, D., Aoyama, M. et al. (2010). Analysis of the Rac/Rop small GTPase family in rice: expression, subcellular localization and role in disease resistance. Plant and Cell Physiology, 51(4), 585–595. DOI 10.1093/pcp/pcq024. [Google Scholar] [CrossRef]
18. Liu, W., Chen, A. M., Luo, L., Sun, J., Cao, L. P. et al. (2010). Characterization and expression analysis of Medicago truncatula ROP GTPase family during the early stage of symbiosis. Journal of Integrative Plant Biology, 52(7), 639–652. DOI 10.1111/j.1744-7909.2010.00944.x. [Google Scholar] [CrossRef]
19. Liang, Q. X., Cao, G. Q., Zhao, S. P., Huang, Q. C., Ying, F. Q. et al. (2015). Analysis of ROP signaling in the leaf epidermis of mutant tomato with low-energy ion beam. Genetics and Molecular Research, 14(2), 3807–3816. DOI 10.4238/2015.April.22.10. [Google Scholar] [CrossRef]
20. Li, L., Li, M. M., Qi, X. W., Tang, X. L., Zhou, Y. F. (2018). De novo transcriptome sequencing and analysis of genes related to salt stress response in Glehnia littoralis. PeerJ, 6, e5681. DOI 10.7717/peerj.5681. [Google Scholar] [CrossRef]
21. Li, L., Li, N., Fang, H., Qi, X., Zhou, Y. (2020). Selection and validation of reference genes for normalisation of gene expression in Glehnia littoralis. Scientific Reports, 10(1), 7374. DOI 10.1038/s41598-020-63917-5. [Google Scholar] [CrossRef]
22. Livak, K. J., Schmittgen, T. D. (2001). Analysis of relative gene expression data using real-time quantitative PCR and the 2-ΔΔCt method. Methods, 25(4), 402–408. DOI 10.1006/meth.2001.1262. [Google Scholar] [CrossRef]
23. Voronkova, N. M., Burkovskaya, E. V., Bezdeleva, T. A., Burundukova, O. L. (2008). Morphological and biological features of plants related to their adaptation to coastal habitats. Russian Journal of Ecology, 39(1), 1–7. DOI 10.1134/S1067413608010013. [Google Scholar] [CrossRef]
24. Li, H. B., Lv, D. G., Jiang, S. Y., Liang, S., Piao, Z. Y. (2011). The effect of NaCl stress on chlorophyll fluorescence parameters and other physiological characteristics of Glehnia littoralis. Agricultural Research in the Arid Areas, 29(6), 239–243. [Google Scholar]
 | This work is licensed under a Creative Commons Attribution 4.0 International License, which permits unrestricted use, distribution, and reproduction in any medium, provided the original work is properly cited. |