International Journal of
Experimental Botany
| Phyton- International Journal of Experimental Botany |
DOI: 10.32604/phyton.2021.014567
ARTICLE
Analysis of Growth and Productivity of Green Chickpea Using Nitrogen and Phosphorus Fertilization
1Facultad de Ciencias Agropecuarias-Universidad Michoacana de San Nicolás de Hidalgo, Apatzingán, 60670, México
2Colegio de Postgraduados-Campus Montecillo, Texcoco, 56230, México
3Facultad de Agrobiología “Presidente Juárez”, Universidad Michoacana de San Nicolás de Hidalgo, Uruapan, 60190, México
*Corresponding Author: Patricio Apáez-Barrios. Email: patricio.apaez@umich.mx
Received: 09 October 2020; Accepted: 25 December 2020
Abstract: Chickpea contains high levels of protein, vitamins and minerals. Acceptable chickpea yield is the result of meeting nitrogen and phosphorus requirements. The effect of appropriately meeting such requirements reflects on growth and can easily be evaluated using growth analysis. This research determined: (a) The effect of nitrogen and phosphorus fertilization on phenology, net assimilation rate, number of green leaves, leaf area, leaf area index and leaf area duration; (b) Green chickpea yield and number of pods due to fertilization; and (c) The combination of nitrogen and phosphorus fertilization that yields the most net revenue. Nitrogen and phosphorus fertilization was evaluated; each at the doses of 0, 75 and 150 kg ha–1 (N0, N75, N150; P0, P75 and P150, respectively). The combination of the levels of both nutrients generated nine combinations of treatments which were distributed in the field in a randomized complete block design in an arrangement of divided plots with four repetitions. Timing of phenological phases were similar among treatments. Nitrogen and phosphorus fertilization increased number of leaves, leaf area index, and leaf area duration that translated into increased green chickpea yield (GCY). Combinations N150-P75 and N150-P150 produced the highest GCY. The highest net revenue and revenue per peso invested was obtained with N150-P75.
Keywords: Cicer arietinum; economic analysis; leaf area; number of leaves; yield
Chickpea (Cicer arietinum) is a legume from India, mostly sown in Turkey, Pakistan and Mexico. World production for 2015 was 8.3 million tons for human consumption [1]. In Mexico, chickpea is commercially sown in Sinaloa, Sonora, Michoacán, Guanajuato, Baja California Sur, Jalisco and Guerrero [2]. Chickpea is an excellent source of tryptophan and phenylalanine. These essential amino acids increase the sensation of satiety and might contribute to obesity reduction [3]. Chickpea can provide between 11% to 14% of fiber, from 8% to 24% of iron and from 17% to 24% of magnesium to the recommended daily intake. In average, the seed contains 7.8 g protein per 100 g of fresh seed (IDR, NOM/051/SCFI/SSA1-2010), and it has more calcium, iron and potassium than faba bean (Vicia faba L.), ayocote (Phaseolus coccineus L.) and green bean (Pisum sativum L.) [4]. Chickpea is harvested green, which results in less than 50% of the required nitrogen by the crop from biological fixation [5].
Fageria et al. [6] mentioned that nitrogen is the nutrient that determines yield. It is an integral part of chlorophyll and essential amino acids for protein synthesis. Likewise, phosphorus takes part in several physiological processes like germination, seedling development, root growth, and start of fructification. It is a necessary component of the plant-rhizome symbiosis, and it affects biological nitrogen fixation [7]. Nitrogen and phosphorus influence yield under rainfed conditions by increasing size and duration of the canopy, and thus modify the photosynthetic machinery [8,9]. Reports have pointed out that size and duration of the photosynthetic apparatus are tightly related to number of pods and yield [10]. The physiological causes of grain yield following fertilization can be determined with a growth analysis. This analysis quantifies important characteristics like growth rate, length of the vegetative cycle, biomass production efficiency, and biomass production rate in every phenological stage, as well as biomass distribution in every organ of the plant. Additionally, it is possible to calculate net assimilation rate (NAR) to determine photosynthate production and photosynthetic activity. Ultimately, the size of the photosynthetic source depends on number of leaves and leaf area [11]. Chickpea is a good alternative for small-scale producers. It is sold as green grain (green chickpea) and reaches up to 50% higher economic revenue than dry grain [12]. Greater yield might be promoted by nitrogen and phosphorus fertilization to promote canopy growth [13]. Chemical fertilizers, particularly those with nitrogen and phosphorus, have increased their price as a consequence of high demand and high production costs [14]. Economic viability of chemical fertilization on chickpea must then be evaluated. The optimal dose that produces the highest net revenue, regardless of yield, can be determined by evaluation of the response to different levels of phosphorus and nitrogen fertilization.
Apáez et al. [15] found a high nitrogen dose (100 kg ha–1) increases crop profitability and results chickpea in the highest yield per surface area. However, few studies have focused on chickpea. Therefore this study determined: (a) The effect of nitrogen and phosphorus fertilization on phenology, net assimilation rate, number of green leaves, leaf area, leaf area index and leaf area duration; (b) Yield components and green chickpea yield after nitrogen and phosphorus fertilization; and (c) The optimal combination of nitrogen and phosphorus fertilization that produces the highest net revenue.
The study was located in Huitzuco, Guerrero, Mexico at 18° 15’ N, 99° 09’ W and 1086 m above sea level. The climate in the region is AW1 corresponding to warm subhumid with rain in summer [16]. The chickpea seed employed in this research was a white grain, regional landrace. Seeds were sowed under rainfed conditions on June 1, 2017. The population density was 15 plants m–2. Nitrogen and phosphorus was applied in treatments that combined 0, 75 and 150 kg ha–1 of each nutrient (N0, N75 and N150; P0, P75 and P150, respectively). These combinations of nitrogen and phosphorus fertilization created nine treatments. All the phosphorus dose and half of the nitrogen treatment were applied 20 days after sowing (das) and the rest at 45 das. Urea (46% nitrogen) and triple calcium superphosphate (46% P205) supplied the nutrients. Trials were set up in random blocks, in a split-plot arrangement with four repetitions. The N corresponded to the large plot and the P to the small plot. Physical and chemical analyses were performed on the soil to determine basal fertility levels. The characteristics of the soil were: 39% clay, 25% sand, 36% silt corresponding to loamy clay, high organic matter content (3.51%), a 1.25 g cm–3 apparent density, pH 7.2 (slightly alkaline), low electric conductivity (0.32 dS m–1), low inorganic nitrogen content (3.0 mg kg–1), and medium phosphorus content (11 mg kg–1).
During the whole crop cycle, maximum and minimum temperature (Tmax, Tmin, respectively; °C) were recorded; accumulated rainfall (mm) was registered. The data were collected from the 12115 Huitzuco (DGE)-GRO weather station (18° 30’ N and 99° 32’ W). Phenological stages were recorded on criteria proposed by Padilla et al. [17]: Days to emergence (E), days to flowering (R1), days to fructification (R2) and days to end of fructification (R3). Green chickpea yield (GCY, g m–2) was determined by harvesting at 100 das. Number of green leaves (NGL, leaves m–2) and leaf area (the leaf area was measured with a LICOR 3100 leaf area integrator, cm2) were recorded in each of five plants sampled from the central row of the useful plot in each experimental unit at 25, 50, 75 and 100 das. Leaf area index (LAI) was calculated at 25, 50, 75 and 100 das. See Eq. (1). Leaf area duration (LAD) was recorded from emergence to 100 das. See Eq. (2):
where LA = leaf area (dm2); NP = number of sampled plant; and PD = number of plants m–2.
where ∑ = sum of the leaf area duration in each sample point; IAF1 = leaf area index at a starting point (T1, days); IAF2 = leaf area index at a final point (T2, days) [11].
Total biomass (TB, g dry matter m–2) was registered for each organ in the plant (stems, leaves, pods and grain). Samples were dried in a forced-air oven at 80°C until constant weight was registered. Average net assimilation rate (NAR) was calculated for the same periods (sowing to 25 das, 25 to 50 das, 50 to 75 das and 75 to 100 das with the collected biomass data). The equations for NAR were. See Eq. (3):
where DW1 and DW2 are dry biomass weight; ln LA2 and ln LA1 are the natural logarithm on leaf area at time T2 and T1, respectively.
Data was analyzed with SAS version 9.0. Differences among treatments were calculated by Tukey mean comparison at 5% probability [18]. An economic analysis was performed with the data [19].
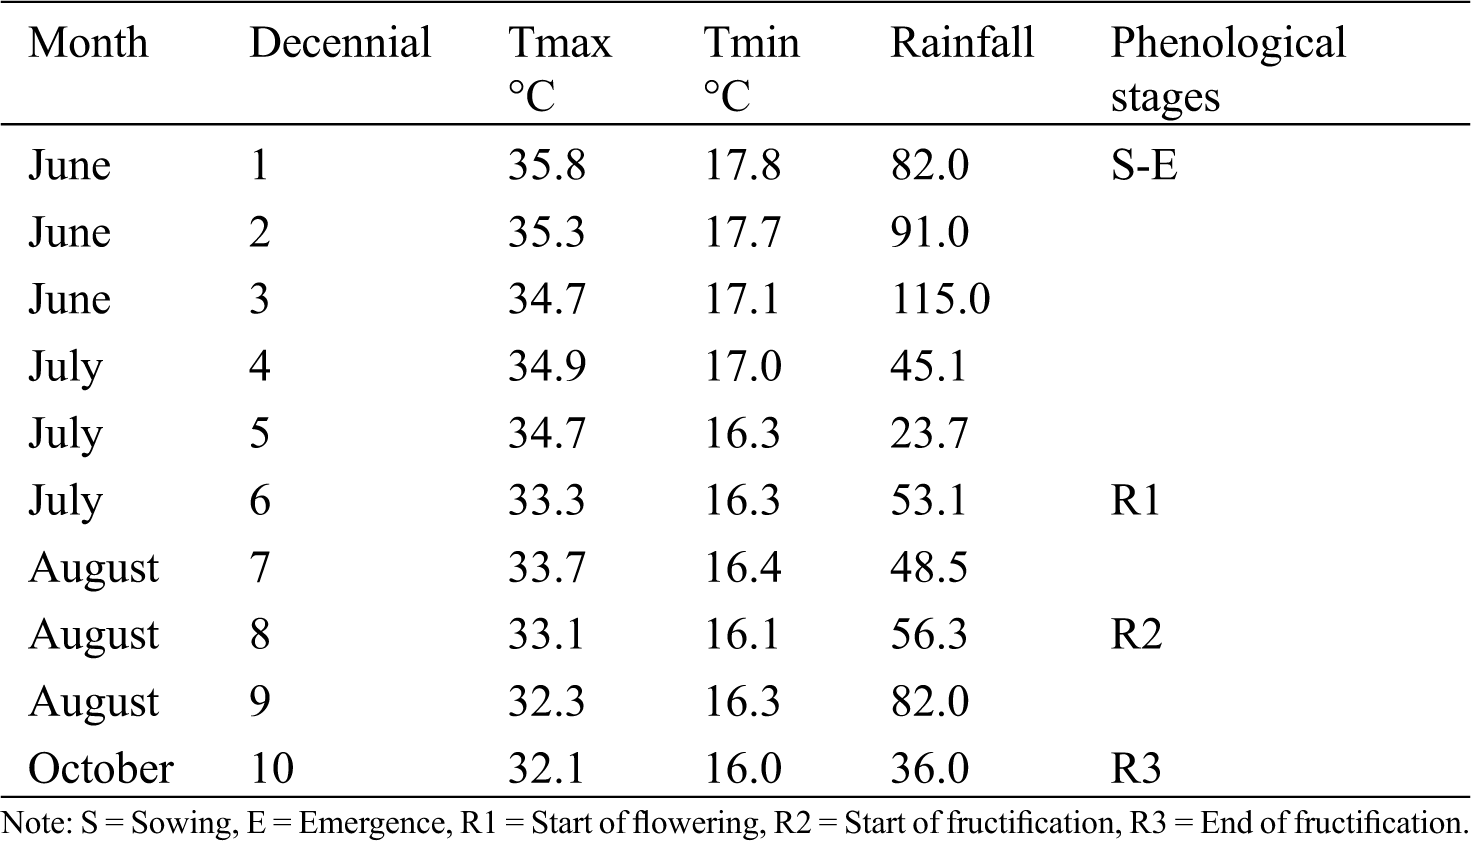
During the crop cycle, the average minimum (Tmin) and maximum (Tmax) temperature was 17°C and 34°C, respectively. The highest temperatures were registered from sowing to 50 das (Tmax = 35°C; Tmin = 17°C). After this period, temperature decreased until the end of fructification (R3); the lowest temperature was registered at 100 das (16°C), exactly when green chickpea was harvested. Accumulated rainfall was 633 mm: 64% (409 mm) occurred from sowing to start of flowering (R1), and 36% (224 mm) accumulated in the reproductive stage from R1 to R3 (end of fructification). Climate conditions, temperature and rainfall, during this study were appropriate for chickpea crops; the recommended temperature range is 10 to 25°C, and the optimal temperature is 20°C [20]. Timing of the phenology stages occurred similarly among treatments. Emergence (E) started at 10 das, start of flowering (R1) started at 55 das, and end of fructification was recorded at 100 das (Tab. 1). Similar behavior is mentioned by Apáez et al. [15]: Timing of phenological stages was not modified by nitrogen fertilization. However, Abayomi et al. [21] reported contrasting results that indicated nitrogen and phosphorus fertilization reduced crop cycle by 6 days.
Table 1: Average decennial maximum and minimum temperature and decennial sum of rainfall during the chickpea crop cycle. Huitzuco, Guerrero. Summer 2017
3.2 Number of Green Leaves, Leaf Area Index and Leaf Area Duration
The number of green leaves (NGL), leaf area index (LAI) and leaf area duration (LAD) showed significant differences due to fertilization with either nitrogen or phosphorus and their interaction N*P presents significant differences at 75 and 100 das. For the LAI variable the factor N generates highly significant differences at 50, 75 and 100 das, P and the interaction generate differences at 75 and 100 das. On the other hand, the LAD variable, the N factor and the interaction present highly significant differences, while P presents significant differences (Tabs. 2 and 3). Treatment N150 produced increments of 82%, 92% and 62% to NGL, LAI and LAD, respectively; the N75 treatment followed by increasing the same variables by 46%, 46% and 35%, respectively, in relation to the control treatment. These results are in line with Escalante et al. [9]: NGL can be modified as the emergence rate for leaves changes with nutrition, and nitrogen fertilization delays leaf senescence. In this research, greater number of leaves per plant were counted at 100 das due to fertilization. Caliskan et al. [22] mentioned that nitrogen fertilization increases production rates of photosynthates and chlorophyll pigments. This effect reflects on LAI. Similar tendencies were reported by Abayomi et al. [21] in cowpea [Vigna unguiculata (L.) Walp]. They found that nitrogen fertilization delayed leaf senescence and increased the number of leaves, NGL, LAI and LAD.
Table 2: Significance of number of green leaves (NGL), leaf area index (LAI), leaf area duration (LAD) and net assimilation rate (NAR) of chickpea as a response of nitrogen (N), phosphorous (P) fertilization and interaction of N*P. Huitzuco, Guerrero. Summer 2017
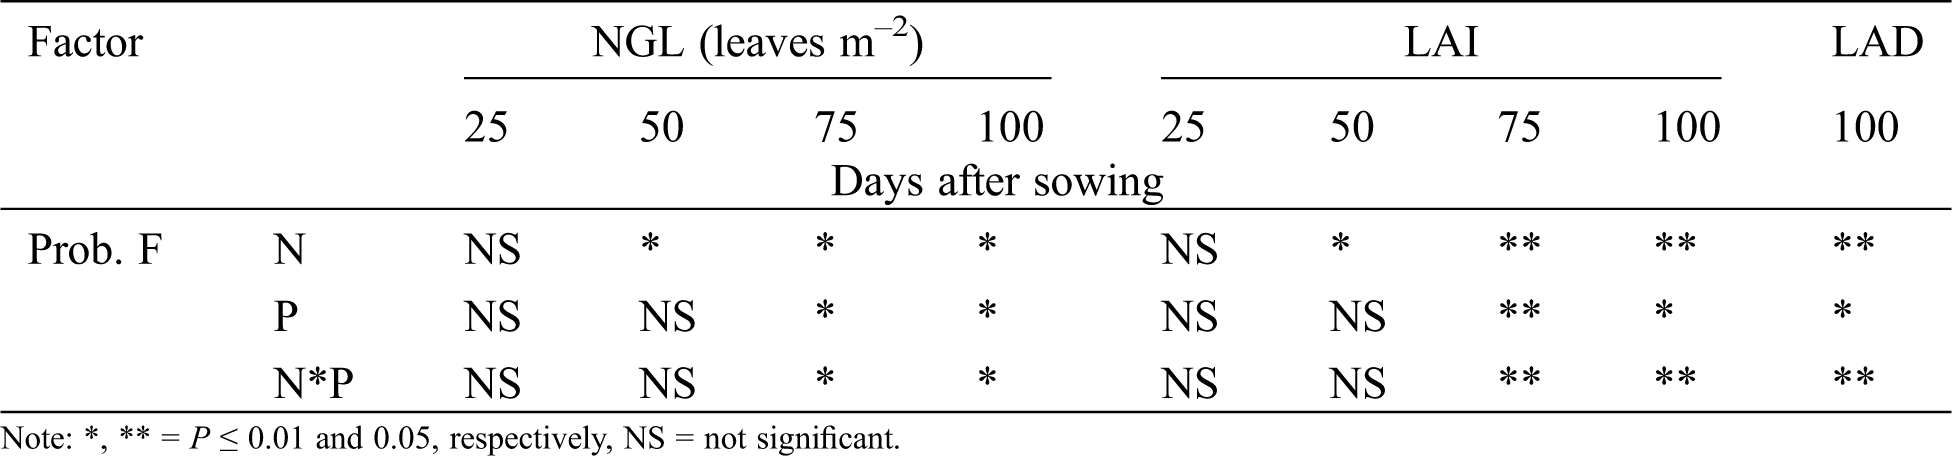
Table 3: Number of green leaves (NGL), leaf area index (LAI), and leaf area duration (LAD) of chickpea as a response of nitrogen (N) and phosphorous (P) fertilization. Huitzuco, Guerrero. Summer 2017
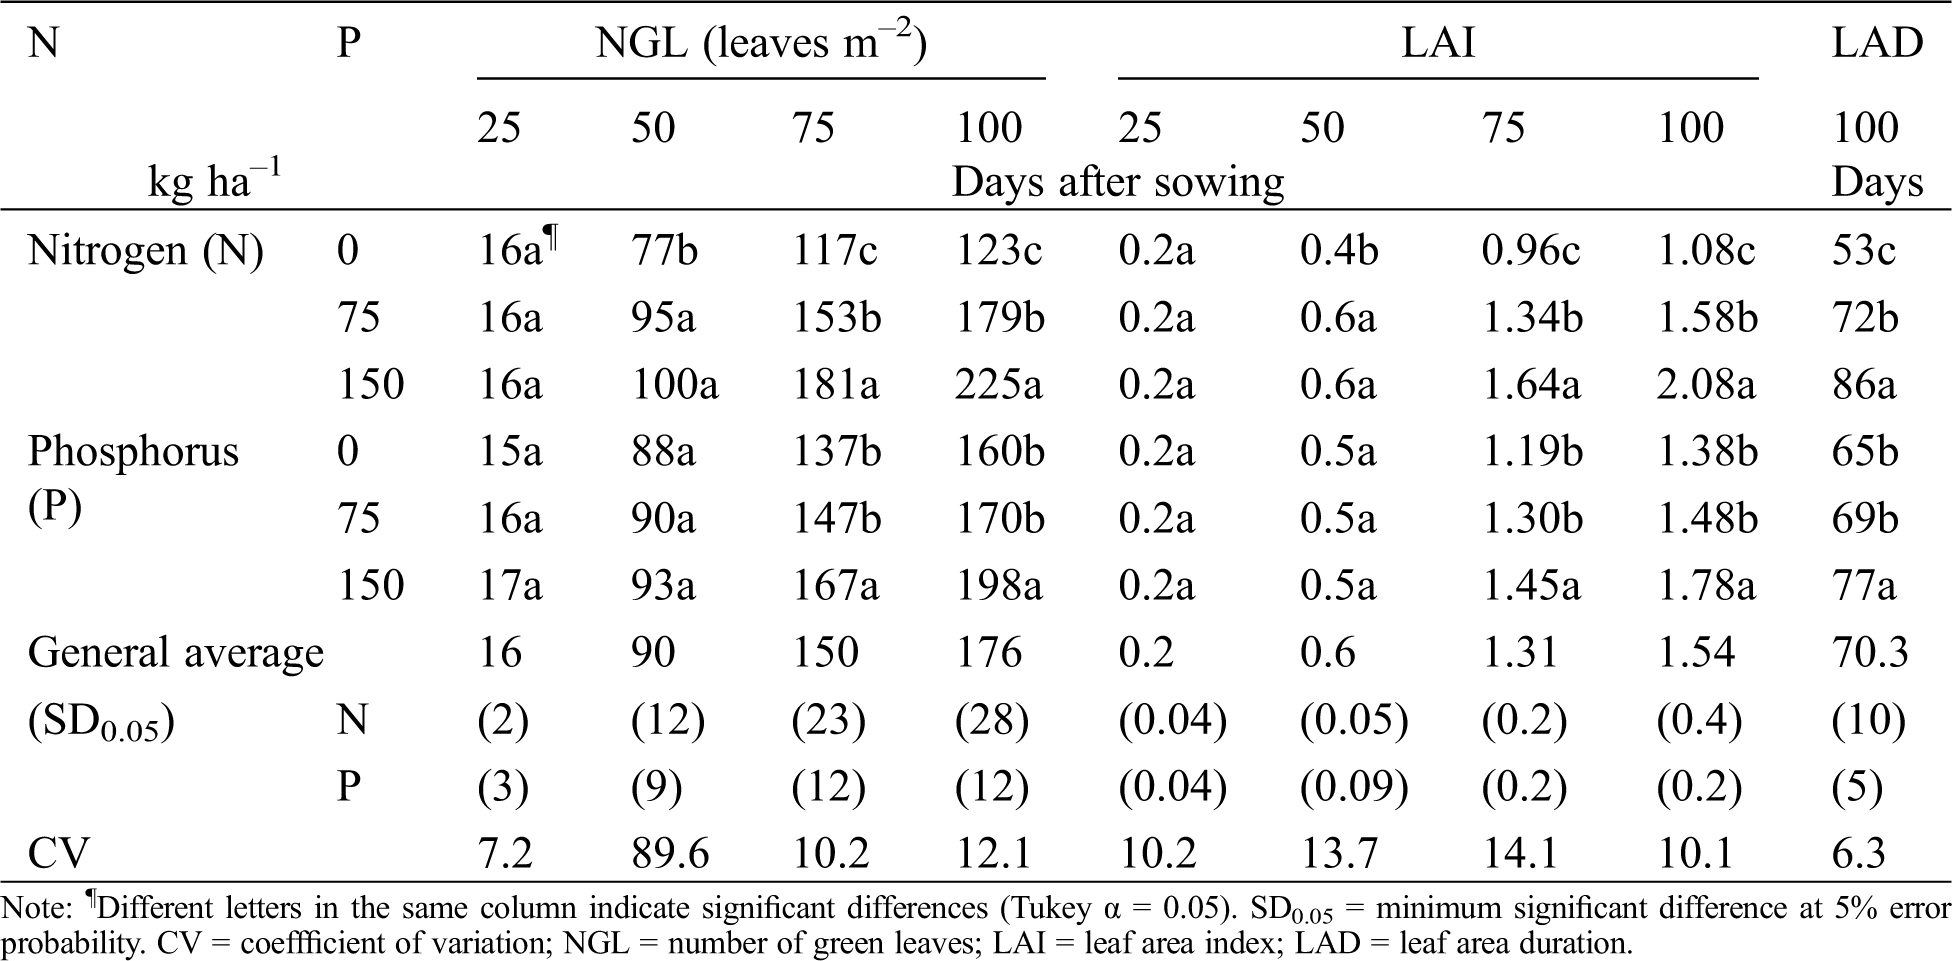
At the end of the cycle (100 das), P150 produced the highest NGL, LAI and LAD. These variables increased by 23%, 28% and 18%, respectively. P75 caused minimal changes on the photosynthetic apparatus: 8% increase in size (NGL and LAI) and 6% longer duration (LAD). This response is similar to the results reported by Olivera et al. [23]. The authors described a positive effect of phosphorus on leaf size, and thus on LAI. Muhammad et al. [24] reported that supplying phosphorus promotes greater leaf area on soybean [Glycine max (L.) Merrill], cowpea and mungo bean [Vigna radiata (L.) Wilczek]. Their results showed 64%, 95% and 90% increments, respectively, when compared to a non-fertilized control.
The results in these research might be explained by reduced photosynthetic rates caused by phosphorus deficiency. This deficiency directly affects leaf area development and photosynthetic capacity per unit of leaf area. Nitrogen fixation is also reduced as a consequence of diminished nitrogenase activity, smaller root growth, fewer leaves, fewer knots, fewer branches, slower relative rate of leaf emergence and slower leaf expansion [24].
Fig. 1 shows the rates of NGL emergence and LAI. The curves were fitted to a second degree polynomial. NGL and LAI increase as the crop cycle advances and then decrease because of senescence. When nitrogen was supplied, increments were more pronounced as the greater NGL indicates. Treatments N75-P150 and N150-P150 increased NGL by 86% to 95%, respectively, while LAI increased 22% to 12%, respectively, when measured at 100 das. The highest values for NGL and LAI occurred at 100 das. Nitrogen fertilization significantly increased NGL and LAI from 50 das, while the effect of phosphorus fertilization was observed from 75 das. Up to that moment, the basal nitrogen and phosphorus levels in the soil might have been enough to satisfy the nutritional requirements of the crop. Similar tendencies were found by Apáez et al. [13]. They reported that biomass and yield of cowpea bean increased in response to additional nitrogen and phosphorous fertilization.
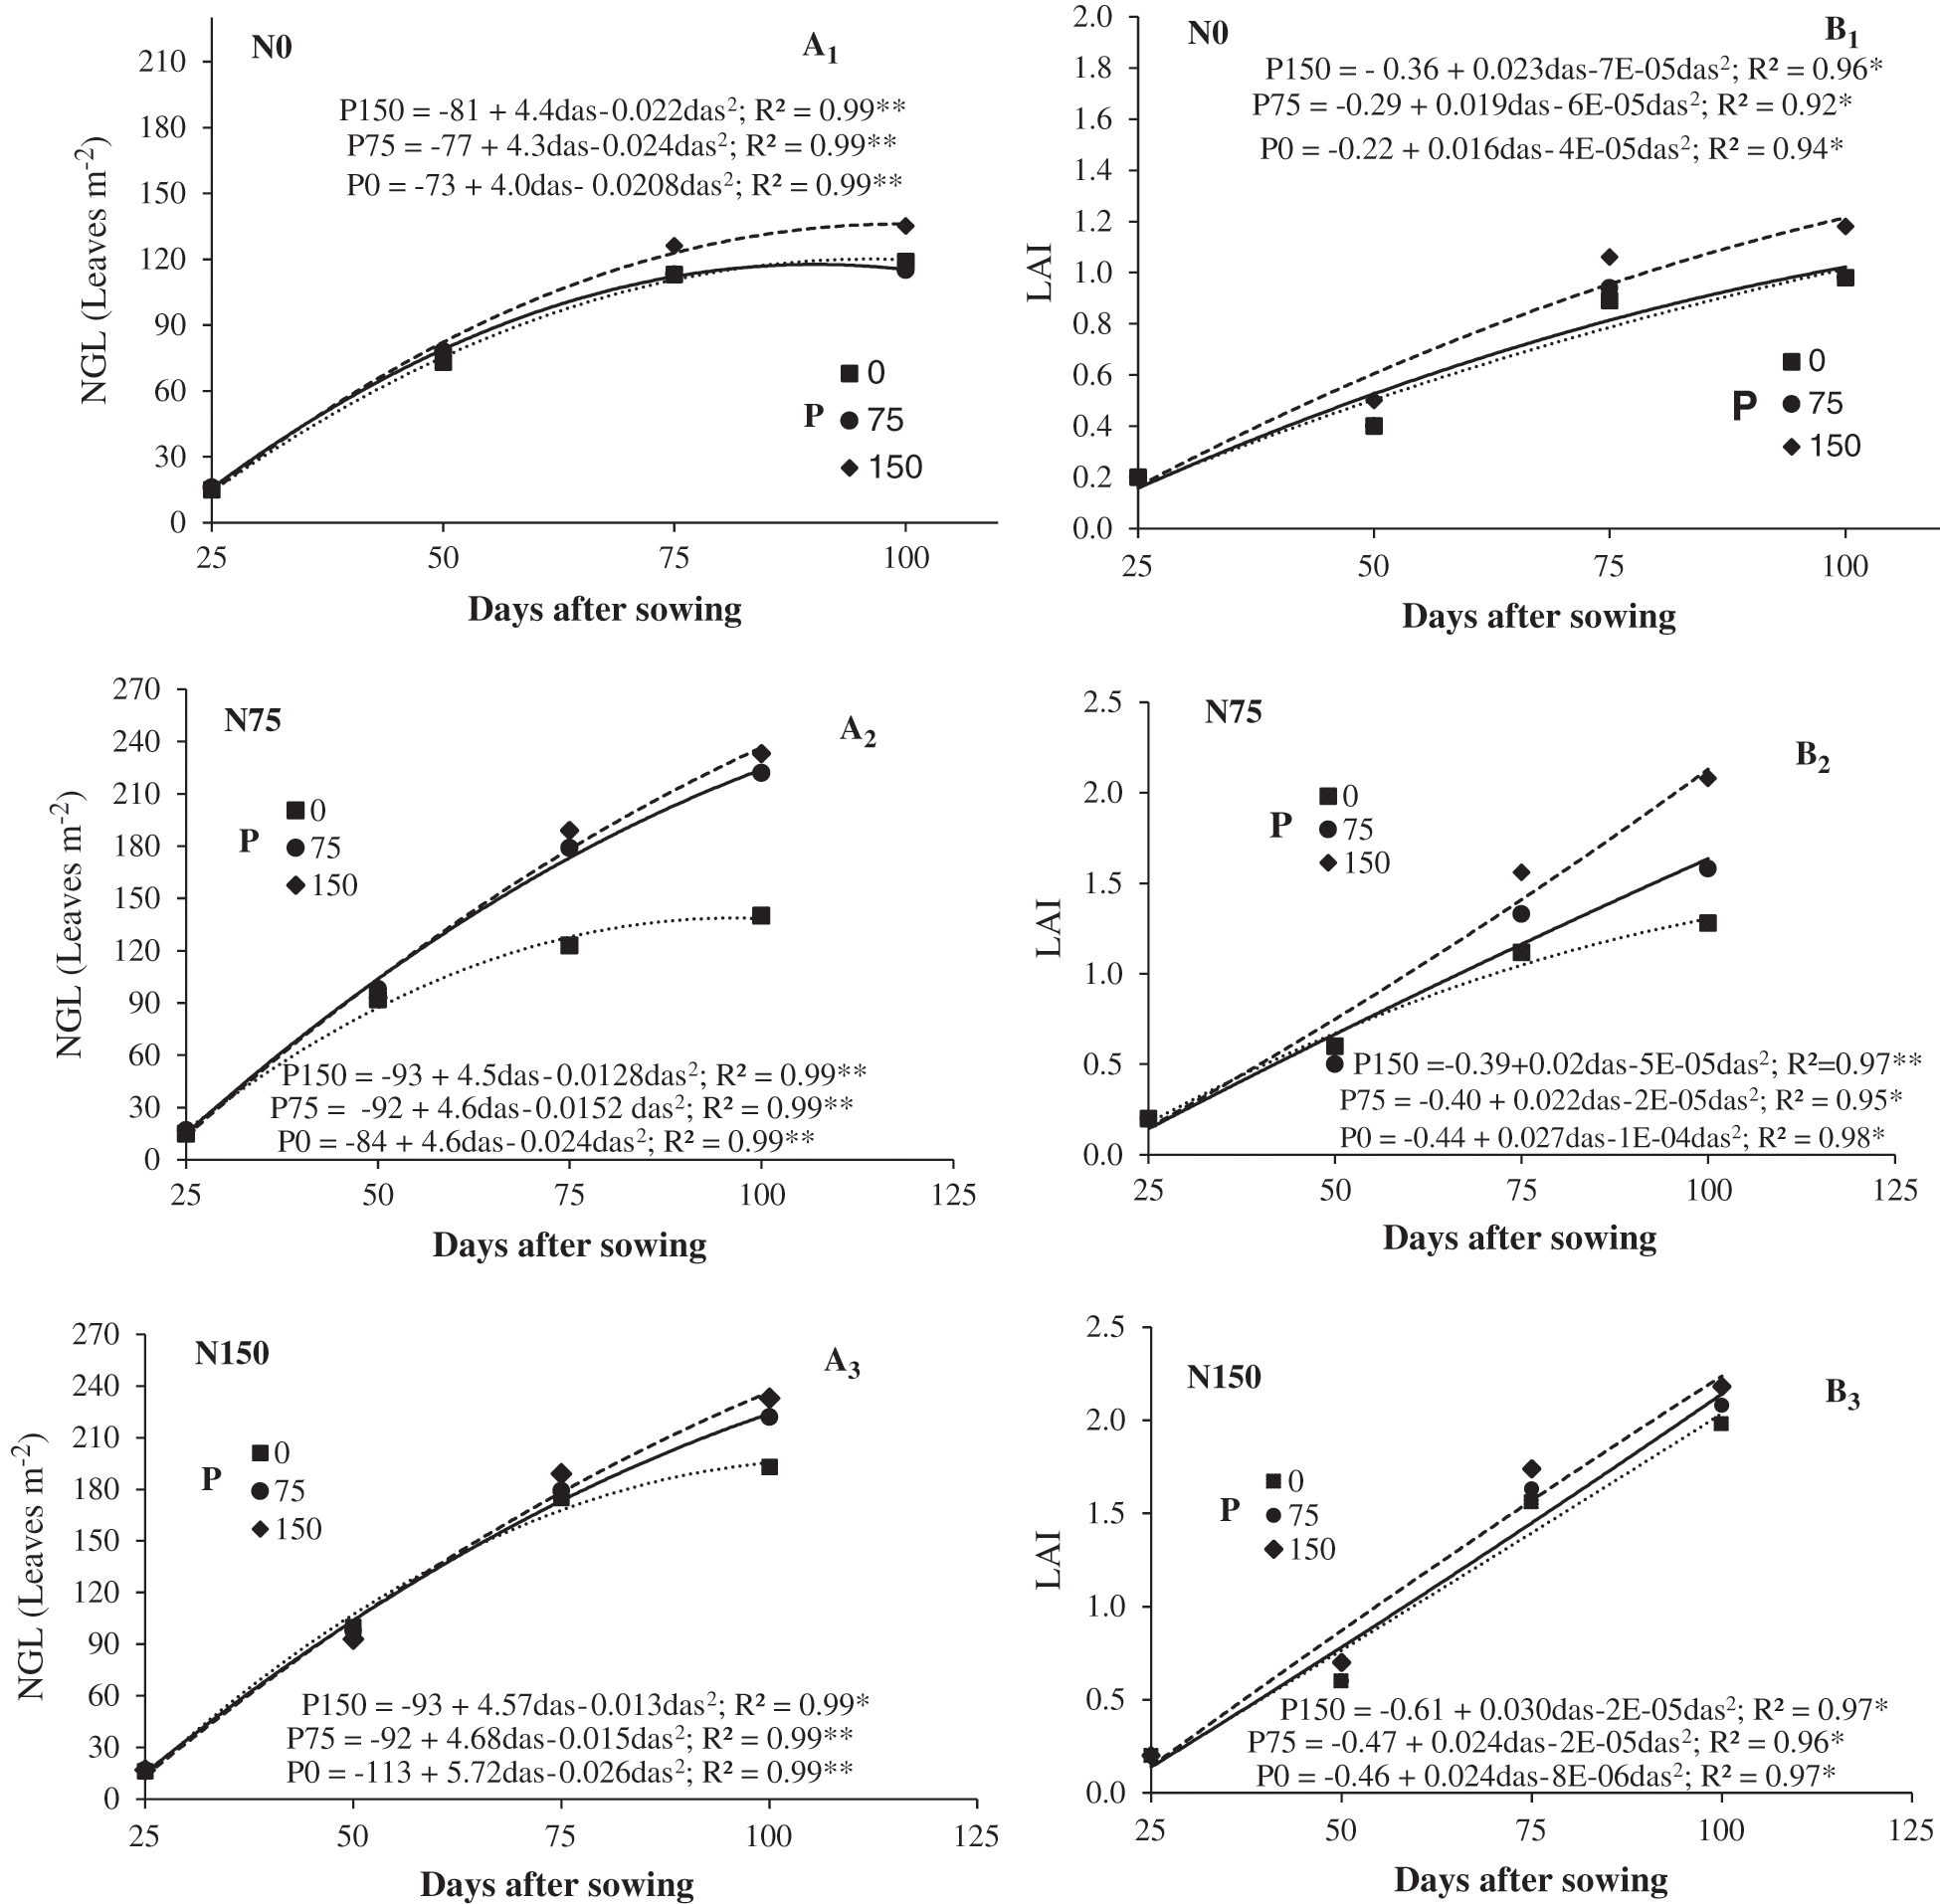
Figure 1: Number of green leaves (NGL, A1, A2 y A3) and leaf area index (LAI, B1, B2 y B3) of chickpea in response to nitrogen (N) and phosphorous (P) fertilization. Huitzuco, Guerrero. Summer 2017. das = days after sowing
Regarding the N*P interaction, it was found that the response of chickpea to fertilization with P on NGL and LAI, was greater with the application of N75, as the highest increases in these variables occurred at 75 and 100 days with the supply of P75 and P150, in comparison with the control without application (P0) as observed in Fig. 1. Likewise, the application of N75 favored more the response of the chickpea to the application of P over the duration of the foliar area.
3.3 Average Net Assimilation Rate
All treatments showed the highest net assimilation rate (NAR) from 25 to 40 das, and as the crop cycle advanced, it decreased to the lowest recorded values at 100 das. This behavior might be caused by shading of the inferior canopy layers from the uppermost canopy. Additionally, in the last stage of the crop cycle, leaf senescence rate increases [8]. Chickpea with added nitrogen had the highest NAR from 40 das. N150 treatment increased NAR by 0.008 g dm–2 day–1, while N75 increased NAR by 0.002 g dm–2 day–1 when compared to the control (N0). These results suggest nitrogen stimulates photosynthetic efficiency of the canopy (Fig. 2). Reported nitrogen fertilization increased photosynthetic activity by increasing Rubisco activity and chlorophyll concentration in the leaves. A similar response was found with N75 and N150 treatments by Apáez et al. [8] in cowpea who applied 100 kg of nitrogen ha–1. Phosphorus fertilization modified NAR and had maximum values of 0.015 g dm–2 day–1 for P150 (Fig. 2). In 2014, Apáez et al. [25] found high NAR values when N150 and P150 were applied to cowpea (0.0016 g dm–2 day–1 y 0.0014 g dm–2 day–1, respectively).
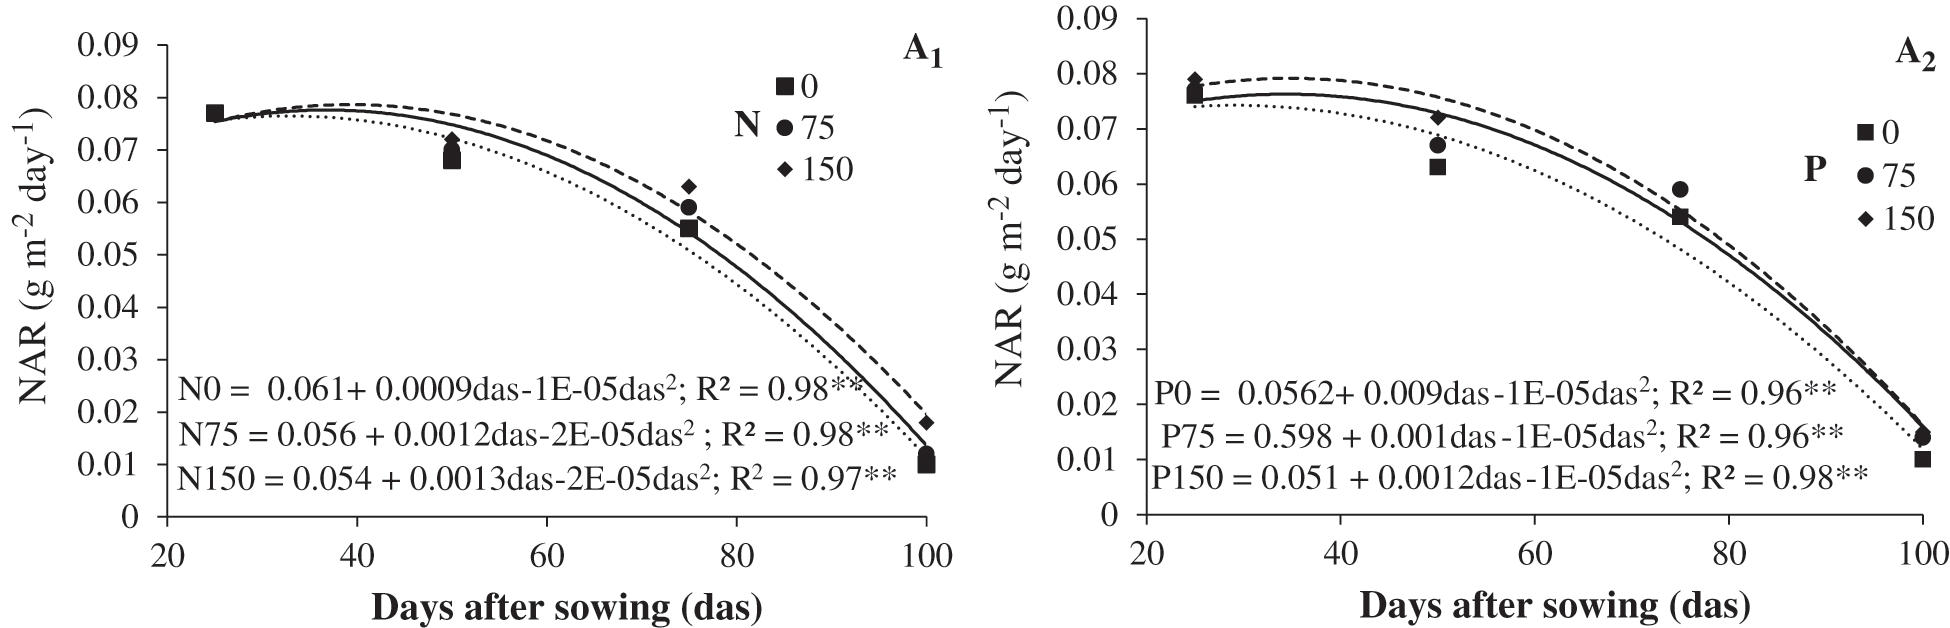
Figure 2: Net assimilation rate (NAR) curves of chickpea in response to nitrogen (A1) and phosphorous (A2). Huitzuco, Guerrero. Summer 2017
3.4 Green Chickpea Yield and Yield Components
Green chickpea yield (GCY) and number of pods (NP) showed significant changes for nitrogen (N) and phosphorus (P) fertilization (Tabs. 4 and 5). For the GCY variable, N and N*P generate highly significant differences, while P causes significant differences. For N*P the factor N and P generate significant differences, while the interaction N*P does not generate differences. The results indicate that the application of N and P, as well as the N*P interaction generate significant differences at the end of the crop cycle since they modify the values of the evaluated variables (Tab. 4).
Table 4: Significance of green chickpea yield (GCY) and number of pods (NP) of chickpea as a response of nitrogen (N), phosphorous (P) fertilization and interaction of N*P. Huitzuco, Guerrero. Summer 2017
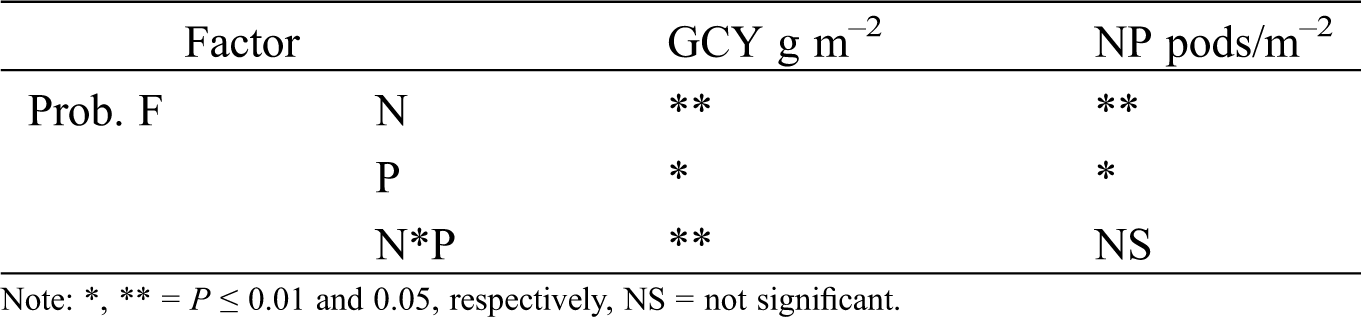
Table 5: Green chickpea yield and yield components in response to nitrogen (N) and phosphorous (P) fertilization. Huitzuco, Guerrero. Summer 2017
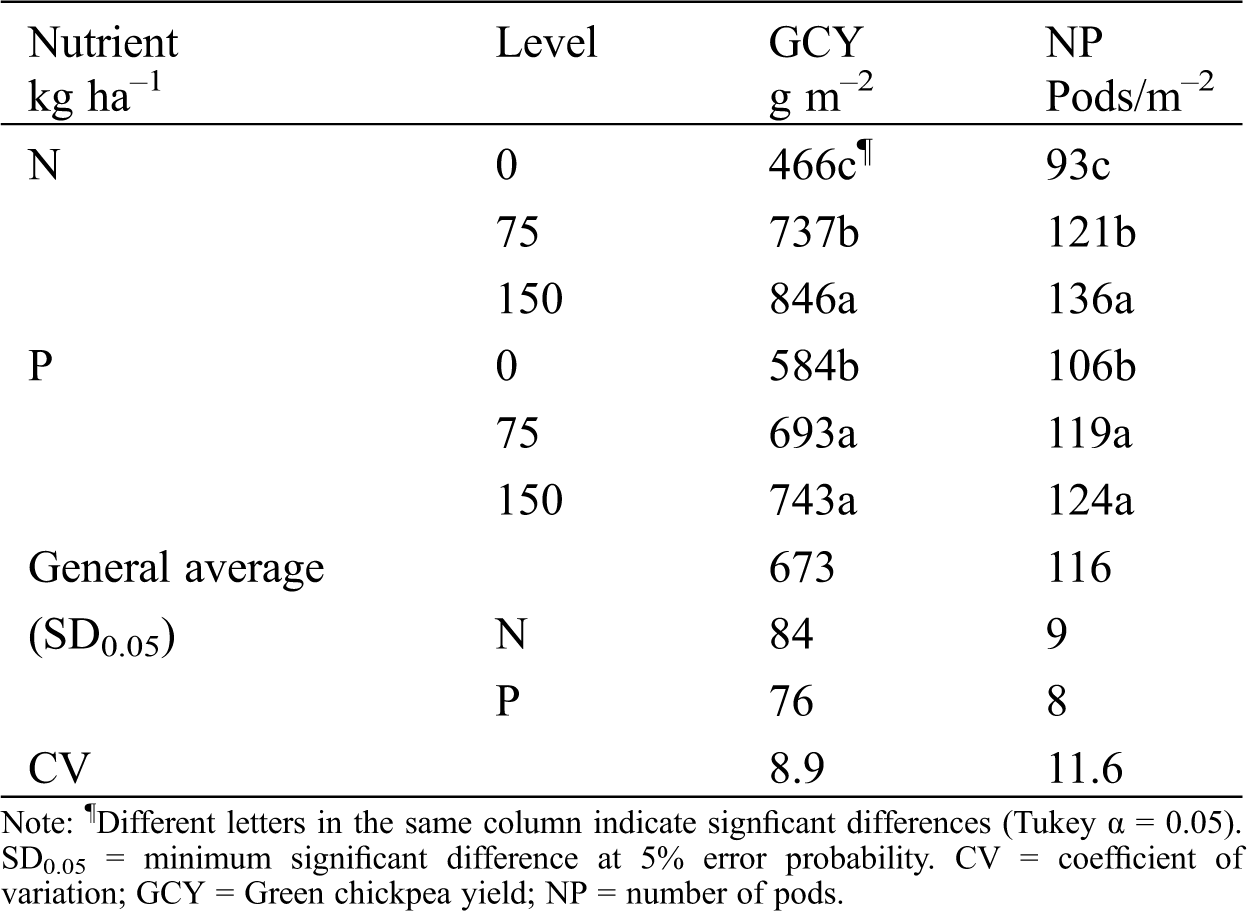
GCY and NP increased with added nitrogen, phosphorus (Tab. 5). P150 had the highest GCY and NP. Comparisons to the control treatment (N0) showed increments of 83% for GCY and 60% for NP. N75 was the second best treatment; it caused increments of 46% and 30% on GCY and NP, respectively. Phosphorus fertilization favored chickpea production too; however, its effect was less visible than nitrogen fertilization. The basal phosphorus level in the soil might have been sufficient to cover initial crop requirements. Tab. 5 shows that the highest increment was achieved from N75; GCY and NP increased 27% and 17%, respectively.
Thus, N150-P75 and N150-P150 statistically increased GCY and NP; both treatments improved GCY by 501 g m–2 and NP by 56 pods m–2 compared to the unfertilized control. The middle fertilization level (N75-P75) increased GCY by 500 g m–2 and NP by 56 pods m–2. The increase in GCY at P150 was 9.93 kg per kilogram of nitrogen used, while on the control treatment (P0) the increment was only 6.93 kg per kilogram of nitrogen used. P75 was the dose that most favored the nitrogen response on GCY with increases of 14.87 kg per kilogram of nitrogen applied (Fig. 3). NP increased to 0.72 pods m–2 when P150 was applied, but it only increased 0.37 pods m–2 with the control (P0).
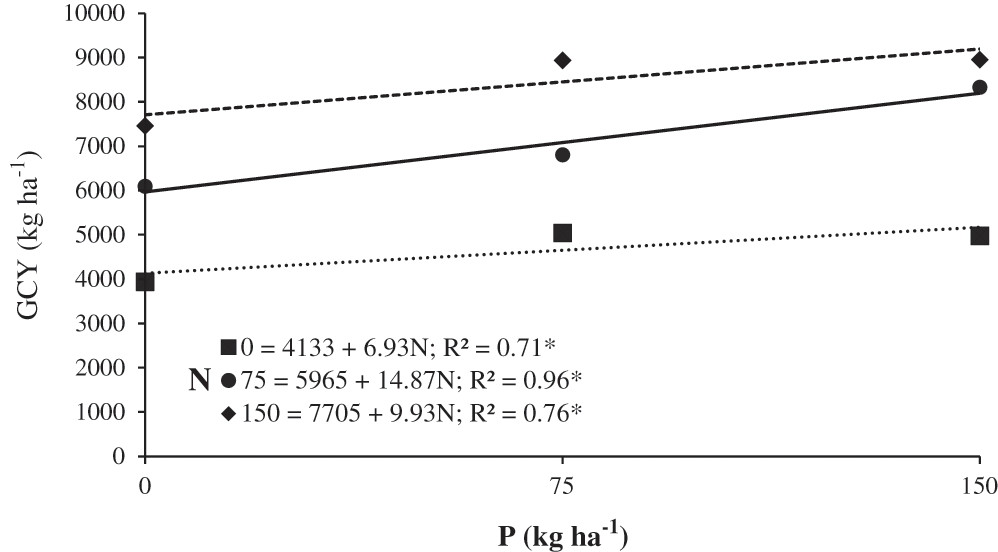
Figure 3: Green chickpea yield (GCY) in response to nitrogen and phosphorous. Huitzuco, Guerrero. Summer 2017
Regarding the N*P interaction, the response of the chickpea to the application of P on GCY was greater with the application of N75, as the greatest increases were obtained in these variables (Tab. 4 and Fig. 3).
Namvar et al. [26] mentioned fertilization of 100 kg of nitrogen ha–1 caused GCY and NP to increase by 52% and 22%, respectively, compared to the control treatment (N0). This behavior results from increased cellular division and enzymatic activity by nitrogen fertilization and results in higher dry matter accumulation in the grain. The positive response to added nitrogen as measured on yield promotes an increment on numbers of branches, flowers, and pods [21]. Several studies show nitrogen and phosphorus fertilization favor the production of pods and grains [27]. Significant effects on grain yield were reported by Walley et al. [28], too, when nitrogen and phosphorus were added (45 kg ha–1). Compared to the control treatment, grain yield was 14% higher when nitrogen was supplied and 7% when phosphorus was added. Addition of these nutrients has positive effects. The differences reported in this research could be attributed to several factors, mainly genotype (Type Desi cv myles) and weather conditions. The effect observed for added phosphorus was also found by Fageria et al. [29]. They found that additional phosphorus stimulates growth, root activity and nodule formation. Deficiency of phosphorus, as reported by Lynch et al. [30], reduces photosynthesis since it has a central role in energy transport, storage and transfer. Additionally, an adequate phosphorus supply increases grain size, number and viability [24]. Lastly, the results in this research indicate higher green grain yield and pod number in chickpea are achieved when nitrogen is applied; the supplemental nitrogen promotes increases photosynthetic apparatus size (NGL and LAI) and its duration (LAD).
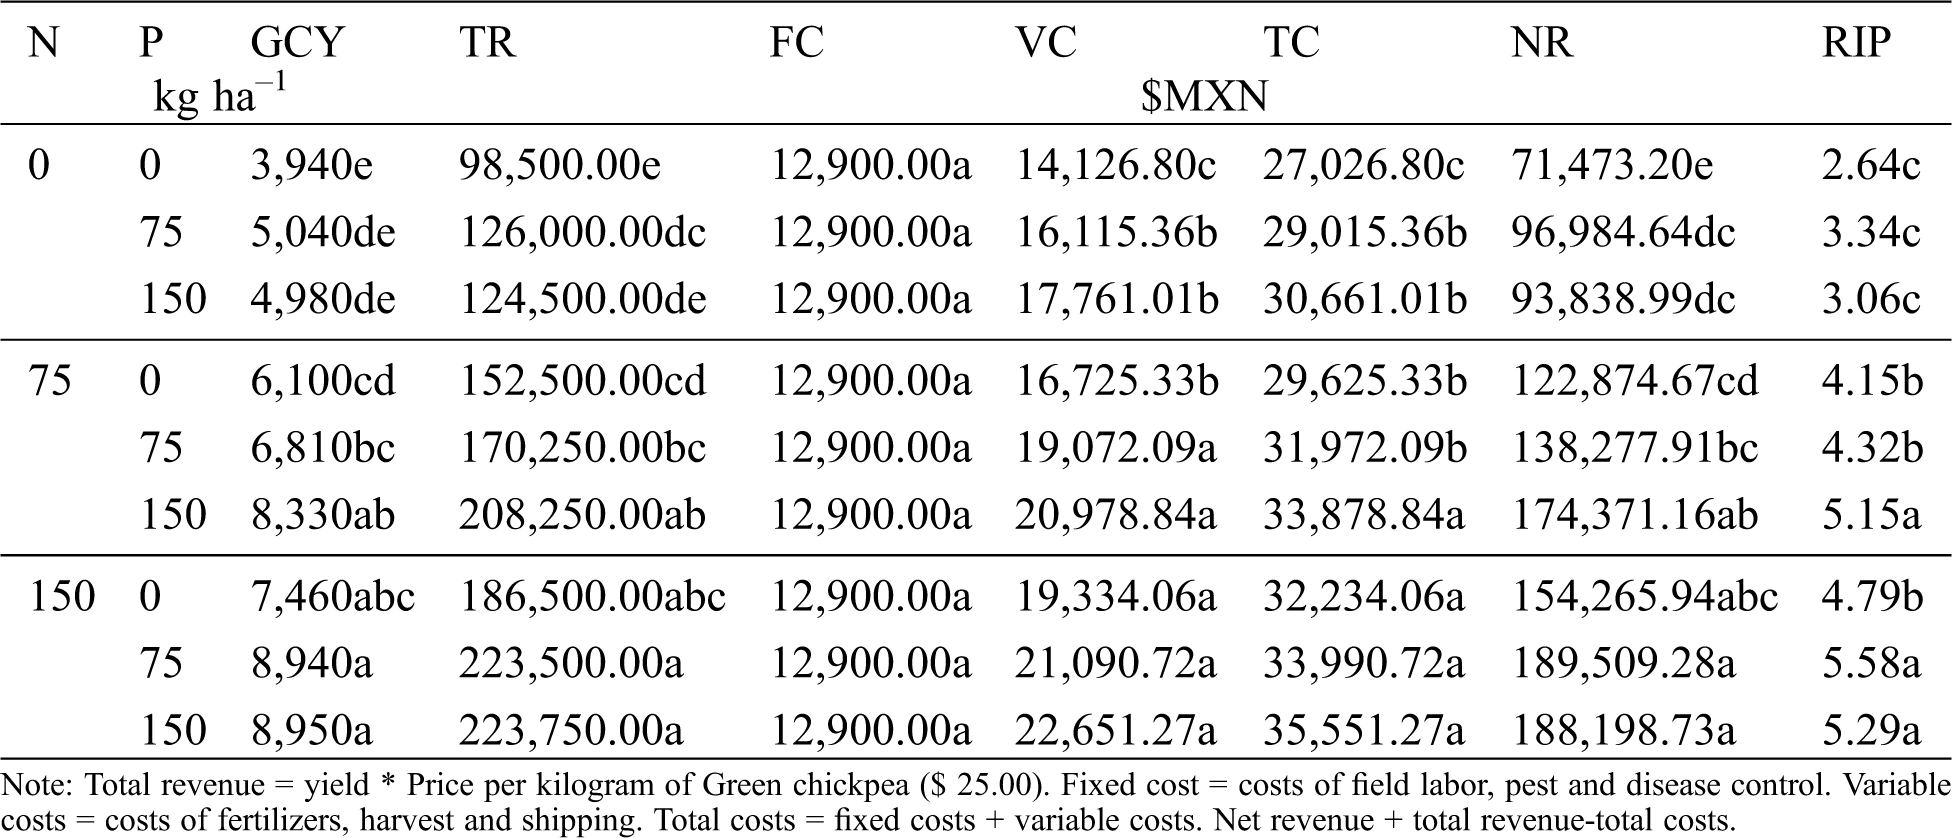
The economic analysis for green chickpea yield (GCY) is shown in Tab. 6. The highest GCY and total revenue (TR) was achieved by fertilization with the N150-P150 treatment. However, this level of fertilization had the highest variable (VC) and total (TC) costs, and net revenue (NR) was $1,310.55 lower than the NR for the N150-P75 treatment. Revenue per invested peso (RIP) varied from $2.64 to $5.58, and the highest RIP was obtained with the N150-P75 treatment. Other researchers report the highest yield occurs when the highest nitrogen dose is used (100 kg ha–1) for chickpea [15]. Treatments without added nitrogen had the lowest RIP; increments on phosphorus dose reduce RIP. The yield increments in chickpea caused by phosphorus-only fertilization are not enough to amortize the cost of fertilizers.
Table 6: Green chickpea yield (GCY), total income (TR), fixed costs (FC), variable costs (VC), total costs (TC), net income (NR), and revenue per invested peso (RIP) in response to nitrogen (N) and phosphorous (P) fertilization. Huitzuco, Gro. Summer 2017
Fertilization with nitrogen and phosphorus has no effect on timing of phenology stages among treatments. However, it improved net assimilation rate and increased of number of green leaves, leaf area index, leaf area duration, green chickpea yield and number of pods. Nitrogen has bigger effects than phosphorus on those variables. The nitrogen and phosphorus combinations that improve growth and increase green chickpea production are N150-P75 and N150-P150. The highest net revenue and revenue per invested peso is achieved with N150-P75.
Funding Statement: The authors received no specific funding for this study.
Conflicts of Interest: The authors declare that they have no conflicts of interest to report regarding the present study.
1. FAOSTAT (2020). World chickpea production. http:www.faostat.fao.org. [Google Scholar]
2. SIAP (2020). Avance de siembras y cosechas. http://www.siap.gob.mx. [Google Scholar]
3. Montenegro, F. C., Fernández, D. J. Y., Hernández, P. (2011). Descripción de seis nuevas líneas de garbanzo (Cicer arietinum L.) en fincas de productores. Cultivos Tropicales, 32(1), 44–48. [Google Scholar]
4. Muy-Rangel, M. D., Verdugo-Perales, M., Osuna-Enciso, T., Báez-Sañudo., M. A., Heredia, J. B. et al. (2011). Caracterización del garbanzo verde (Cicer arietinum L.) y tecnologías postcosecha para mantener su calidad. Revista Chapingo Serie Horticultura, 17(1), 39–45. DOI 10.5154/r.rchsh.2011.17.006. [Google Scholar] [CrossRef]
5. Urzua, H., Barrales, L., Faguenbaum, H., Gálvez, M., Ormazabal, R. et al. (2003). Fertilización nitrogenada de porotos verdes para uso agroindustrial en la zona central de chile: Indicaciones preliminares. Ciencia e Investigación Agraria, 30(1), 57–60. DOI 10.7764/rcia.v30i1.1324. [Google Scholar] [CrossRef]
6. Fageria, N. K., Baligar, V. C. (2005). Enhancing nitrogen use efficiency in crop plants. Advances in Agronomy, 88(1), 97–185. DOI 10.1016/S0065-2113(05)88004-6. [Google Scholar] [CrossRef]
7. Cárdenas, N. R., Sánchez, J. M. Y., Farías, R. R., Peña, C. J. J. (2004). Los aportes de nitrógeno y fósforo en la agricultura. Revista Chapingo Serie Horticultura, 10(2), 173–178. DOI 10.5154/r.rchsh.2002.07.039. [Google Scholar] [CrossRef]
8. Apáez, B. P., Escalante, E. J. A., Rodríguez, G. M. T. (2011). Growth and yield of cowpea bean in relation with trellises types and climate. Tropical and Subtropical Agroecosystems, 13(3), 307–315. [Google Scholar]
9. Escalante, E. J. A., Rodríguez, G. M. T., Escalante, E. Y. I. (2014). Tasa de crecimiento de biomasa y rendimiento de frijol en función del nitrógeno. Ciencia y Tecnología Agropecuaria, 2(1), 1–8. [Google Scholar]
10. Escalante, E. J. A., Rodríguez, G. M. T. (2011). Biomasa y rendimiento de haba en función de la densidad de población, nitrógeno y fósforo. Ciencias Agrícolas Informa, 20(1), 16–25. [Google Scholar]
11. Escalante, E. J. A., Kohashi, S. J. (2015). El rendimiento y crecimiento del frijol. Manual para la toma de datos. México: Colegio de Postgraduados. [Google Scholar]
12. SNIIM (2020). National system of information and market integration. Grain and seed prices. http://www.economia-sniim.gob.mx. [Google Scholar]
13. Apáez, B. P., Escalante, E. J. A., Ramírez, V. P., Koch, O. S. D., Sosa, M. E. et al. (2013). Eficiencia agronómica del nitrógeno y fósforo en la producción de frijol chino en espaldera de maíz. Terra Latinoamericana, 31(4), 285–293. [Google Scholar]
14. SNIIM (2020). National system of information and market integration. Biweekly report of fertilizer prices. http://www.economia-sniim.gob.mx. [Google Scholar]
15. Apáez, B. M., Escalante, E. J. A. S., Rodríguez, G. M. T., Apáez, B. P. (2016). Distancia entre hileras, nitrógeno y producción de garbanzo en humedad residual. Revista Mexicana de Ciencias Agrícolas, 7(2), 223–234. [Google Scholar]
16. García, E. (2005). Modificación al sistema de clasificación climática de Köppen. México: Universidad Autónoma de México. [Google Scholar]
17. Padilla, V. I., Ramón, I., Valenzuela, V. C. M., Armenta, C. R. A., Salinas, P. E. (2008). Comportamiento Agronómico de Genotipos de Garbanzo en Siembra Tardía en el Valle del Mayo, Sonora, México. Revista Fitotecnia Mexicana, 31(1), 43–49. [Google Scholar]
18. SAS Institute (2017). SAS/STAT user’s guide release. 9.1 ed. Cary, NC, USA: Statistical Analysis System Institute. [Google Scholar]
19. CIMMYT (1998). La formulación de recomendaciones a partir de datos agronómicos: un manual metodológico de evaluación económica. México: CIMMYT. [Google Scholar]
20. Bejiga, G., van der Maesen, L. J. G. (2006). Cicer arietinum L. In: Brink, M., Belay, G. (eds.Plant resources of tropical Africa 1: Cereals and pulses. Wageningen/Blackhuys, pp. 42–46. Leiden/CTA, Netherlands: Prota Foundation. [Google Scholar]
21. Abayomi, Y. A., Ajibade, T. V., Sammuel, O. F., Saadudeen, B. F. (2008). Growth and yield responses of cowpea (Vigna unguiculata (L.) Walp) genotypes to nitrogen fertilizer (NPK) application in the Southern Guinea Savanna zone of Nigeria. Asian Journal of Plant Sciences, 7(2), 170–176. DOI 10.3923/ajps.2008.170.176. [Google Scholar] [CrossRef]
22. Caliskan, S., Ozkaya, I., Caliskan, M. E., Arslan, M. (2008). The effect of nitrogen and iron fertilization on growth, yield, and fertilizer use efficiency of soybean in Mediterranean type soil. Field Crops Research, 108(1), 126–132. DOI 10.1016/j.fcr.2008.04.005. [Google Scholar] [CrossRef]
23. Olivera, M., Tejera, N., Iribarne, C., Ocana, A., Lluch, C. (2004). Growth, nitrogen fixation and ammonium assimilation in common bean (Phaseolus vulgaris L.Effect of phosphorus. Physiologia Plantarum, 121(1), 498–505. DOI 10.1111/j.0031-9317.2004.00355.x. [Google Scholar] [CrossRef]
24. Muhammad, I. C., Adu-Gyamfi, J. J., Saneoka, H., Tran, N. N., Suwa, R. et al. (2008). The effect of phosphorus deficiency on nutrient uptake, nitrogen fixation and photosynthetic rate in mashbean, mungbean and soybean. Acta Physiologiae Plantarum, 30(1), 537–544. DOI 10.1007/s11738-008-0152-8. [Google Scholar] [CrossRef]
25. Apáez, B. P., Escalante, E. J. A. S., Rodríguez, G. M. T., González, C. M. C., Apáez, B. M. (2014). Analysis of cowpea growth and production in maize trellis with nitrogen and phosphorus. International Journal of AgriScience, 4(2), 102–108. [Google Scholar]
26. Namvar, A., Seyed, S. R., Sedghi, M., Asghari, Z. R., Khandan, T. et al. (2011). Study on the effects of organic and inorganic nitrogen fertilizer on yield, yield components, and nodulation state of chickpea (Cicer arietinum L.). Communications in Soil Science and Plant Analysis, 42(9), 1097–1109. DOI 10.1080/00103624.2011.562587. [Google Scholar] [CrossRef]
27. Guadarrama, Q. A., Escalante, E. J. A., Rodríguez, G. M. T., Sánchez, G. P., Sandoval, C. E. (2007). Biomasa, proteína, taninos y rendimiento de haba en función del nitrógeno. Terra Latinoamericana, 25(2), 169–175. [Google Scholar]
28. Walley, F. L., Kyei-Boahen, S., Hnatowich, G., Stevenson, C. (2005). Nitrogen and phosphorus fertility management for desi and kabuli chickpea. Canadian Journal of Plant Science, 85(1), 73–79. DOI 10.4141/P04-039. [Google Scholar] [CrossRef]
29. Fageria, N. K., Baligar, V. C., Moreira, A., Portes, T. A. (2010). Dry bean genotypes evaluation for growth, yield components and phosphorus use efficiency. Journal of Plant Nutrition, 33(14), 2167–2181. DOI 10.1080/01904167.2010.519089. [Google Scholar] [CrossRef]
30. Lynch, J. P., Ho, M. (2005). Rhizoeconomics: Carbon costs of phosphorus acquisition. Plant and Soil, 269(1), 45–56. DOI 10.1007/s11104-004-1096-4. [Google Scholar] [CrossRef]
 | This work is licensed under a Creative Commons Attribution 4.0 International License, which permits unrestricted use, distribution, and reproduction in any medium, provided the original work is properly cited. |