International Journal of
Experimental Botany
| Phyton- International Journal of Experimental Botany |
DOI: 10.32604/phyton.2021.015087
ARTICLE
Photodegradation and Removal of Diclofenac by the Green Alga Nannochloropsis oculata
Facultad de Ciencias Químicas, Universidad Autónoma de San Luis Potosí, San Luis Potosí, 78210, México
*Corresponding Author: Ruth Elena Soria-Guerra. Email: ruth.soria@uaslp.mx
Received: 20 November 2020; Accepted: 20 February 2021
#These authors contributed equally to this work
Abstract: The emerging contaminants (ECs) are organic compounds including pharmaceuticals. These products are consumed in large quantities, favoring their continuous entrance to the environment and affecting the health of living beings. Diclofenac is a non-steroidal anti-inflammatory drug with analgesic properties of prolonged release. It is the commonest postoperative analgesic, and it is highly consumed without prescription. In recent years, the capability of microalgae to remove pharmaceuticals in water has been tested as a promising tool. In this work, the removal efficiency of diclofenac (16 µg/mL) by the microalga Nannochloropsis oculata CCAP 186/7 was evaluated. The major nutrient concentrations in Bold’s Basal Medium were modified (nitrogen and carbon: 50 and 100% of their original concentration) to know their effect in the removal of diclofenac. Drug degradation by light was also evaluated. The maximum removal capacity of diclofenac in the medium was 68.8%. The percentage of diclofenac adsorbed on the cell wall was between 6 and 12.7%. Around 23.6% of diclofenac was degraded by light after 18 days. N. oculata did not show growth inhibition due to the presence of diclofenac. The results obtained point to the promissory application of N. oculata as a bioremediation system for diclofenac removal.
Keywords: Adsorption; emerging contaminants; microalgae; pharmaceuticals; phycoremediation; photodegradation
Since the early eighties, many studies have shown that emerging contaminants (ECs) and their transformation products are present in aquatic environments worldwide [1–4]. ECs include pharmaceuticals, personal care products and pesticides, among others [5–6]. Within ECs, the pharmaceutically active compounds (PhACs) are of major concern. Although their environmental concentrations are usually very low, this kind of ECs represent a risk to both human health and the environment since they are not completely assimilated by the organism and are excreted with urine and fecal matter either as intact substances and metabolites.
The non-steroidal anti-inflammatory drugs (NSAIDs) have been found at concentrations of 5 ng/L to 4.1 μg/L in samples of wastewater (WW), sewage sludge from urban wastewater treatment plants (WWTPs), surface water, groundwater, and drinking water [7,8]. One of the most widely used NSAIDs is diclofenac, which has anti-inflammatory, analgesic, and antipyretic properties; it is fast absorbed by the duodenum, with a plasma half-life that oscillates around 2 h, and it is over the counter [9,10].
Diclofenac has negative effects such as impaired kidney function and necrosis in gill cells; it has been found accumulated in liver, kidneys, gills, and muscle tissue of fish [11,12]. The death of vultures of the genus Gyps associated with kidney failure in South Asia and Africa has been reported due to the ingestion of remains contaminated with diclofenac; the drug was detected in concentrations ranging from 0.051 to 0.643 μg/L in kidneys of these vultures [13].
Due to the deficiency in conventional WWTPs to remove diclofenac, alternative strategies need to be implemented to improve water quality; since it returns to the environment, it can be incorporated into the food chain, generating toxic effects even at low environmental concentrations [14,15]. A viable alternative for NSAIDs removal and other drugs is the phycoremediation, which comprise the use of macroalgae, microalgae and cyanobacteria for the removal of nutrients and xenobiotics from wastewater and carbon dioxide from the air [16]. Microalgae-mediated bioremediation of ECs has gained attention in recent years, due to its ability to convert CO2 into biomass assimilating large amounts of inorganic nutrients (e.g., phosphorus and nitrogen). Furthermore, relatively small amounts of operational inputs are required. Therefore, the use of algae is a sustainable and environmentally friendly technology [17–19].
Microalgae have a great flexibility to grow and survive under extreme environments; their metabolism can change between autotrophic and heterotrophic depending on the carbon sources and nutrients in the environment; it has been proposed that this adaptability makes them great candidates for removal of ECs [20–22].
The mechanisms for ECs removal by microalgae include bioaccumulation, bioadsorption, and intracellular and extracellular biodegradation. Moreover, photolysis plays an important role in the elimination process of some pharmaceuticals [14,23,24]. Several microalgae species have been employed for diclofenac removal, including Chlorella sorokiniana, Chlorella vulgaris, Chlorella pyrenoidosa, Chlamydomonas reinhardtii, and Scenedesmus obliquus. These species have been evaluated in axenic cultures in different growing conditions; diclofenac removal percentages achieved by these microalgae were up to 79% in batch experiments [3,25,26].
Nannochloropsis is one of the commonest green algae found in different types of water systems; this genus has high photosynthetic efficiency and growth rate, good environmental adaptability, contamination resistance, and it is able to growth mixotrophically [27]. In recent years, some studies have been carried out with Nannochloropsis sp. in bioremediation processes for the elimination of PhACs (i.e., trimethoprim, sulfamethoxazole, carbamazepine, ciprofloxacin, and triclosan) in water, obtaining removal percentages from 60 to 100% [28,29]. Yoshida et al. [30] demonstrated the capacity of formaldehyde removal by the strain N. oculata ST-3, which was able to degrade 99.3% of formaldehyde from the medium at a concentration of 19.9 μg/mL. It has been proposed that the diclofenac can be taken up by microalgae as a carbon source [25,31,32].
The present study focuses on the evaluation of diclofenac removal from the growth media, considering adsorption of the drug to the cell wall and photodegradation. Diclofenac removal was evaluated modifying the initial concentrations of two macronutrients (C and N applied each to 50 or 100% of their original composition) to know if their deficit generates greater drug removal. Therefore, the objective of this work was to determine the ability of N. oculata to remove diclofenac from the modified culture medium.
2.1 Microalgae Cultivation and Inoculum Preparation
The freshwater microalga Nannochloropsis oculata CCAP 846/7 was obtained from the Autonomous University of Aguascalientes, México. To maintain the stock culture, the microalga was inoculated into 100 mL of the Bold’s Basal Medium (BBM) in sterile conditions at a volume ratio of 10% (Vinoculum/Vmedium). The flask was stirred at 80 rpm and kept at 25°C for two weeks under a photoperiod of 16 h light and 8 h dark. The culture was grown under fluorescent lamps with an intensity of 150 µmol of photons per m2 per second.
The microalga was cultivated until the exponential phase was reached and the absorbance adjusted at 0.2 AU at a wavelength of 750 nm using a GloMax®-MultiMicroplate Reader (PromegaCorporation, Madison, WI, USA) to generate the inoculum for further experiments.
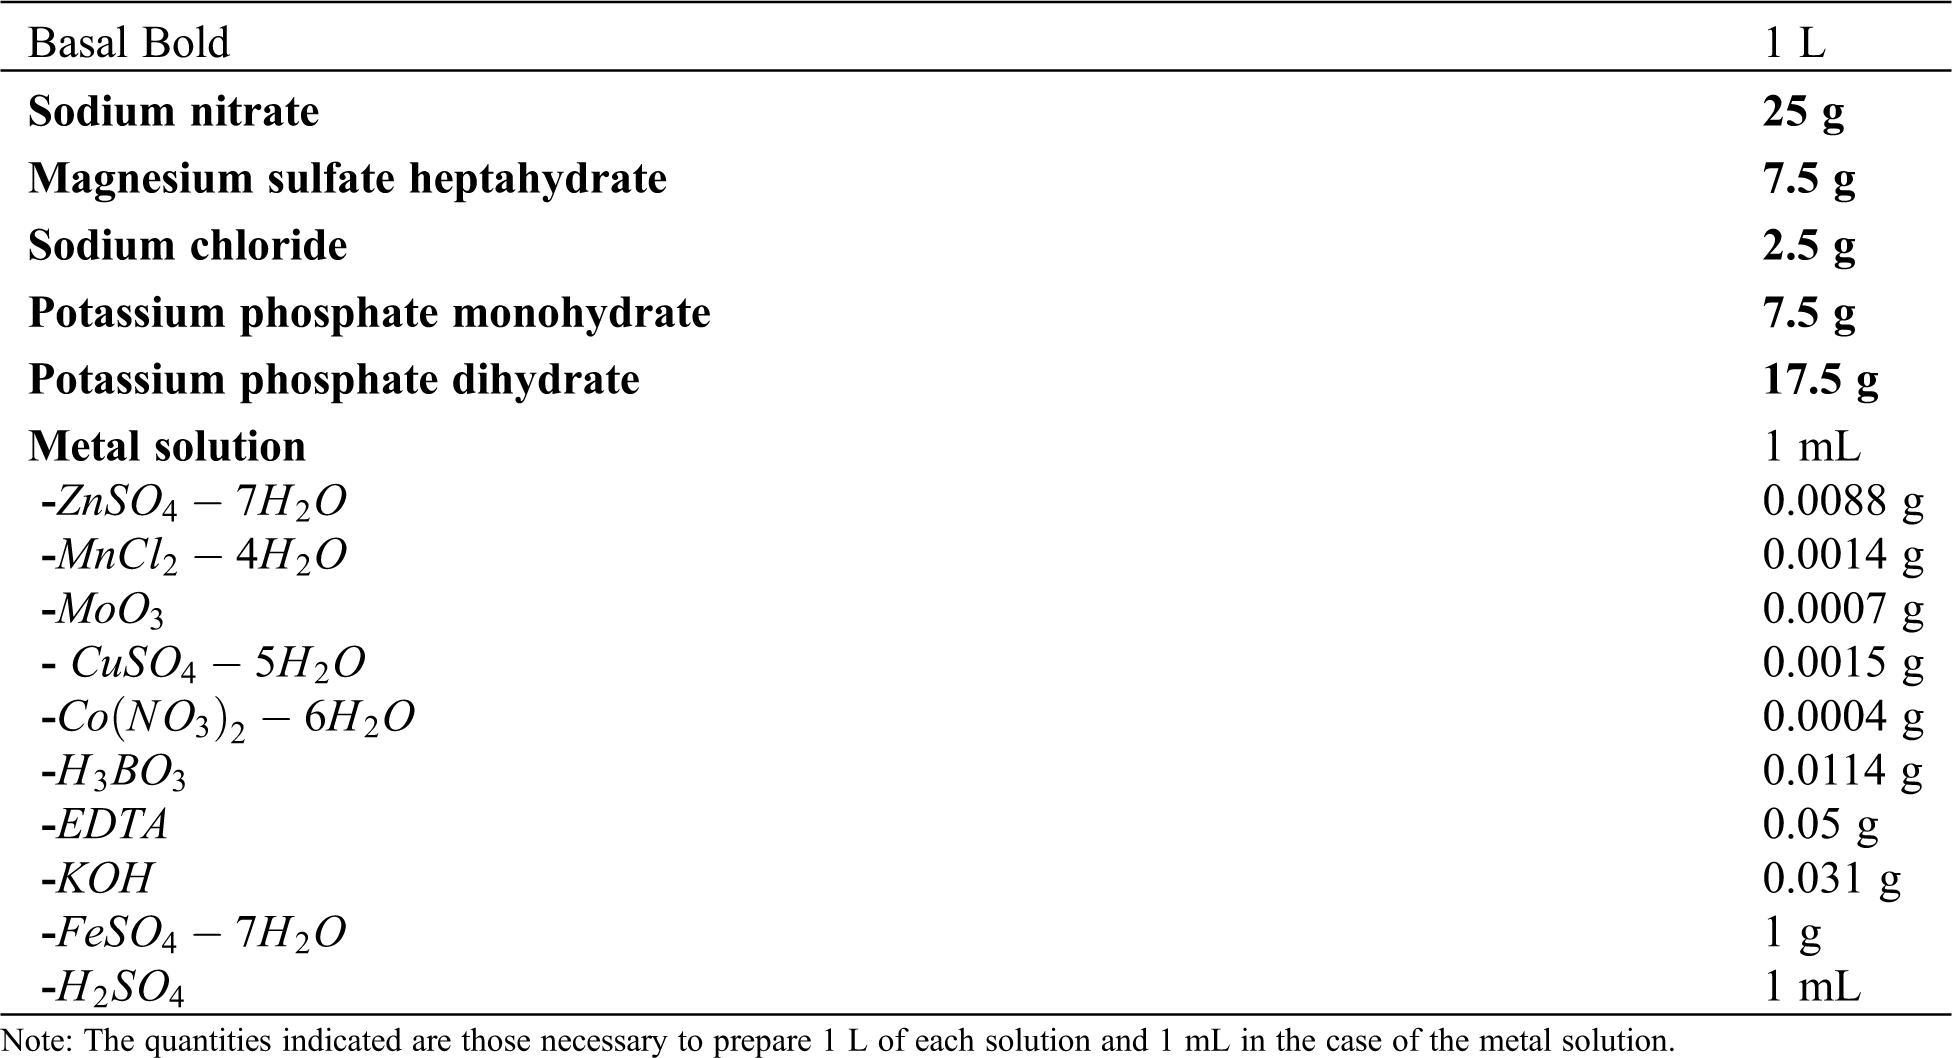
Batch experiments were performed by modifying the initial concentration of two nutrients to 50 and 100%. These nutrients were nitrogen (as NaNO3, the main source of nitrogen) of Bold’s Basal medium (BBM, composition in Tab. S1 of the Supplementary Material) and carbon. As the BBM does not contain a carbon source, the inorganic carbon source (CO2) was supplied by aeration. The inoculum used was described in Section 2.1. The experiments carried out were: A) N. oculata grown with 50% of nitrogen and 100% of carbon (N50 C100), B) N. oculata grown with 100% of nitrogen and 50% of carbon (N100 C50), and C) N. oculata grown with complete medium (100% of nitrogen and 100% of carbon, N100 C100); each condition was run in triplicate. A standard solution of diclofenac sodium salt (Sigma–Aldrich, St. Louis, MO, USA) was prepared at a concentration of 250 µg/mL, diluted in 3 mL of ethanol, and supplemented with distilled water to obtain the desired concentration. The necessary volume of the diclofenac standard solution was added to the flasks to reach the initial concentration of 16 µg/mL. The flasks were stirred at 80 rpm and kept at 25°C under a photoperiod of 16 h light and 8 h dark. The culture was grown under fluorescent lamps with an intensity of 150 µmol of photons per m2 per second. A control for each experiment was carried out under the same conditions but without diclofenac. These experiments were performed in 125 mL Erlenmeyer flasks containing 70 mL of culture medium that were inoculated with 10% of a microalgal cell suspension (Vinoculum/Vmedium) and closed with sterile cotton-wool stoppers. The carbon supply, agitation, and aeration were kept constant by an air diffusion system designed with plastic hoses connected to an air pump set to 2.2 L/min. The uniformity of the airflow was controlled by flow-regulating valves of 0.25 in.
From each Erlenmeyer flask, a sample of 2.5 mL was withdrawn every 48 h to determine cell concentration of N. oculata, chlorophyll a concentration, and diclofenac concentration using HPLC analysis. All batches were run until the algal growth curves reached the stationary phase.
The diclofenac concentration was previously established by a phycotoxicity test where different concentrations of diclofenac were evaluated independently for N. oculata CCAP 846/7 in BBM media, selecting the concentration that induced the greatest growth (data not shown).
2.3 Determination of Cell Growth and Chlorophyll a
The N. oculata CCAP 846/7 growth was monitored by counting cell density in a Neubauer chamber. The specific growth rate (μ) was calculated as described by Zhu et al. [33].
Chlorophyll a was measured by a previously established methodology with some modifications [34]. Briefly, 1 mL of culture was harvested by centrifugation at 13,000 rpm for 5 min. The supernatant was discarded, and the pellet was re-suspended in 1 mL of methanol, sonicated at 50% amplitude for 60 s (Ultrasonic Processor GEX 130, CT, USA), and incubated at 4°C for 24 h under dark conditions; afterwards, the samples were centrifuged again for 5 min at 13,000 rpm. The absorbance of the supernatant was registered at 652, 665, and 750 nm using a UV-visible spectrophotometer (Jenway™ 6705, Cole-Palmer, OSA, UK). Chlorophyll a concentration of each sample was calculated by the equation described by Porra et al. [35].
2.4 Diclofenac Removal by N. oculata
To measure diclofenac removal in the culture medium, 1 mL of the microalgal samples withdrawn every 48 h was centrifuged at 13,000 rpm for 5 min; the supernatant was transferred to a new tube and evaporated (Vacufuge Plus, Eppendorf, HH, DE) at 30°C for 3 h. Afterwards, the pellet obtained was resuspended in 500 µL of 100% ethanol and sonicated at 50% amplitude for 15 s. Following centrifugation (13,000 rpm for 5 min), the supernatant was removed, completely evaporated, and stored at room temperature until further use.
The samples were resuspended in 500 μL of 100% ethanol and analyzed in a High-Resolution Liquid Chromatography (HPLC) equipment (Agilent 1260 Infinity) coupled to a diode array detector (DAD) (Santa Clara, CA, USA).
A column packed with hydrophobic spherical silica (Agilent, Eclipse XDB C-18) was used. A volume of 20 µL of sample or standard was injected into the column fed with a 0.1% trifluoroacetic acid (TFA) aqueous solution (mobile phase A). An acetonitrile gradient was generated using 0.1% TFA in acetonitrile (mobile phase B) from 0 to 100% in a period of 10 min. A calibration curve was elaborated at diclofenac (Sigma–Aldrich, St. Louis, MO, USA) concentrations of 1, 2, 5, 10, and 20 µg/mL.
2.5 Bioadsorption of Diclofenac
In order to evaluate the amount of diclofenac adsorbed on the cell wall of N. oculata CCAP 846/7, 1 mL of culture was used. The sample was centrifuged at 13,000 rpm for 5 min, the microalgae pellet obtained was dried at 70°C for 2 h and the dry weight registered. Subsequently 200 µL of 1 M NaCl was added and the sample vortexed for 5 min. The sample was centrifuged at 13,000 rpm for 5 min and the supernatant recovered. The microalgae pellet was dried again and after recording the dry weight, the washing process was repeated with 200 μL of 0.1% Tween-20 solution.
The supernatants recovered were concentrated in an evaporator for 3 h at 30°C. The resulting pellet was resuspended in 500 μL of 100% ethanol and sonicated for 15 s at a 50% amplitude; subsequently, the sample was centrifuged at 13,000 rpm for 5 min and the supernatant recovered for a final evaporation for 24 h at 70°C. Once evaporated, the sample was resuspended in 500 μL of ethanol and analyzed by HPLC as described above. This procedure was standardized for N. oculata with the addition of diclofenac.
The biomass was washed with 1 M NaCl and 0.1% Tween-20 to discriminate possible electrostatic and hydrophobic interactions between diclofenac and cell wall components. The dry weight was recorded to homogenize the 3 cultures and compare the results obtained from the concentration of adsorbed diclofenac.
The abiotic removal of diclofenac was monitored in an Erlenmeyer flask with 16 µg/mL of diclofenac in 70 mL of BBM, but without microalgal inoculum. A negative control was performed, without microalgal inoculum and without exposure to light. The cultures were kept at the same conditions of incubation mentioned above. Samples were withdrawn every 48 h and the concentration of diclofenac in the culture medium was determined by HPLC. The experiment was carried out by triplicate.
All experiments were carried out by triplicate with three biological replicates. The data obtained were analyzed by one-way analysis of variance (ANOVA) using Dunnett tests in the Minitab v.16 software. Values were considered significant for p < 0.05.
Fig. 1 shows the number of cells per mL of N. oculata CCAP 846/7 cultures exposed to an initial diclofenac concentration of 16 μg/mL and under different initial concentrations of nitrogen and carbon. Previous studies in our laboratory indicated that this concentration is not toxic for N. oculata CCAP 846/7; even more, the growth of this microalga was stimulated. As it can be observed in Fig. 1, all cultures exhibited the same growth behavior. In the case of the N50 C100 culture, lower growth was observed in both the control and diclofenac cultures (Fig. 1a). However, there was no significant difference between the control and diclofenac cultures in this treatment (Fig. 1a). After 14 days of growth in the N100 C50 culture, the number of cells/mL was significantly greater in the diclofenac than in the control culture (Fig. 1b). Also, there were no significant difference between the control and diclofenac cultures in the N100 C100 treatment (Fig. 1c). The slight decreases in growth in the control in the cultures with N100 C50 and N100 C100 (Figs. 1b and 1c) may be explained by the fact that the microalga can use the diclofenac as an additional source of organic carbon it is well known that the Nannochloropsis genus have a mixotrophic growth. It has been previously reported that the addition of some pharmaceuticals stimulated microalgae growth during batch cultures [2,25]. However, it has been reported that CO2 metabolism is strongly related to nitrogen assimilation. For this reason, since nitrogen is the limiting nutrient; it could affect the consumption of the carbon source. Due to this, it was inferred that a part of the diclofenac removed in the N50 C100 culture could be internalized and stored in vacuoles, instead of being metabolized [36]. After 16 days, the stationary phase was observed in the cultures exposed to diclofenac and in the control; optical density values (Fig. S1 in Supplementary Material) and the number of cells per milliliter remained constant.
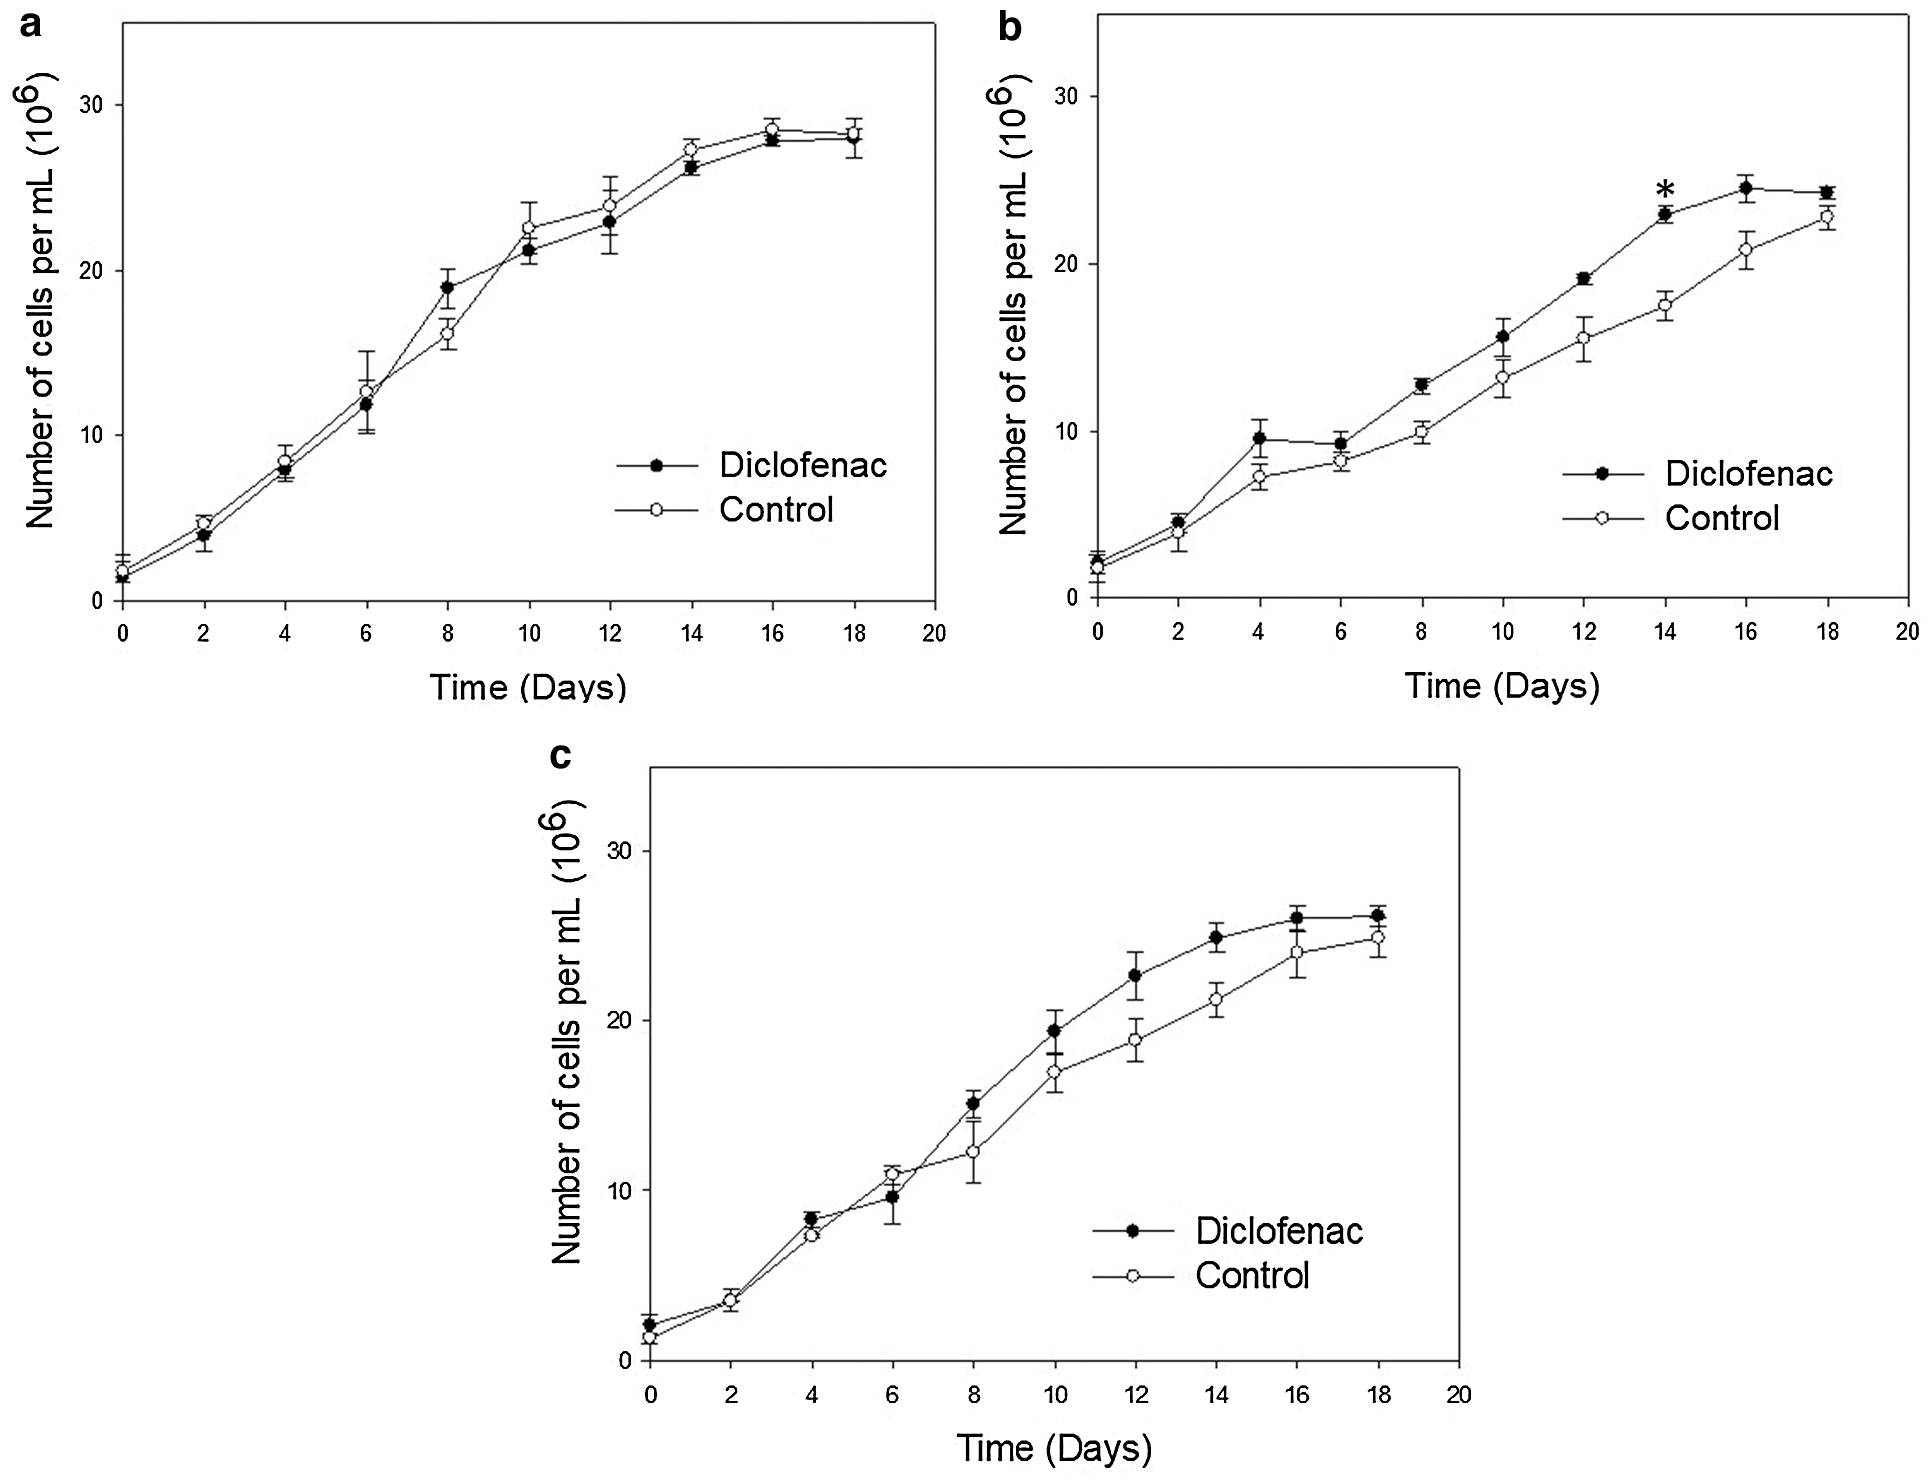
Figure 1: Growth kinetics displaying changes in number of cells per mL for N. oculata exposed to diclofenac (16 μg/mL) over time under different concentrations of nitrogen and carbon. The control cultures did not contain diclofenac. a) 50% of nitrogen and 100% of carbon (N50 C100), b) 100% of nitrogen and 50% of carbon (N100 C50), and c) 100% of nitrogen and 100% of carbon (N100 C100). Error bars indicate standard deviations. Statistically significant differences from the control are indicated by an asterisk (ANOVA, p < 0.05, Dunnett test)
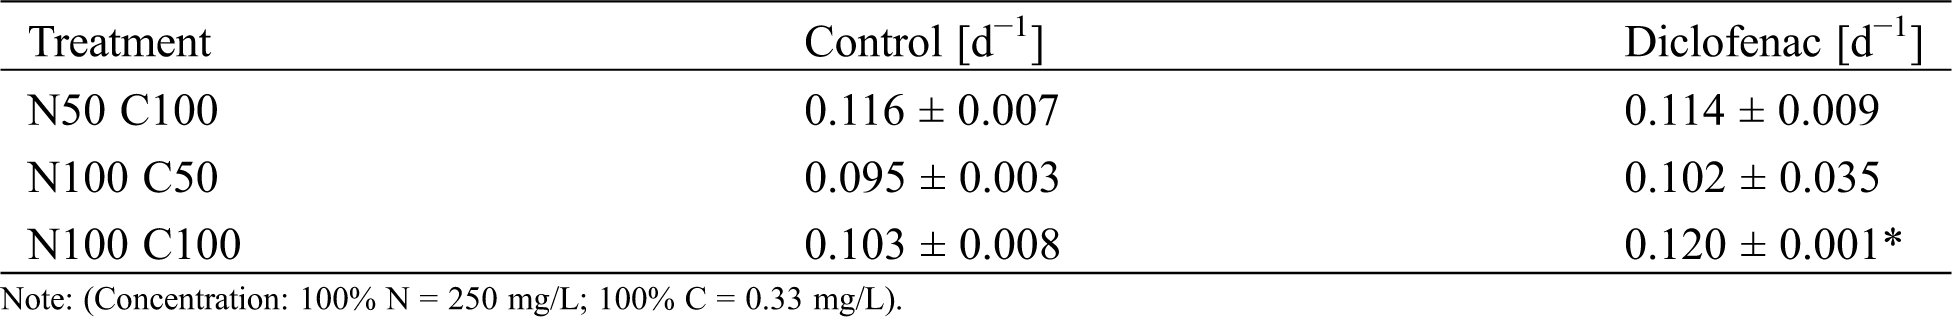
The specific growth rate (µ) for N. oculata CCAP 846/7 growing with and without diclofenac was calculated (Tab. 1); according to the results, no significant differences (p > 0.05) were detected between the controls and their corresponding treatment with diclofenac N50 C100 and N100 C50. The highest µ was reached in the treatment having N100 C100 with diclofenac.
Table 1: Specific growth rate µ [d−1] for Nannochloropsis oculata CCAP 846/7 under different concentrations of nitrogen and carbon. The control cultures did not contain diclofenac. Results are given as average value ± standard deviation. An asterisk indicates a statistically significant difference (ANOVA, p < 0.05, Tukey test)
The concentration of chlorophyll a was quantified in cultures exposed to diclofenac and controls under different nutrient conditions. As it can be seen in Fig. 2, all cultures showed accumulation of chlorophyll a during the exponential growth phase; the concentration of this pigment gradually decreased between days 8 and 14, where the beginning of the stationary phase was appreciated. These differences were attributed to the nutrient deficit, since the N100 C100 culture showed greater accumulation of chlorophyll a. According to Fig. 2, there were no significant differences in the chlorophyll a concentration in the control cultures and those with 16 μg/ mL of diclofenac; this suggests that the presence of this drug did not cause a negative effect in the pigment concentration during the growth of N. oculata CCAP 846/7. These data are in accordance with those reported by de Wilt et al. [3]; their studies using Chlorella sorokiniana indicated that the administration of a mixture of drugs (~100–350 μg/L), including diclofenac, did not produce changes in the chlorophyll a concentration. Also, Schmitt et al. [4] evaluated the phytotoxicity of diclofenac at a concentration of 50 µg/mL in Scenedesmus vacuolatus, without finding any modification in the concentration of chlorophyll a. Although it is a different genus, they showed a similar behavior.
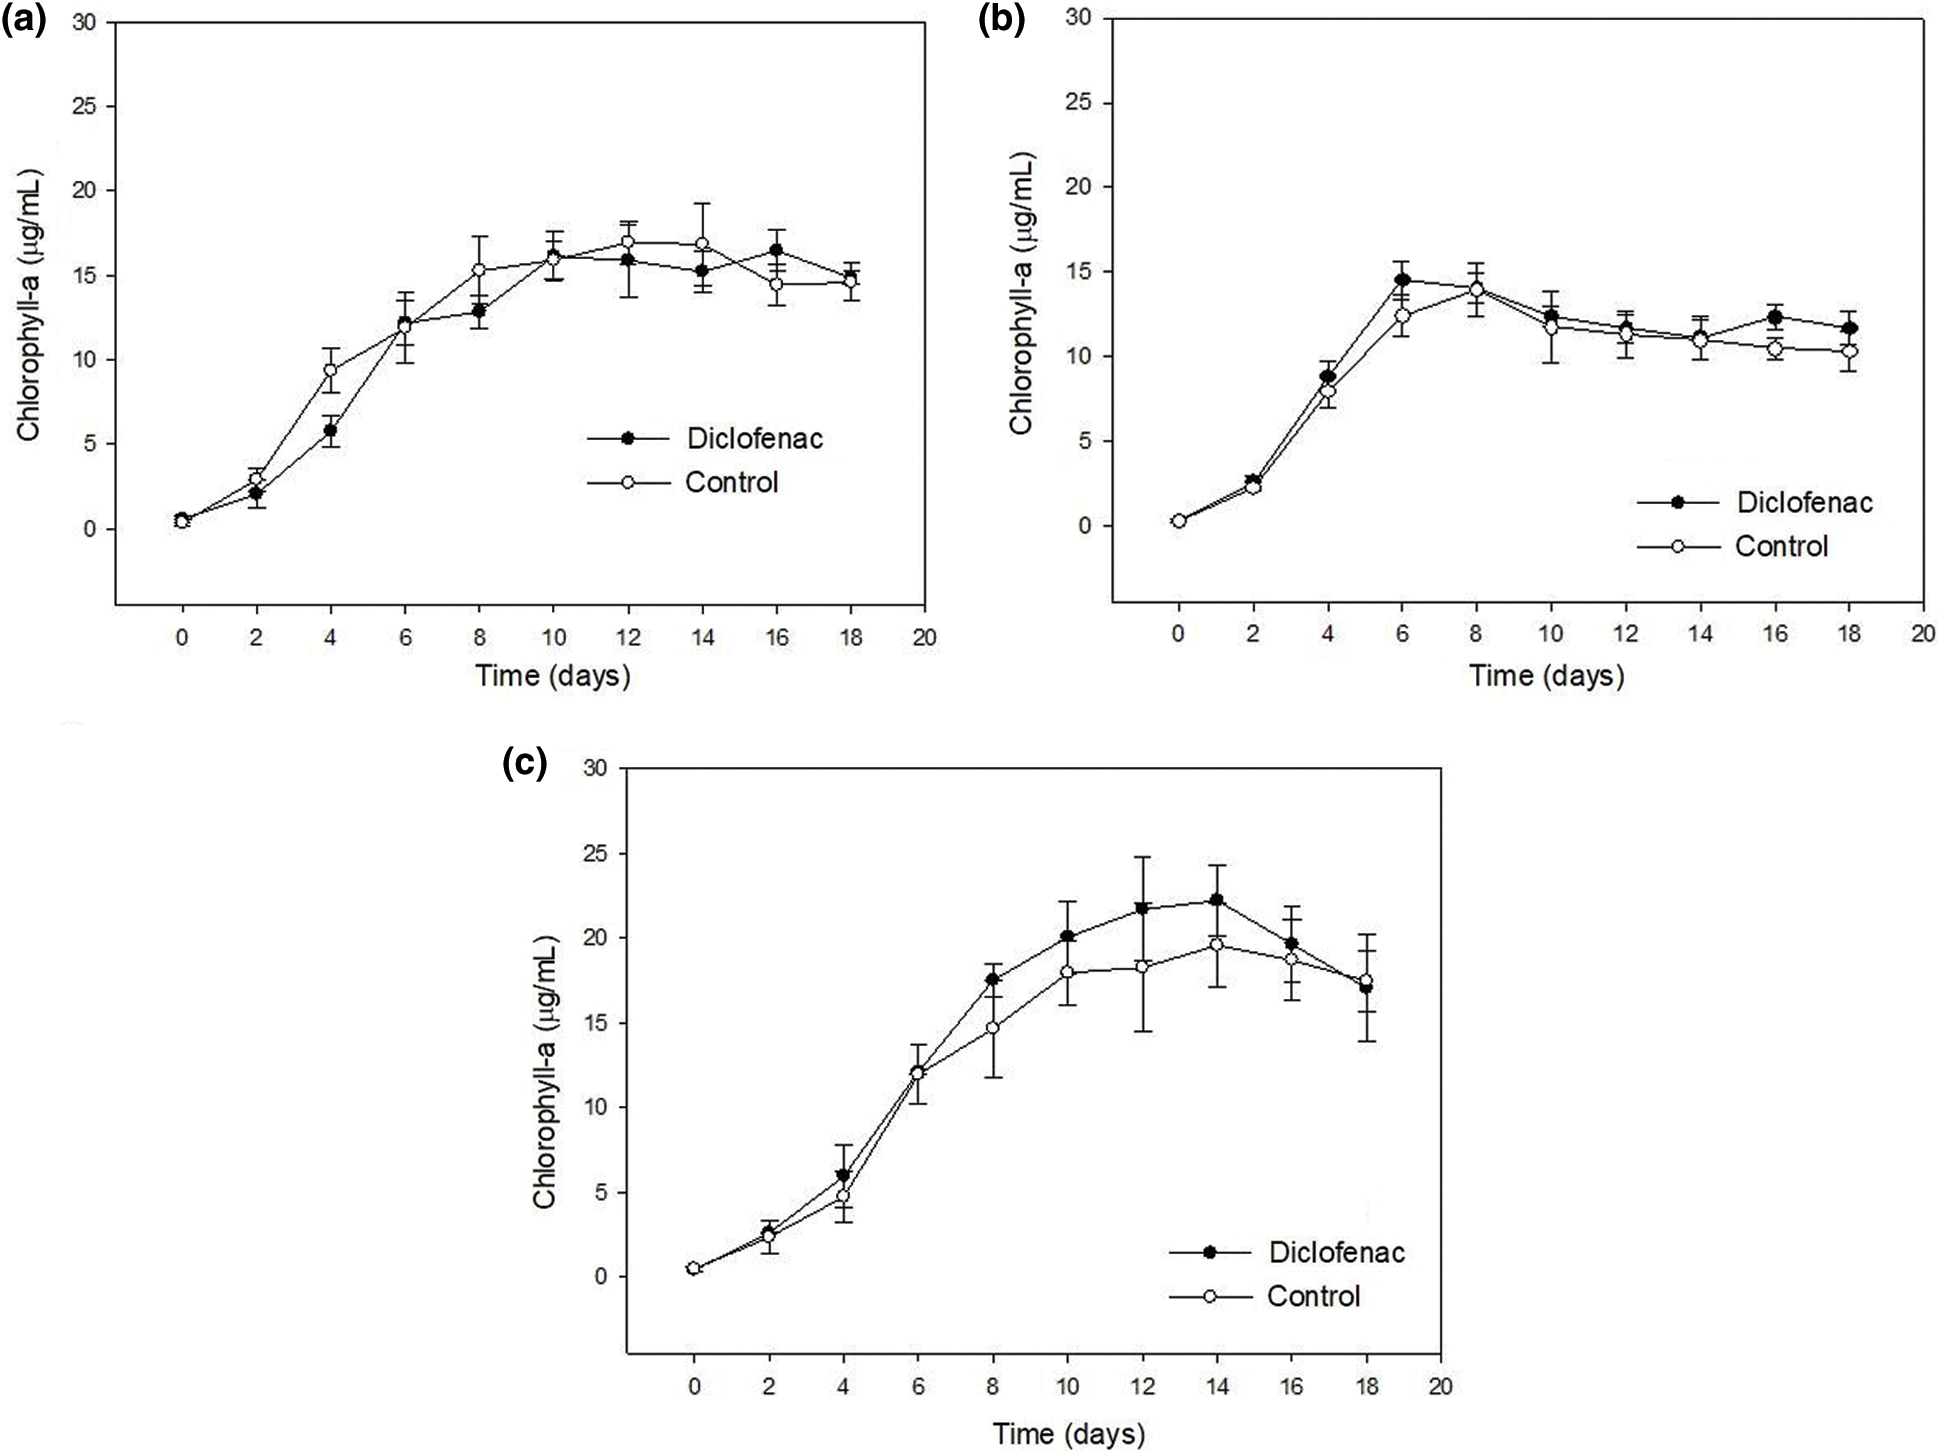
Figure 2: Chlorophyll a concentration in cultures of N. oculata CCAP 846/7 exposed to diclofenac (16 μg/mL) under different concentrations of nitrogen and carbon. The control culture did not contain diclofenac. a) N50 C100, b) N100 C50, and c) N100 C100. Error bars represent standard deviations. Statistically significant differences from the control are indicated by an asterisk (ANOVA, p < 0.05, Dunnett test)
Regarding the nutrient concentration, the culture N100 C100 (Fig. 2c) showed the highest concentration of chlorophyll a, meanwhile, the culture N100 C50 (Fig. 2b) presented the lowest concentration. This suggests that changes are occurring in the photosynthetic apparatus to adapt to the carbon deficient medium. Some authors have mentioned that carbon deficiency can cause changes in the photosynthetic apparatus, in the synthesis of carbohydrates, and in the way of capturing and fixing carbon and oxygen present in the atmosphere. In the absence of this compound there is practically no growth, or there is a limitation in productivity when the supply of this compound is deficient [37,38]. These results are not consistent with those reported by Huertas et al. [39], who evaluated the growth and accumulation of chlorophyll a in cultures of Nannochloropsis gaditana and N. maculata aerated with different concentrations of CO2. The chlorophyll a concentration during growth was similar between the control cultures (0.03% v/v CO2) and the high carbon concentration group (1% v/v CO2). However, cultures of N. maculata with low carbon concentration (<0.0001% v/v CO2) showed an increased chlorophyll a accumulation. Also has been reported that CO2-enriched aeration promotes growth of Nannochloropsis sp., obtaining a higher biomass yield in aerated cultures with a higher percentage of CO2 compared to aerated cultures with ambient CO2 levels (~0.03%) [40].
On the other hand, the culture N50 C100 (Fig. 2a) showed a decrease in chlorophyll a concentration with respect to the culture N100 C100 (Fig. 2c). These results corroborate those reported by Msanne et al. [41], who determined that cultures of C. reinhardtii deprived of nitrogen have a decrease in the concentration of chlorophyll. Furthermore, studies in Nannochloropsis sp. and Nannochloropsis oculata indicate that nitrogen restriction produces a decline in chlorophyll a concentration [42]. According to Pérez et al. [43], nitrogen is the nutrient that determines growth of microalgae since it is necessary for the fixation of CO2 in autotrophic cultures or for the assimilation of carbon in heterotrophic cultures. However, this situation does not agree with what obtained in this work where no significant differences were found between the culture with deficiency of N or C (Figs. 2a, 2b); therefore, it can be inferred that the nutrients were still in an adequate proportion to meet the requirements of this microalga.
When comparing cell density and optical density graphs with the chlorophyll a graphs, a different behavior was observed. The chlorophyll a graphs showed less growth or started their phase of decline days earlier than those corresponding to the cell and optical density graphs. This has been reported by Bolier et al. [44] in studies with microalgae where the optical density is used as a measure of growth; the OD750 values may continue to increase even though the chlorophyll concentration decreased. The relationship between cell density and the information provided by other methods, such as chlorophyll concentration, is not constant. In the case of chlorophyll a concentration it depended on the physiological state of the cells since it provided a measurement of the amount of active microalgae biomass. However, in the measurement of cell density by determining OD, some factors such as dead cells may interfere [45]. The optical density measurement is considered an indirect measurement; it can be affected by some type of contamination or dead microalgae cells, while the chlorophyll a (being the main photosynthetic pigment) is a reliable and commonly used indicator to estimate the total alive biomass of cultures.
3.2 Diclofenac Removal by N. oculata CCAP 846/7
In this study, the diclofenac removal was monitored in each batch experiment every two days; this concentration decreased over time in all treatments (Fig. 3). In the three experiments performed, the removal curves displayed a similar behavior.
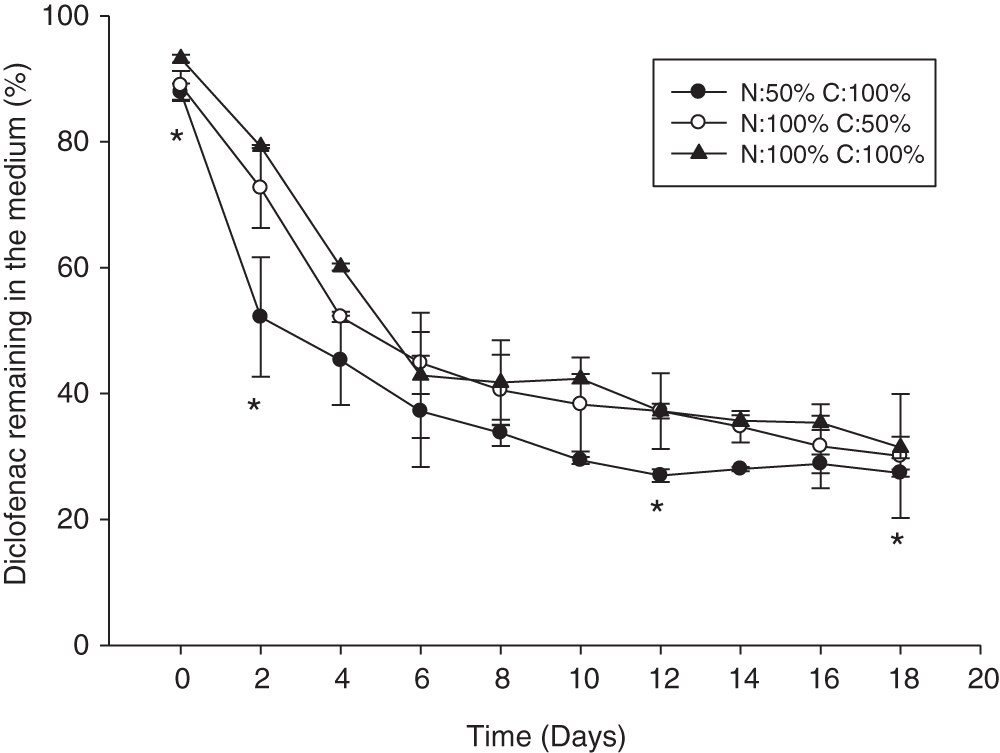
Figure 3: Percentage of diclofenac remaining in the medium during cultivation time by N. oculata CCAP 846/7. Error bars indicate standard deviations. Statistically significant differences from the control are indicated by an asterisk (ANOVA, p < 0.05, Tukey test)
The highest removal of diclofenac was observed during the first 10 days of the kinetics; afterwards, the diclofenac concentration in the medium remained relatively constant (Fig. 3). In the culture N50 C100 we observed a higher removal of the drug during all the kinetic; however, significant differences were only found in the percentage of diclofenac in the medium on days 2 and 4 when considering all experiments.
The percentage of diclofenac removal by N. oculata CCAP 846/7 obtained after 10 days ranged between 49 and 59%, while after 18 days of cultivation the final percentages of removal were between 66 and 69%. These results are similar to those reported by Escapa et al. [25], who evaluated the removal of diclofenac by three strains of microalgae in batch cultures using a photobioreactor with 250 mL of Mann and Myers medium and an initial diclofenac concentration of 25 μg/mL. At the end of the batch culture (17 days), the treatments with Chlorella sorokiniana, Chlorella vulgaris, and Scenedesmus obliquus showed removal efficiencies of 65, 69, and 98%, respectively. The authors suggested that these differences may be due to specific characteristics of the strains such as cell size.
The ability to remove a mixture of drugs (including diclofenac) by C. sorokiniana was evaluated by de Wilt et al. [3]. The microalga strain was cultivated in urine (23 days), water treated by anaerobic processes, and synthetic urine (31 days); these cultures were spiked with a mixture of drugs (diclofenac, ibuprofen, fenoprofen, trimethoprim, paracetamol, metoprolol, diaveridine, carbamazepine dihydrocarbamazepine, trimethoprim-d9, estrone, ethinylestradiol 17 β-estradiol, and 17 β-estradiol-d3) in a concentration range from 100 to 350 μg/L. At the end of the batch culture, the diclofenac removal ranged between 40 and 60%. However, similar removal percentages were observed in abiotic cultures. The authors suggested that the elimination of diclofenac could be attributed mainly to phototransformation [3].
3.3 Bioadsorption of Diclofenac by N. oculata CCAP 846/7
The bioadsorption of diclofenac by the cell wall of microalgae has been reported. Algae cell walls have a set of polymers with similarity to cellulose, pectin, hemicellulose, and lignin [23]. In this study, the concentration of diclofenac adsorbed by N. oculata was quantified every 48 h from cultures exposed to the drug (16 μg/mL) under different concentrations of nitrogen and carbon. Over the time, the percentages desorbed with 0.1% Tween-20 were higher than those using 1 M NaCl; additionally, during the first days of growth (days 0 to 4) the concentration of diclofenac adsorbed was higher than that obtained afterwards (Tab. 2). This could be due to the relationship between the concentration of the drug and that of cells of the microalga. At the first days of growth, cells had a higher concentration of the drug available in the medium. Over time, the concentration of N. oculata cells increased and that of diclofenac decreased, resulting in less adsorption of the drug. This was more evident in the experiments N50 C100 and N100 C50; in the experiment N100 C100 the amount of diclofenac desorbed remained almost constant throughout the time.
Table 2: Percentages of diclofenac desorption from Nannochloropsis oculata CCAP 846/7 biomass under different concentrations of nitrogen (N) and carbon (C) over time. Values with different letters indicate statistically significant differences in the percentage of removal between solutions for each experiment (ANOVA, p < 0.05, Tukey test)
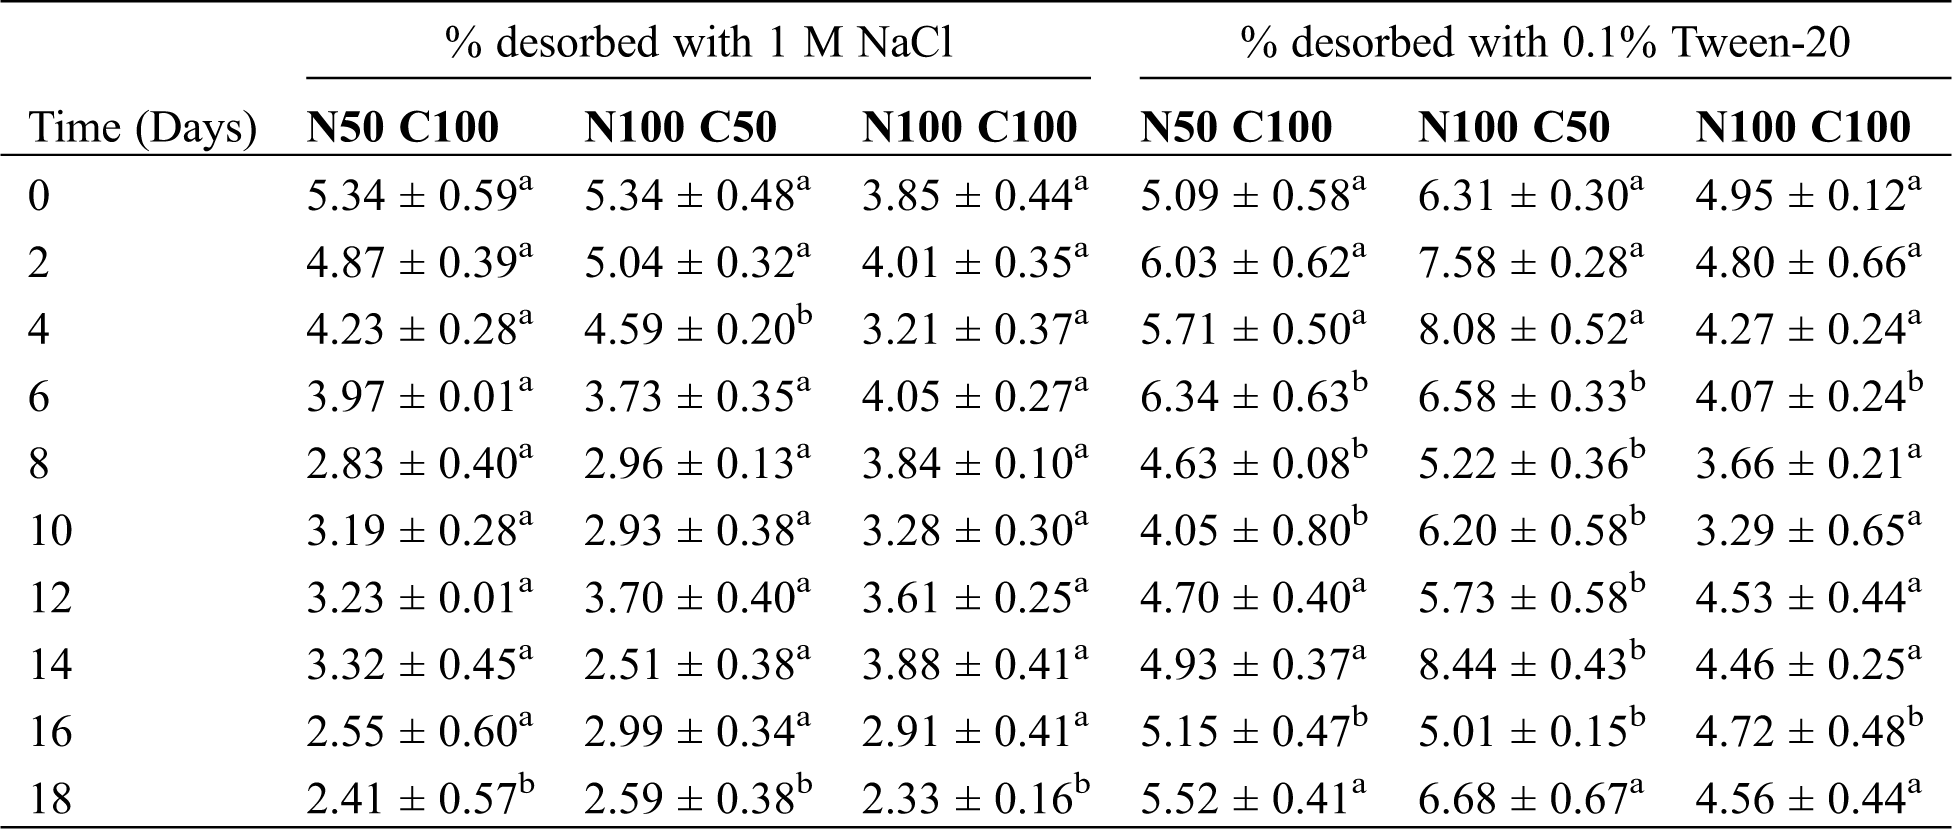
In general, the percentage of drug retained by the cell wall in relation to the initial concentration was from 6.6–12.7%; these range was obtained after washing the biomass with both solutions. These results are in agreement with those reported by de Wilt et al. [3] who evaluated the removal of a mixture of drugs by C. sorokiniana. Regarding diclofenac, the percentage adsorbed in relation to the initial concentration was 7.5 and 5.5% in urine and in anaerobically treated black water, respectively.
The adsorption process varies significantly according to the hydrophobicity, structure, and functional groups present in the contaminating compounds and on the cell surface of the microalgae. Diclofenac is a weak acid with a pKa value of 4.7 [46]. Therefore, it was negatively charged during the experiments (the initial pH of the cultures was 6.8, while it slightly diminished at the end to 6.4–6.5). Protonated diclofenac shows low water solubility [47]; this implies that it also has a hydrophobic region. The cell wall of algae has a complex constitution; specifically, in the case of N. oculata the cell wall contains highly aliphatic biopolymers called algaenans [48]. Moreover, this cell wall could contain amino acids, which were reported for N. gaditana [49]. Therefore, diclofenac could interact with the cell wall either electrostatically (by interaction with positively charged amines from basic amino acids) or hydrophobically (by interaction with algaenan).
The low percentage of diclofenac in the cell wall of N. oculata with respect to the percentage of drug removed from the culture medium suggests that other mechanisms could be participating in the remotion, including an intracellular biodegradation during which N. oculata could internalize and metabolize diclofenac in order to use it as a carbon source. There are not studies that analyze the interaction of microalgae with diclofenac on their cell wall.
3.4 Photodegradation of Diclofenac
It has been reported that diclofenac is among the drugs most susceptible to direct photolysis [24,50–51]. In this work, the removal of diclofenac via abiotic factors was also evaluated by supplying this drug into the medium without any microalgal inoculation. In the negative controls, no significant difference was found between the initial and final concentration of diclofenac. Therefore, it is inferred that drug degradation was associated to light. Fig. 4 shows the percentage of diclofenac degradation by light, which displays a decrease over the time. During the first 4 days, the drug concentration in the culture medium remained constant; however, from day 6 the concentration of diclofenac showed a continuous decrease. At day 12, 13.7% of the drug was degraded. The total percentage of diclofenac degraded was approximately 23.6% after 18 days.
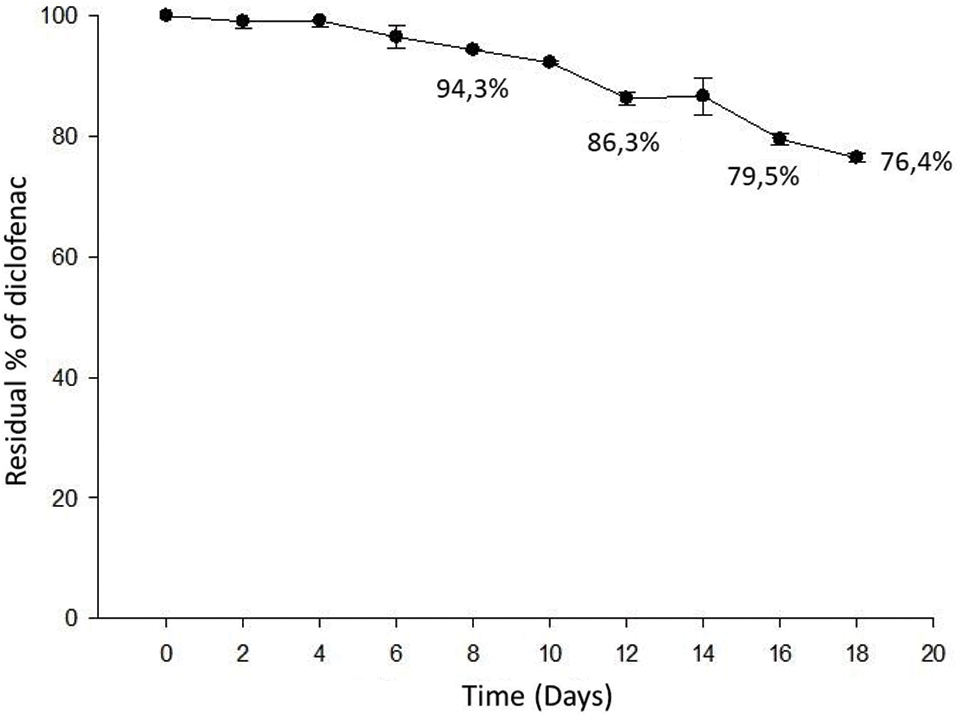
Figure 4: Photodegradation of diclofenac in an abiotic culture exposed to a photoperiod of 16 h in light and 8 h in dark for 18 days
However, this contrasts with what was reported by Ben-Ouada et al. [1]. These authors evaluated the elimination of diclofenac under similar incubation conditions to this study (they used initial concentrations of 25, 50, and 100 µg/mL) by two isolated microalgal strains, while the controls (without algae cells) served also for the determination of the diclofenac abiotic removal. Their results indicate that the abiotic removal did not exceed 8% after 5 days regardless of the initial diclofenac concentration.
The percentage of diclofenac removal in the abiotic culture obtained in the present study was lower compared to other studies where higher degradation percentages were obtained. However, this was due to the type of light used in this experiment. Generally, in photodegradation studies, compounds in solution are exposed to a source of UV light [52–54]. In addition to the type of light, Zhang et al. [52] established that the diclofenac photodegradation is reduced by the presence of nitrate ions and/or dissolved oxygen in the medium. Our studied culture medium had nitrate ions with an initial concentration of 2.94 mM.
Our results showed that diclofenac did not inhibit the growth of N. oculata CCAP 846/7 at the spiked concentration (16 µg/mL). The cultures of N. oculata CCAP 846/7 exposed to diclofenac presented an efficient removal of the drug (68.8%) in the medium, with the highest removal during the first 8 days. No statistically significant difference was found in diclofenac removal in cultures growing with complete medium and with different concentrations of nitrogen and carbon. N. oculata showed a low percentage of diclofenac adsorption at the cell wall (12.7%), suggesting that other processes are involved in the removal of the drug such as absorption. Abiotic cultures irradiated with light resulted in 23.6% of diclofenac degradation after 18 days. The results obtained point to the promissory use of N. oculata CCAP 846/7 as a bioremediation system for the removal of diclofenac; these results are expected to contribute to the knowledge on the application of microalgae for wastewater bioremediation, mainly on the removal of ECs such as pharmaceuticals.
Acknowledgement: Sincere thanks are due to Dra. Luz María Teresita Paz Maldonado from the Bioreactors Engineering Laboratory of the Autonomous University of San Luis Potosí for providing some equipment to carry out the experiments. We also thank Dr. Roberto Rico Martínez from the Autonomous University of Aguascalientes for kindly donating the microalga used in this work.
Declaration of Contributions: Sánchez-Sandoval and Navarro-Martínez performed the experimentation and drafted the manuscript. Sánchez-Sandoval, Navarro-Martínez, Castro-Tapia and González-Ortega participated in the analysis and interpretation of the data. Sánchez-Sandoval, González-Ortega and García-de la Cruz participated in the discussion of the results, reviewed and corrected the manuscript. Soria-Guerra supervised the experimentation, contributed to the drafted of the manuscript and reviewed the article for final approval.
Funding Statement: This research did not receive any specific grant from funding agencies in the public, commercial, or not-for-profit sectors.
Conflicts of Interest: The authors declare that they have no conflict of interests or personal relationships that could have appeared to influence the work reported in this paper.
1. Ben-Ouada, S., Ben-Ali, R., Cimetiere, N., Leboulanger, C., Ben-Ouada, H. et al. (2019). Biodegradation of diclofenac by two green microalgae: picocystis sp. and Graesiella sp. Ecotoxicology and Environmental Safety, 186, 109769. DOI 10.1016/j.ecoenv.2019.109769. [Google Scholar] [CrossRef]
2. Escapa, C., Coimbra, R. N., Paniagua, S., García, A. I., Otero, M. (2017). Paracetamol and salicylic acid removal from contaminated water by microalgae. Journal of Environmental Management, 203, 799–806. DOI 10.1016/j.jenvman.2016.06.051. [Google Scholar] [CrossRef]
3. de Wilt, A., Butkovskyi, A., Tuantet, K., Leal, L. H., Fernandes, T. V. et al. (2016). Micropollutant removal in an algal treatment system fed with source separated wastewater streams. Journal of Hazardous Materials, 304, 84–92. DOI 10.1016/j.jhazmat.2015.10.033. [Google Scholar] [CrossRef]
4. Schmitt, M., Bartels, P., Adler, N., Altenburger, R. (2007). Phytotoxicity assessment of diclofenac and its phototransformation products. Analytical and Bioanalytical Chemistry, 387(4), 1389–1396. DOI 10.1007/s00216-006-0825-3. [Google Scholar] [CrossRef]
5. Arnold, K. E., Boxall, A. B. A., Brown, A. R., Cuthbert, R. J., Gaw, S. et al. (2013). Assessing the exposure risk and impacts of pharmaceuticals in the environment on individuals and ecosystems. Biology Letters, 9(4), 20130492. DOI 10.1098/rsbl.2013.0492. [Google Scholar] [CrossRef]
6. Kûmmerer, K. (2008). Pharmaceuticals in the environment– a brief summary. Pharmaceuticals in the environment – Sources, fate, effects and risks. pp. 1–21. Berlin Heidelberg: Springer-Verlag, 10.1007/978-3-662-09259-0. [Google Scholar] [CrossRef]
7. Sophia, A. C., Lima, E. C. (2018). Removal of emerging contaminants from the environment by adsorption. Ecotoxicology and Environmental Safety, 150(5326), 1–17. DOI 10.1016/j.ecoenv.2017.12.026. [Google Scholar] [CrossRef]
8. Wiegel, S., Aulinger, A., Brockmeyer, R., Harms, H., Löffler, J. et al. (2004). Pharmaceuticals in the river Elbe and its tributaries. Chemosphere, 57(2), 107–126. DOI 10.1016/j.chemosphere.2004.05.017. [Google Scholar] [CrossRef]
9. Barakat, M. A. (2011). New trends in removing heavy metals from industrial wastewater. Arabian Journal of Chemistry, 4(4), 361–377. DOI 10.1016/j.arabjc.2010.07.019. [Google Scholar] [CrossRef]
10. Verlicchi, P., Al Aukidy, M., Zambello, E. (2012). Occurrence of pharmaceutical compounds in urban wastewater: removal, mass load and environmental risk after a secondary treatment–A review. Science of the Total Environment, 429, 123–155. DOI 10.1016/j.scitotenv.2012.04.028. [Google Scholar] [CrossRef]
11. Corcoran, J., Winter, M., Tyler, C. (2010). Pharmaceuticals in the aquatic environment: a critical review of the evidence for health effects in fish. Critical Reviews in Toxicology, 40(4), 287–304. DOI 10.3109/10408440903373590. [Google Scholar] [CrossRef]
12. Tanoue, R., Nomiyama, K., Nakamura, H., Kim, J. W., Isobe, T. et al. (2015). Uptake and tissue distribution of pharmaceuticals and personal care products in wild fish from treated-wastewater-impacted streams. Environmental Science & Technology, 49(19), 11649–11658. DOI 10.1021/acs.est.5b02478. [Google Scholar] [CrossRef]
13. Oaks, J., Gilbert, M., Virani, M. Z., Watson, R. T., Meteyer, C. U. et al. (2004). Diclofenac residues as the cause of vulture population decline in Pakistan. Nature, 427(6975), 630–633. DOI 10.1038/nature02317. [Google Scholar] [CrossRef]
14. Cuellar-Bermudez, S. P., Aleman-Nava, G. S., Chandra, R., Garcia-Perez, J. S., Contreras-Angulo, J. R. et al. (2017). Nutrients utilization and contaminants removal. A review of two approaches of algae and cyanobacteria in wastewater. Algal Research, 24, 438–449. DOI 10.1016/j.algal.2016.08.018. [Google Scholar] [CrossRef]
15. Xu, M., Huang, H., Li, N., Li, F., Wang, D. et al. (2019). Occurrence and ecological risk of pharmaceuticals and personal care products (PPCPs) and pesticides in typical surface watersheds, China. Ecotoxicology and Environmental Safety, 175(1–3), 289–298. DOI 10.1016/j.ecoenv.2019.01.131. [Google Scholar] [CrossRef]
16. Olguin, E. J., Sanchez-Galvan, G. (2012). Heavy metal removal in phytofiltration and phycoremediation: the need to differentiate between bioadsorption and bioaccumulation. New Biotechnology, 30(1), 3–8. DOI 10.1016/j.nbt.2012.05.020. [Google Scholar] [CrossRef]
17. Abinandan, S., Shanthakumar, S. (2015). Challenges and opportunities in application of microalgae (Chlorophyta) for wastewater treatment: a review. Renewable Sustainable Energy Reviews, 52(4), 123–132. DOI 10.1016/j.rser.2015.07.086. [Google Scholar] [CrossRef]
18. El-Sheekh, M., Farghl, A., Galal, H., Bayoumi, H. (2016). Bioremediation of different types of polluted water using microalgae. Rendiconti Lincei, 27(2), 401–410. DOI 10.1007/s12210-015-0495-1. [Google Scholar] [CrossRef]
19. Rawat, I., Kumar, R. R., Mutanda, T., Bux, F. (2011). Dual role of microalgae: Phycoremediation of domestic wastewater and biomass production for sustainable biofuels production. Applied Energy, 88(10), 3411–3424. DOI 10.1016/j.apenergy.2010.11.025. [Google Scholar] [CrossRef]
20. Subashchandrabose, S. R., Ramakrishnan, B., Megharaj, M., Venkateswarlu, K., Naidu, R. (2013). Mixotrophic cyanobacteria and microalgae as distinctive biological agents for organic pollutant degradation. Environment International, 51, 59–72. DOI 10.1016/j.envint.2012.10.007. [Google Scholar] [CrossRef]
21. Wijffels, R. H., Kruse, O., Hellingwerf, K. J. (2013). Potential of industrial biotechnology with cyanobacteria and eukaryotic microalgae. Current Opinion in Biotechnology, 24(3), 405–413. DOI 10.1016/j.copbio.2013.04.004. [Google Scholar] [CrossRef]
22. Raja, R., Hemaiswarya, S., Kumar, N. A., Sridhar, S., Rengasamy, R. (2008). A perspective on the biotechnological potential of microalgae. Critical Reviews in Microbiology, 34(2), 77–88. DOI 10.1080/10408410802086783. [Google Scholar] [CrossRef]
23. Xiong, J. Q., Kurade, M. B., Jeon, B. H. (2018). Can microalgae remove pharmaceutical contaminants from water? Trends of Biotechnology, 36(1), 30–44. DOI 10.1016/j.tibtech.2017.09.003. [Google Scholar] [CrossRef]
24. Kunkel, U., Radke, M. (2012). Fate of pharmaceuticals in rivers: deriving a benchmark dataset at favorable attenuation conditions. Water Research, 46(17), 5551–5565. DOI 10.1016/j.watres.2012.07.033. [Google Scholar] [CrossRef]
25. Escapa, C., Coimbra, R. N., Paniagua, S., García, A. I., Otero, M. (2016). Comparative assessment of diclofenac removal from water by different microalgae strains. Algal Research, 18, 127–134. DOI 10.1016/j.algal.2016.06.008. [Google Scholar] [CrossRef]
26. Zhou, G. J., Ying, G. G., Liu, S., Zhou, L. J., Chen, Z. F. et al. (2014). Simultaneous removal of inorganic and organic compounds in wastewater by freshwater green microalgae. Environmental Science Process Impacts, 16(8), 2018–2027. DOI 10.1039/C4EM00094C. [Google Scholar] [CrossRef]
27. Ma, X. N., Chen, T. P., Yang, B., Liu, J., Chen, F. (2016). Lipid production from Nannochloropsis. Marine Drugs, 14(4), 61. DOI 10.3390/md14040061. [Google Scholar] [CrossRef]
28. Bai, X., Acharya, K. (2016). Removal of trimethoprim, sulfamethoxa zole, and triclosan by the green alga Nannochloris sp. Journal of Hazardous Materials, 315, 70–75. DOI 10.1016/j.jhazmat.2016.04.067. [Google Scholar] [CrossRef]
29. Bai, X., Acharya, K. (2017). Algae-mediated removal of selected pharmaceutical and personal care products (PPCPs) from Lake Mead water. Science of the Total Environment, 581-582, 734–740. DOI 10.1016/j.scitotenv.2016.12.192. [Google Scholar] [CrossRef]
30. Yoshida, K., Ishii, H., Ishihara, Y., Saito, H., Okada, Y. (2009). Bioremediation potential of formaldehyde by the marine microalga Nannochloropsis oculata ST-3 strain. Applied Biochemistry and Biotechnology, 157(2), 321–328. DOI 10.1007/s12010-008-8314-0. [Google Scholar] [CrossRef]
31. Grandclement, C., Piram, A., Petit, M. E., Seyssiecq, I., Laffont-Schwob, I. et al. (2020). Biological removal and fate assessment of diclofenac using Bacillus subtilis and Brevibacillus laterosporus strains and ecotoxicological effects of diclofenac and 49-Hydroxy-diclofenac. Journal of Chemistry, 2020, 1–12. DOI 10.1155/2020/9789420. [Google Scholar] [CrossRef]
32. Nguyen, H. T., Yoon, Y., Ngo, H. H., Jang, A. (2020). The application of microalgae in removing organic micropollutants in wastewater. Critical Reviews in Environmental Science and Technology, 2(59), 1–34. DOI 10.1080/10643389.2020.1753633. [Google Scholar] [CrossRef]
33. Zhu, L., Wang, Z., Shu, Q., Takala, J., Hiltunen, E. et al. (2013). Nutrient removal and biodiesel production by integration of freshwater algae cultivation with piggery wastewater treatment. Water Research, 47(13), 4294–4302. DOI 10.1016/j.watres.2013.05.004. [Google Scholar] [CrossRef]
34. Henriques, M., Silva, A., Rocha, J. (2007). Extraction and quantification of pigments from a marine microalga: a simple and reproducible method. Communicating Current Research Educational Topics and Trends in Applied Microbiology, 1, 586–593. [Google Scholar]
35. Porra, R. J., Thompson, W. A., Kriedemann, P. E. (1989). Determination of accurate extinction coefficients and simultaneous equations for assaying chlorophylls a and b extracted with four different solvents: verification of the concentration of chlorophyll standards by atomic absorption spectroscopy. Biochimica et Biophysica Acta (BBA)-Bioenergetics, 975(3), 384–394. DOI 10.1016/S0005-2728(89)80347-0. [Google Scholar] [CrossRef]
36. Barajas, A. F., Godoy, C. A., Monroy, J. D., Barajas, C., Kafarov, V. (2012). Mejoramiento del secuestro del CO2 por Chlorella vulgaris UTEX, 1803 en fotobiorreactores a escala laboratorio. Revista ION, 25, 39–47. https://www.redalyc.org/articulo.oa?id=342030286005. [Google Scholar]
37. Ho, S. H., Chen, C. Y., Chang, J. S. (2012). Effect of light intensity and nitrogen starvation on CO2 fixation and lipid/carbohydrate production of an indigenous microalga Scenedesmus obliquus CNW-N. Bioresource Technology, 113(5), 244–252. DOI 10.1016/j.biortech.2011.11.133. [Google Scholar] [CrossRef]
38. Goli, A., Shamiri, A., Talaiekhozani, A., Eshtiaghi, N., Aghamohammadi, N. et al. (2016). An overview of biological processes and their potential for CO2 capture. Journal of Environmental Management, 183(8), 41–58. DOI 10.1016/j.jenvman.2016.08.054. [Google Scholar] [CrossRef]
39. Huertas, E., Montero, O., Lubián, L. M. (2000). Effects of dissolved inorganic carbon availability on growth, nutrient uptake and chlorophyll fluorescence of two species of marine microalgae. Aquacultural Engineering, 22(3), 181–197. DOI 10.1016/S0144-8609(99)00038-2. [Google Scholar] [CrossRef]
40. Hu, H., Gaol, K. (2003). Optimization of growth and fatty acid composition of a unicellular marine picoplankton, Nannochloropsis sp, with enriched carbon sources. Biotechnology Letters, 25(5), 421–425. DOI 10.1023/A:1022489108980. [Google Scholar] [CrossRef]
41. Msanne, J., Xu, D., Konda, A. R., Casas-Mollano, J. A., Awada, T. et al. (2012). Metabolic and gene expression changes triggered by nitrogen deprivation in the photoautotrophically grown microalgae Chlamydomonas reinhardtii and Coccomyxa sp. C-169. Phytochemistry, 75, 50–59. DOI 10.1016/j.phytochem.2011.12.007. [Google Scholar] [CrossRef]
42. Pal, D., Khozin-Goldberg, I., Cohen, Z., Boussiba, S. (2011). The effect of light, salinity, and nitrogen availability on lipid production by Nannochloropsis sp. Applied Microbiology and Biotechnology, 90(4), 1429–1441. DOI 10.1007/s00253-011-3170-1. [Google Scholar] [CrossRef]
43. Pérez, O., Escalante, F. M., de-Bashan, L. E., Bashan, Y. (2011). Heterotrophic cultures of microalgae: metabolism and potential products. Water Research, 45(1), 11–36. DOI 10.1016/j.watres.2010.08.037. [Google Scholar] [CrossRef]
44. Bolier, G., Donze, M. (1989). On the accuracy and interpretation of growth curves of planktonic algae. Hydrobiologia, 188–189(1), 175–179. DOI 10.1007/BF00027783. [Google Scholar] [CrossRef]
45. Alfonso, E., Leal, S. (1998). Creación y Mantenimiento de un Cepario de Microalgas. Centro de Investigaciones Marinas, Universidad de La Habana. pp. 21. Habana, Cuba. [Google Scholar]
46. Kamal, M. A., Iimura, N., Nabekura, T., Kitagawa, S. (2007). Enhanced skin permeation of diclofenac by ion-pair formation and further enhancement by microemulsion. Chemical and Pharmaceutical Bulletin, 55(3), 368–371. DOI 10.1248/cpb.55.368. [Google Scholar] [CrossRef]
47. Fini, A., Bassini, G., Monastero, A., Cavallari, C. (2012). Diclofenac salts, VIII. Effect of the counterions on the permeation through porcine membrane from aqueous saturated solutions. Pharmaceuticals, 4(3), 413–429. DOI 10.3390/pharmaceutics4030413. [Google Scholar] [CrossRef]
48. Zhang, Z., Volkman, J. K. (2017). Algaenan structure in the microalga Nannochloropsis oculata characterized from stepwise pyrolysis. Organic Geochemistry, 104, 1–7. DOI 10.1016/j.orggeochem.2016.11.005. [Google Scholar] [CrossRef]
49. Scholz, M. J., Weiss, T. L., Jinkerson, R. E., Jing, J., Roth, R. et al. (2014). Ultrastructure and composition of the Nannochloropsis gaditana cell wall. Eukaryotic Cell, 13(11), 1450–1464. DOI 10.1128/EC.00183-14. [Google Scholar] [CrossRef]
50. Radke, M., Ulrich, H., Wurm, C., Kunkel, U. (2010). Dynamics and attenuation of acidic pharmaceuticals along a river stretch. Environmental Science & Technology, 44(8), 2968–2974. DOI 10.1021/es903091z. [Google Scholar] [CrossRef]
51. Matamoros, V., Gutiérrez, R., Ferrer, I., García, J., Bayona, J. M. (2015). Capability of microalgae-based wastewater treatment systems to remove emerging organic contaminants: a pilot-scale study. Journal of Hazardous Materials, 288(2), 34–42. DOI 10.1016/j.jhazmat.2015.02.002. [Google Scholar] [CrossRef]
52. Zhang, N., Liu, G., Liu, H., Wang, Y., He, Z. et al. (2011). Diclofenac photodegradation under simulated sunlight: effect of different forms of nitrogen and kinetics. Journal of Hazardous Materials, 192, 447. DOI 10.1016/j.jhazmat.2011.05.038. [Google Scholar] [CrossRef]
53. Zhang, D. Q., Gersberg, R. M., Hua, T., Zhu, J., Goyal, M. K. et al. (2013). Fate of pharmaceutical compounds in hydroponic mesocosms planted with Scirpus validus. Environmental Pollution, 181, 98–106. DOI 10.1016/j.envpol.2013.06.016. [Google Scholar] [CrossRef]
54. Matamoros, V., Garcia, J., Bayona, J. M. (2008). Organic micropollutant removal in a full-scale surface flow constructed wetland fed with secondary effluent. Water Research, 42(3), 653–660. DOI 10.1016/j.watres.2007.08.016. [Google Scholar] [CrossRef]
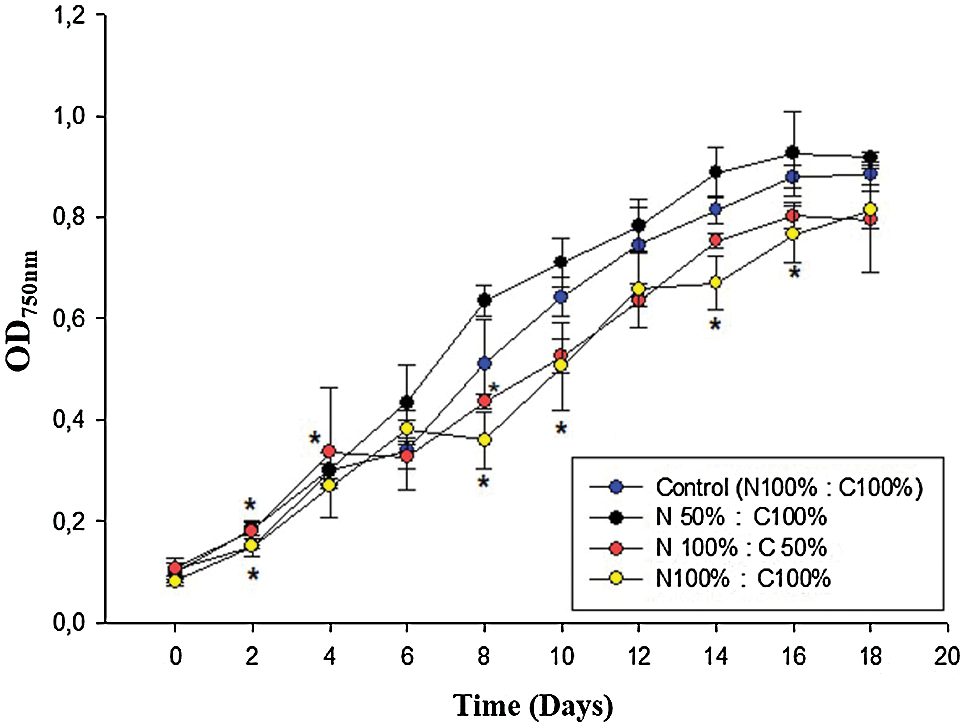
Figure S1: Growth curves of cultures of N. oculata exposed to diclofenac (16 µg/mL), under different concentrations of nitrogen (N) and carbon (C). The control culture did not contain diclofenac. Statistically significant differences with respect to the control are marked with an asterisk (ANOVA, p < 0.05, Dunnett test)
Table S1: Composition of the Bold nutrient solution
 | This work is licensed under a Creative Commons Attribution 4.0 International License, which permits unrestricted use, distribution, and reproduction in any medium, provided the original work is properly cited. |