International Journal of
Experimental Botany
| Phyton- International Journal of Experimental Botany |
DOI: 10.32604/phyton.2021.016795
ARTICLE
The Spatial-Temporal Heterogeneity of Understory Light Availability in a Temperate Forest of North China
1College of Landscape Architecture and Art, Henan Agricultural University, Zhengzhou, 450002, China
2College of Life Sciences, Henan Agricultural University, Zhengzhou, 450002, China
3Departamento de Agronomía-CERZOS (CONICET), Universidad Nacional del Sur, Bahía Blanca, Buenos Aires, 8000, Argentina
*Corresponding Authors: Qiusheng Yang. Email: ljzk919@163.com; Carlos Alberto Busso. Email: carlosbusso1@gmail.com
Received: 26 March 2021; Accepted: 25 May 2021
Abstract: The spatial-temporal variation of understory light availability has important influences on species diversity and community assembly. However, the distribution characteristics and influencing factors of understory light availability have not been fully elucidated, especially in temperate deciduous, broad-leaved forests. In this study, the understory light availability was monitored monthly (May–October) in a temperate deciduous, broad-leaved forest in Henan Province, China. Differences in the light availability among different months and habitat types were statistically analyzed using Kruskal–Wallis method, respectively. Partial least squares path modeling (PLS-PM) was used to explore the direct and/or indirect effects of stand structure, dominant species and topographic factors on the light environment. Results showed that there were differences in light environments among the four habitat types and during the studied six months. The PLS-PM results showed that the stand structure and the dominant species were negatively correlated with the light environment, and the path coefficient values were −0.089 (P = 0.042) and −0.130 (P = 0.004), respectively. Our result indicated that the understory light availability exhibit a distinct spatial and temporal heterogeneity in temperate deciduous, broad-leaved forest of north China. The characteristics of woody plant community, especially the abundance of one of the dominant plant species, were the important factors affecting the understory light availability.
Keywords: Dominant species; forest canopy; stand structure; forest dynamic monitoring plot
Light is a key environmental factor in forest ecosystems, especially for the understory [1]. The changes in light availability have important influences on the spatial distribution of woody plants [2]. However, canopy cover varies significantly among seasons in temperate deciduous, broad-leaved forests [1,3]. Previous studies have been conducted to explore the light heterogeneity in the forest understory [4–9], and discuss the effects of the understory light availability on herbaceous plants [10,11], liana plants [12], and plant seedlings [13,14]. Although these studies contributed greatly to our understanding of the distribution mechanisms that determine the understory light availability in forests, the influencing factors on the understory light availability have not been fully elucidated, especially in temperate deciduous, broad-leaved forests.
Understory light availability has highly complex spatial-temporal variation under the influence of stand structure, topographic factors and meteorological conditions [15]. The woody plant community is the main body of forest ecosystem, and affects the understory light availability by directly determining its transmission and spatial distribution [16]. Dominant species in woody plant communities play a key role in ecosystem productivity [17–19]. Grime et al. [20] pointed out that dominant species strongly affect vegetation structure and dynamics, and determine the fate of understory vegetation. Elevation, convex–concave and other topographic factors could affect plant community distribution [21]. These factors have direct and/or indirect effects on the understory light availability [21]. Although previous studies reported the effect of plant canopy structure, stand structure and topographic factors on the understory light availability [15], it is still unclear to which extent the spatial distribution of understory light availability is explained by the stand structure, the dominant species distribution and the topographic factors.
The canopy of the deciduous, broad-leaved forest in the warm temperate zone showed an obvious seasonal dynamics [21]. Temperate deciduous, broad-leaved forests are widely distributed in China with distinct seasonal change and complex community structure [22]. Quercus aliena var. acuteserrata, which is a deciduous dominant species in the temperate, broad-leaved forest with a wide distribution area, has an important ecological significance for the maintenance of the ecosystem structure [23]. In temperate deciduous, broad-leaved forests, forest structure determines the complex characteristics of understory light availability. For instance, under a dense canopy in summer, light availability is a limiting resource for the understory subcanopy species [24].
Natural ecosystems characteristically support complex communities by multiple interacting processes [25]. Many studies have demonstrated the spatial-temporal heterogeneity of understory light availability in temperate, deciduous broad-leaved forest [26–30]. However, the direct and indirect effects of the environment on understory light availability in temperate, deciduous broad-leaved forest are still unknown. Univariate statistical methods cannot completely satisfy the requirements of analyzing ecological system [25]. Partial least squares path modeling (PLS-PM) provides a multivariate statistical method that can solve complex problems.
Topography is considered an important driver of understory light availability in forest ecosystems [24]. Ridge and valley habitats are the most common microhabitats associated with distinct understory light availability [25]. However, topography is an indirect environmental variable, without direct biological effects. There are differences in species diversity and canopy structure among different plant communities [26]. The direct effect of plant communities on understory light availability is not clear. The accurate understanding and quantitative description of the spatial variation of understory light availability has important implications for protecting species diversity.
In the present study, the understory light availability was monitored monthly from May to October in a 5 ha plot established in a temperate deciduous, broad-leaved forest in China. This study aimed to (1) improve the ecological understanding of the distribution characteristics of the understory light availability at spatial and temporal scales, and (2) determine the direct and indirect effects of the environment on understory light availability and reveal potential mechanisms of the distribution of the understory light availability in temperate deciduous, broad-leaved forest of north China.
The study area, which is a temperate deciduous, broad-leaved forest, is located in the Funiushan National Nature Reserve in the Henan Province, China (111°48′–112°16′ E, 33°33′–33°56′ N). The mountain extends from the southeast to the northwest, and the highest peak is at an altitude of 2200 m. The mean annual temperature is 14.7°C, with the average temperature of the coldest month (January) is 1.5°C and that of the hottest month (July) 27.8°C. The mean annual precipitation is approximately 1200 mm, mainly occurring from July to September. The relative humidity ranges from 70% to 78% [31]. The forest cover area is 81.2% in the whole National Nature Reserve. The dominant tree species in the deciduous, broad-leaved forest, and in the studied plot were Q. aliena var. acuteserrata, Pinus armandii, Toxicodendron vernicifluum, and Sorbus alnifolia (Tab. S1).
On the basis of a comprehensive investigation on the Funiushan Nature Reserve, a 5 ha (200 m × 250 m) forest plot was established in 2015 (Fig. 1). Data were collected following the plot standards of the Center for Tropical Forest Science network [32]. The plot was divided into 500 subplots (10 m × 10 m). All woody plants with a diameter at breast height ≥1 cm were tagged and identified. The topography of the plot was complex, the elevation varied from 1538 to 1600 m, and the slope varied from 4.3° to 55.5°. Detailed information on this forest plot was described by Depauw et al. [33].
In the 5 ha plot, 17, 963 individual woody plants (with diameter at breast height ≥1 cm) belonging to 93 species were previously identified [33]. Of the 93 woody plant species, Quercus aliena var. acuteserrata is the dominant species (Tab. S1). Stand density and basal area were measured for each 10 m × 10 m grid in the plot. Stand density indicated the number of individual trees. Plant basal area was calculated as π × R2, where R is the radius at the height of 1.3 m. The dominant species was the abundance of Q. aliena var. acuteserrata in 10 m × 10 m subplot. The elevation of the four corners of each 10 m × 10 m subplot was measured to quantify the topography of the subplot. Based on Harms et al. [34] and Valencia et al. [35], topographic attributes (i.e., elevation and convex concave) were calculated for each 10 m × 10 m subplot.
Based on the 500 subplots in the 5 ha plot, the light availability of each subplot was measured using the hemispherical photographs taken with an ultra-wide-angle fisheye lens (F2.8 EX DC, SIGMA, Japan) attached to a Canon 7D camera (EOS60D, Canon, Japan). We held the camera at 1.3 m with a tripod located at the center of each 10 m × 10 m subplot. Triplicate photos were taken in the morning (06:30–08:00) and in the evening (16:30–18:30) to avoid inaccurate readings caused by direct sunlight [36,37]. The images were processed by using the Gap Light Analyser software (version 2.0). According to the location of the study site and the date of taking photos, longitude and latitude, lens parameters and threshold values are set in the software. Measurements were conducted monthly from May to October in 2016. In this temperate zone, leaves began to grow in May and fall in October. The Gap Light Analyzer software (version 2.0) was used to measure leaf area index (LAI), canopy cover (CC), average leaf angle (ALA), scattered radiation (SR), direct radiation (DR), light transmittance (LT) and total radiation (TR).

Figure 1: Topographic map of the 5 ha Funiushan permanent plot. The black solid line is the contour map of the plot
Cluster analysis was conducted to delineate similar habitat types in the light environment. The mean of the six surveys represented the light environment of the forest community. We conducted cluster analysis by using a plot-light matrix via the mean of the 6 months to analyze the distribution of the light environment in the plot. Cluster analysis was conducted using the heatmap function with the euclidean distance in the Vegan package [38]. Spatial autocorrelation may be observed among the light factors (including LAI, CC, ALA, SR, DR, LT, and TR). Thus, principal component analysis (PCA) was used to compress and extract the main spatial variation of the seven light factors (i.e., LAI, CC, ALA, SR, DR, LT, and TR). The dependent variable was matrix of plots-environment (seven light factors) in the PCA analysis. PCA was performed using the Vegan package [38]. Differences in the seven light factors among different months (from May to October) and habitat types were statistically analyzed using Kruskal–Wallis method, respectively. Habitat types were delineated based on the cluster analysis results.
In the present study, partial least squares path modeling (PLS-PM) was used to explore the possible effect of the stand structure, dominant species and topographic factors on the light environment [39]. Light environments were extracted from the first four PCA axes (Tab. 1). Stand structure included determinations of stand density and basal area, and the dominant species was determined as the abundance of Q. aliena var. acuteserrata in each subplot. Two topographic attributes (i.e., average elevation and convexity) were assigned to each subplot. For each subplot, elevation was calculated as the mean value at its four corners, and convexity as the elevation of a focal subplot minus the mean elevation of the eight surrounding subplots [34,35]. The PLS-PM model is a complex, detailed method according to the study of Hodapp [39]. This model was performed using the PLSPM package. All analyses were conducted using R 3.4.0 (R Development Core Team, http://www.Rproject.org).
3.1 Spatial Variation of Understory Light Availability
Cluster analysis showed that light environments could be divided into four types (Fig. 2). The spatial distribution of light environment in the plot were shown in Fig. 3. PCA results revealed that the first four PCs exhibit the main spatial variation of the light environment in the plot (Tab. 1, Fig. 4). PC1, PC2, PC3 and PC4 accounted for 42.79%, 35.59%, 12.54% and 8.39% of the light variation in the plot, respectively, which accounted for 99.32% of the total variation of the light environment. The Kruskal–Wallis test showed that there were significant differences in light environments among different habitats (Fig. 5).


Figure 2: Cluster analysis of the light environment in the Funiushan permanent plot. The parts colored in red, purple, black, and cyan are habitats 1–4, respectively. Different habitats represent different light conditions. ALA: average leaf angle, CC: canopy cover, TR: total radiation, SR: scattered radiation, DR: direct radiation, LT: light transmittance, and LAI: leaf area index

Figure 3: (A) Principal component analysis (PCA) of light environments. (B) Spatial distribution of the light conditions in the Funiushan permanent plot. Red, purple, black, and cyan represent habitats 1–4, respectively. Habitat classification was based on cluster analysis (Fig. 2). The black solid line is the contour map of the plot. ALA: average leaf angle, CC: canopy cover, TR: total radiation, SR: scattered radiation, DR: direct radiation, LT: light transmittance, and LAI: leaf area index

Figure 4: Maps of the principal components of light factors in the 500 subplots (10 m × 10 m) within the plot. Principal component analysis was used to compress and extract the main spatial variation of the light factors (including LAI, CC, ALA, SR, DR, LT, and TR) in the plot (Tab. 1)
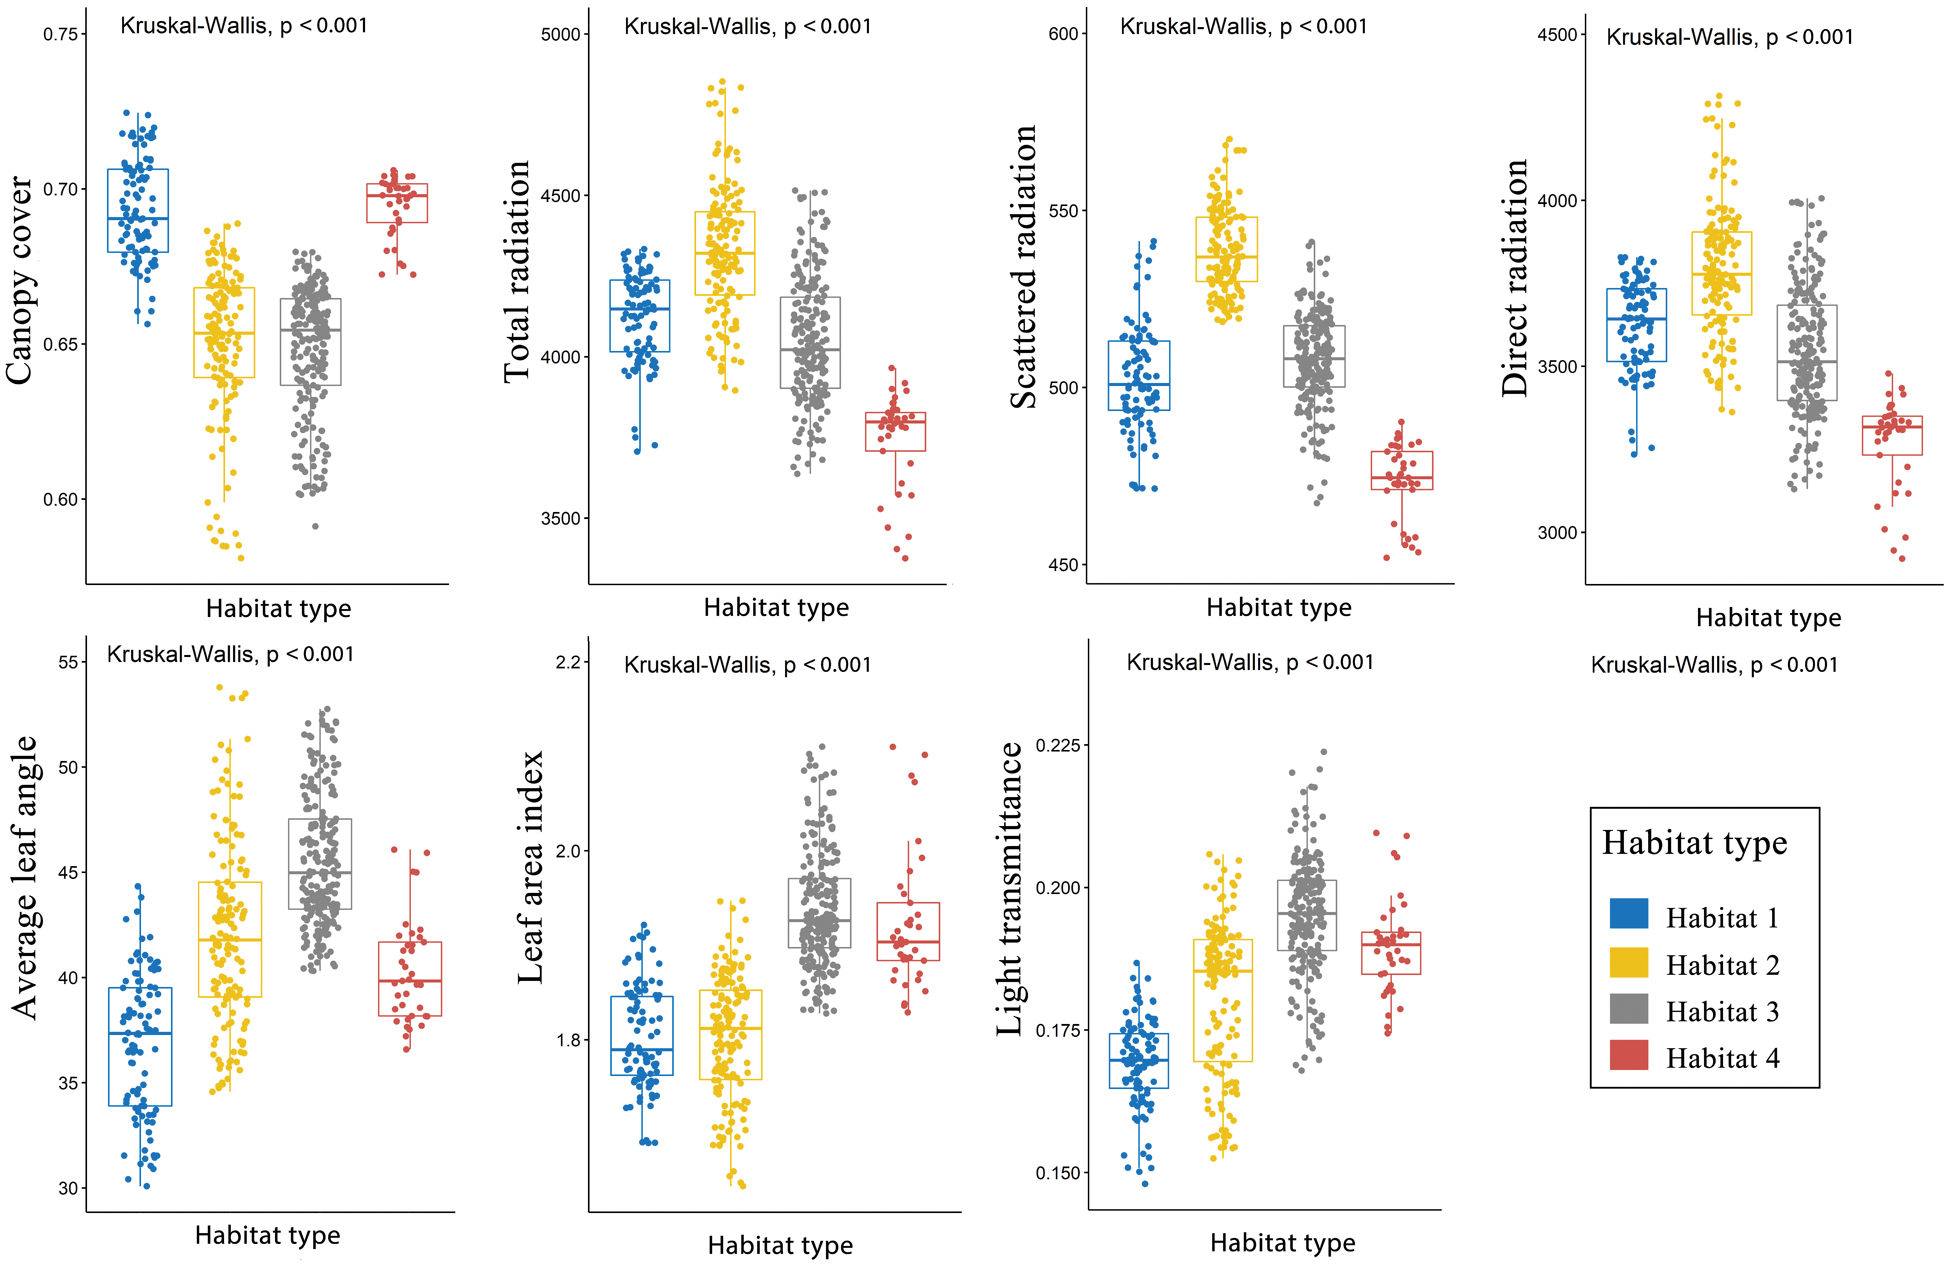
Figure 5: Light environments in the different habitats in the 500 subplots (10 m × 10 m) within the plot. (P ≤ 0.05 level of significance)
3.2 Temporal Variation of Understory Light Availability
There were significant differences in spatial distribution pattern of the light environments among the 6 studied months (Figs. S1–S7). The understory light availability significantly varied among the 6 studied months in the temperate deciduous, broad-leaved forest (Fig. 6). The mean value of canopy cover were the highest, and the mean value of light radiation were the lowest in July and August among 6 months.
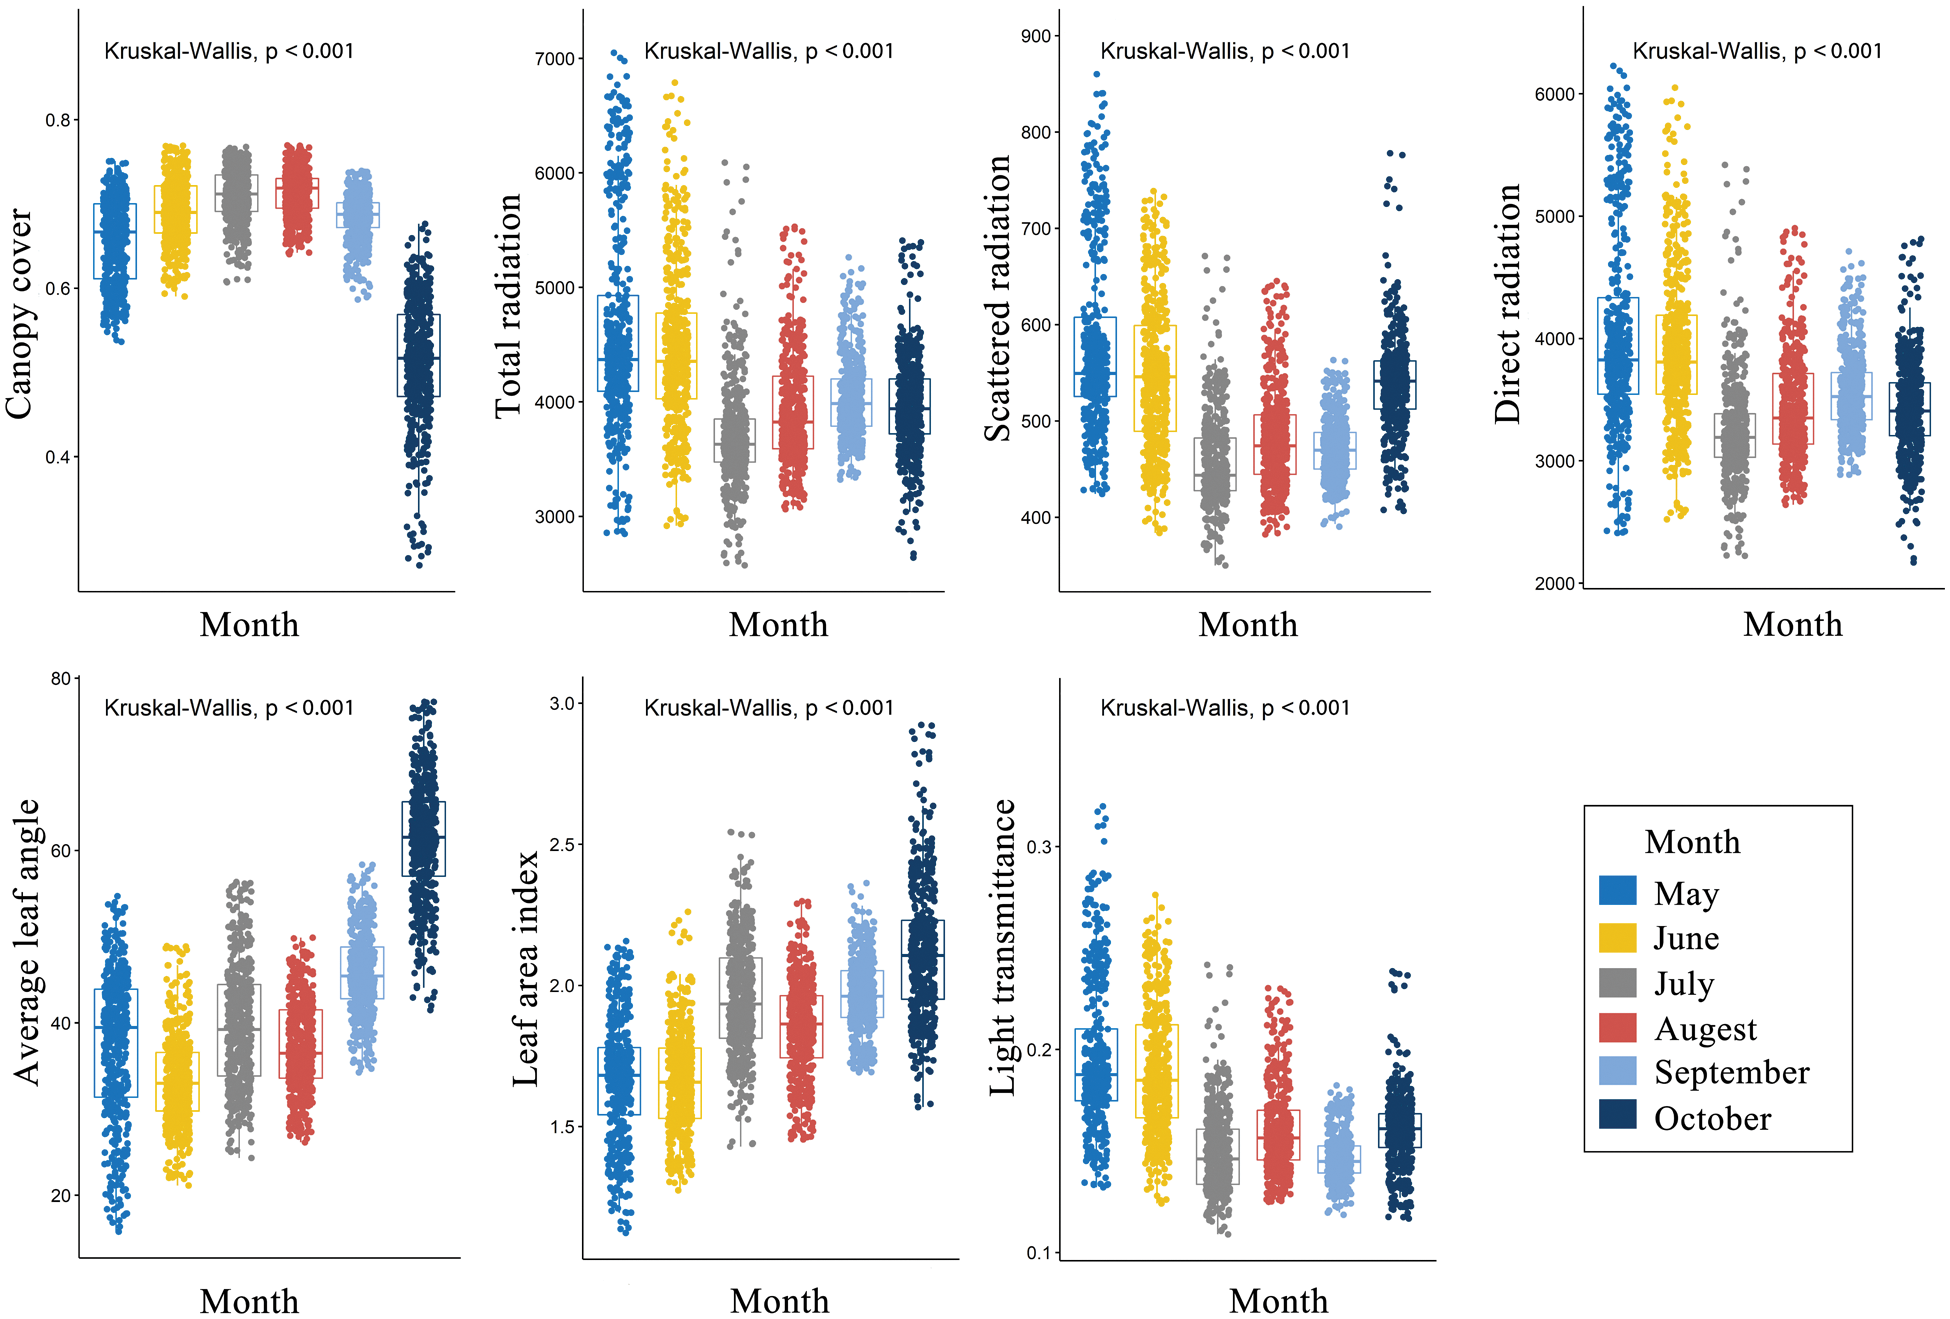
Figure 6: Light environments in the different moths in the 500 subplots (10 m × 10 m) within the plot. (P ≤ 0.05 level of significance)
3.3 Effects of Stand Structure, Dominant Species and Topography on Light Conditions
The PLS-PM results showed that the stand structure (stand density and basal area) and the dominant species (species abundance of Q. aliena var. acuteserrata) were negatively correlated with the light environment, and the path coefficient values (i.e., Total effect) were −0.089 and −0.130, respectively (Tab. 2). Topographic factors (average elevation and convexity) were positively correlated with the light environment, although the path coefficient (0.007) was extremely small and was not significantly different (Fig. 7).

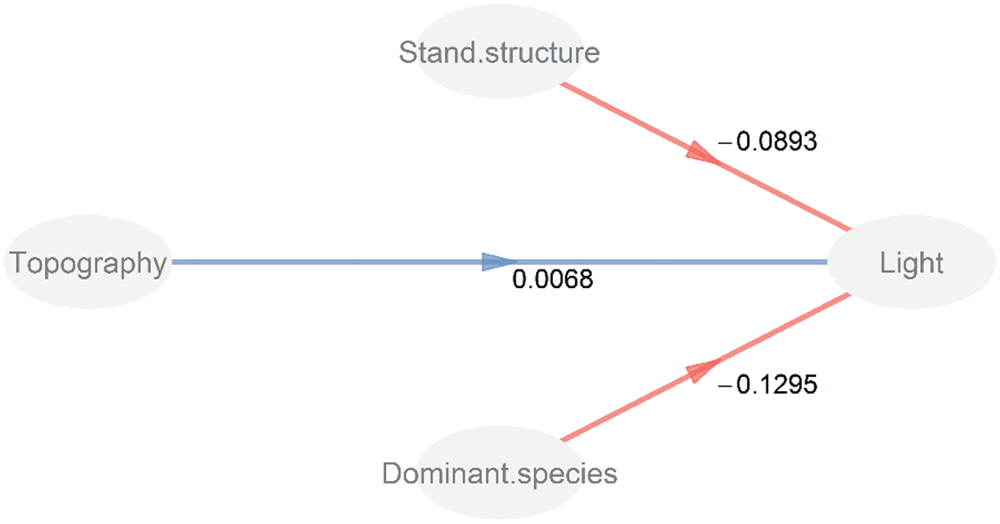
Figure 7: Partial least squares path modeling of the effects of topography, stand structure, and dominant species in the light environments. The numbers above the arrows indicate the path coefficients. Blue and red lines indicate the positive and negative pathways, respectively
In the present study, the understory light availability in the studied temperate deciduous, broad-leaved forest showed a patchy or zonal distribution, which was consistent with the topographic distribution (Fig. 1). On the spatial scale, canopy cover is greater on ridges than valleys, and the underforest light availability is lower on ridges than valleys. It might be attributed to the distribution of woody plants. Quercus aliena var. acuteserrata was the dominant species (accounting for 27.87% of total plant basal area) and was mainly distributed on the ridge while some sparse, shrubby forests existed in the valley (Fig. S8). Quercus aliena var. acuteserrata belongs to a broad-leaf species with an extremely large leaf area. Therefore, the understory light availability is better on the ridge than on the valley.
Habitat partitioning is of importance in maintaining species diversity of forest ecosystem [40,41]. In this temperate forest, the understory light availability could be divided into four habitats, and the light environment varied among them. Besides, habitat partitioning of the light environment is extremely important for the species coexistence of understory, such as herbaceous plants [42,43], bryophytes [44] and microbial communities [45]. This study demonstrated that the understory light distribution exhibit a significant spatial heterogeneity in the studied temperate deciduous, broad-leaved forest.
In contrast to tropical forests, temperate deciduous, broad-leaved forests vary significantly in their canopy cover during different months of the year. Canopy dynamics in the temperate deciduous, broad-leaved forest have an important effect on the understory light availability [26–28]. In this study, the light distribution pattern changed with months, which might be attributed to the fact that canopy interfered strongly with the understory light availability. Temporal partitioning is also important in maintaining the forest ecosystem species diversity [40].
A variety of factors, such as stand structure (e.g., individual density and basal area), topographic factors (e.g., elevation and convex–concave) and meteorological conditions (e.g., temperature and precipitation) directly or indirectly affect the understory light availability [15,21,46]. The PLS-PM model suggested that the stand structure and dominant species have great influences on the light environment while the effect of topography was extremely small. The forest community was the main body of the forest ecosystem, and topography determined the spatial distribution of plants on local scales [23,47]. The characteristics of the woody plant community (e.g., stand structure and the dominant species) were the direct factors influencing the understory light availability in the studied temperate, deciduous broad-leaved forest.
Our result indicated that the understory light availability exhibit a significant spatial and temporal heterogeneity in temperate deciduous, broad-leaved forest of north China. The characteristics of the woody plant community, especially the abundance of one of the dominant plant species, were the important factors affecting the understory light availability. Topography was an indirect factor affecting the light availability in understory. Our study could provide a certain guidance for the management of understory species in temperate deciduous, broad-leaved forest of north China. Most sunlight is absorbed by the tree canopy, making the much more understorey species inhabit a severely resource-limited habitat. Additionally, the heterogeneity of light availability, resulting from management-moderated tree composition and age structure, may contribute to species coexistence in temperate deciduous, broad-leaved forest of north China.
Acknowledgement: We thank the field observation and research station of forest ecosystem in the north-south transition zone of Funiu Mountain in Luoyang for their support for the plot construction and species survey.
Data Availability: The dataset analyzed during the current study is available from the corresponding author on a reasonable request.
Funding Statement: This work a contribution to Youth Foundation of Natural Science Foundation of Henan Province (212300410153), The Young Talents Promotion Project of Henan Province (2020HYTP037), Science and Technology Project of Henan Provincial Department of Natural Resources (No. 2021-178-9), and Basic scientific research expenses of Henan Province (2021JB02014).
Conflicts of Interest: The authors declare that they have no conflicts of interest to report regarding the present study.
1. Wirth, R., Weber, B., Ryel, R. J. (2001). Spatial and temporal variability of canopy structure in a tropical moist forest. Acta Oecologica, 22(5), 235–244. DOI 10.1016/S1146-609X(01)01123-7. [Google Scholar] [CrossRef]
2. Martens, S. N., Breshears, D. D., Meyer, C. W. (2000). Spatial distributions of understory light along the grassland/forest continuum: Effects of cover, height, and spatial pattern of tree canopies. Ecological Modelling, 126(1), 79–93. DOI 10.1016/S0304-3800(99)00188-X. [Google Scholar] [CrossRef]
3. Montgomery, R. A., Chazdon, R. L. (2001). Forest structure, canopy architecture, and light transmittance in tropical wet forests. Ecology, 82(10), 2707–2718. DOI 10.1890/0012-9658(2001)082[2707:FSCAAL]2.0.CO;2. [Google Scholar] [CrossRef]
4. Canham, C. D., Denslow, J. S., Platt, W. J., Runkle, J. R., Spies, T. A. et al. (1990). Light regimes beneath closed canopies and tree-fall gaps in temperate and tropical forests. Canadian Journal of Forest Research, 20(5), 620–631. DOI 10.1139/x90-084. [Google Scholar] [CrossRef]
5. Canham, C. D., Finzi, A. C., Pacala, S. W., Burbank, D. H. (1994). Causes and consequences of resource heterogeneity in forests: Interspecific variation in light transmission by canopy trees. Canadian Journal of Forest Research, 24(2), 337–349. DOI 10.1139/x94-046. [Google Scholar] [CrossRef]
6. Chazdon, R. L., Pearcy, R. W. (1991). The importance of sunflecks for forest understory plants. Bioscience, 41(11), 760–766. DOI 10.2307/1311725. [Google Scholar] [CrossRef]
7. Montgomery, R. A., Chazdon, R. J. (2002). Light gradient partitioning by tropical tree seedlings in the absence of canopy gaps. Oecologia, 131(2), 165–174. DOI 10.1007/s00442-002-0872-1. [Google Scholar] [CrossRef]
8. Feng, J., Zhao, K., He, D., Fang, S., Lee, T. et al. (2018). Comparing shade tolerance measures of woody forest species. PeerJ, 6(3), e5736. DOI 10.7717/peerj.5736. [Google Scholar] [CrossRef]
9. Liu, Q., Sun, Y., Wang, G., Cheng, F., Xia, F. (2019). Short-term effects of thinning on the understory natural environment of mixed broadleaf-conifer forest in Changbai Mountain area, Northeast China. PeerJ, 7(3), e7400. DOI 10.7717/peerj.7400. [Google Scholar] [CrossRef]
10. Stoepler, T. M., Lill, J. T. (2013). Direct and indirect effects of light environment generate ecological trade-offs in herbivore performance and parasitism. Ecology, 94(10), 2299–2310. DOI 10.1890/12-2068.1. [Google Scholar] [CrossRef]
11. Westerband, A. C., Horvitz, C. C. (2017). Photosynthetic rates influence the population dynamics of understory herbs in stochastic light environments. Ecology, 98(2), 370–381. DOI 10.1002/ecy.1664. [Google Scholar] [CrossRef]
12. Toledo-Aceves, T., Swaine, M. D. (2008). Biomass allocation and photosynthetic responses of lianas and pioneer tree seedlings to light. Acta Oecologica, 34(1), 38–49. DOI 10.1016/j.actao.2008.03.003. [Google Scholar] [CrossRef]
13. Jones, R. H., Sharitz, R. R. (1998). Survival and growth of woody plant seedlings in the understorey of floodplain forests in South Carolina. Journal of Ecology, 86(4), 574–587. DOI 10.1046/j.1365-2745.1998.00287.x. [Google Scholar] [CrossRef]
14. Lusk, C. H. (2019). Leaf functional trait variation in a humid temperate forest, and relationships with juvenile tree light requirements. PeerJ, 7(1), e6855. DOI 10.7717/peerj.6855. [Google Scholar] [CrossRef]
15. Giesbrecht, I. J., Saunders, S. C., MacKinnon, A., Lertzman, K. P. (2017). Overstory structure drives fine-scale coupling of understory light and vegetation in two temperate rainforest floodplains. Canadian Journal of Forest Research, 47(9), 1244–1256. DOI 10.1139/cjfr-2016-0466. [Google Scholar] [CrossRef]
16. Mi, X., Swenson, N. G., Jia, Q., Rao, M., Feng, G. et al. (2016). Stochastic assembly in a subtropical forest chronosequence: Evidence from contrasting changes of species, phylogenetic and functional dissimilarity over succession. Scientific Reports, 6(1), 32596. DOI 10.1038/srep32596. [Google Scholar] [CrossRef]
17. Smith, M. D., Wilcox, J. C., Kelly, T., Knapp, A. K. (2004). Dominance not richness determines invasibility of tallgrass prairie. Oikos, 106(2), 253–262. DOI 10.1111/j.0030-1299.2004.13057.x. [Google Scholar] [CrossRef]
18. Emery, S. M., Gross, K. L. (2006). Dominant species identity regulates invasibility of old-field plant communities. Oikos, 115(3), 549–558. DOI 10.1111/j.2006.0030-1299.15172.x. [Google Scholar] [CrossRef]
19. Gilbert, B., Turkington, R., Srivastava, D. S. (2009). Dominant species and diversity: Linking relative abundance to controls of species establishment. American, 174, 850–862. DOI 10.1086/647903. [Google Scholar] [CrossRef]
20. Grime, J. P. (1987). Dominant and subordinate components of plant communities: Implications for succession, stability and diversity. In: Gray, A. J., Crawley, M. J., Edwards, P. J. (Eds.Colonization, succession and stability, pp. 413–428. Oxford, UK: Blackwell Scientific Publications. [Google Scholar]
21. Chen, Y., Svenning, J. C., Wang, X., Cao, R., Yuan, Z. et al. (2018). Drivers of macrofungi community structure differ between soil and rotten-wood substrates in a temperate mountain forest in China. Frontiers in Microbiology, 9, 37. DOI 10.3389/fmicb.2018.00037. [Google Scholar] [CrossRef]
22. Senn-Irlet, B., Heilmann-Clausen, J., Genney, D., Dahlberg, A. (2007). Guidance for conservation of macrofungi in Europe. Strasbourg: ECCF. [Google Scholar]
23. Chen, Y., Jia, H. R., Niu, S., Zhang, X., Wang, H. L. et al. (2018). Effects of topographical heterogeneity and dispersal limitation on species turnover in a temperate mountain ecosystem: A case study in the Henan Province. China Russian Journal of Ecology, 49(1), 40–46. DOI 10.1134/S1067413618010046. [Google Scholar] [CrossRef]
24. Chen, Y., Shao, Y., Xi, J., Yuan, Z., Ye, Y. et al. (2020). Preferences of woody plant species in a heterogeneous temperate forest, Chin. Frontiers in Ecology and Evolution, 8, 165. DOI 10.3389/fevo.2020.00165. [Google Scholar] [CrossRef]
25. Jia, H. R., Chen, Y., Wang, X. Y., Li, P. K., Yuan, Z. L. et al. (2019). The relationships among topographically-driven habitats, dominant species and vertical layers in temperate forest in China. Russian Journal of Ecology, 50(2), 172–186. DOI 10.1134/S1067413619020061. [Google Scholar] [CrossRef]
26. Tanaka, H., Nakashizuka, T. (1997). Fifteen years of canopy dynamics analyzed by aerial photographs in a temperate deciduous forest. Japan Ecology, 78(2), 612–620. DOI 10.1890/0012-9658(1997)078[0612:FYOCDA]2.0.CO;2. [Google Scholar] [CrossRef]
27. Emborg, J. (1998). Understorey light conditions and regeneration with respect to the structural dynamics of a near-natural temperate deciduous forest in Denmark. Forest Ecology and Management, 106(2–3), 83–95. DOI 10.1016/S0378-1127(97)00299-5. [Google Scholar] [CrossRef]
28. Xi, J., Shao, Y., Li, Z., Zhao, P., Ye, Y. et al. (2021). Distribution of woody plant species among different disturbance regimes of forests in a temperate deciduous broad-leaved forest. Frontiers in Plant Science, 12. DOI 10.3389/fpls.2021.618524. [Google Scholar] [CrossRef]
29. Kim, H., Park, C., Lim, J., Shin, H. W. (2020). Changes of the flowering time of trees in spring by climate change in Seoul, South Korea. Phyton-International Journal of Experimental Botany, 89(4), 1019–1033. DOI 10.32604/phyton.2021.016796. [Google Scholar] [CrossRef]
30. Sánchez-Pinillos, M., De Cáceres, M., Casals, P., Alvarez, A., Beltrán, M. et al. (2021). Spatial and temporal variations of overstory and understory fuels in Mediterranean landscapes. Forest Ecology and Management, 490(40), 119094. DOI 10.1016/j.foreco.2021.119094. [Google Scholar] [CrossRef]
31. Chen, Y., Guo, L., Yao, C., Wei, B. L., Yuan, Z. L. et al. (2017). Community characteristics of a deciduous broad-leaved forest in a temperate-subtropical ecological transition zone: Analyses of a 5-hm2 forest dynamics plot in Baiyunshan Nature Reserve, Henan Province. Acta Ecologica Sinica, 37(17), 5602–5611. DOI 10.5846/stxb201606011056. [Google Scholar] [CrossRef]
32. Condit, R. (1995). Research in large, long-term tropical forest plots. Trends in Ecology & Evolution, 10(1), 18–22. DOI 10.1016/S0169-5347(00)88955-7. [Google Scholar] [CrossRef]
33. Depauw, L., Perring, M. P., Landuyt, D., Maes, S. L., Blondeel, H. et al. (2021). Evaluating structural and compositional canopy characteristics to predict the light-demand signature of the forest understorey in mixed, semi-natural temperate forests. Applied Vegetation Science, 24(1), e12532. DOI 10.1111/avsc.12532. [Google Scholar] [CrossRef]
34. Harms, K. E., Condit, R., Hubbell, S. P., Foster, R. B. (2001). Habitat associations of trees and shrubs in a 50-ha neotropical forest plot. Journal of Ecology, 89(6), 947–959. DOI 10.1111/j.1365-2745.2001.00615.x. [Google Scholar] [CrossRef]
35. Valencia, R., Foster, R. B., Villa, G., Condit, R., Svenning, J. C. et al. (2004). Tree species distributions and local habitat variation in the Amazon: Large forest plot in eastern Ecuador. Journal of Ecology, 92(2), 214–229. DOI 10.1111/j.0022-0477.2004.00876.x. [Google Scholar] [CrossRef]
36. Rich, P. M. (1990). Characterizing plant canopies with hemispherical photographs. Remote Sensing Reviews, 5(1), 13–29. DOI 10.1080/02757259009532119. [Google Scholar] [CrossRef]
37. Clark, D. B., Clark, D. A., Rich, P. M., Weiss, S., Oberbauer, S. F. (1996). Landscape-scale evaluation of understory light and canopy structures: Methods and application in a neotropical lowland rain forest. Canadian Journal of Forest Research, 26(5), 747–757. DOI 10.1139/x26-084. [Google Scholar] [CrossRef]
38. Oksanen, J., Kindt, R., Legendre, P., O’Hara, B., Stevens, M. H. H. et al. (2007). The vegan package. Community Ecology Package, 10, 631–637. http://vegan.r-forge.r-project.org/. [Google Scholar]
39. Hodapp, D., Meier, S., Muijsers, F., Badewien, T. H., Hillebrand, H. (2015). Structural equation modeling approach to the diversity-productivity relationship of Wadden Sea phytoplankton. Marine Ecology Progress Series, 523, 31–40. DOI 10.3354/meps11153. [Google Scholar] [CrossRef]
40. Svenning, J. C. (1999). Microhabitat specialization in a species-rich palm community in Amazonian Ecuador. Journal of Ecology, 87(1), 55–65. DOI 10.1046/j.1365-2745.1999.00329.x. [Google Scholar] [CrossRef]
41. Guo, Y., Xiang, W., Wang, B., Li, D., Mallik, A. U. et al. (2018). Partitioning beta diversity in a tropical karst seasonal rainforest in Southern China. Scientific Reports, 8(1), 17408. DOI 10.1038/s41598-018-35410-7. [Google Scholar] [CrossRef]
42. Murphy, S. J., Salpeter, K., Comita, L. S. (2016). Higher β-diversity observed for herbs over woody plants is driven by stronger habitat filtering in a tropical understory. Ecology, 97(8), 2074–2084. DOI 10.1890/15-1801.1. [Google Scholar] [CrossRef]
43. Jin, Y., Russo, S. E., Yu, M. (2018). Effects of light and topography on regeneration and coexistence of evergreen and deciduous tree species in a Chinese subtropical forest. Journal of Ecology, 106(4), 1634–1645. DOI 10.1111/1365-2745.12911. [Google Scholar] [CrossRef]
44. Chen, Y., Niu, S., Li, P., Jia, H., Wang, H. et al. (2017). Stand structure and substrate diversity as two major drivers for bryophyte distribution in a temperate montane ecosystem. Frontiers in Plant Science, 8, 874. DOI 10.3389/fpls.2017.00874. [Google Scholar] [CrossRef]
45. Gao, C., Shi, N. N., Chen, L., Ji, N. N., Wu, B. W. et al. (2017). Relationships between soil fungal and woody plant assemblages differ between ridge and valley habitats in a subtropical mountain forest. New Phytologist, 213(4), 1874–1885. DOI 10.1111/nph.14287. [Google Scholar] [CrossRef]
46. Smith, L. M., Reynolds, H. L. (2015). Plant-soil feedbacks shift from negative to positive with decreasing light in forest understory species. Ecology, 96(9), 2523–2532. DOI 10.1890/14-2150.1. [Google Scholar] [CrossRef]
47. Jia, H. R., Chen, Y., Yuan, Z. L., Ye, Y. Z., Huang, Q. C. (2015). Effects of environmental and spatial heterogeneity on tree community assembly in Baotianman National Nature Reserve, Henan. China Polish Journal of Ecology, 63(2), 175–183. DOI 10.3161/15052249PJE2015.63.2.002. [Google Scholar] [CrossRef]
 | This work is licensed under a Creative Commons Attribution 4.0 International License, which permits unrestricted use, distribution, and reproduction in any medium, provided the original work is properly cited. |