| Phyton-International Journal of Experimental Botany |
DOI: 10.32604/phyton.2022.016458
ARTICLE
Phytochemical Analysis and Antioxidant Activity of Crocus speciosus Leaves
1Department of Pharmaceutical Chemistry, National University of Pharmacy, Kharkiv, 61168, Ukraine
2Department of Pharmacognosy, National University of Pharmacy, Kharkiv, 61168, Ukraine
3Department of Quality, Standardisation and Certification of Drugs, National University of Pharmacy, Kharkiv, 61001, Ukraine
4Department of Analytical and Toxicological Chemistry, Lithuanian University of Health Sciences, Kaunas, 44307, Lithuania
*Corresponding Author: Olha Mykhailenko. Email: Mykhailenko.farm@gmail.com
Received: 07 March 2021; Accepted: 28 May 2021
Abstract: The numerous studies indicate leaves of plants are a rich source of bioactive compounds that can be a valuable source of compounds used in the pharmaceutical and cosmetic industries. Aim of this study was to investigate the chemical composition and the antioxidant property of Crocus speciosus leaves. Primary phytochemical screening of C. speciosus leaves revealed the presence of some following compound categories such as phenolic compounds, aminoacids, saponins, proteins, tannins, triterpenoids, glycosides, polysaccharides. The total flavonoids and phenolic compounds content were determined spectrophotometrically and by HPLC-DAD and HPLC-MS. Antiradical activity was determined by ABTS radical-cation scavenging method, spectrophotometrically. The total amount of flavonoids in C. speciosus leaves was 1.07 ± 0.02 mg RE/g (p < 0.05), the total amount of phenolic compounds was 0.41 ± 0.01 mg GAE/g (p < 0.05). By HPLC-DAD-MS analysis the presence of the mangiferin, chlorogenic acid, isoorientin, kaempferol, hyperoside, and isoquercitin was established for the first time in Crocus leaves. The antiradical activity of C. speciosus leaves extracts was 150.08 ± 4.5 μmol/g (p < 0.05) and its was mainly attributed to phenolic compounds content. The high amounts of flavonoids and antiradical activity in C. speciosus leaves suggests promising phytochemical and pharmacological study of this Crocus species.
Keywords: Crocus speciosus; flavonoids; leaves; antiradical activity
The genus Crocus L. (Iridaceae) consists of about 100 species recognized [1,2]. The genus Crocus is divided into two subgenera: subgenus Crociris containing C. banaticus and subgenus Crocus comprising the remaining species. The subgenus Crocus is further divided into two sections: section Crocus and section Nudiscapus. The genus is of ecological, horticultural, culinary and pharmacological importance [3]. The most known representative of the genus Crocus is Crocus sativus L. or saffron, which is used as a coloring agent, flavor enhancer and also as a medicine.
Recent researches [4–6] point to the value of by-products in the saffron production. The possibility of additional use of leaves, flowers or low-quality corms of the plant can increase the profit for the farming companies producing this spice. Various phytochemicals such as carotenoids, terpenoids, tannins, flavonoids, hydroxycinnamic acids, and anthocyanins can be obtained from plant by-products [7]. These compounds are useful in cosmetics, medicine and food additives, or used in the agri-food industry as natural pigments, antioxidants or antimicrobial agents [5,8]. According to authors [5,6,9,10] active compounds of different by-products of C. sativus have significant antioxidant activities. The Crocus genus plants are ornamental plants and are widely cultivated [1,2]. The widespread use of C. sativus creates the prerequisites for a detailed study of other species and varieties of Crocuses. Various studies of the chemical composition or pharmacological activity of Crocus spp. (C. speciosus, C. albiflorus, C. neapolitanus, C. aureus, C. stellaris, C. asturicus, C. candidus, C. olivieri, C. baytopiorum, C. carwrightianus, C. corsicus, C. etruscus, C. korolkowii, etc.) have already been presented. They showed that the leaves and flowers of Crocus spp. contain flavonoids, anthocyanins, phenol carboxylic acids, terpenoids [11–14], fatty acids, etc. [15]. The presence of antimicrobial [16,17], antioxidant [17,18] cytotoxic [19], and other activities have been established. These data show the promise of studying and using not only saffron. However, the data is very limited. This study focused on the study of С. speciosus from Lithuania.
Crocus speciosus Marschall von Bieberstein is one of the 30 autumn flowering Crocuses [1]. The plant originated from Greece, Turkey and Iran, but is already widely cultivated in various European countries [20]. The corms and leaves of this Crocus species in Turkey are used for food [21].
The plant requires a well-drained soil, a dry period in summer with flowering caused by lower temperatures and increased soil moisture in autumn, therefore the climatic conditions of the countries of Eastern Europe are very favorable for the plant. Analysis of the literature showed that the following compounds were identified in С. speciosus: in petals/perianth/tepal were found crocetin [11], astragalin, kaempferol and quercetin derivatives [12,13], kaempferol 3-O-α-L-(2-O-β-D-glucopyranosyl) rhamnopyranoside-7-O-β-D-glucopyranoside [22]; kaempferol [11] and kaempferol tetrahexoside [23] were found in leaves and in the stigma, respectively.
Leaves of C. speciosus appear after flowering. Leaves a hysteranthous, until 20 mm long, green with a distinct mid-white stripe [20,21]. Due to the fact that there are no data in the literature on the chemical composition of leaves of this Crocus species, this study focused on the analysis of phenolic compounds of the chosen raw material. The aim of the investigation is to evaluate the chemical composition and antioxidant activities of C. speciosus, as there is a significant lack of information on this Crocus species. The assessment of the possibility of using C. speciosus leaves as a source of biologically active compounds is important for the creation of nutraceutical drugs and encourages the implementation of a sustainable valorization plant plan.
2.1 Plant Material and Reagents
The objects were the leaves of Crocus speciosus M. Bieb harvested at Vytautas Magnus University Botanical Garden in Kaunas, Lithuania in December 2019. Sample were identified and authenticated by Dr. Mykhailenko. Analysis was performed with air-dried raw materials. Voucher specimens (N 2019057) were deposited in the Herbarium of Pharmacognosy Department of the National University of Pharmacy, Kharkiv, Ukraine. HPLC grade methanol and acetonitrile (Sigma-Aldrich GmbH, Switzerland), HPLC grade glacial acetic acid (Fluka Chemie, Switzerland) were used in the analysis work. HPLC grade water was obtained from a water purifying system (Millipore, Bedford, MA, USA). 2, 20-azino-bis (3-ethylbenzothiazoline-6-sulfonic acid) diammonium salt (ABTS, 98%) were purchased from Sigma (Sigma-Aldrich, Steinheim, Germany and St. Louis, MO, USA, respectively). Trolox (98%) was received from Fluka Chemika (Buchs, Switzerland). The reference compounds: chlorogenic acid (95.33%), mangiferin (98.0%), isoorientin (98%), hyperoside (98%), kaempferol (98%), and isoquercetin (94.16%) were purchased from Sigma-Aldrich GmbH (Steinheim, Germany). Other chemicals and solvents were of analytical grade.
Crushed sample was filled with 70% methanol and kept in an ultrasonic bath for 20 min (1:50). The sample was then diluted to the mark in 10 mL flasks and diluted with methanol and filtered through microfilters. Preliminary qualitative analysis of phenolic compounds of C. speciosus leaves was established as described by Morsy [24], by Wilson [25], by TLC analysis [26]. On the chromatograms the zones of compounds were detected by the characteristic fluorescence in UV-light at the wavelength 365 and 254 nm before and after treating the TLC plate with ammonium vapors, 2% alcoholic solution of aluminum chloride; 10% sodium/potassium hydroxide solution; 5% alcoholic solution of diazotized sulfanilic acid (diazo reagent) (it is for testing of coumarins, hydroxycinnamic acids) that allows to obtain bands with brighter fluorescence in UV-light.
2.3 Determination of Total Phenolic Content
Total phenolic content in the methanol extracts of C. speciosus leaves was measured using the Folin–Ciocalteu reagent method as described by Cicco et al. [27]. The absorbance of solutions was measured at 750 nm. The measurements were repeated three times. The standard acid solutions were prepared in the same way as the test solutions, but instead of 1 mL of extract, 1 mL of a solution of known concentration was taken. Using a 70% methanolic solution of gallic acid, five concentrations of gallic acid solutions were prepared: 0.5, 1.0, 1.5, 2.0, and 2.5 mg/mL. The obtained data were evaluated according to the linear regression equation of the end acid calibration graph: y = 0.9068x + 0.0617; R2 = 0.9960; y = absorption intensity; x = total phenolic compounds expressed as gallic acid equivalent [mg GAE/g].
2.4 Determination of Total Flavonoid Content
Total flavonoid content of C. speciosus leaves was determined using spectrophotometric method as described by Bezruk et al. [28]. C. speciosus extract (0.2 mL) was mixed with 0.2 mL glacial acetic acid 33%, 0.8 mL hexamethylenetetramine 5%, 0.6 mL aluminum (III) chloride 10%, and 2.2 mL of water. The resulting mixture was incubated for 30 min at 70°C. Furthermore, absorbance was measured at 407 nm [29]. The measurements were repeated three times. Reference solutions of five different concentrations were prepared: 0.2, 0.4, 0.6, 0.8 and 1.0 mg/mL. Data were evaluated according to the linear regression equation of a rutin calibration graph: y = 0.9465x – 0.0950; R2 = 0.9960; y = absorption intensity; x = total amount of flavonoids expressed as rutin equivalent [mg RE/g].
The separation of phenolic compounds in C. speciosus leaves methanol extracts was carried out using an ACE C18 column (250 mm × 4.6 mm, 5.0 μm) as described by Mykhailenko et al. [30]. The flow rate of elution was 1 mL/min. The solvent system comprised solvent A (0.1% acetic acid in water) and solvent B (acetonitrile). A linear gradient program was applied: 0–8 min, 5–15% B; 8–30 min, 15–20% B; 30–48 min, 20–40% B; 48–58 min, 40–50% B; 58–65 min, 50%; 65–66 min, 50–95% B. The temperature of the column was constant at 25°C. The injection volume of the sample solution was adjusted at 20 μL. An aliquot of 20 μL of 70% methanol extract was injected three times into the HPLC system for analysis. The reference compounds (mangiferin, chlorogenic acid, isoorientin, kaempferol, hyperoside, isoquercitin) were used to prepare the standard solutions at a concentration of 1.0 mg/mL in methanol and were used for calibration. The retention time (Rt), and the UV-spectra of the peaks in the samples were compared with those of the authentic reference compounds.
2.6 Quantitative Determination of the Constituents
The compound concentration in the plant was calculated (mg/g) by the following formula:
where S–phenolic compound peaks average area calculated from the parallel chromatograms of the sample solution; Sst–reference compound peaks average area calculated from the parallel chromatograms of the standard solution; m–powdered raw materials weights in g; mst–reference compound weights in mg; V–volumetric flask volume of the test extract in mL and Vst–volumetric flask volume of the reference compounds in mL.
Following the United States Pharmacopeia (USP) recommendations, there are various analytical method validation parameters, including the limit of quantification (LOQ), the limit of detection (LOD), linearity, accuracy, and repeatability [31]. The responses’ linearity range of the standards was obtained using ten concentration levels with two injections for each level. The analytes were dissolved in methanol and the stock solutions were prepared. The stock solutions were diluted to a series of appropriate concentrations to construct the calibration curves. All calibration curves were recorded using the solutions of the reference compounds with an injection volume of 2.2 µL. The working solution with the lowest concentration was diluted with methanol to various concentrations. These solutions were then used for the determination of the limits of detection (LOD) and limits of quantification (LOQ) at a signal-to-noise ratio (S/N) of 3 and 10 for each compound. The repeatability was evaluated by analyzing six replicates of each preparation using HPLC (repeatability on the real sample). The main peak areas of two repeated chromatograms were used to calculate the relative standard deviation (RSD).
Separation of the samples’ components was carried out with the ACQUITY H-class UPLC system (Waters, Milford, MA, USA) equipped with ACQUITY UPLC BEH C18 (50 × 2.1 mm, particle size 1.7 µm) (Merck Millipore, Darmstadt, Germany). Gradient elution was performed with 0.1% formic acid water solution (solvent A) and acetonitrile (solvent B), the flow rate at 0.5 mL/min. The following proportions of the solvent system were applied using a linear gradient profile B: Initial 0–3 min, 5%, 3–10 min, 30%, 50%, 10–18 min, 95%, 18–34 min, 5%. Xevo TQD triple quadrupole mass spectrometer detector (Waters) was used to obtain MS/MS data. Positive electrospray ionization was applied with the following settings: Capillary voltage was 1.5 kV, source temperature was 150°C, desolvation temperature was 350°C, with a desolvation gas flow 650 L/h, cone gas flow was 25 L/h. Collision energy and cone voltage were optimized for each compound separately. Collision energy varied in the range from 6 to 20 eV and cone voltage was selected from 8 to 38 V.
2.9 Antioxidant Activity of C. speciosus Leaves
Measurement of radical scavenging properties of C. speciosus leaves methanol extracts was carried out according to the method described by Bezruk et al. [32] and Marksa et al. [33]. After PDA detection, the ABTS solution was mixed with the mobile phase carrying the analytes in the reaction coil [32]. Empower Software Chromatographic Manager System (Waters Corporation, Milford, USA) was used to analyze the data. The ABTS post-column chromatograms were detected at the wavelength of 650 nm using Waters 2487 UV/VIS detector (Waters Corporation). Teflon reaction coil of 3 m length, 0.25 mm i.d. was used. The system with the ABTS solution was monitored as follows: temperature set at 50°C and the flow rate of the reagent was set 0.5 ml/min. The standard antioxidant Trolox (0.3995 µmol/g) was used for the preparation of the calibration curves [33]. The value was calculated as μmol Trolox equivalent (TE) for 1 g of dry mass (DM) of the plant material using the following formula: TEAC = c × V/m (μmol/g) where ‘c’ is the Trolox concentration in μM established from the calibration curve, ‘V’ is the plant material extract volume in L, and ‘m’ is the weight (precise) in g [33].
For the spectrophotometry analysis, analysis was conducted as follows: 10 µl of the ethanolic extract of C. speciosus leaves was mixed with 3 ml of working ABTS•+ stock solution (concentration was 2 mmol/L). The mixture was kept in the dark for 30 min, then its absorption was measured with a spectrophotometer at a wavelength of 734 nm. The calibration graph was created using standard Trolox solutions of 8000 to 24000 µmol/L: y = 0.00003x − 0.00360; R² = 0.9714; y = extent of absorption; x = antioxidant activity. Stock solution preparation: 0.0548 g of ABTS powder was dissolved in 50 ml of purified water. To the resulting solution was added 0.0095 g of K2S2O8. ABTS working solution•+: Stock solution was diluted with purified water until absorbance at 734 nm measured with a spectrophotometer was 0.8 ± 0.03 [34].
The plant material is weighed with electronic scales from Sartorius AG (Götingen, Germany). The plant material was shredded using a household shredder BOSCH MKM6003 (Gerlingen, Germany). For ultrasonic extraction, an ultrasonic bath Biosonic UC100 Ultrasonic Cleaner Set WUC-A06H (Witeg, Wertheim) was used. 1 cm diameter cells were used for sample analysis (Germany). The Halo DB-20 UV-Vis spectrophotometer (Dynamica GmbH, Switzerland) was used for spectrophotometric studies to determine the total amount of flavonoids, phenolic compounds and antioxidant activity.
2.11 Statistical Data Analysis
The content of the components and antioxidant capacity were expressed as a mean ± SD (standard deviation) of three replicates. The data were processed by using SPSS v25 (IBM, Armonk, NY, USA) software. A statistically significant difference was found when p < 0.05.
The phenolic composition of C. speciosus was studied in the methanol extract of leaves by two-dimensional thin layer chromatography in mobile phase n-butanol–acetic acid–water (4:1:2)–I direction and 15% acetic acid–II direction. The chromatograms were examined on presence of phenolic compounds under daylight and UV light before and after derivatization with chromogenic agents. Substances that had a dark and yellow color under UV light and changed to an intense yellow, yellow-green, yellow-brown or orange under the action of ammonia vapor, 2% zirconium chloride solution and 5% ethanolic sodium hydroxide were classified as flavonoids. Zones with a yellow-brown or dark brown color are classified as flavones (3-and 5-hydroxyflavones) and 5-hydroxyflavanones. That is also confirmed by the boric acid colour identification reaction (yellow colouring) [25]. The reaction with 3% solution of iron (III) chloride gives a green coloration of the solution. That indicates the presence of flavonols or flavones in Crocus leaves. Zones with a blue color on the chromatogram in UV light was belong to derivatives of hydroxycinnamic acids. Chromatograms were treated with ammonia vapor and aluminum chloride reagent. The zones of flavonoid aglycones acquired bright yellow fluorescence. The dark brown zones acquired a yellow-green color, which is characteristic of flavone glycosides. In addition, chromatograms in UV light had spots with a dark yellow fluorescence characteristic for benzo-γ-pyrones. After derivatization with ammonia vapor, these zones turned a bright orange color. After treatment with a chromogenic reagent (AlCl3), these zones became a green, which confirms their belonging to xanthones. According to literature data on the chemical composition of Crocus genus plants, several classes of biologically active compounds were selected for further identification in plant raw materials by HPLC methods.
The preliminary results of phytochemical screening of C. speciosus leaves extracts showed the presence of aminoacids, proteins, saponins, hydrolysable tannins, triterpenoids. Alkaloids and coumarins were not found in raw material (Tab. 1).

The results are difficult to compare with the literature data, because, the information in the scientific sources prevails for C. sativus [5,6,35,36], as well as, the chemical composition are influenced by the type of plant genotype, extraction procedures, geographical and climatic conditions of growth, and also phenological phases.
3.2 Quantification of Phenolic Compounds of Crocus speciosus Leaves
Further analysis was carried out for the leaves of C. speciosus, since the literature data on the study of this particular Crocus species are very limited. According to the results of study conducted in 2001 year [35] the total phenolic content in extracts of C. sativus leaves from different parts of the world averaged 8.55%–9.49%. Leaves of C. sativus from Jammu and Kashmir (India) contained 5.62 mg GAE/g of phenolic compounds [37]. In current investigation, the total phenolic content in extracts of C. speciosus leaves were 0.412 ± 0.01 mg GAE/g or 4.12 ± 0.21 µmol/g. The total flavonoid content in C. speciosus leaves was 1.07 ± 0.02 mg RE/g or 10.62 ± 0.42 μmol/g. The total content of phenolic compounds depends not only on the place of production, but also on the various growing conditions, the time of harvesting or the preparation time of the plant raw material [30,32]. For this experiment, the leaves of C. speciosus were harvested in December in VDU botanical garden of Kaunas, Lithuania. The experimental place has a humid continental climate (Dfb in the Köppen climate classification). Average temperatures on the coast are −2.5°C (27.5°F) in January and 16°C (60.8°F) in July. The geographic coordinates of the area are 54°5350 N latitude, 23°5310 EW longitude and 48 m above sea level [38]. The climate of Lithuania is temperate and cool, but the Gulf Stream creates a favorable humid climate for autumn flowering Crocuses.
The spectrophotometric method based on the oxidation of phenolic compounds in an alkaline medium with the Folin–Ciocalteu reagent as a rule used to determine the total phenolic content in plant raw materials [39]. Recent studies [40,41] have shown that the total content of phenols, determined by the Folin–Ciocalteu method, correlates with antioxidant activity of plant extracts. The method of measuring the optical density of solutions at 410–430 nm after adding a solution of aluminum chloride is used to assess the total content of flavonoids [32,42]. However, this reagent oxidizes different groups of phenolic compounds.
The absorption in the area of 405–410 nm interacting with the reagent of aluminum chloride gives not only flavonols (for example, kaempferol, isorhamnetin, rutin), but also flavones (apigenin, luteolin, etc.) and flavonones (naringenin, hesperetin, etc.) with the hydroxyl groups in position 3 and/or 5 [42,43]. Flavonones and flavones with aluminum chloride and form stable complexes. Analysis of literature data [4,11,36,37] showed that plants of Crocus genus may contain naringenin and apigenin and their glycosides. Therefore, the total flavonoids content in terms of rutin in C. speciosus leaves is higher than the total amount of phenolic compounds. The content of total phenols is less using the Folin-Ciocalteu reagent than the total flavonoids content with aluminum chloride. This is probably due to the presence of compounds in Crocus leaves that do not react with the Folin-Chocalteu reagent in the specified UV region. The leaves contain approximately equal amounts of flavonols and phenolic acids (including the identified chlorogenic acid), which are not oxidized by the Folin–Ciocalteu reagent. The assessment of the compounds content can be given precisely for the flavonoids content. This study represents the first report on the determination of total phenolic and flavonoids contents in C. speciosus leaves. Moreover, Crocus leaves are generally regarded as by-products and could be used as an alternative source of bioactive compounds.
A validation study was conducted to demonstrate the applicability of the developed analytical method. The validation was done in terms of specificity, linearity, LOD, LOQ, precision and recovery according to the International Conference on Harmonization [31]. The results are summarized in Tabs. 2 and 3. The regression equation for each reference standard compound, together with the LOD and LOQ values are shown in Tab. 2. All the calibration curves showed acceptable linear regression (r2 ≥ 0.999). The overall intra-day and inter-day precision RSDs were not more than 1.3%. The overall stability over 24 h and repeatability were not more than 1.06% for both parameters. The developed analytical method showed excellent precision with overall recovery in the range from 99.58% to 101.91% (RSD ≤ 1.31%) for all compounds. Therefore, the method was precise, accurate and sensitive enough for the simultaneous quantitative evaluation of all compounds in C. speciosus methanol extracts. The specificity is the ability of a method to discriminate the study analytes and other constituents in the sample. It was demonstrated by the separation of the analytes from other interfering compounds. The determination of the main compounds in the tested solutions was done by comparing the retention times of the peaks and UV-spectrum with those of the standard solution. The results showed that the conditions for the fingerprint analysis were repeatable and precise.
3.4 Qualitative and Quantitative Analysis of the Compounds
Previously, Harborne et al. [11] identified kaempferol in C. speciosus leaves by paper chromatography. Its derivative kaempferol 3-sophoroside was further isolated by the authors from the flowers of C. laevigatus and C. korolkowii. Nørbaek et al. [13,14] found astragalin, kaempferol 3-O-β-D-(2-O-β-D-glucopyranosyl) glucopyranoside, kaempferol 3,4′-di-O-β-D-glucopyranoside, kaempferol 3-O-α-L-(2-O-β-D-glucopyranosyl) rhamnopyranosides, quercetin 3,4′-di-O-β-D-glucopyranoside, quercetin 3-O-β-D-sophoroside, and isoramnetin in petals of C. speciosus. According to our knowledge, no further studies were carried out for the leaves of this Crocus species.
For further investigation the HPLC method was applied. It is the optimal method, which stands to provide a simple and versatile approach to identify and quantitative assessment of secondary metabolites in plant extracts [44]. The identification of compounds occurs by comparing the detected UV spectra and the retention time of the compounds on the chromatogram with the spectra of reference compounds. HPLC analysis of C. speciosus leaves methanol extract showed the presence of six phenolic compounds, namely mangiferin, chlorogenic acid, isoorientin, kaempferol, hyperoside, and isoquercitin (Figs. 1a and 1b). Isoorientin and kaempferol had higher content 3.68 and 1.25 mg/g, respectively. All identified compounds in C. speciosus leaves play an important role as antioxidants. Thus, their presence in the raw material suggests antiradical activity of its extracts [36].
To confirm the identified compounds, further UPLC-MS/MS analysis of these components was performed in negative ion mode, and their retention time (tR), calculated molecular weights and MS/MS data are shown in Tab. 4, respectively. This method has high sensitivity and therefore allows the identification of substances that are contained in raw materials in a small amount and can elucidate unknown structures based on mass fragmentation pathways of known compounds [45]. All compounds were unambiguously identified with the reference standards comparison. Peak 1 ([M – H]− at m/z 353) was assigned to monocaffeoyquinic acids. The MS spectrum of peak 1 was characterized by the loss of one moiety of caffeic acid, due to the ester bond, which readily dissociated and was identified as 3-O-caffeylquinic acid or chlorogenic acid in comparison with the reference standards. In the MS spectrum peak 2 produced the [M − H]− ion at m/z 421. The MS2 spectrum gave the predominant fragment ions at m/z 331 and 301 owing to the neutral loss of C3H6O3 and C4H8O4, respectively. The low intensity product ion at m/z 259 appeared in the MS2 spectrum due to the loss of the glucose residue from the [M − H]− ion. The MS3 spectrum of the precursor ion at m/z 301 gave the product ion at m/z 273, 271 and 257 resulting from the loss of CO, CH2O and CO2, respectively. The RDA fragmentation reaction was also observed in the MS/MS spectrum and corresponding with literature data [46]. For flavones, Peaks 3 ([M − H]− at m/z 447), 4 ([M − H]− at m/z 463), 5 ([M − H]− at m/z 463) and 6 ([M − H]− at m/z 285) were identified as isoorientin (calculated for C22H20O11, m/z 248), hyperoside (calculated for C21H20O12, m/z 464), isoquercitrin (calculated for C21H20O12, m/z 464) and kaempferol (calculated for C15H10O6, m/z 286), respectively. They were further confirmed by comparing the retention time and the MS/MS spectra with the corresponding standards.


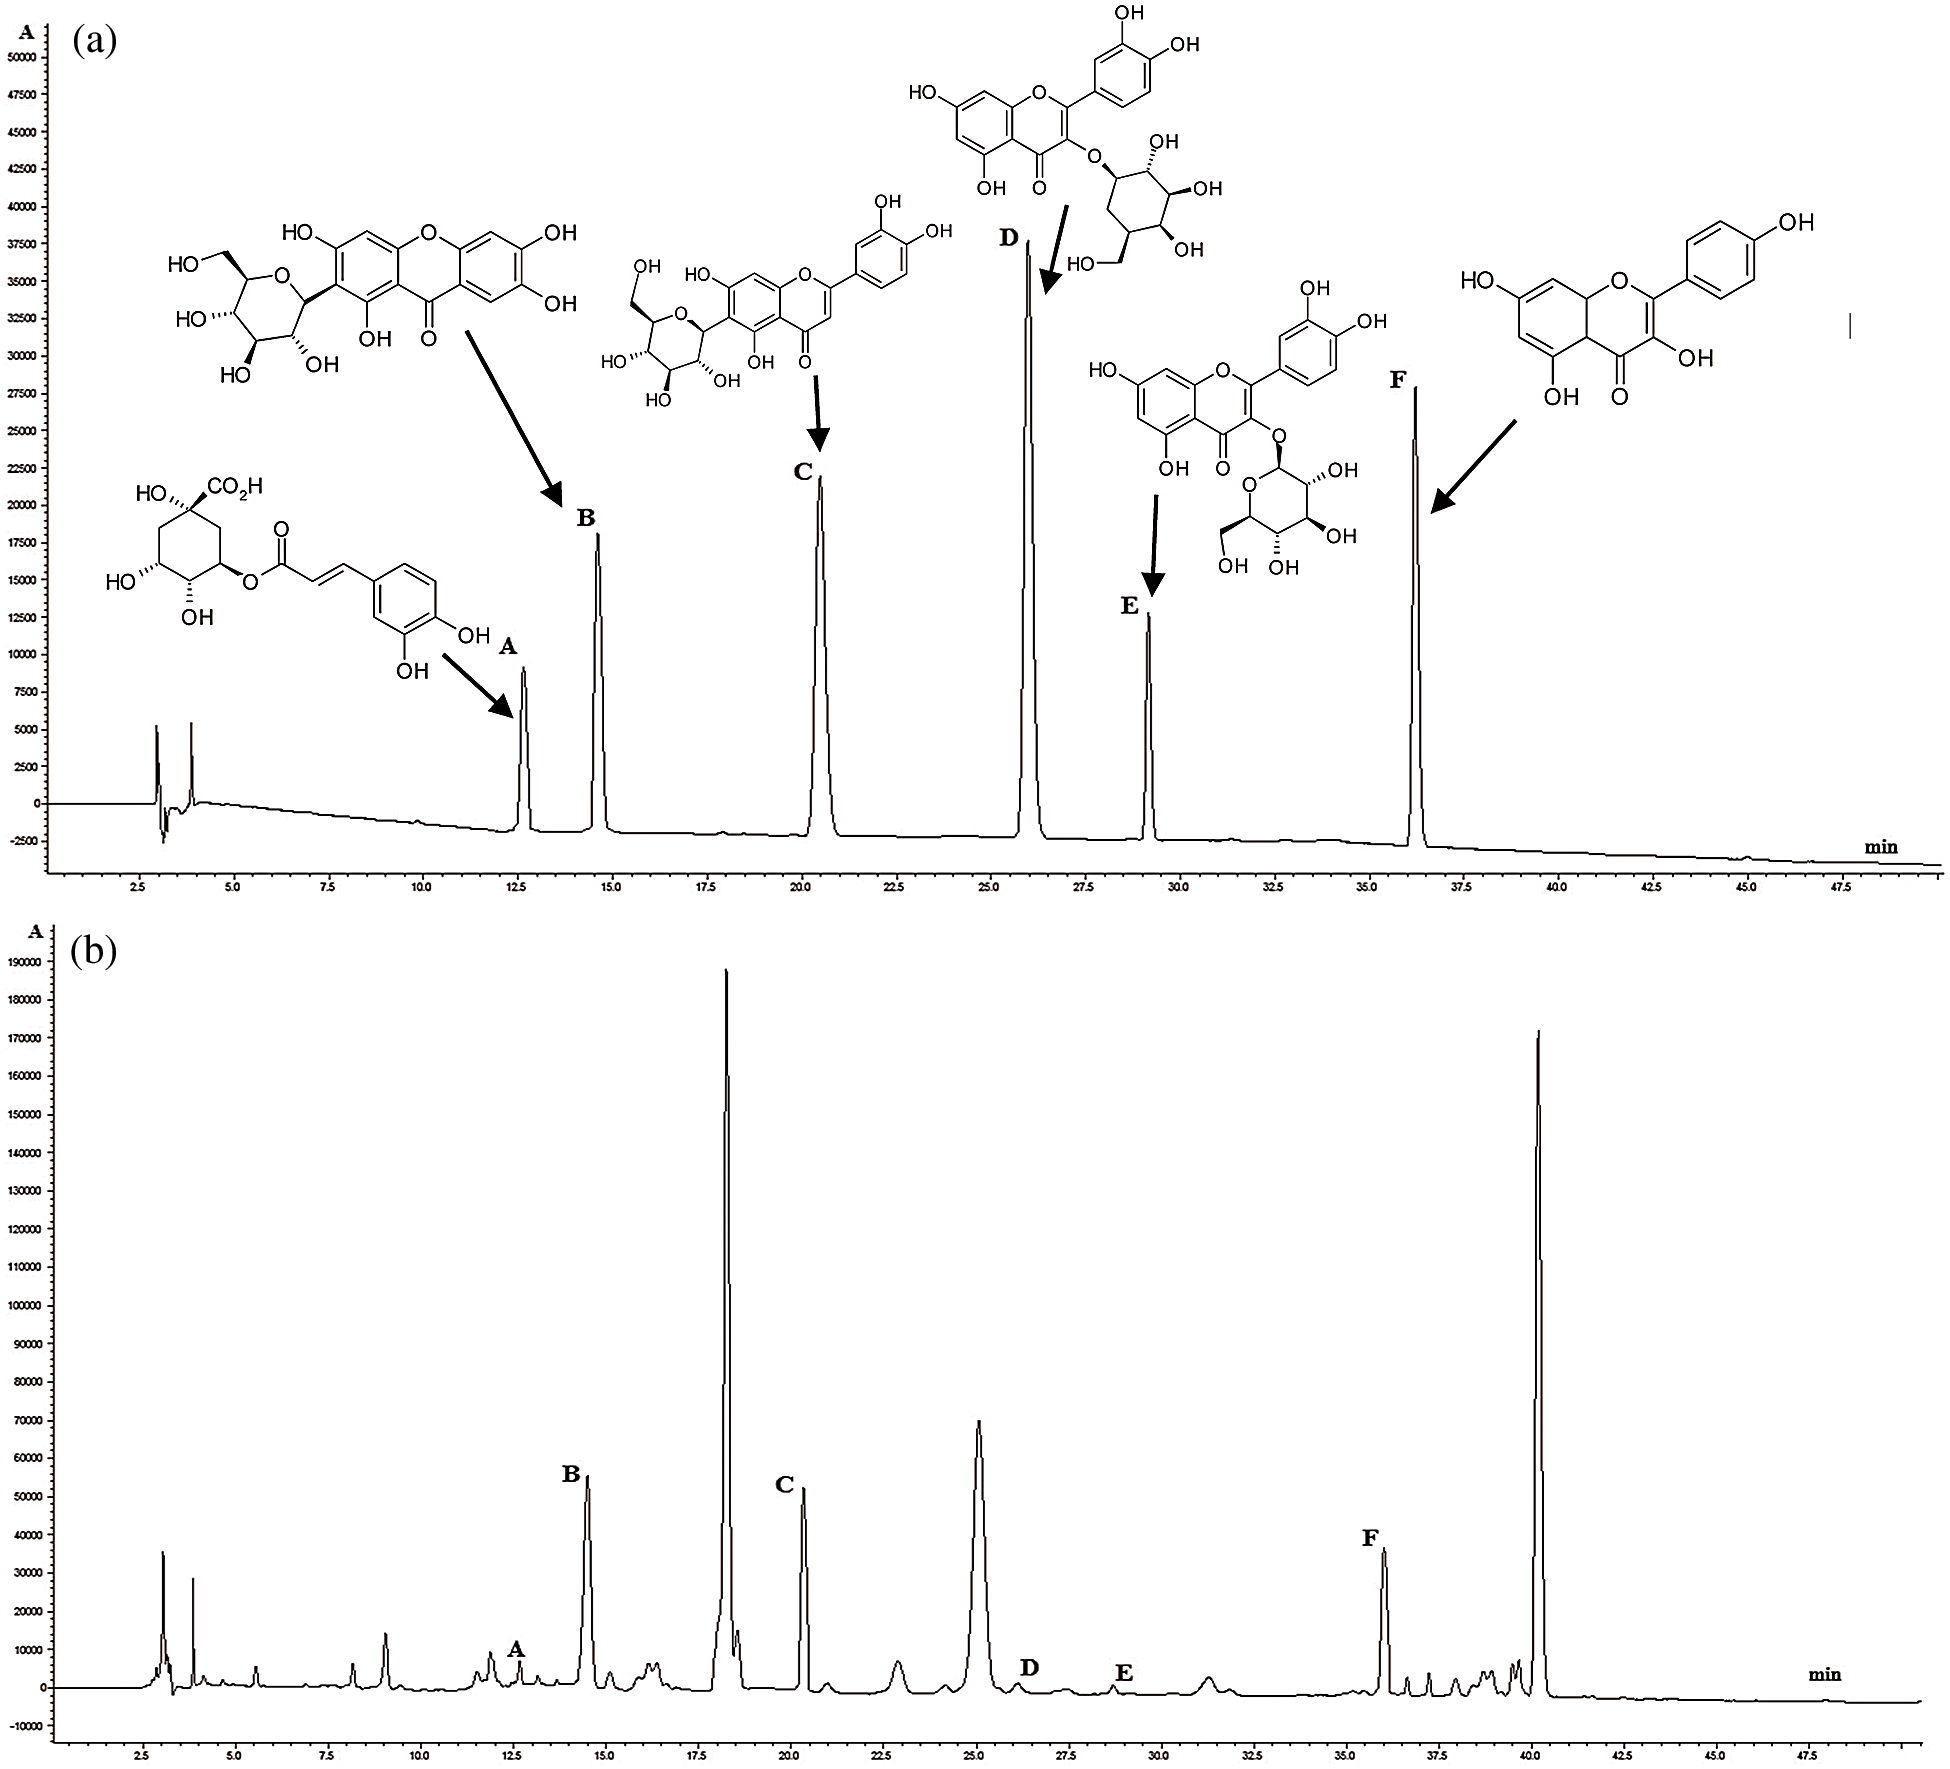
Figure 1: (a) HPLC-DAD chromatograms recorded at 310 nm of the mixed reference compounds: chlorogenic acid (A), mangiferin (B), isoorientin (C), hyperoside (D), isoquercitrin (E), kaempferol (F); (b) HPLC-DAD chromatograms of the methanolic extracts of C. speciosus leaves
3.5 Antioxidant Activity of the Leaves of C. speciosus
For determination of antiradical activity in vitro we used the ABTS radical-cation binding method. Pre-study antiradical activity of C. speciosus leaves extract with spectroscopic method showed promising results (150.08 ± 4.5 µmol Trolox/g). Therefore, further analysis was performed with an application of HPLC-ABTS. The antioxidant activity of the identified compounds (TEAC values, Trolox µmol/g) is displayed in Tab. 5. The antioxidant activity of C. speciosus leaves has a potent antioxidant capacity (TEAC 1049.930 µmol/g). The extract possessed antioxidant activity due to the present phenolic compounds (chlorogenic acid, mangiferin, isoorientin, hyperoside, isoquercitin, kaempferol). This could be explained by the fact that phenolic compounds are potent antioxidants due to their high redox potential allowing them to become hydrogen donors and singlet oxygen quenchers. The greatest antioxidant activity was detected in samples according to the presence of mangiferin, isoorientin, and kaempferol (Fig. 2). Other peaks of the compounds are also present on the chromatogram, but they did not reveal antioxidant activity, and precise identification of these compounds was not carried out.


Figure 2: HPLC-ABTS chromatograms of C. speciosus leaves (the top chromatogram is presenting identified compounds whereas the bottom one is for their radical scavenging activity). Numbering of the compounds is the same as in Tab. 5
Flavonoids have antioxidant properties that can prevent the oxidative degradation of cell wall lipids and increase the body’s antioxidant capacity [47]. According to the literature data, C. sativus methanol 80% leaves extract has a higher antioxidant activity than C. sativus methanol petal extract. Also, methanolic 80% leaf extract was similar to α-tocopherol in its antioxidant capacity [48,49]. Baba et al. [37] compared the antioxidant activity of extracts of stigma, corms, and leaves of C. sativus. The extract of C. sativus stigma demonstrated the strongest antioxidant activity which could be attributed to its highest content of phenolics and flavonoids. The water leaf extract of C. sativus showed more moderate antioxidant activity (IC50 482.78 ± 4.81 μg/mL). The antioxidant activity of this extract was lower than ascorbic acid had (IC50 10.50 ± 0.42 μg/mL) as a positive control substance. In current experiment, the potent antioxidant activity of the leaves extract of C. speciosus is likely to be associated with total phenolic and flavonoid contents.
The phytochemical analysis showed that Crocus speciosus leaves contains a different phytochemicals as phenolic compounds, flavonoids, aminoacids, saponins, proteins, tannins, triterpenoids, glycosides, polysaccharides. C. spesiosus leaves contains marked amount of total phenolic compounds (0.41 mg GAE/g) and total flavonoid (1.07 mg RE/g). The leaves extract showed a significant result in antiradical activity 150.08 μmol/g due to the presence of mangiferin, chlorogenic acid, isoorientin, kaempferol, hyperoside, and isoquercitin. Thus, Crocus speciosus leaves could be harvested and used for the production of food supplements or medicines, since the raw material contains biologically active compounds that have a positive effect on human health. In the future, it is necessary to conduct research on Crocus speciosus raw materials grown and collected in different regions of the world in order to study the diversification of phenolic compounds depending on hydrometeorological conditions. According to literature, it is most likely that this is the first report on phytochemical screening, total phenolic and flavonoids content and antioxidant activity of this species.
Funding Statement: The authors received no specific funding for this study.
Conflicts of Interest: The authors declare that they have no conflicts of interest to report regarding the present study.
1. Kerndorff, H., Pasche, E., Harpke, D. (2015). The genus Crocus (Liliiflorae, IridaceaeLifecycle, morphology, phenotypic characteristics, and taxonomical relevant parameters. Stapfia, 103, 27–65. [Google Scholar]
2. Petersen, G., Seberg, O., Thorsoe, S., Jorgensen, T., Mathew, B. (2008). A phylogeny of the genus Crocus (Iridaceae) based on sequence data from five plastid regions. Taxon, 57, 487–499. DOI 10.2307/25066017. [Google Scholar] [CrossRef]
3. Fernández, J. A., Santana, O., Guardiola, J. L., Molina, R. V., Heslop-Harrison, P. et al. (2011). The World Saffron and Crocus collection: Strategies for establishment, management, characterisation and utilisation. Genetic Resources and Crop Evolution, 58(1), 125–137. DOI 10.1007/s10722-010-9601-5. [Google Scholar] [CrossRef]
4. Mykhailenko, O., Kovalyov, V., Goryacha, O., Ivanauskas, L., Georgiyants, V. (2019). Biologically active compounds and pharmacological activities of species of the genus Crocus: A review. Phytochemistry, 162(10), 56–89. DOI 10.1016/j.phytochem.2019.02.004. [Google Scholar] [CrossRef]
5. Vignolini, P., Heimler, D., Pinelli, P., Ieri, F., Sciullo, A. et al. (2008). Characterization of by-products of Saffron (Crocus sativus L.) production. NPC Natural Product Communication, 3, 1959–1962. DOI 10.1177/1934578X0800301203. [Google Scholar] [CrossRef]
6. Lahmassa, I., Lamkami, T., Delporte, C., Sikdar, S., van Antwerpen, P. et al. (2017). The waste of saffron crop, a cheap source of bioactive compounds. Journal of Functional Foods, 35(6), 341–351. DOI 10.1016/j.jff.2017.05.057. [Google Scholar] [CrossRef]
7. Martillanes, S., Rocha-Pimienta, J., Delgado-Adámez, J. (2018). Agrifood by-products as a source of phytochemical compounds. Descriptive Food Science. IntechOpen, 3, 1–17. DOI 10.5772/intechopen.79434. [Google Scholar] [CrossRef]
8. The Food and Agricultural Organization (FAO) (2013). Food wastage footprint: Impacts on natural resources. Summary report, pp. 63. Rome, Italy: The Food and Agricultural Organization. Office of Assistant Director-General (Natural Resources Management and Environment Department). [Google Scholar]
9. Hosseini, A., Razavi, B. M., Hosseinzadeh, H. (2018). Saffron (Crocus sativus) petal as a new pharmacological target: A review. The Iranian Journal of Basic Medical Science, 21, 1091–1099. DOI 10.22038/IJBMS.2018.31243.7529. [Google Scholar] [CrossRef]
10. Ghanbari, J., Khajoei-Nejad, G., van Ruth, S. M., Aghighi, S. (2019). The possibility for improvement of flowering, corm properties, bioactive compounds, and antioxidant activity in saffron (Crocus sativus L.) by different nutritional regimes. Industrial Crops and Products, 135(1), 301–310. DOI 10.1016/j.indcrop.2019.04.064. [Google Scholar] [CrossRef]
11. Harborne, J. B., Williams, C. A. (1984). 6-Hydroxyflavones and other flavonoids of Crocus. Zeitschrift für Naturforschung C, 39(1–2), 18–23. DOI 10.1515/znc-1984-1-204. [Google Scholar] [CrossRef]
12. Masuda, A., Mori, K., Miyazawa, M. (2012). Comparative analysis of volatile compounds from corms of Crocus sativus and C. vernus. Chemistry of Natural Compounds, 48(2), 319–321. DOI 10.1007/s10600-012-0236-y. [Google Scholar] [CrossRef]
13. Nørbæk, R., Brandt, K., Nielsen, J. K., Ørgaard, M., Jacobsen, N. (2002). Flower pigment composition of Crocus species and cultivars used for a chemotaxonomic investigation. Biochemical Systematic Ecolology, 30(8), 763–791. DOI 10.1016/S0305-1978(02)00020-0. [Google Scholar] [CrossRef]
14. Nørbaek, R., Kondo, T. (1999). Flavonol glycosides from flowers of Crocus speciosus and C. antalyensis. Phytochemistry, 51(8), 1113–1119. DOI 10.1016/S0031-9422(99)00109-0. [Google Scholar] [CrossRef]
15. Yayli, N., Kiran, Z., Seymen, H., Genc, H. (2001). Characterization of lipids and fatty acid methyl ester contents in leaves and roots of Crocus vallicola. Turkish Journal of Chemistry, 25, 391–395. [Google Scholar]
16. Parray, J. A., Kamili, A. N., Hamid, R., Reshi, Z. A., Qadri, R. A. (2015). Antibacterial and antioxidant activity of methanol extracts of Crocus sativus L. c.v. Kashmirianus. Front Life Science, 8(1), 40–46. DOI 10.1080/21553769.2014.951774. [Google Scholar] [CrossRef]
17. Satybaldiyeva, D., Mursaliyeva, V., Rakhimbayev, I., Zayadan, B., Mammadov, R. (2015). Preliminary phytochemical analysis and antioxidant, antibacterial activities of Crocus alatavicus from Kazakhstan. Notulae Botanicae Horti Agrobotanici Cluj-Napoca, 43(2), 343–348. DOI 10.15835/nbha43210089. [Google Scholar] [CrossRef]
18. Loizzo, M. R., Marrelli, M., Pugliese, A., Conforti, F., Nadjafi, F. et al. (2016). Crocus cancellatus subsp. damascenus stigmas: Chemical profile, and inhibition of α-amylase, α-glucosidase and lipase, key enzymes related to type 2 diabetes and obesity. Journal of Enzyme Inhibition and Medicinal Chemistry, 31(2), 212–218. DOI 10.3109/14756366.2015.1016510. [Google Scholar] [CrossRef]
19. Satybaldiyeva, D., Mursaliyeva, V., Mammadov, R., Zayadan, B. (2016). Phenolic profiles and brine shrimp cytotoxicity of the ethanolic extract from the aerial part of Crocus alatavicus L. International Journal of Biological and Chemical Sciences, 9, 38–41. DOI 10.26577/2218-7979-2016-9-1-38-41. [Google Scholar] [CrossRef]
20. Brighton, C. A., Mathew, B., Rudall, P. (1983). A detailed study of Crocus speciosus and its ally C. pulchellus (Iridaceae). Plant Systematics and Evolution, 142(3–4), 187–206. DOI 10.1007/BF00985898. [Google Scholar] [CrossRef]
21. Özdemir, C., Kilinç, M. (2008). Morphology and anatomy of three subsp. of Crocus speciosus Bieb. Bangladesh Journal of Botany, 37, 97–103. DOI 10.3329/bjb.v37i2.1713. [Google Scholar] [CrossRef]
22. Trapero, A., Ahrazem, O., Rubio-Moraga, A., Jimeno, M. L., Gómez, M. D. et al. (2012). Characterization of a glucosyltransferase enzyme involved in the formation of kaempferol and quercetin sophorosides in Crocus sativus. Plant Physiology, 159(4), 1335–1354. DOI 10.1104/pp.112.198069. [Google Scholar] [CrossRef]
23. Moraga Á., R., Mozos, A. T., Ahrazem, O., Gómez-Gómez, L. (2009). Cloning and characterization of a glucosyltransferase from Crocus sativus stigmas involved in flavonoid glucosylation. BMC Plant Biology, 9(1), 109. DOI 10.1186/1471-2229-9-109. [Google Scholar] [CrossRef]
24. Morsy, N. (2014). Phytochemical analysis of biologically active constituents of medicinal plants. Main Group Chemistry, 13(1), 7–21. DOI 10.3233/MGC-130117. [Google Scholar] [CrossRef]
25. Wilson, C. W. (1939). A Study of the boric acid color reaction of flavone derivatives. Journal of the American Chemical Society, 61(9), 2303–2306. DOI 10.1021/ja01878a011. [Google Scholar] [CrossRef]
26. Mykchailenko, О. О., Kovalyov, V. M. (2016). Phenolic compounds of the genus Iris plants (Iridaceae). Česká a slovenská farmacie, 65, 70–77. [Google Scholar]
27. Cicco, N., Lanorte, M. T., Paraggio, M., Viggiano, M., Lattanzio, V. (2009). A reproducible, rapid and inexpensive Folin–Ciocalteu micro-method in determining phenolics of plant methanol extracts. Microchemical Journal, 91(1), 107–110. DOI 10.1016/j.microc.2008.08.011. [Google Scholar] [CrossRef]
28. Bezruk, I., Materiienko, A., Gubar, S., Proskurina, K., Budanova, L. et al. (2020). Estimation of the influence of the environmental factors on the accumulation of phytochemicals and antioxidant capacity in the ivy leaves (Hedera helix L.). Natural Products Research, 34, 1–6. DOI 10.1080/14786419.2020.1843029. [Google Scholar] [CrossRef]
29. Hamidu, L., Ahmad, A. R., Najib, A. (2018). Qualitative and quantitative test of total flavonoid buni fruit (Antidesma bunius (L.) Spreng) with UV-Vis spectrophotometry method. Pharmacognosy Journal, 10(1), 60–63. DOI 10.5530/pj.2018.1.12. [Google Scholar] [CrossRef]
30. Mykhailenko, O., Gudžinskas, Z., Kovalyov, V., Bezruk, I., Ivanauskas, L. et al. (2020). Effect of ecological factors on the accumulation of phenolic compounds in Iris species from Latvia, Lithuania and Ukraine. Phytochemical Analysis, 31(5), 1–19. DOI 10.1002/pca.2918. [Google Scholar] [CrossRef]
31. Q2 (R1) Validation of analytical procedures: Text and methodology. https://www.fda.gov/regulatory-information/search-fda-guidance-documents/q2-r1-validation-analytical-procedures-text-and-methodology. Docket Number: FDA-1994-D-0401 Docket Number: FDA-1996-D-0169. [Google Scholar]
32. Bezruk, I., Marksa, M., Georgiyants, V., Ivanauskas, L., Raudone, L. (2020). Phytogeographical profiling of ivy leaf (Hedera helix L.). Industrial Crops and Products, 154, 112713–112721. DOI 10.1016/j.indcrop.2020.112713. [Google Scholar] [CrossRef]
33. Marksa, M., Radušienė, J., Jakštas, V., Ivanauskas, L. (2016). Development of an HPLC post-column antioxidant assay for Solidago canadensis radical scavengers. Natural Products Research, 30(5), 3–8. DOI 10.1080/14786419.2015.1027703. [Google Scholar] [CrossRef]
34. Asghar, M. N., Khan, I. U., Zia, I., Ahmad, M., Qureshi, F. A. (2008). Modified 2, 2’-azinobis(3-ethylbenzo thiazoline)-6-sulphonic acid radical cation decolorization assay for antioxidant activity of human plasma and extracts of traditional medicinal plants. Acta Chimica Slovenica, 55, 408–418. [Google Scholar]
35. Smolskaite, L., Talou, T., Fabre, N., Venskutonis, P. R. (2011). Valorization of saffron industry by-products: Bioactive compounds from leaves. Proceedings of the 6th Baltic conference on food science and technology FOODBALT-2011 (Jelgava, Latvia, may 5–6). in Straumite, E. (Eds.Innovations for food science and production, pp. 67–72. Latvia, Riga, Latvia: Faculty of Food Technology. [Google Scholar]
36. Popovic-Djordjevic, J. B., Kostic, A. Z., Kiralan, M. (2021). Antioxidant activities of bioactive compounds and various extracts obtained from saffron. in Charis, M., Galanakis (Eds.Saffron, pp. 41–97. USA: Academic Press. [Google Scholar]
37. Baba, S. A., Malik, A. H., Wani, Z. A., Mohiuddin, T., Shah, Z. et al. (2015). Phytochemical analysis and antioxidant activity of different tissue types of Crocus sativus and oxidative stress alleviating potential of saffron extract in plants, bacteria, and yeast. South Africa Journal of Botany, 99(7), 80–87. DOI 10.1016/j.sajb.2015.03.194. [Google Scholar] [CrossRef]
38. Dailidienė, I., Davulienė, L., Kelpšaitė, L., Razinkovas, A. (2012). Analysis of the climate change in Lithuanian coastal areas of the Baltic Sea. Journal of Coastal Research, 28, 557–569. DOI 10.2112/JCOASTRES-D-10-00077.1. [Google Scholar] [CrossRef]
39. Singleton, V. L., Orthofer, R., Lamuela-Raventos, R. M. (1999). Analysis of total phenols and other oxidations substrates and antioxidans by means of Folin-Ciocalteu reagent. Methods in Enzymology, 299, 152–178. DOI 10.1016/S0076-6879(99)99017-1. [Google Scholar] [CrossRef]
40. Piluzza, G., Bullitta, S. (2011). Correlations between phenolic content and antioxidant properties in twenty-four plant species of traditional ethnoveterinary use in the Mediterranean area. Pharmaceutical Biology, 49(3), 240–247. DOI 10.3109/13880209.2010.501083. [Google Scholar] [CrossRef]
41. Rahiman, S., Tantry, B. A., Kumar, A. (2012). Variation of antioxidant activity and phenolic content of some common home remedies with storage time. African Journal of Traditional, Complementary and Alternative Medicines, 10(1), 124–127. DOI 10.4314/ajtcam.v10i1.16. [Google Scholar] [CrossRef]
42. Pękal, A., Pyrzynska, K. (2014). Evaluation of aluminum complexation reaction for flavonoid content assay. Food Analitical Methods, 7(9), 1776–1782. DOI 10.1007/s12161-014-9814-x. [Google Scholar] [CrossRef]
43. Jurd, L. (1969). Aluminium complexes of phenolic flavones. Spectral and structural correlation. Phytochemistry, 8, 445–462. DOI 10.1016/S0031-9422(00)85447-3. [Google Scholar] [CrossRef]
44. Boligon, A. A., Athayde, M. L. (2014). Importance of HPLC in analysis of plants extracts. Austin Chromatography, 1, 2. [Google Scholar]
45. Balcke, G. U., Handrick, V., Bergau, N. M., Fichtner, A., Henning, H. et al. (2012). An UPLC-MS/MS method for highly sensitive high-throughput analysis of phytohormones in plant tissues. Plant Methods, 8(1), 47–58. DOI 10.1186/1746-4811-8-47. [Google Scholar] [CrossRef]
46. Yu, Q., Qi, J., Yu, H. X., Chen, L. L., Kou, J. P. et al. (2013). Qualitative and quantitative analysis of phenolic compounds in the leaves of Aquilaria sinensis using liquid chromatography-mass spectrometry. Phytochemical Analysis, 24(4), 349–356. DOI 10.1002/pca.2416. [Google Scholar] [CrossRef]
47. Ghanbari-Niaki, A., Saeidi, A., Kolahdouzi, S., Aliakbari-Baydokhty, M., Ardeshiri, S. et al. (2019). Effect of Crocus sativus Linnaeus [saffron] supplementations combined with circuit resistance training on total creatine kinase, lactate dehydrogenase and creatine kinase MB levels in young untrained men. Science et Sports, 34(1), e53–e58. DOI 10.1016/j.scispo.2018.10.004. [Google Scholar] [CrossRef]
48. Jadouali, S. M., Atifi, H., Bouzouba, Z., Majourhat, K., Gharby, S. et al. (2018). Chemical characterization, antiradical and antibacterial activity of Moroccan Crocus sativus L. petals and leaves. Journal of Materials and Environmental Sciences, 9(1), 113–118. DOI 10.26872/jmes.2018.9.1.14. [Google Scholar] [CrossRef]
49. Jadouali, S. M., Atifi, H., Mamouni, R., Majourhat, K., Bouzouba, Z. et al. (2019). Chemical characterization and antiradical compounds of flower parts of Moroccan Crocus sativus L. Journal of the Saudi Society of Agricultural Sciences, 18(4), 476–480. DOI 10.1016/j.jssas.2018.03.007. [Google Scholar] [CrossRef]
 | This work is licensed under a Creative Commons Attribution 4.0 International License, which permits unrestricted use, distribution, and reproduction in any medium, provided the original work is properly cited. |